Shorewood, WI
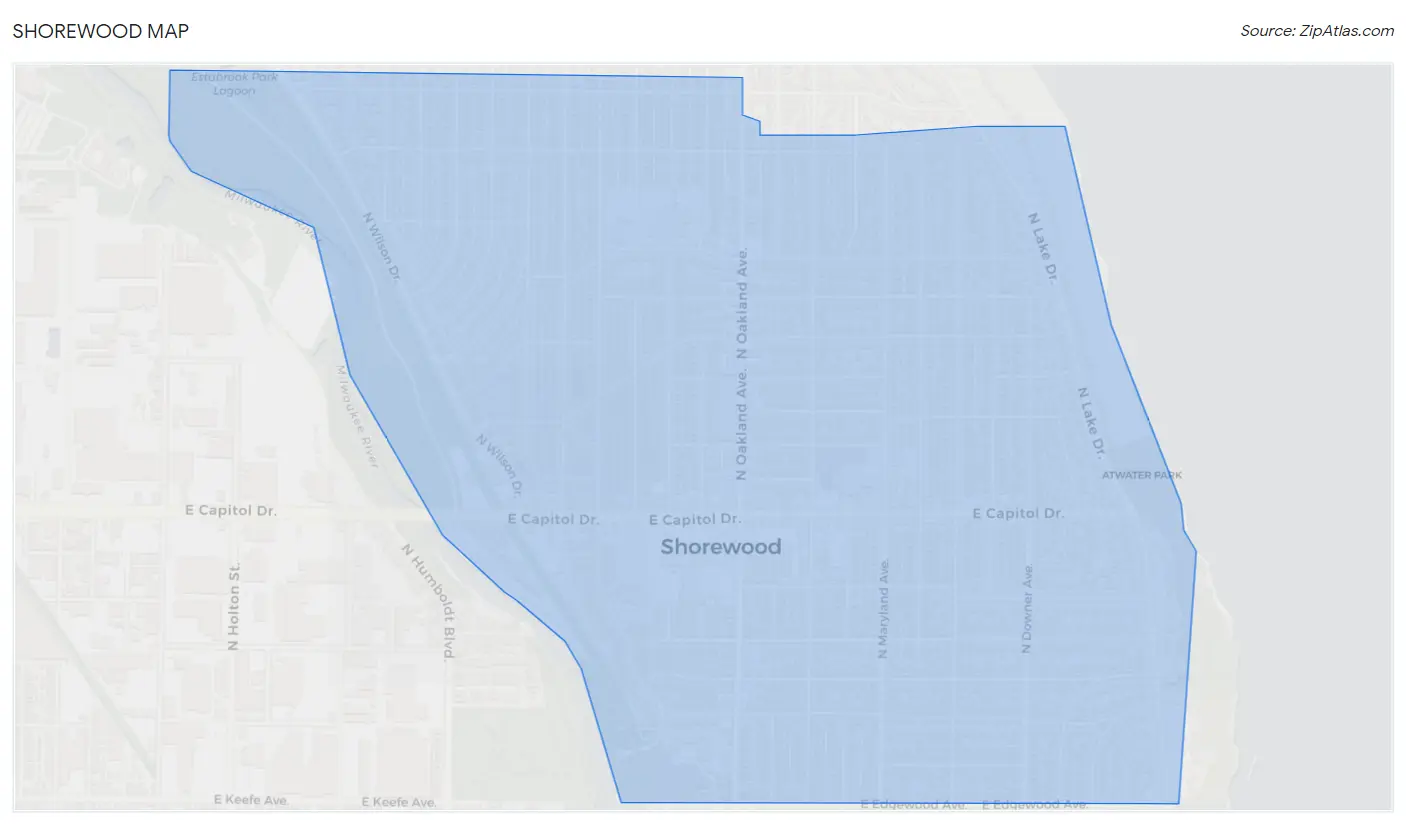
Shorewood Map
Shorewood Overview
13,707
TOTAL POPULATION
6,557
MALE POPULATION
7,150
FEMALE POPULATION
91.71
MALES / 100 FEMALES
109.04
FEMALES / 100 MALES
38.6
MEDIAN AGE
2.8
AVG FAMILY SIZE
2.0
AVG HOUSEHOLD SIZE
$62,155
PER CAPITA INCOME
$143,583
AVG FAMILY INCOME
$87,161
AVG HOUSEHOLD INCOME
20.8%
WAGE / INCOME GAP [ % ]
79.2¢/ $1
WAGE / INCOME GAP [ $ ]
0.51
INEQUALITY / GINI INDEX
8,011
LABOR FORCE [ PEOPLE ]
71.7%
PERCENT IN LABOR FORCE
3.8%
UNEMPLOYMENT RATE
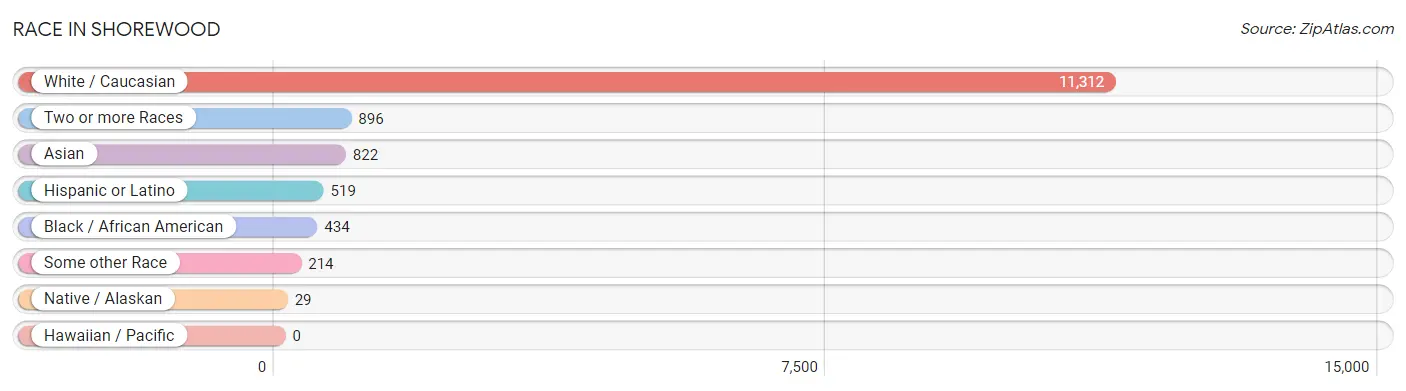
Race in Shorewood
The most populous races in Shorewood are White / Caucasian (11,312 | 82.5%), Two or more Races (896 | 6.5%), and Asian (822 | 6.0%).
| Race | # Population | % Population |
| Asian | 822 | 6.0% |
| Black / African American | 434 | 3.2% |
| Hawaiian / Pacific | 0 | 0.0% |
| Hispanic or Latino | 519 | 3.8% |
| Native / Alaskan | 29 | 0.2% |
| White / Caucasian | 11,312 | 82.5% |
| Two or more Races | 896 | 6.5% |
| Some other Race | 214 | 1.6% |
| Total | 13,707 | 100.0% |
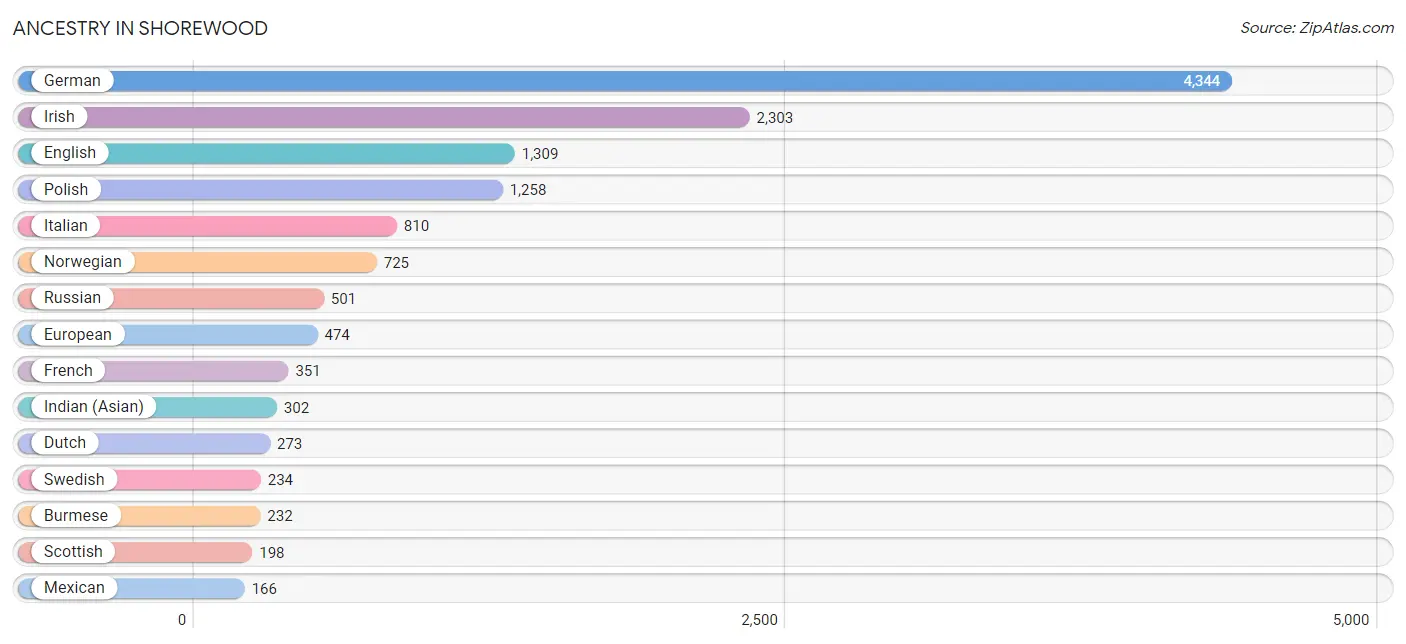
Ancestry in Shorewood
The most populous ancestries reported in Shorewood are German (4,344 | 31.7%), Irish (2,303 | 16.8%), English (1,309 | 9.6%), Polish (1,258 | 9.2%), and Italian (810 | 5.9%), together accounting for 73.1% of all Shorewood residents.
| Ancestry | # Population | % Population |
| African | 45 | 0.3% |
| Albanian | 20 | 0.2% |
| American | 141 | 1.0% |
| Apache | 7 | 0.1% |
| Arab | 99 | 0.7% |
| Armenian | 57 | 0.4% |
| Australian | 22 | 0.2% |
| Austrian | 106 | 0.8% |
| Bangladeshi | 35 | 0.3% |
| Belgian | 38 | 0.3% |
| Bhutanese | 137 | 1.0% |
| Brazilian | 8 | 0.1% |
| British | 84 | 0.6% |
| Burmese | 232 | 1.7% |
| Canadian | 134 | 1.0% |
| Central American | 52 | 0.4% |
| Cherokee | 10 | 0.1% |
| Chilean | 9 | 0.1% |
| Chippewa | 37 | 0.3% |
| Costa Rican | 10 | 0.1% |
| Croatian | 38 | 0.3% |
| Czech | 129 | 0.9% |
| Czechoslovakian | 36 | 0.3% |
| Danish | 162 | 1.2% |
| Dominican | 15 | 0.1% |
| Dutch | 273 | 2.0% |
| Eastern European | 115 | 0.8% |
| Egyptian | 26 | 0.2% |
| English | 1,309 | 9.6% |
| European | 474 | 3.5% |
| Filipino | 15 | 0.1% |
| Finnish | 102 | 0.7% |
| French | 351 | 2.6% |
| French Canadian | 133 | 1.0% |
| German | 4,344 | 31.7% |
| Greek | 144 | 1.1% |
| Hungarian | 81 | 0.6% |
| Indian (Asian) | 302 | 2.2% |
| Iraqi | 20 | 0.2% |
| Irish | 2,303 | 16.8% |
| Iroquois | 13 | 0.1% |
| Israeli | 23 | 0.2% |
| Italian | 810 | 5.9% |
| Japanese | 55 | 0.4% |
| Korean | 58 | 0.4% |
| Latvian | 18 | 0.1% |
| Lithuanian | 107 | 0.8% |
| Luxembourger | 29 | 0.2% |
| Mexican | 166 | 1.2% |
| Moroccan | 13 | 0.1% |
| Nicaraguan | 16 | 0.1% |
| Northern European | 57 | 0.4% |
| Norwegian | 725 | 5.3% |
| Palestinian | 21 | 0.2% |
| Paraguayan | 43 | 0.3% |
| Peruvian | 17 | 0.1% |
| Polish | 1,258 | 9.2% |
| Puerto Rican | 164 | 1.2% |
| Romanian | 18 | 0.1% |
| Russian | 501 | 3.7% |
| Salvadoran | 26 | 0.2% |
| Scandinavian | 56 | 0.4% |
| Scotch-Irish | 100 | 0.7% |
| Scottish | 198 | 1.4% |
| Serbian | 9 | 0.1% |
| Slovak | 90 | 0.7% |
| Slovene | 46 | 0.3% |
| South American | 80 | 0.6% |
| Spaniard | 33 | 0.2% |
| Sri Lankan | 13 | 0.1% |
| Subsaharan African | 55 | 0.4% |
| Swedish | 234 | 1.7% |
| Swiss | 92 | 0.7% |
| Thai | 166 | 1.2% |
| Turkish | 29 | 0.2% |
| Ukrainian | 113 | 0.8% |
| Venezuelan | 11 | 0.1% |
| Welsh | 152 | 1.1% |
| Yaqui | 10 | 0.1% |
| Yugoslavian | 10 | 0.1% | View All 80 Rows |
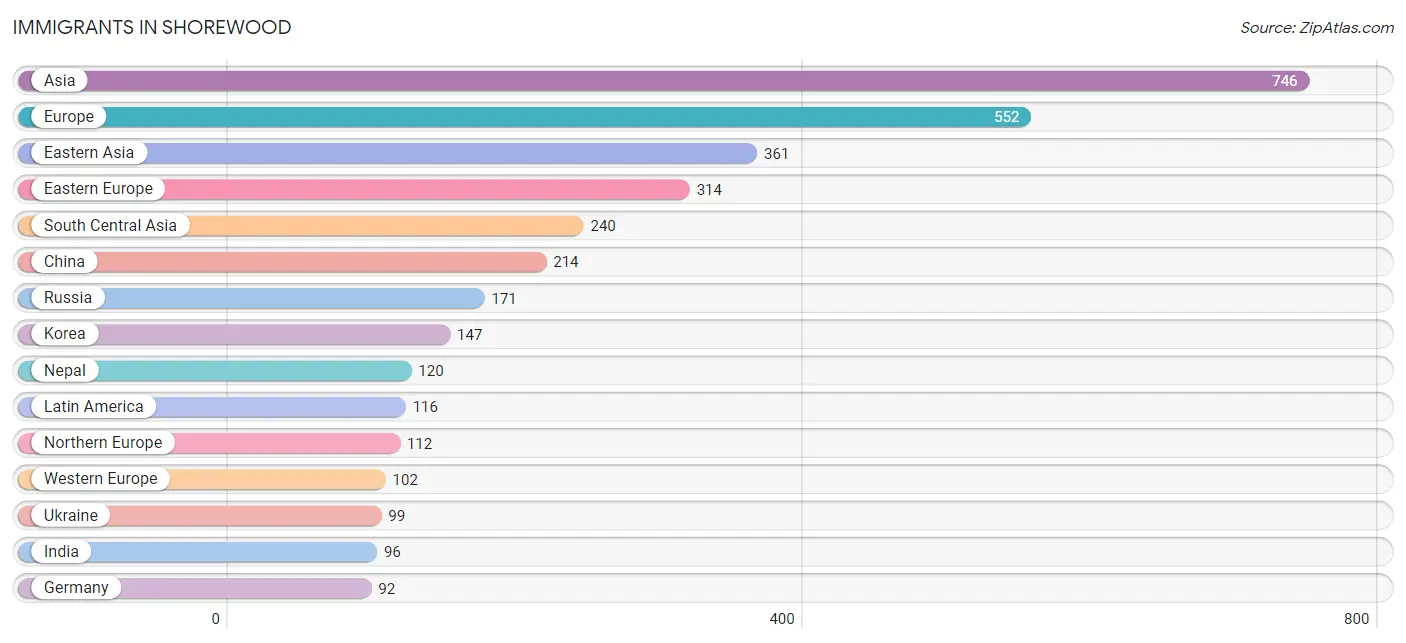
Immigrants in Shorewood
The most numerous immigrant groups reported in Shorewood came from Asia (746 | 5.4%), Europe (552 | 4.0%), Eastern Asia (361 | 2.6%), Eastern Europe (314 | 2.3%), and South Central Asia (240 | 1.8%), together accounting for 16.1% of all Shorewood residents.
| Immigration Origin | # Population | % Population |
| Africa | 66 | 0.5% |
| Albania | 20 | 0.2% |
| Asia | 746 | 5.4% |
| Australia | 6 | 0.0% |
| Austria | 10 | 0.1% |
| Brazil | 8 | 0.1% |
| Cambodia | 32 | 0.2% |
| Canada | 18 | 0.1% |
| Caribbean | 12 | 0.1% |
| Central America | 35 | 0.3% |
| Chile | 9 | 0.1% |
| China | 214 | 1.6% |
| Costa Rica | 10 | 0.1% |
| Dominican Republic | 12 | 0.1% |
| Eastern Africa | 25 | 0.2% |
| Eastern Asia | 361 | 2.6% |
| Eastern Europe | 314 | 2.3% |
| Egypt | 23 | 0.2% |
| England | 9 | 0.1% |
| Ethiopia | 16 | 0.1% |
| Europe | 552 | 4.0% |
| Germany | 92 | 0.7% |
| Hong Kong | 9 | 0.1% |
| India | 96 | 0.7% |
| Ireland | 8 | 0.1% |
| Israel | 49 | 0.4% |
| Italy | 24 | 0.2% |
| Jordan | 10 | 0.1% |
| Korea | 147 | 1.1% |
| Latin America | 116 | 0.9% |
| Mexico | 9 | 0.1% |
| Moldova | 16 | 0.1% |
| Morocco | 13 | 0.1% |
| Nepal | 120 | 0.9% |
| Nicaragua | 16 | 0.1% |
| Northern Africa | 36 | 0.3% |
| Northern Europe | 112 | 0.8% |
| Oceania | 6 | 0.0% |
| Peru | 5 | 0.0% |
| Poland | 8 | 0.1% |
| Russia | 171 | 1.3% |
| Somalia | 9 | 0.1% |
| South Africa | 5 | 0.0% |
| South America | 69 | 0.5% |
| South Central Asia | 240 | 1.8% |
| South Eastern Asia | 57 | 0.4% |
| Southern Europe | 24 | 0.2% |
| Taiwan | 15 | 0.1% |
| Thailand | 12 | 0.1% |
| Turkey | 29 | 0.2% |
| Ukraine | 99 | 0.7% |
| Venezuela | 19 | 0.1% |
| Vietnam | 13 | 0.1% |
| Western Asia | 88 | 0.6% |
| Western Europe | 102 | 0.7% | View All 55 Rows |
Sex and Age in Shorewood
Sex and Age in Shorewood
The most populous age groups in Shorewood are 20 to 24 Years (508 | 7.7%) for men and 30 to 34 Years (747 | 10.4%) for women.
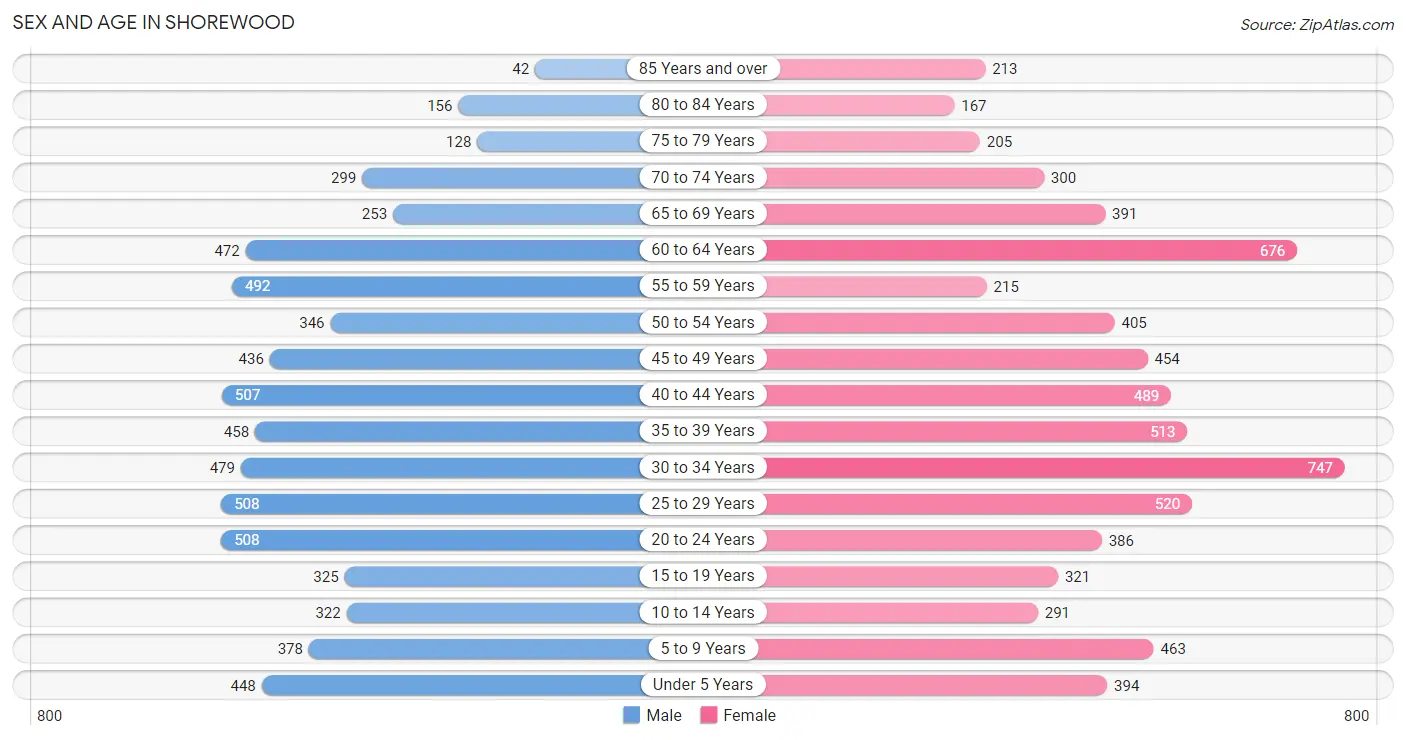
| Age Bracket | Male | Female |
| Under 5 Years | 448 (6.8%) | 394 (5.5%) |
| 5 to 9 Years | 378 (5.8%) | 463 (6.5%) |
| 10 to 14 Years | 322 (4.9%) | 291 (4.1%) |
| 15 to 19 Years | 325 (5.0%) | 321 (4.5%) |
| 20 to 24 Years | 508 (7.7%) | 386 (5.4%) |
| 25 to 29 Years | 508 (7.7%) | 520 (7.3%) |
| 30 to 34 Years | 479 (7.3%) | 747 (10.4%) |
| 35 to 39 Years | 458 (7.0%) | 513 (7.2%) |
| 40 to 44 Years | 507 (7.7%) | 489 (6.8%) |
| 45 to 49 Years | 436 (6.7%) | 454 (6.4%) |
| 50 to 54 Years | 346 (5.3%) | 405 (5.7%) |
| 55 to 59 Years | 492 (7.5%) | 215 (3.0%) |
| 60 to 64 Years | 472 (7.2%) | 676 (9.5%) |
| 65 to 69 Years | 253 (3.9%) | 391 (5.5%) |
| 70 to 74 Years | 299 (4.6%) | 300 (4.2%) |
| 75 to 79 Years | 128 (1.9%) | 205 (2.9%) |
| 80 to 84 Years | 156 (2.4%) | 167 (2.3%) |
| 85 Years and over | 42 (0.6%) | 213 (3.0%) |
| Total | 6,557 (100.0%) | 7,150 (100.0%) |
Families and Households in Shorewood
Median Family Size in Shorewood
The median family size in Shorewood is 2.84 persons per family, with married-couple families (2,777 | 82.1%) accounting for the largest median family size of 2.93 persons per family. On the other hand, single female/mother families (408 | 12.1%) represent the smallest median family size with 2.29 persons per family.
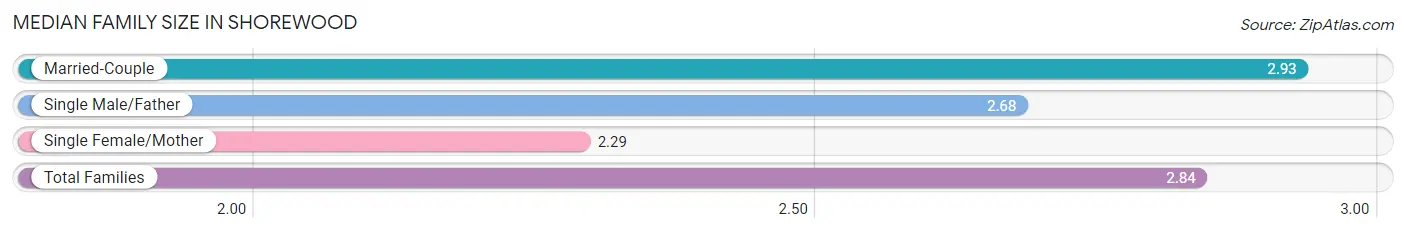
| Family Type | # Families | Family Size |
| Married-Couple | 2,777 (82.1%) | 2.93 |
| Single Male/Father | 196 (5.8%) | 2.68 |
| Single Female/Mother | 408 (12.1%) | 2.29 |
| Total Families | 3,381 (100.0%) | 2.84 |
Median Household Size in Shorewood
The median household size in Shorewood is 2.05 persons per household, with married-couple households (2,777 | 41.6%) accounting for the largest median household size of 2.94 persons per household. non-family households (3,300 | 49.4%) represent the smallest median household size with 1.21 persons per household.
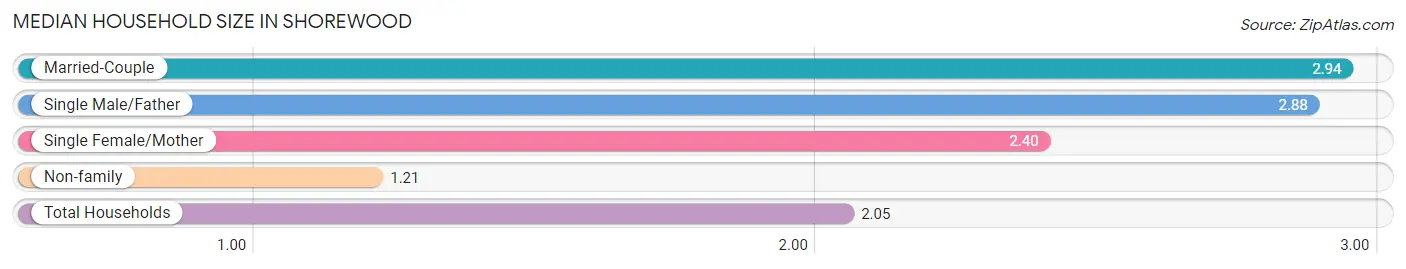
| Household Type | # Households | Household Size |
| Married-Couple | 2,777 (41.6%) | 2.94 |
| Single Male/Father | 196 (2.9%) | 2.88 |
| Single Female/Mother | 408 (6.1%) | 2.40 |
| Non-family | 3,300 (49.4%) | 1.21 |
| Total Households | 6,681 (100.0%) | 2.05 |
Household Size by Marriage Status in Shorewood
Out of a total of 6,681 households in Shorewood, 3,381 (50.6%) are family households, while 3,300 (49.4%) are nonfamily households. The most numerous type of family households are 2-person households, comprising 1,593, and the most common type of nonfamily households are 1-person households, comprising 2,760.
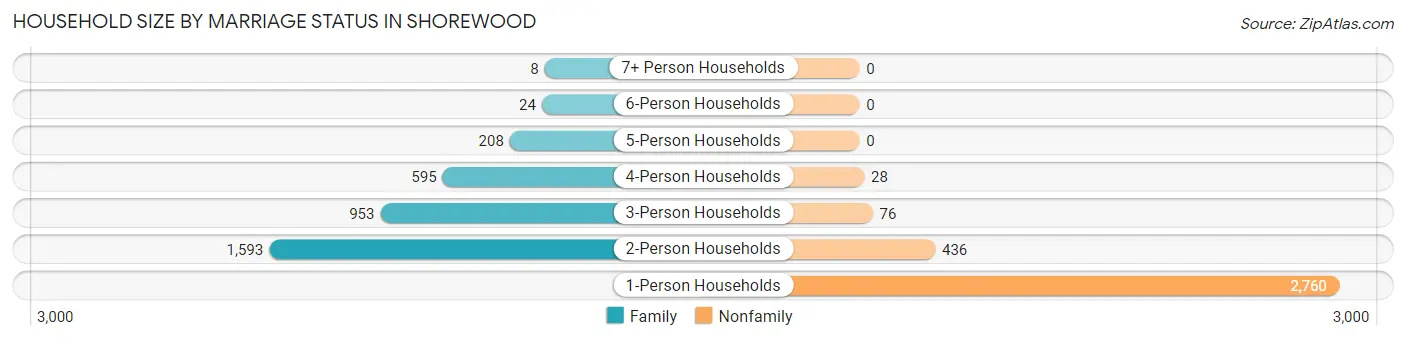
| Household Size | Family Households | Nonfamily Households |
| 1-Person Households | - | 2,760 (41.3%) |
| 2-Person Households | 1,593 (23.8%) | 436 (6.5%) |
| 3-Person Households | 953 (14.3%) | 76 (1.1%) |
| 4-Person Households | 595 (8.9%) | 28 (0.4%) |
| 5-Person Households | 208 (3.1%) | 0 (0.0%) |
| 6-Person Households | 24 (0.4%) | 0 (0.0%) |
| 7+ Person Households | 8 (0.1%) | 0 (0.0%) |
| Total | 3,381 (50.6%) | 3,300 (49.4%) |
Female Fertility in Shorewood
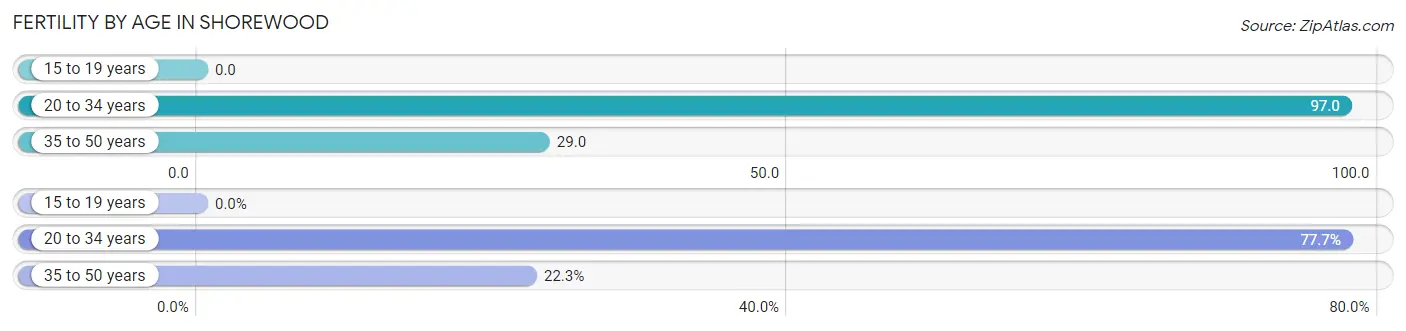
Fertility by Age in Shorewood
Average fertility rate in Shorewood is 58.0 births per 1,000 women. Women in the age bracket of 20 to 34 years have the highest fertility rate with 97.0 births per 1,000 women. Women in the age bracket of 20 to 34 years acount for 77.7% of all women with births.
| Age Bracket | Women with Births | Births / 1,000 Women |
| 15 to 19 years | 0 (0.0%) | 0.0 |
| 20 to 34 years | 160 (77.7%) | 97.0 |
| 35 to 50 years | 46 (22.3%) | 29.0 |
| Total | 206 (100.0%) | 58.0 |
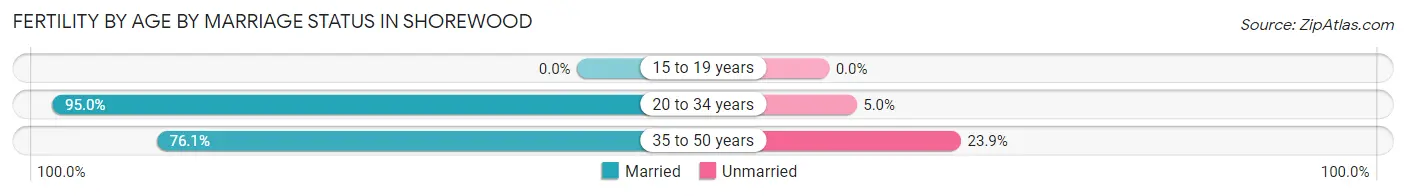
Fertility by Age by Marriage Status in Shorewood
90.8% of women with births (206) in Shorewood are married. The highest percentage of unmarried women with births falls into 35 to 50 years age bracket with 23.9% of them unmarried at the time of birth, while the lowest percentage of unmarried women with births belong to 20 to 34 years age bracket with 5.0% of them unmarried.
| Age Bracket | Married | Unmarried |
| 15 to 19 years | 0 (0.0%) | 0 (0.0%) |
| 20 to 34 years | 152 (95.0%) | 8 (5.0%) |
| 35 to 50 years | 35 (76.1%) | 11 (23.9%) |
| Total | 187 (90.8%) | 19 (9.2%) |
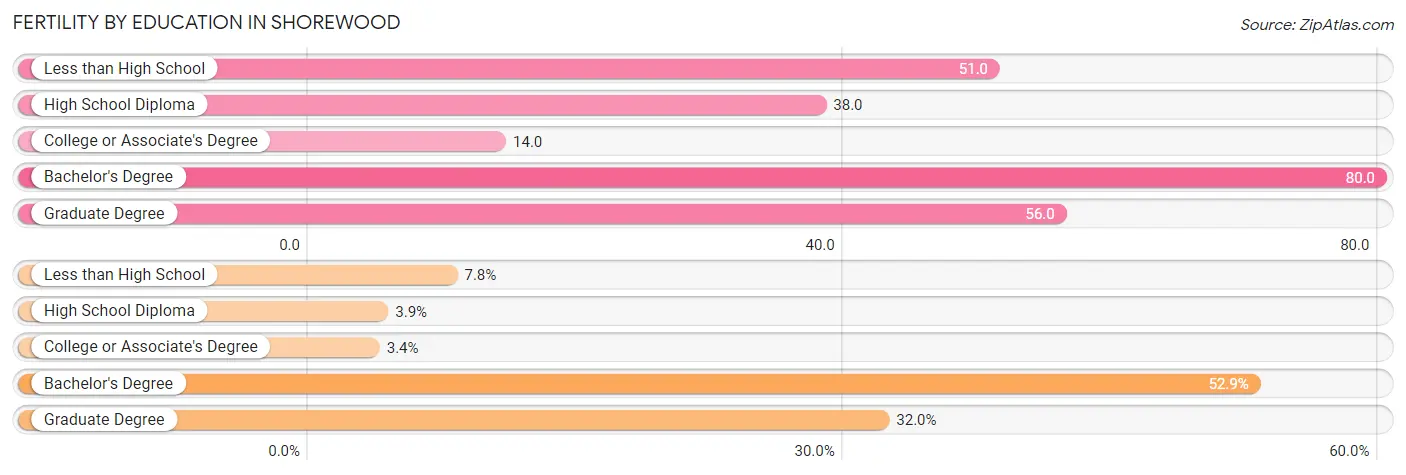
Fertility by Education in Shorewood
Average fertility rate in Shorewood is 58.0 births per 1,000 women. Women with the education attainment of bachelor's degree have the highest fertility rate of 80.0 births per 1,000 women, while women with the education attainment of college or associate's degree have the lowest fertility at 14.0 births per 1,000 women. Women with the education attainment of bachelor's degree represent 52.9% of all women with births.
| Educational Attainment | Women with Births | Births / 1,000 Women |
| Less than High School | 16 (7.8%) | 51.0 |
| High School Diploma | 8 (3.9%) | 38.0 |
| College or Associate's Degree | 7 (3.4%) | 14.0 |
| Bachelor's Degree | 109 (52.9%) | 80.0 |
| Graduate Degree | 66 (32.0%) | 56.0 |
| Total | 206 (100.0%) | 58.0 |
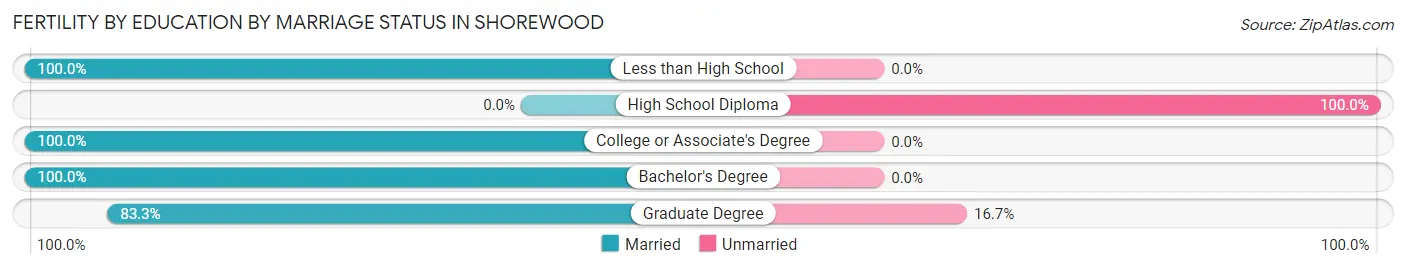
Fertility by Education by Marriage Status in Shorewood
9.2% of women with births in Shorewood are unmarried. Women with the educational attainment of less than high school are most likely to be married with 100.0% of them married at childbirth, while women with the educational attainment of high school diploma are least likely to be married with 100.0% of them unmarried at childbirth.
| Educational Attainment | Married | Unmarried |
| Less than High School | 16 (100.0%) | 0 (0.0%) |
| High School Diploma | 0 (0.0%) | 8 (100.0%) |
| College or Associate's Degree | 7 (100.0%) | 0 (0.0%) |
| Bachelor's Degree | 109 (100.0%) | 0 (0.0%) |
| Graduate Degree | 55 (83.3%) | 11 (16.7%) |
| Total | 187 (90.8%) | 19 (9.2%) |
Income in Shorewood
Income Overview in Shorewood
Per Capita Income in Shorewood is $62,155, while median incomes of families and households are $143,583 and $87,161 respectively.
| Characteristic | Number | Measure |
| Per Capita Income | 13,707 | $62,155 |
| Median Family Income | 3,381 | $143,583 |
| Mean Family Income | 3,381 | $187,594 |
| Median Household Income | 6,681 | $87,161 |
| Mean Household Income | 6,681 | $128,005 |
| Income Deficit | 3,381 | $0 |
| Wage / Income Gap (%) | 13,707 | 20.77% |
| Wage / Income Gap ($) | 13,707 | 79.23¢ per $1 |
| Gini / Inequality Index | 13,707 | 0.51 |
Earnings by Sex in Shorewood
Average Earnings in Shorewood are $60,082, $68,160 for men and $54,002 for women, a difference of 20.8%.
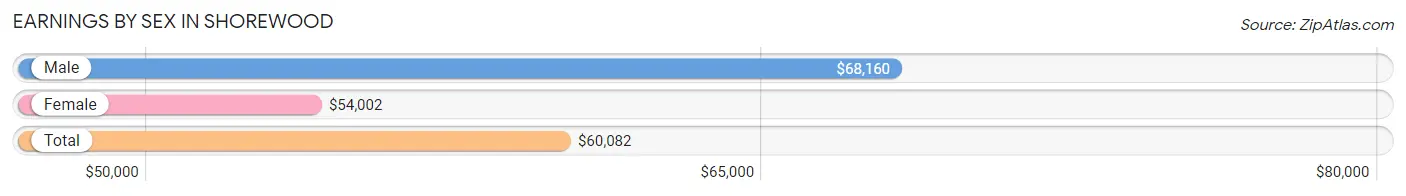
| Sex | Number | Average Earnings |
| Male | 4,204 (50.7%) | $68,160 |
| Female | 4,079 (49.2%) | $54,002 |
| Total | 8,283 (100.0%) | $60,082 |
Earnings by Sex by Income Bracket in Shorewood
The most common earnings brackets in Shorewood are $100,000+ for men (1,294 | 30.8%) and $100,000+ for women (707 | 17.3%).
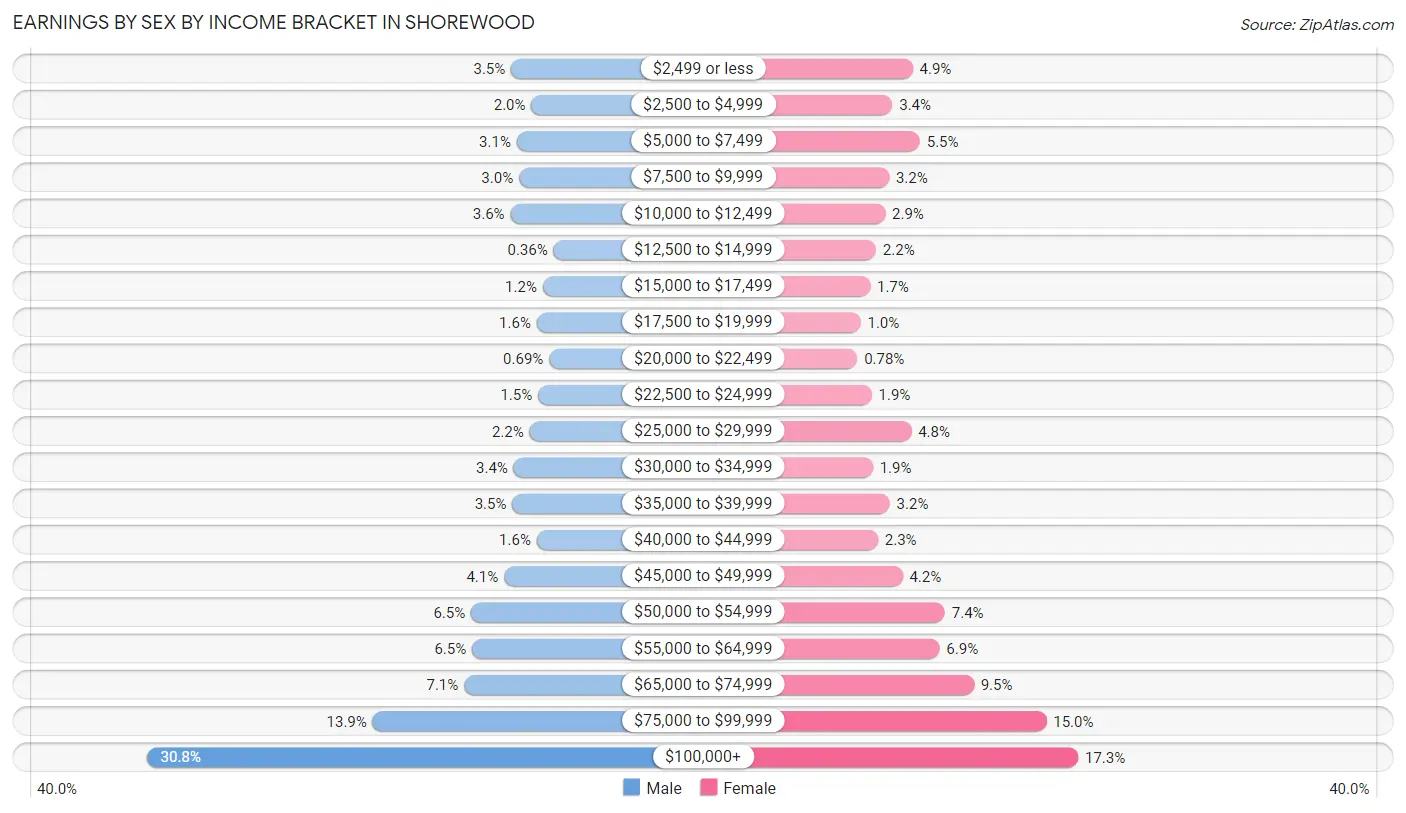
| Income | Male | Female |
| $2,499 or less | 149 (3.5%) | 201 (4.9%) |
| $2,500 to $4,999 | 85 (2.0%) | 139 (3.4%) |
| $5,000 to $7,499 | 131 (3.1%) | 223 (5.5%) |
| $7,500 to $9,999 | 124 (2.9%) | 129 (3.2%) |
| $10,000 to $12,499 | 151 (3.6%) | 117 (2.9%) |
| $12,500 to $14,999 | 15 (0.4%) | 89 (2.2%) |
| $15,000 to $17,499 | 49 (1.2%) | 71 (1.7%) |
| $17,500 to $19,999 | 68 (1.6%) | 42 (1.0%) |
| $20,000 to $22,499 | 29 (0.7%) | 32 (0.8%) |
| $22,500 to $24,999 | 64 (1.5%) | 76 (1.9%) |
| $25,000 to $29,999 | 91 (2.2%) | 197 (4.8%) |
| $30,000 to $34,999 | 141 (3.4%) | 79 (1.9%) |
| $35,000 to $39,999 | 145 (3.5%) | 131 (3.2%) |
| $40,000 to $44,999 | 68 (1.6%) | 95 (2.3%) |
| $45,000 to $49,999 | 171 (4.1%) | 170 (4.2%) |
| $50,000 to $54,999 | 275 (6.5%) | 300 (7.3%) |
| $55,000 to $64,999 | 272 (6.5%) | 283 (6.9%) |
| $65,000 to $74,999 | 297 (7.1%) | 388 (9.5%) |
| $75,000 to $99,999 | 585 (13.9%) | 610 (14.9%) |
| $100,000+ | 1,294 (30.8%) | 707 (17.3%) |
| Total | 4,204 (100.0%) | 4,079 (100.0%) |
Earnings by Sex by Educational Attainment in Shorewood
Average earnings in Shorewood are $77,516 for men and $61,236 for women, a difference of 21.0%. Men with an educational attainment of graduate degree enjoy the highest average annual earnings of $116,071, while those with high school diploma education earn the least with $51,899. Women with an educational attainment of graduate degree earn the most with the average annual earnings of $78,927, while those with high school diploma education have the smallest earnings of $40,682.
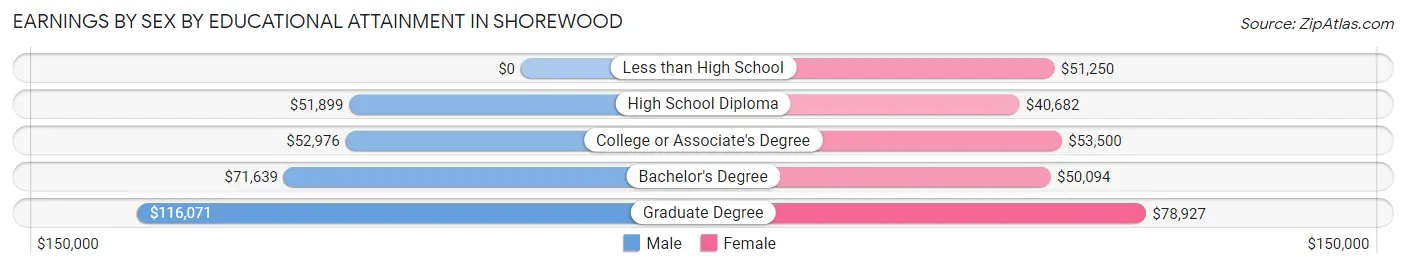
| Educational Attainment | Male Income | Female Income |
| Less than High School | - | - |
| High School Diploma | $51,899 | $40,682 |
| College or Associate's Degree | $52,976 | $53,500 |
| Bachelor's Degree | $71,639 | $50,094 |
| Graduate Degree | $116,071 | $78,927 |
| Total | $77,516 | $61,236 |
Family Income in Shorewood
Family Income Brackets in Shorewood
According to the Shorewood family income data, there are 967 families falling into the $200,000+ income range, which is the most common income bracket and makes up 28.6% of all families. Conversely, the less than $10,000 income bracket is the least frequent group with only 10 families (0.3%) belonging to this category.
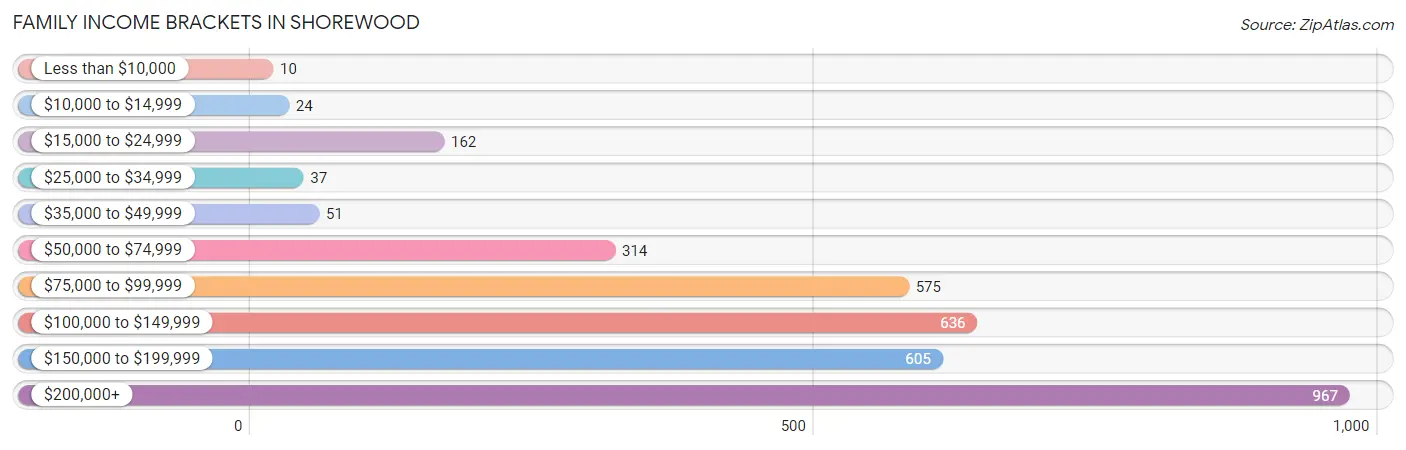
| Income Bracket | # Families | % Families |
| Less than $10,000 | 10 | 0.3% |
| $10,000 to $14,999 | 24 | 0.7% |
| $15,000 to $24,999 | 162 | 4.8% |
| $25,000 to $34,999 | 37 | 1.1% |
| $35,000 to $49,999 | 51 | 1.5% |
| $50,000 to $74,999 | 314 | 9.3% |
| $75,000 to $99,999 | 575 | 17.0% |
| $100,000 to $149,999 | 636 | 18.8% |
| $150,000 to $199,999 | 605 | 17.9% |
| $200,000+ | 967 | 28.6% |
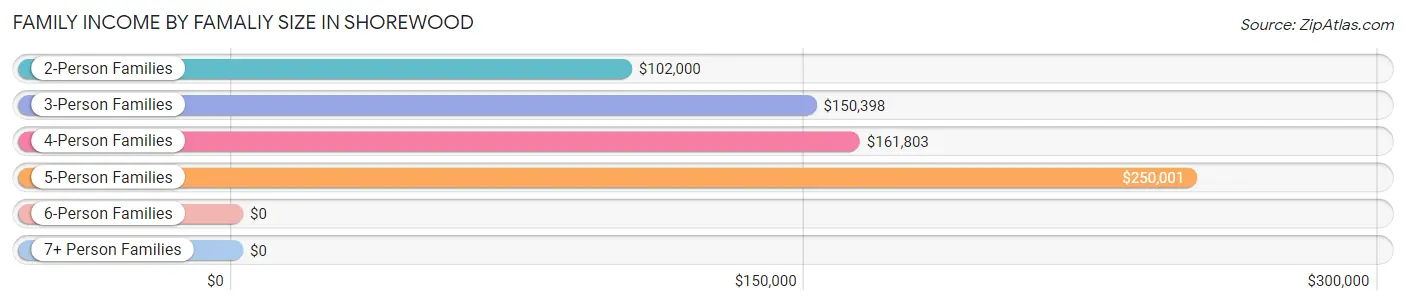
Family Income by Famaliy Size in Shorewood
5-person families (196 | 5.8%) account for the highest median family income in Shorewood with $250,001 per family, while 2-person families (1,632 | 48.3%) have the highest median income of $51,000 per family member.
| Income Bracket | # Families | Median Income |
| 2-Person Families | 1,632 (48.3%) | $102,000 |
| 3-Person Families | 939 (27.8%) | $150,398 |
| 4-Person Families | 589 (17.4%) | $161,803 |
| 5-Person Families | 196 (5.8%) | $250,001 |
| 6-Person Families | 17 (0.5%) | $0 |
| 7+ Person Families | 8 (0.2%) | $0 |
| Total | 3,381 (100.0%) | $143,583 |
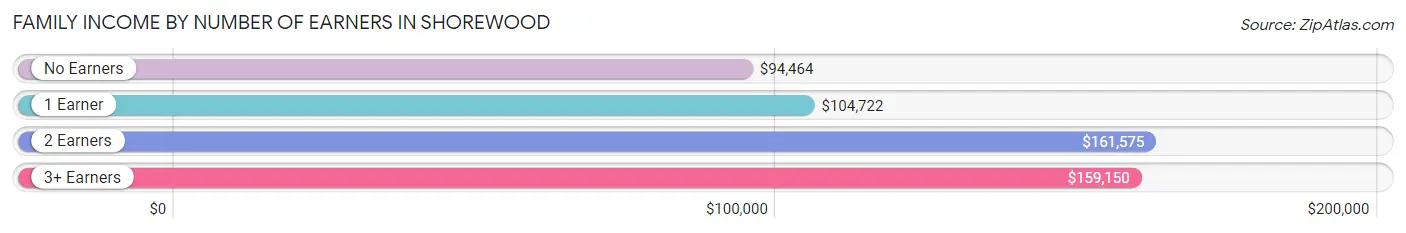
Family Income by Number of Earners in Shorewood
The median family income in Shorewood is $143,583, with families comprising 2 earners (1,731) having the highest median family income of $161,575, while families with no earners (345) have the lowest median family income of $94,464, accounting for 51.2% and 10.2% of families, respectively.
| Number of Earners | # Families | Median Income |
| No Earners | 345 (10.2%) | $94,464 |
| 1 Earner | 1,000 (29.6%) | $104,722 |
| 2 Earners | 1,731 (51.2%) | $161,575 |
| 3+ Earners | 305 (9.0%) | $159,150 |
| Total | 3,381 (100.0%) | $143,583 |
Household Income in Shorewood
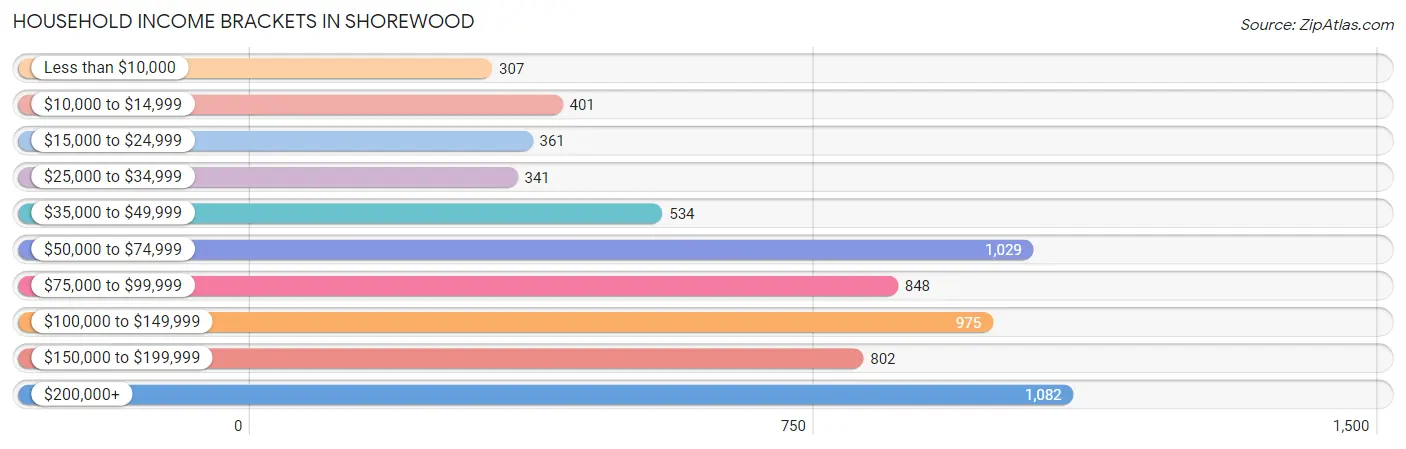
Household Income Brackets in Shorewood
With 1,082 households falling in the category, the $200,000+ income range is the most frequent in Shorewood, accounting for 16.2% of all households. In contrast, only 307 households (4.6%) fall into the less than $10,000 income bracket, making it the least populous group.
| Income Bracket | # Households | % Households |
| Less than $10,000 | 307 | 4.6% |
| $10,000 to $14,999 | 401 | 6.0% |
| $15,000 to $24,999 | 361 | 5.4% |
| $25,000 to $34,999 | 341 | 5.1% |
| $35,000 to $49,999 | 534 | 8.0% |
| $50,000 to $74,999 | 1,029 | 15.4% |
| $75,000 to $99,999 | 848 | 12.7% |
| $100,000 to $149,999 | 975 | 14.6% |
| $150,000 to $199,999 | 802 | 12.0% |
| $200,000+ | 1,082 | 16.2% |
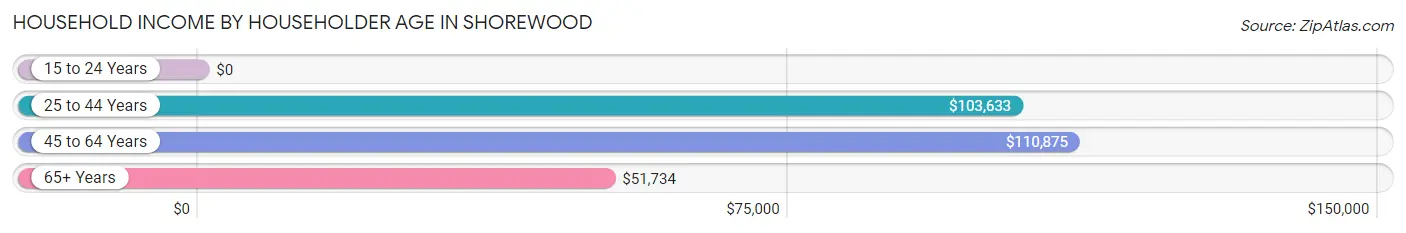
Household Income by Householder Age in Shorewood
The median household income in Shorewood is $87,161, with the highest median household income of $110,875 found in the 45 to 64 years age bracket for the primary householder. A total of 2,209 households (33.1%) fall into this category. Meanwhile, the 15 to 24 years age bracket for the primary householder has the lowest median household income of $0, with 324 households (4.9%) in this group.
| Income Bracket | # Households | Median Income |
| 15 to 24 Years | 324 (4.9%) | $0 |
| 25 to 44 Years | 2,527 (37.8%) | $103,633 |
| 45 to 64 Years | 2,209 (33.1%) | $110,875 |
| 65+ Years | 1,621 (24.3%) | $51,734 |
| Total | 6,681 (100.0%) | $87,161 |
Poverty in Shorewood
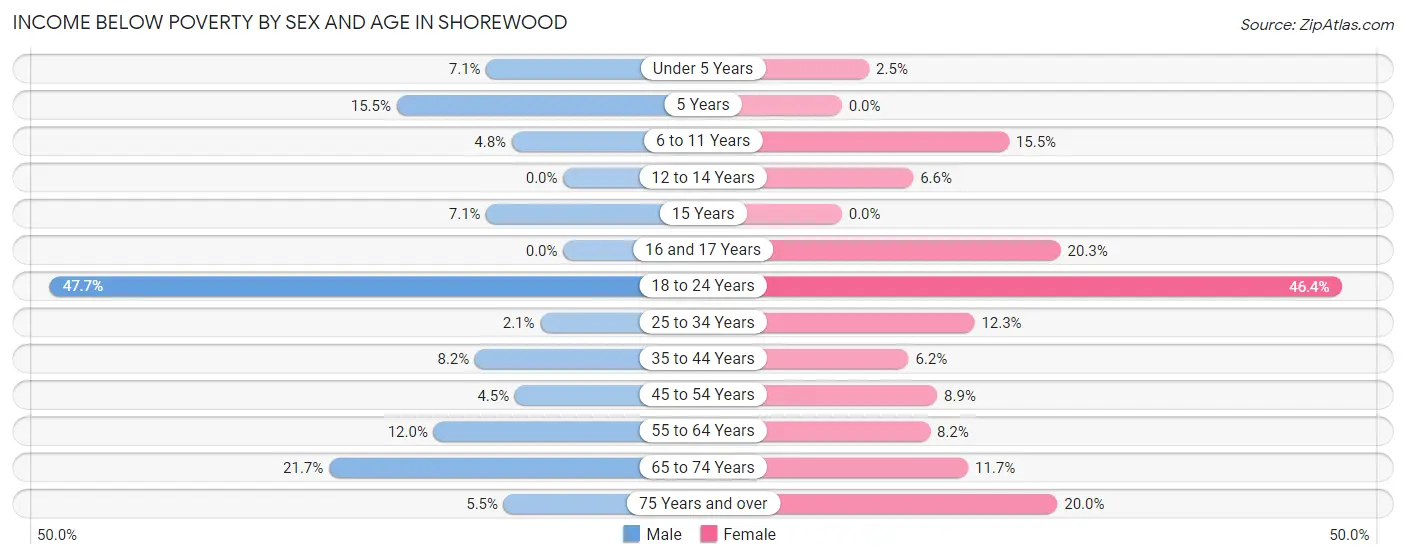
Income Below Poverty by Sex and Age in Shorewood
With 11.5% poverty level for males and 12.6% for females among the residents of Shorewood, 18 to 24 year old males and 18 to 24 year old females are the most vulnerable to poverty, with 295 males (47.7%) and 210 females (46.4%) in their respective age groups living below the poverty level.
| Age Bracket | Male | Female |
| Under 5 Years | 32 (7.1%) | 10 (2.5%) |
| 5 Years | 15 (15.5%) | 0 (0.0%) |
| 6 to 11 Years | 18 (4.8%) | 74 (15.5%) |
| 12 to 14 Years | 0 (0.0%) | 13 (6.6%) |
| 15 Years | 8 (7.1%) | 0 (0.0%) |
| 16 and 17 Years | 0 (0.0%) | 26 (20.3%) |
| 18 to 24 Years | 295 (47.7%) | 210 (46.4%) |
| 25 to 34 Years | 21 (2.1%) | 156 (12.3%) |
| 35 to 44 Years | 79 (8.2%) | 62 (6.2%) |
| 45 to 54 Years | 35 (4.5%) | 76 (8.8%) |
| 55 to 64 Years | 116 (12.0%) | 73 (8.2%) |
| 65 to 74 Years | 120 (21.7%) | 81 (11.7%) |
| 75 Years and over | 18 (5.5%) | 117 (20.0%) |
| Total | 757 (11.5%) | 898 (12.6%) |
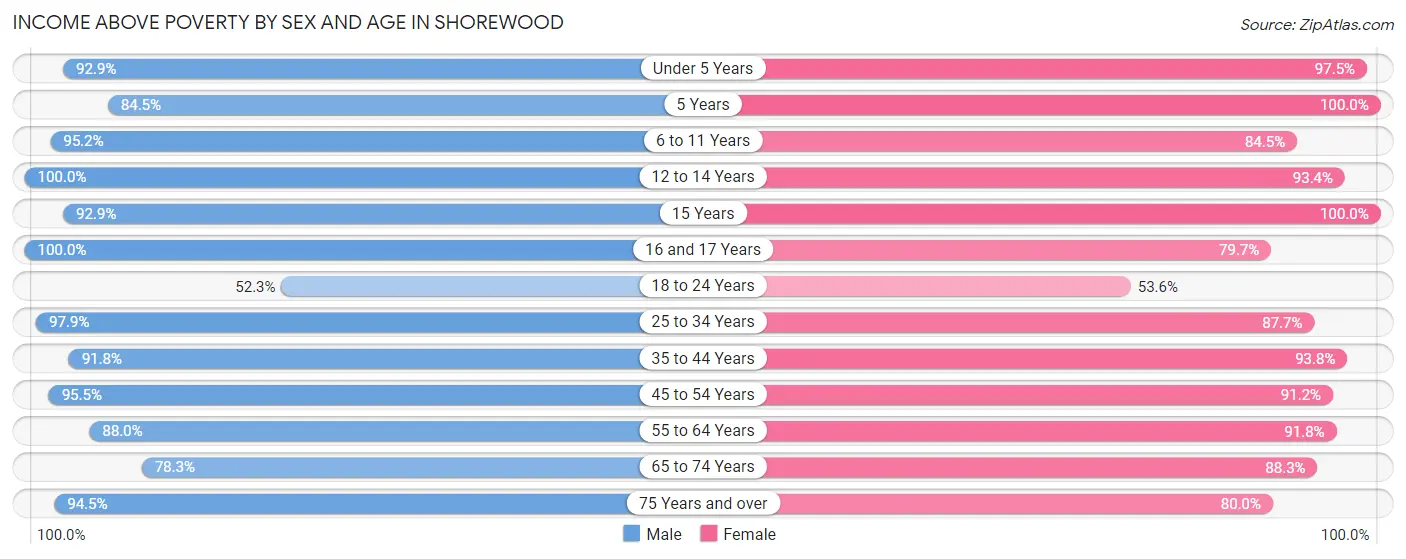
Income Above Poverty by Sex and Age in Shorewood
According to the poverty statistics in Shorewood, males aged 12 to 14 years and females aged 5 years are the age groups that are most secure financially, with 100.0% of males and 100.0% of females in these age groups living above the poverty line.
| Age Bracket | Male | Female |
| Under 5 Years | 416 (92.9%) | 384 (97.5%) |
| 5 Years | 82 (84.5%) | 74 (100.0%) |
| 6 to 11 Years | 359 (95.2%) | 403 (84.5%) |
| 12 to 14 Years | 226 (100.0%) | 183 (93.4%) |
| 15 Years | 104 (92.9%) | 126 (100.0%) |
| 16 and 17 Years | 102 (100.0%) | 102 (79.7%) |
| 18 to 24 Years | 324 (52.3%) | 243 (53.6%) |
| 25 to 34 Years | 966 (97.9%) | 1,111 (87.7%) |
| 35 to 44 Years | 886 (91.8%) | 940 (93.8%) |
| 45 to 54 Years | 747 (95.5%) | 783 (91.1%) |
| 55 to 64 Years | 848 (88.0%) | 818 (91.8%) |
| 65 to 74 Years | 432 (78.3%) | 610 (88.3%) |
| 75 Years and over | 308 (94.5%) | 468 (80.0%) |
| Total | 5,800 (88.5%) | 6,245 (87.4%) |
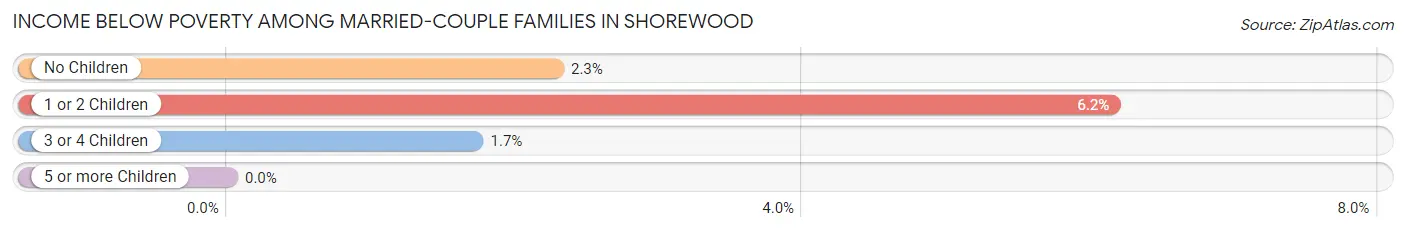
Income Below Poverty Among Married-Couple Families in Shorewood
The poverty statistics for married-couple families in Shorewood show that 3.8% or 106 of the total 2,777 families live below the poverty line. Families with 1 or 2 children have the highest poverty rate of 6.1%, comprising of 70 families. On the other hand, families with 5 or more children have the lowest poverty rate of 0.0%, which includes 0 families.
| Children | Above Poverty | Below Poverty |
| No Children | 1,422 (97.7%) | 33 (2.3%) |
| 1 or 2 Children | 1,069 (93.9%) | 70 (6.1%) |
| 3 or 4 Children | 172 (98.3%) | 3 (1.7%) |
| 5 or more Children | 8 (100.0%) | 0 (0.0%) |
| Total | 2,671 (96.2%) | 106 (3.8%) |
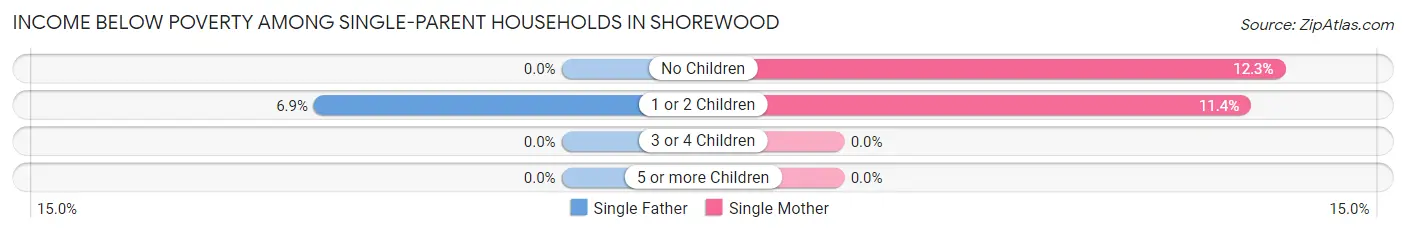
Income Below Poverty Among Single-Parent Households in Shorewood
According to the poverty data in Shorewood, 4.6% or 9 single-father households and 11.5% or 47 single-mother households are living below the poverty line. Among single-father households, those with 1 or 2 children have the highest poverty rate, with 9 households (6.9%) experiencing poverty. Likewise, among single-mother households, those with no children have the highest poverty rate, with 19 households (12.3%) falling below the poverty line.
| Children | Single Father | Single Mother |
| No Children | 0 (0.0%) | 19 (12.3%) |
| 1 or 2 Children | 9 (6.9%) | 28 (11.4%) |
| 3 or 4 Children | 0 (0.0%) | 0 (0.0%) |
| 5 or more Children | 0 (0.0%) | 0 (0.0%) |
| Total | 9 (4.6%) | 47 (11.5%) |
Income Below Poverty Among Married-Couple vs Single-Parent Households in Shorewood
The poverty data for Shorewood shows that 106 of the married-couple family households (3.8%) and 56 of the single-parent households (9.3%) are living below the poverty level. Within the married-couple family households, those with 1 or 2 children have the highest poverty rate, with 70 households (6.1%) falling below the poverty line. Among the single-parent households, those with no children have the highest poverty rate, with 19 household (10.9%) living below poverty.
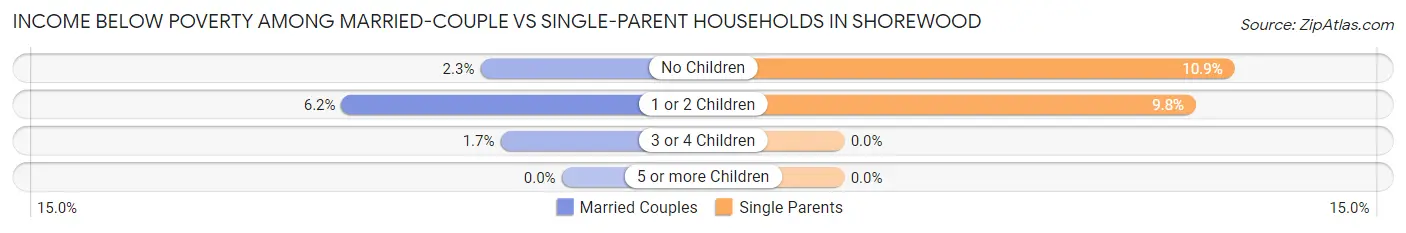
| Children | Married-Couple Families | Single-Parent Households |
| No Children | 33 (2.3%) | 19 (10.9%) |
| 1 or 2 Children | 70 (6.1%) | 37 (9.8%) |
| 3 or 4 Children | 3 (1.7%) | 0 (0.0%) |
| 5 or more Children | 0 (0.0%) | 0 (0.0%) |
| Total | 106 (3.8%) | 56 (9.3%) |
Employment Characteristics in Shorewood
Employment by Class of Employer in Shorewood
Among the 7,617 employed individuals in Shorewood, private company employees (4,068 | 53.4%), not-for-profit organizations (1,101 | 14.4%), and state government employees (777 | 10.2%) make up the most common classes of employment.
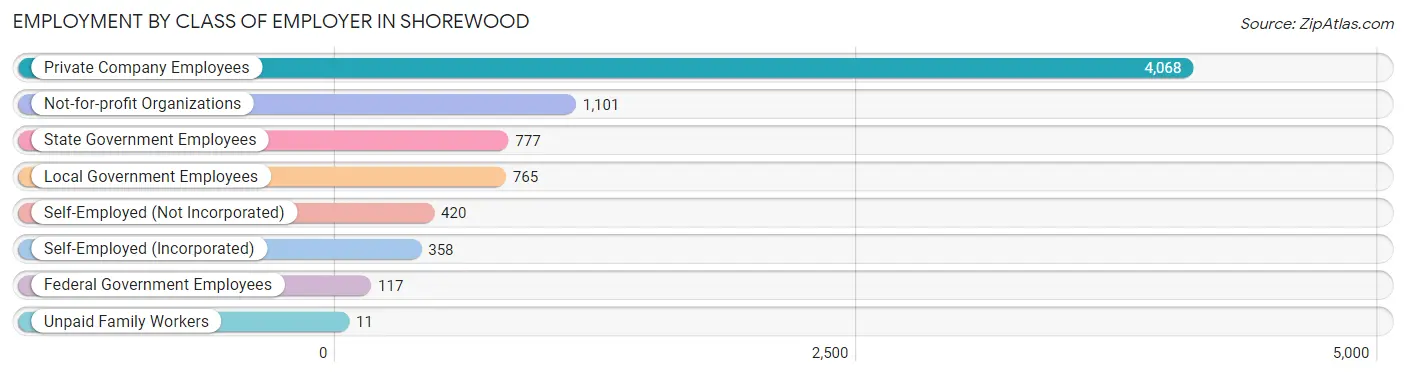
| Employer Class | # Employees | % Employees |
| Private Company Employees | 4,068 | 53.4% |
| Self-Employed (Incorporated) | 358 | 4.7% |
| Self-Employed (Not Incorporated) | 420 | 5.5% |
| Not-for-profit Organizations | 1,101 | 14.4% |
| Local Government Employees | 765 | 10.0% |
| State Government Employees | 777 | 10.2% |
| Federal Government Employees | 117 | 1.5% |
| Unpaid Family Workers | 11 | 0.1% |
| Total | 7,617 | 100.0% |
Employment Status by Age in Shorewood
According to the labor force statistics for Shorewood, out of the total population over 16 years of age (11,173), 71.7% or 8,011 individuals are in the labor force, with 3.8% or 304 of them unemployed. The age group with the highest labor force participation rate is 25 to 29 years, with 91.7% or 943 individuals in the labor force. Within the labor force, the 20 to 24 years age range has the highest percentage of unemployed individuals, with 10.1% or 73 of them being unemployed.
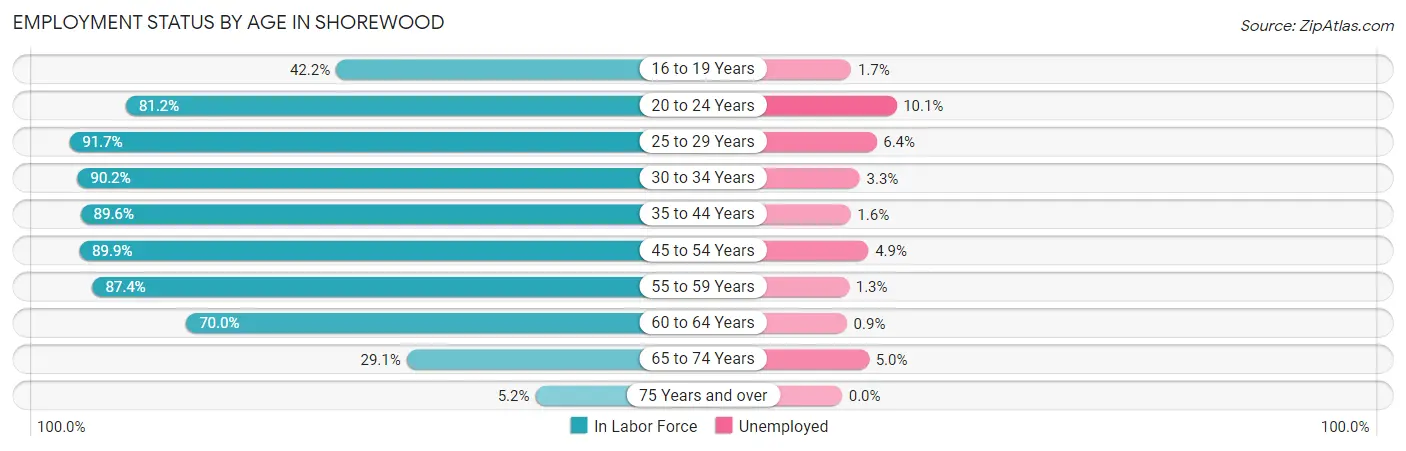
| Age Bracket | In Labor Force | Unemployed |
| 16 to 19 Years | 172 (42.2%) | 3 (1.7%) |
| 20 to 24 Years | 726 (81.2%) | 73 (10.1%) |
| 25 to 29 Years | 943 (91.7%) | 60 (6.4%) |
| 30 to 34 Years | 1,106 (90.2%) | 36 (3.3%) |
| 35 to 44 Years | 1,762 (89.6%) | 28 (1.6%) |
| 45 to 54 Years | 1,475 (89.9%) | 72 (4.9%) |
| 55 to 59 Years | 618 (87.4%) | 8 (1.3%) |
| 60 to 64 Years | 804 (70.0%) | 7 (0.9%) |
| 65 to 74 Years | 362 (29.1%) | 18 (5.0%) |
| 75 Years and over | 47 (5.2%) | 0 (0.0%) |
| Total | 8,011 (71.7%) | 304 (3.8%) |
Employment Status by Educational Attainment in Shorewood
According to labor force statistics for Shorewood, 86.9% of individuals (6,706) out of the total population between 25 and 64 years of age (7,717) are in the labor force, with 3.1% or 208 of them being unemployed. The group with the highest labor force participation rate are those with the educational attainment of bachelor's degree or higher, with 87.8% or 5,421 individuals in the labor force. Within the labor force, individuals with high school diploma education have the highest percentage of unemployment, with 14.2% or 70 of them being unemployed.
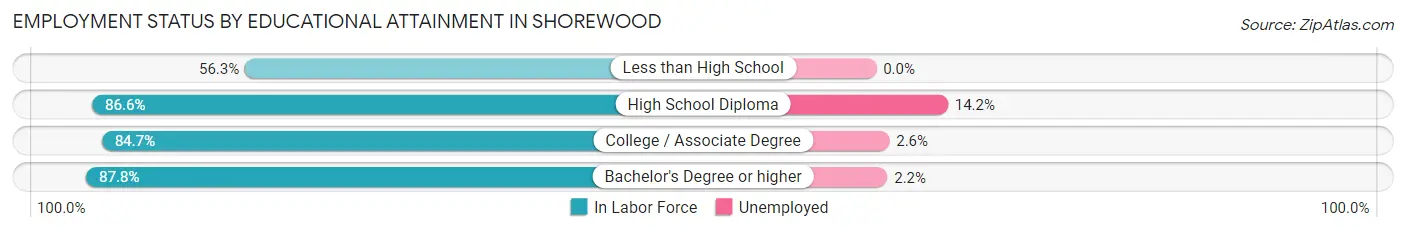
| Educational Attainment | In Labor Force | Unemployed |
| Less than High School | 63 (56.3%) | 0 (0.0%) |
| High School Diploma | 493 (86.6%) | 81 (14.2%) |
| College / Associate Degree | 730 (84.7%) | 22 (2.6%) |
| Bachelor's Degree or higher | 5,421 (87.8%) | 136 (2.2%) |
| Total | 6,706 (86.9%) | 239 (3.1%) |
Employment Occupations by Sex in Shorewood
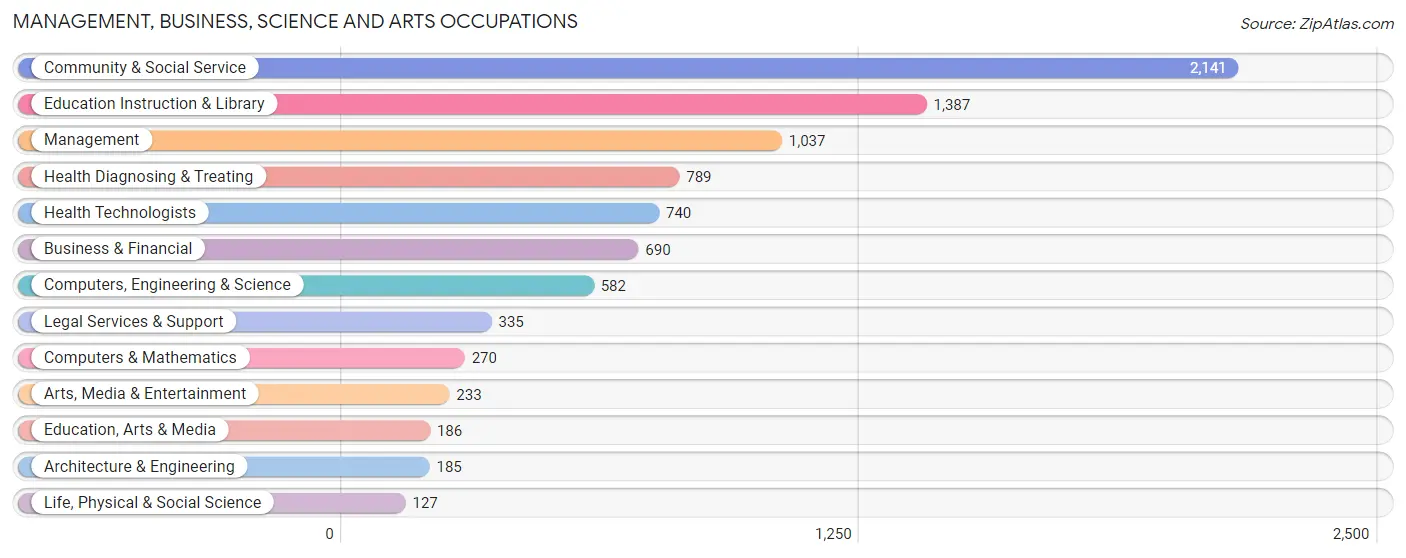
Management, Business, Science and Arts Occupations
The most common Management, Business, Science and Arts occupations in Shorewood are Community & Social Service (2,141 | 27.8%), Education Instruction & Library (1,387 | 18.0%), Management (1,037 | 13.5%), Health Diagnosing & Treating (789 | 10.2%), and Health Technologists (740 | 9.6%).
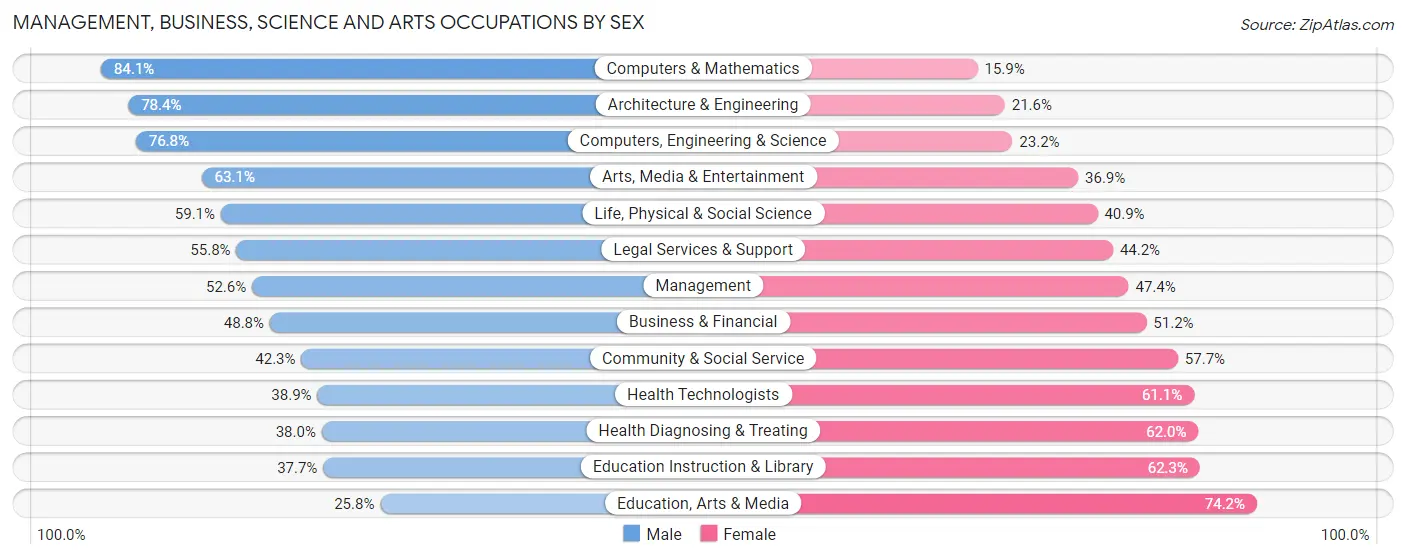
Management, Business, Science and Arts Occupations by Sex
Within the Management, Business, Science and Arts occupations in Shorewood, the most male-oriented occupations are Computers & Mathematics (84.1%), Architecture & Engineering (78.4%), and Computers, Engineering & Science (76.8%), while the most female-oriented occupations are Education, Arts & Media (74.2%), Education Instruction & Library (62.3%), and Health Diagnosing & Treating (62.0%).
| Occupation | Male | Female |
| Management | 545 (52.6%) | 492 (47.4%) |
| Business & Financial | 337 (48.8%) | 353 (51.2%) |
| Computers, Engineering & Science | 447 (76.8%) | 135 (23.2%) |
| Computers & Mathematics | 227 (84.1%) | 43 (15.9%) |
| Architecture & Engineering | 145 (78.4%) | 40 (21.6%) |
| Life, Physical & Social Science | 75 (59.1%) | 52 (40.9%) |
| Community & Social Service | 905 (42.3%) | 1,236 (57.7%) |
| Education, Arts & Media | 48 (25.8%) | 138 (74.2%) |
| Legal Services & Support | 187 (55.8%) | 148 (44.2%) |
| Education Instruction & Library | 523 (37.7%) | 864 (62.3%) |
| Arts, Media & Entertainment | 147 (63.1%) | 86 (36.9%) |
| Health Diagnosing & Treating | 300 (38.0%) | 489 (62.0%) |
| Health Technologists | 288 (38.9%) | 452 (61.1%) |
| Total (Category) | 2,534 (48.4%) | 2,705 (51.6%) |
| Total (Overall) | 3,920 (50.9%) | 3,783 (49.1%) |
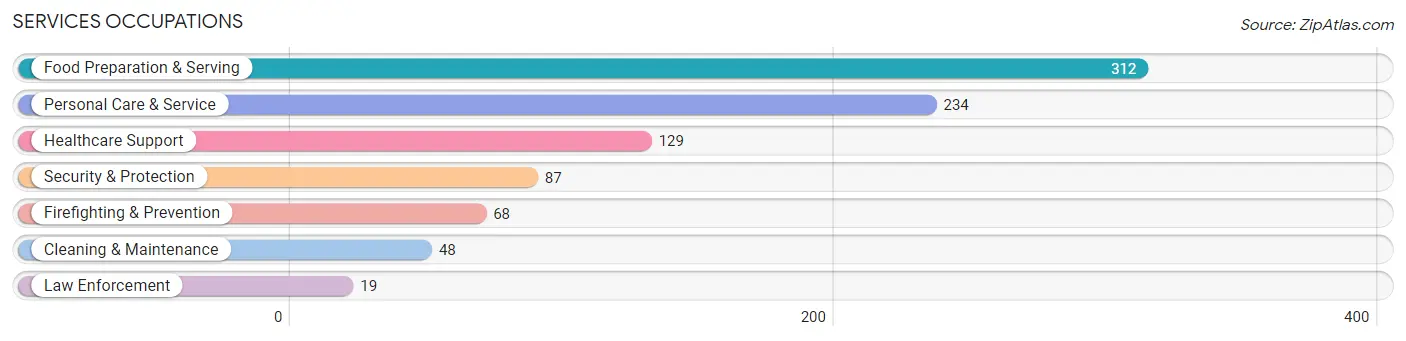
Services Occupations
The most common Services occupations in Shorewood are Food Preparation & Serving (312 | 4.1%), Personal Care & Service (234 | 3.0%), Healthcare Support (129 | 1.7%), Security & Protection (87 | 1.1%), and Firefighting & Prevention (68 | 0.9%).
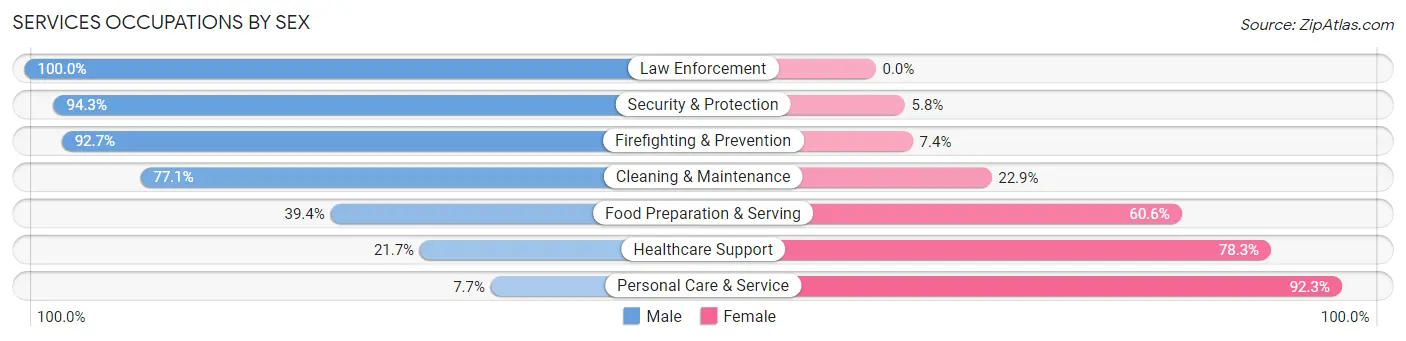
Services Occupations by Sex
Within the Services occupations in Shorewood, the most male-oriented occupations are Law Enforcement (100.0%), Security & Protection (94.3%), and Firefighting & Prevention (92.6%), while the most female-oriented occupations are Personal Care & Service (92.3%), Healthcare Support (78.3%), and Food Preparation & Serving (60.6%).
| Occupation | Male | Female |
| Healthcare Support | 28 (21.7%) | 101 (78.3%) |
| Security & Protection | 82 (94.3%) | 5 (5.8%) |
| Firefighting & Prevention | 63 (92.6%) | 5 (7.3%) |
| Law Enforcement | 19 (100.0%) | 0 (0.0%) |
| Food Preparation & Serving | 123 (39.4%) | 189 (60.6%) |
| Cleaning & Maintenance | 37 (77.1%) | 11 (22.9%) |
| Personal Care & Service | 18 (7.7%) | 216 (92.3%) |
| Total (Category) | 288 (35.6%) | 522 (64.4%) |
| Total (Overall) | 3,920 (50.9%) | 3,783 (49.1%) |
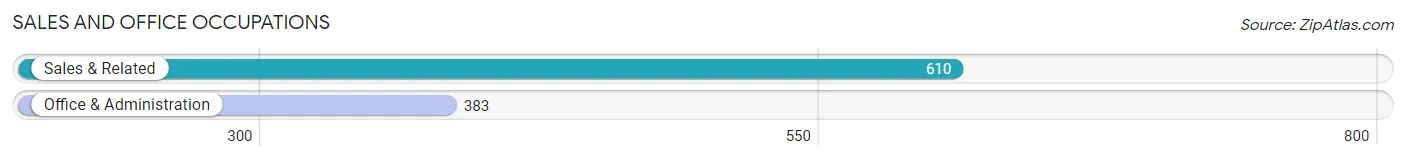
Sales and Office Occupations
The most common Sales and Office occupations in Shorewood are Sales & Related (610 | 7.9%), and Office & Administration (383 | 5.0%).
Sales and Office Occupations by Sex
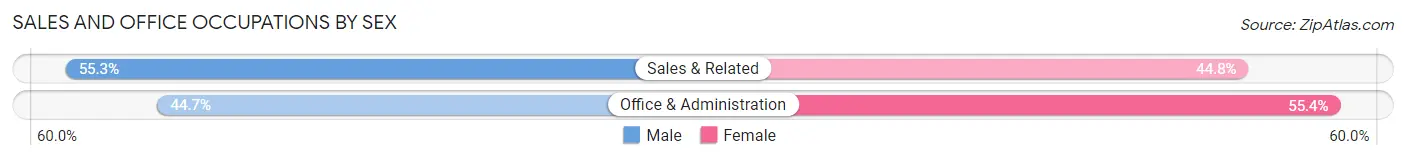
| Occupation | Male | Female |
| Sales & Related | 337 (55.2%) | 273 (44.8%) |
| Office & Administration | 171 (44.7%) | 212 (55.3%) |
| Total (Category) | 508 (51.2%) | 485 (48.8%) |
| Total (Overall) | 3,920 (50.9%) | 3,783 (49.1%) |
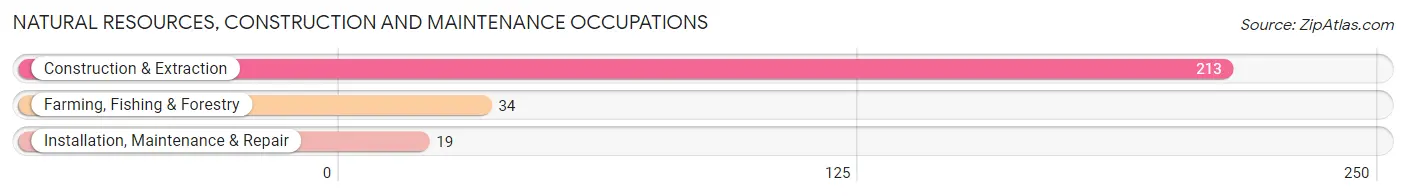
Natural Resources, Construction and Maintenance Occupations
The most common Natural Resources, Construction and Maintenance occupations in Shorewood are Construction & Extraction (213 | 2.8%), Farming, Fishing & Forestry (34 | 0.4%), and Installation, Maintenance & Repair (19 | 0.3%).
Natural Resources, Construction and Maintenance Occupations by Sex
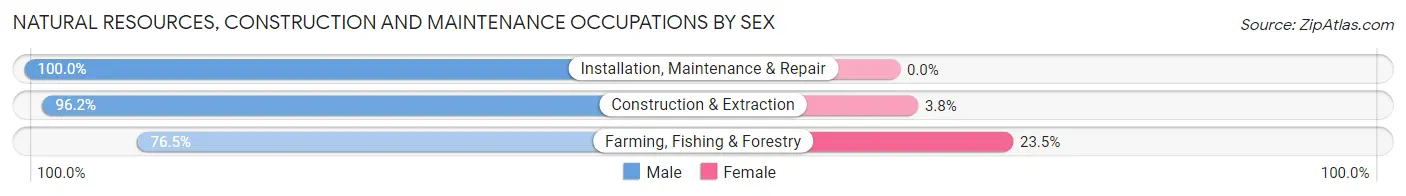
| Occupation | Male | Female |
| Farming, Fishing & Forestry | 26 (76.5%) | 8 (23.5%) |
| Construction & Extraction | 205 (96.2%) | 8 (3.8%) |
| Installation, Maintenance & Repair | 19 (100.0%) | 0 (0.0%) |
| Total (Category) | 250 (94.0%) | 16 (6.0%) |
| Total (Overall) | 3,920 (50.9%) | 3,783 (49.1%) |
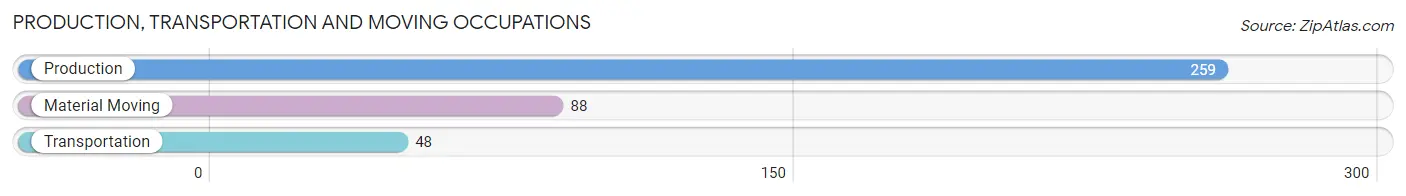
Production, Transportation and Moving Occupations
The most common Production, Transportation and Moving occupations in Shorewood are Production (259 | 3.4%), Material Moving (88 | 1.1%), and Transportation (48 | 0.6%).
Production, Transportation and Moving Occupations by Sex
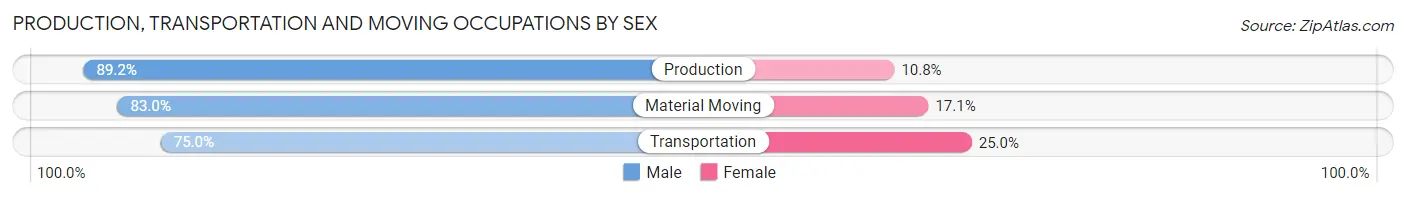
| Occupation | Male | Female |
| Production | 231 (89.2%) | 28 (10.8%) |
| Transportation | 36 (75.0%) | 12 (25.0%) |
| Material Moving | 73 (83.0%) | 15 (17.1%) |
| Total (Category) | 340 (86.1%) | 55 (13.9%) |
| Total (Overall) | 3,920 (50.9%) | 3,783 (49.1%) |
Employment Industries by Sex in Shorewood
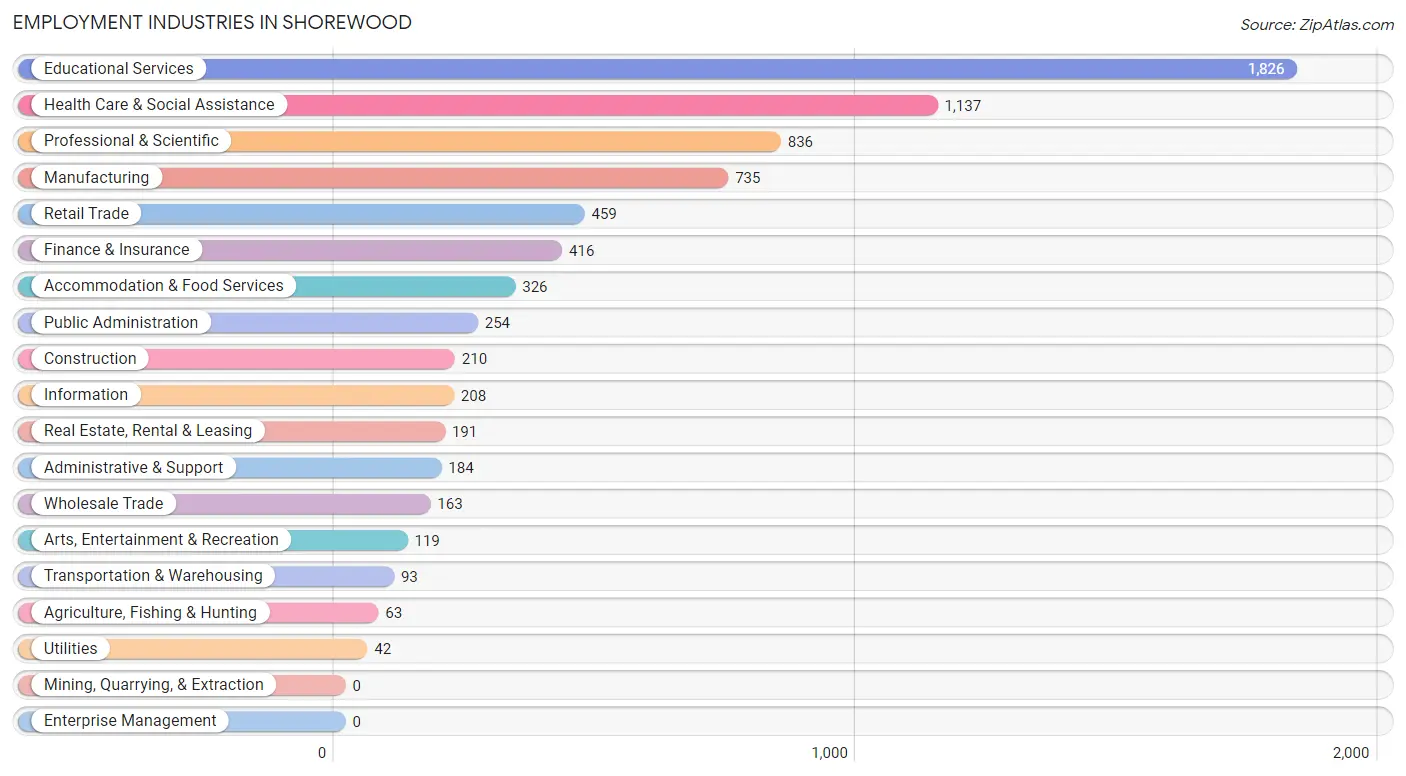
Employment Industries in Shorewood
The major employment industries in Shorewood include Educational Services (1,826 | 23.7%), Health Care & Social Assistance (1,137 | 14.8%), Professional & Scientific (836 | 10.8%), Manufacturing (735 | 9.5%), and Retail Trade (459 | 6.0%).
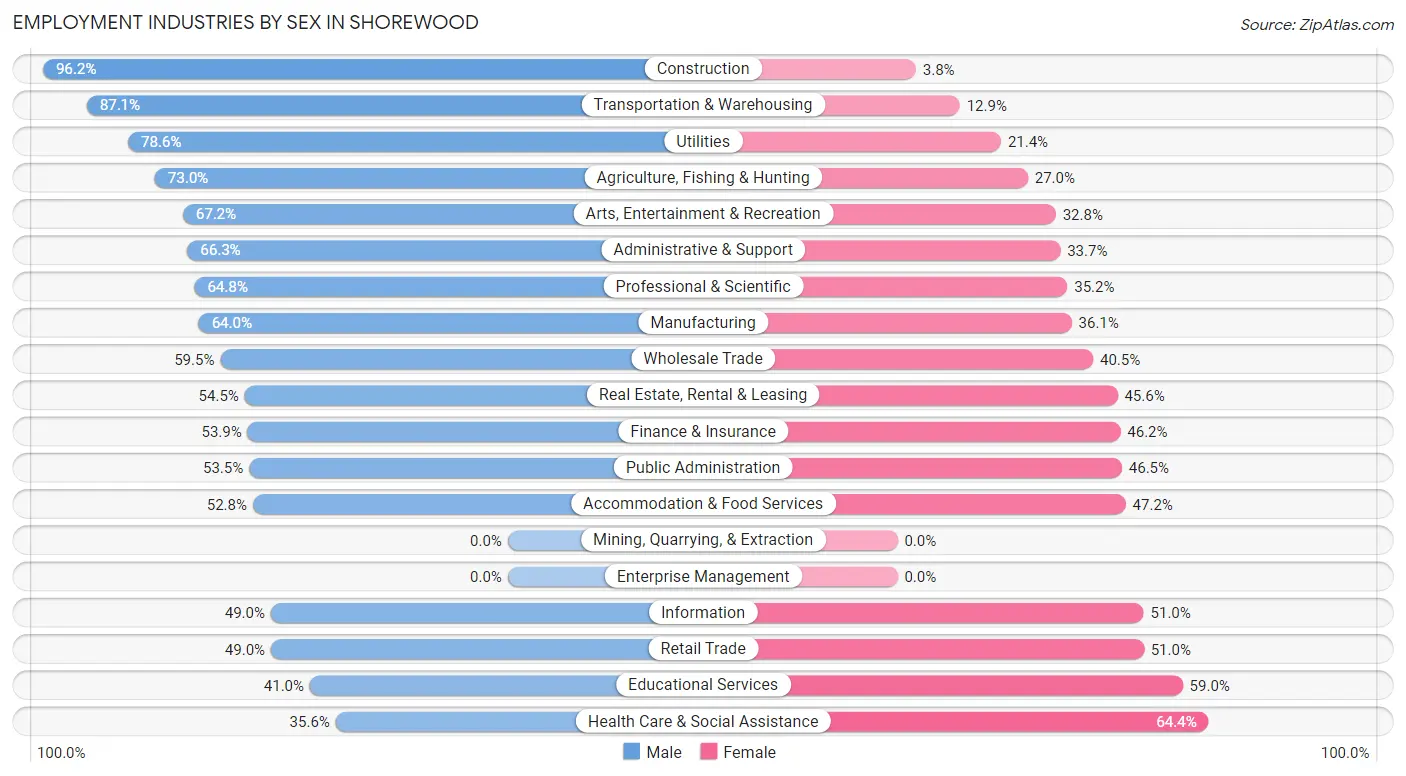
Employment Industries by Sex in Shorewood
The Shorewood industries that see more men than women are Construction (96.2%), Transportation & Warehousing (87.1%), and Utilities (78.6%), whereas the industries that tend to have a higher number of women are Health Care & Social Assistance (64.4%), Educational Services (59.0%), and Retail Trade (51.0%).
| Industry | Male | Female |
| Agriculture, Fishing & Hunting | 46 (73.0%) | 17 (27.0%) |
| Mining, Quarrying, & Extraction | 0 (0.0%) | 0 (0.0%) |
| Construction | 202 (96.2%) | 8 (3.8%) |
| Manufacturing | 470 (63.9%) | 265 (36.0%) |
| Wholesale Trade | 97 (59.5%) | 66 (40.5%) |
| Retail Trade | 225 (49.0%) | 234 (51.0%) |
| Transportation & Warehousing | 81 (87.1%) | 12 (12.9%) |
| Utilities | 33 (78.6%) | 9 (21.4%) |
| Information | 102 (49.0%) | 106 (51.0%) |
| Finance & Insurance | 224 (53.8%) | 192 (46.2%) |
| Real Estate, Rental & Leasing | 104 (54.4%) | 87 (45.6%) |
| Professional & Scientific | 542 (64.8%) | 294 (35.2%) |
| Enterprise Management | 0 (0.0%) | 0 (0.0%) |
| Administrative & Support | 122 (66.3%) | 62 (33.7%) |
| Educational Services | 748 (41.0%) | 1,078 (59.0%) |
| Health Care & Social Assistance | 405 (35.6%) | 732 (64.4%) |
| Arts, Entertainment & Recreation | 80 (67.2%) | 39 (32.8%) |
| Accommodation & Food Services | 172 (52.8%) | 154 (47.2%) |
| Public Administration | 136 (53.5%) | 118 (46.5%) |
| Total | 3,920 (50.9%) | 3,783 (49.1%) |
Education in Shorewood
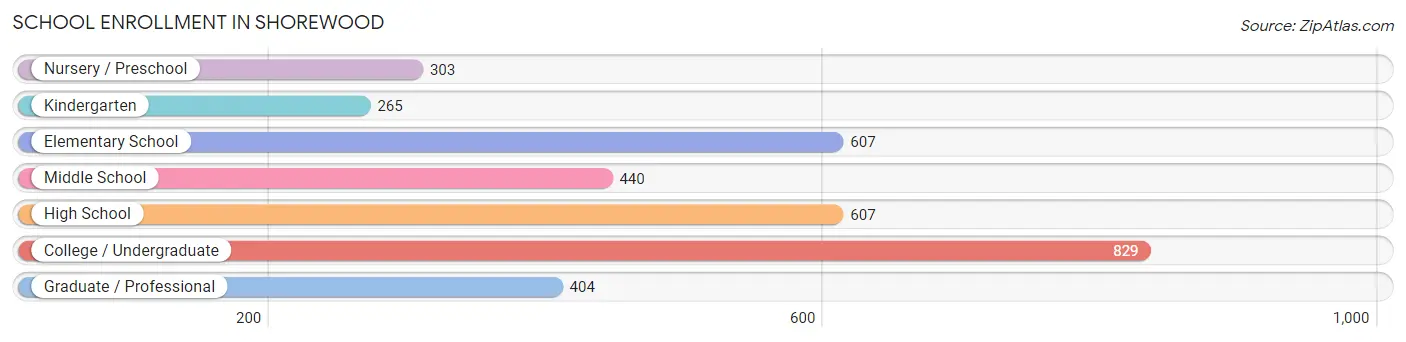
School Enrollment in Shorewood
The most common levels of schooling among the 3,455 students in Shorewood are college / undergraduate (829 | 24.0%), elementary school (607 | 17.6%), and high school (607 | 17.6%).
| School Level | # Students | % Students |
| Nursery / Preschool | 303 | 8.8% |
| Kindergarten | 265 | 7.7% |
| Elementary School | 607 | 17.6% |
| Middle School | 440 | 12.7% |
| High School | 607 | 17.6% |
| College / Undergraduate | 829 | 24.0% |
| Graduate / Professional | 404 | 11.7% |
| Total | 3,455 | 100.0% |
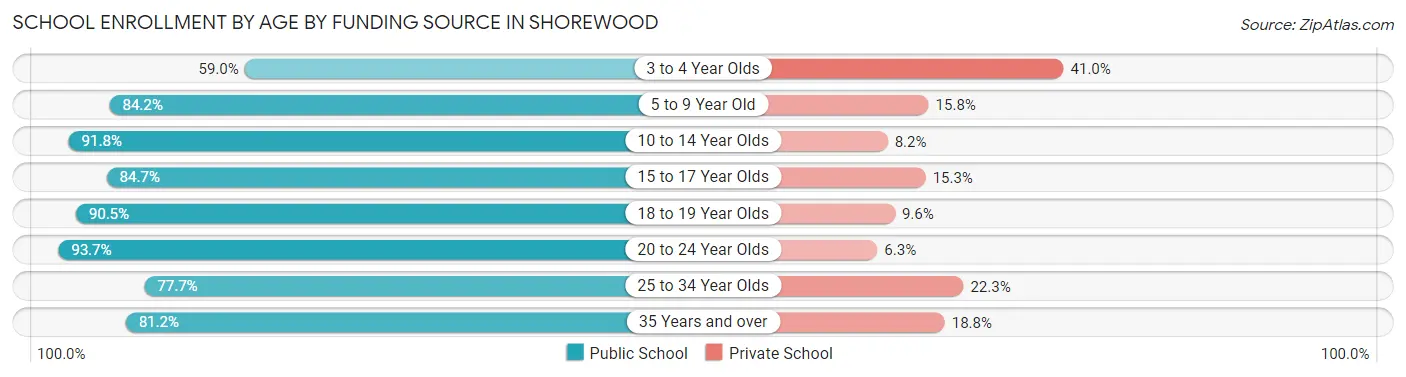
School Enrollment by Age by Funding Source in Shorewood
Out of a total of 3,455 students who are enrolled in schools in Shorewood, 539 (15.6%) attend a private institution, while the remaining 2,916 (84.4%) are enrolled in public schools. The age group of 3 to 4 year olds has the highest likelihood of being enrolled in private schools, with 127 (41.0% in the age bracket) enrolled. Conversely, the age group of 20 to 24 year olds has the lowest likelihood of being enrolled in a private school, with 537 (93.7% in the age bracket) attending a public institution.
| Age Bracket | Public School | Private School |
| 3 to 4 Year Olds | 183 (59.0%) | 127 (41.0%) |
| 5 to 9 Year Old | 691 (84.2%) | 130 (15.8%) |
| 10 to 14 Year Olds | 537 (91.8%) | 48 (8.2%) |
| 15 to 17 Year Olds | 377 (84.7%) | 68 (15.3%) |
| 18 to 19 Year Olds | 161 (90.4%) | 17 (9.6%) |
| 20 to 24 Year Olds | 537 (93.7%) | 36 (6.3%) |
| 25 to 34 Year Olds | 261 (77.7%) | 75 (22.3%) |
| 35 Years and over | 168 (81.2%) | 39 (18.8%) |
| Total | 2,916 (84.4%) | 539 (15.6%) |
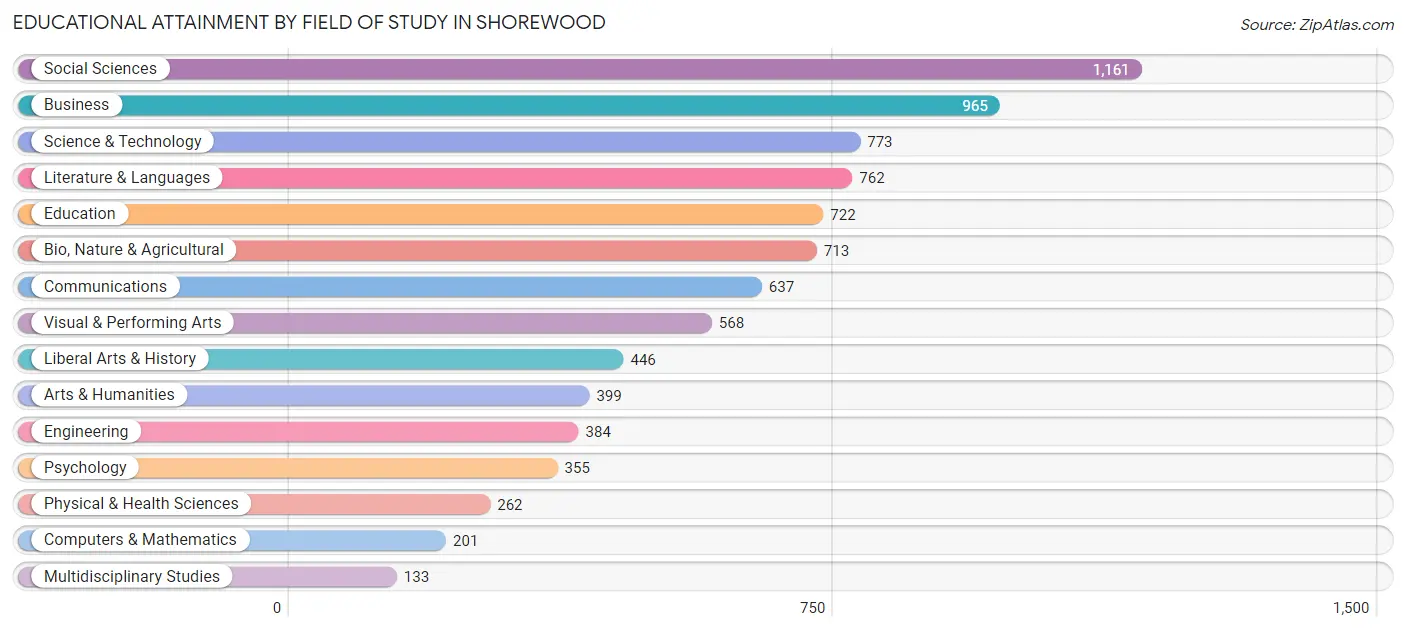
Educational Attainment by Field of Study in Shorewood
Social sciences (1,161 | 13.7%), business (965 | 11.4%), science & technology (773 | 9.1%), literature & languages (762 | 9.0%), and education (722 | 8.5%) are the most common fields of study among 8,481 individuals in Shorewood who have obtained a bachelor's degree or higher.
| Field of Study | # Graduates | % Graduates |
| Computers & Mathematics | 201 | 2.4% |
| Bio, Nature & Agricultural | 713 | 8.4% |
| Physical & Health Sciences | 262 | 3.1% |
| Psychology | 355 | 4.2% |
| Social Sciences | 1,161 | 13.7% |
| Engineering | 384 | 4.5% |
| Multidisciplinary Studies | 133 | 1.6% |
| Science & Technology | 773 | 9.1% |
| Business | 965 | 11.4% |
| Education | 722 | 8.5% |
| Literature & Languages | 762 | 9.0% |
| Liberal Arts & History | 446 | 5.3% |
| Visual & Performing Arts | 568 | 6.7% |
| Communications | 637 | 7.5% |
| Arts & Humanities | 399 | 4.7% |
| Total | 8,481 | 100.0% |
Transportation & Commute in Shorewood
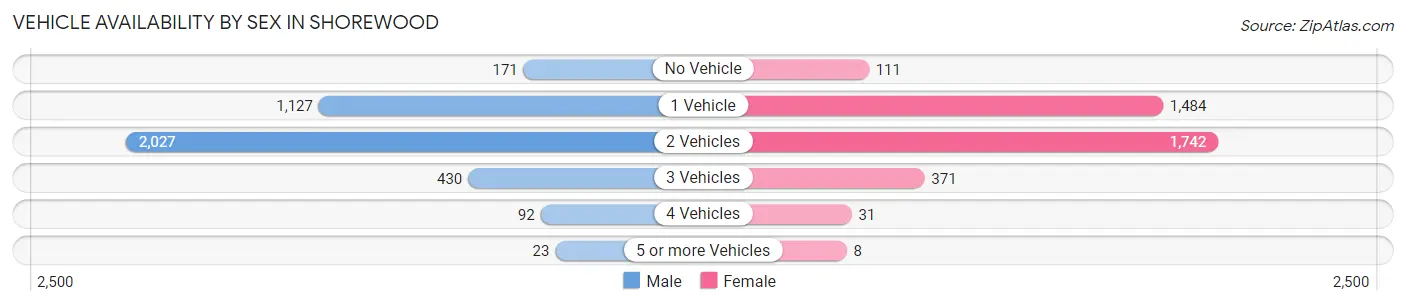
Vehicle Availability by Sex in Shorewood
The most prevalent vehicle ownership categories in Shorewood are males with 2 vehicles (2,027, accounting for 52.4%) and females with 2 vehicles (1,742, making up 54.1%).
| Vehicles Available | Male | Female |
| No Vehicle | 171 (4.4%) | 111 (3.0%) |
| 1 Vehicle | 1,127 (29.1%) | 1,484 (39.6%) |
| 2 Vehicles | 2,027 (52.4%) | 1,742 (46.5%) |
| 3 Vehicles | 430 (11.1%) | 371 (9.9%) |
| 4 Vehicles | 92 (2.4%) | 31 (0.8%) |
| 5 or more Vehicles | 23 (0.6%) | 8 (0.2%) |
| Total | 3,870 (100.0%) | 3,747 (100.0%) |
Commute Time in Shorewood
The most frequently occuring commute durations in Shorewood are 10 to 14 minutes (1,434 commuters, 23.2%), 15 to 19 minutes (1,142 commuters, 18.5%), and 30 to 34 minutes (896 commuters, 14.5%).
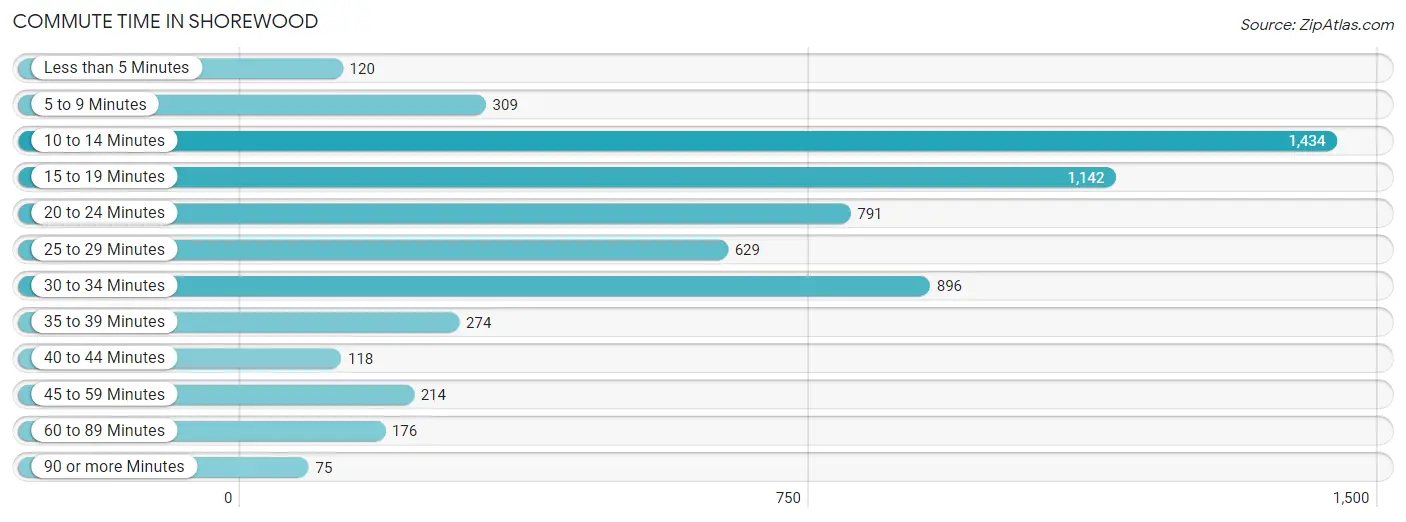
| Commute Time | # Commuters | % Commuters |
| Less than 5 Minutes | 120 | 1.9% |
| 5 to 9 Minutes | 309 | 5.0% |
| 10 to 14 Minutes | 1,434 | 23.2% |
| 15 to 19 Minutes | 1,142 | 18.5% |
| 20 to 24 Minutes | 791 | 12.8% |
| 25 to 29 Minutes | 629 | 10.2% |
| 30 to 34 Minutes | 896 | 14.5% |
| 35 to 39 Minutes | 274 | 4.4% |
| 40 to 44 Minutes | 118 | 1.9% |
| 45 to 59 Minutes | 214 | 3.5% |
| 60 to 89 Minutes | 176 | 2.9% |
| 90 or more Minutes | 75 | 1.2% |
Commute Time by Sex in Shorewood
The most common commute times in Shorewood are 10 to 14 minutes (710 commuters, 22.7%) for males and 10 to 14 minutes (724 commuters, 23.7%) for females.
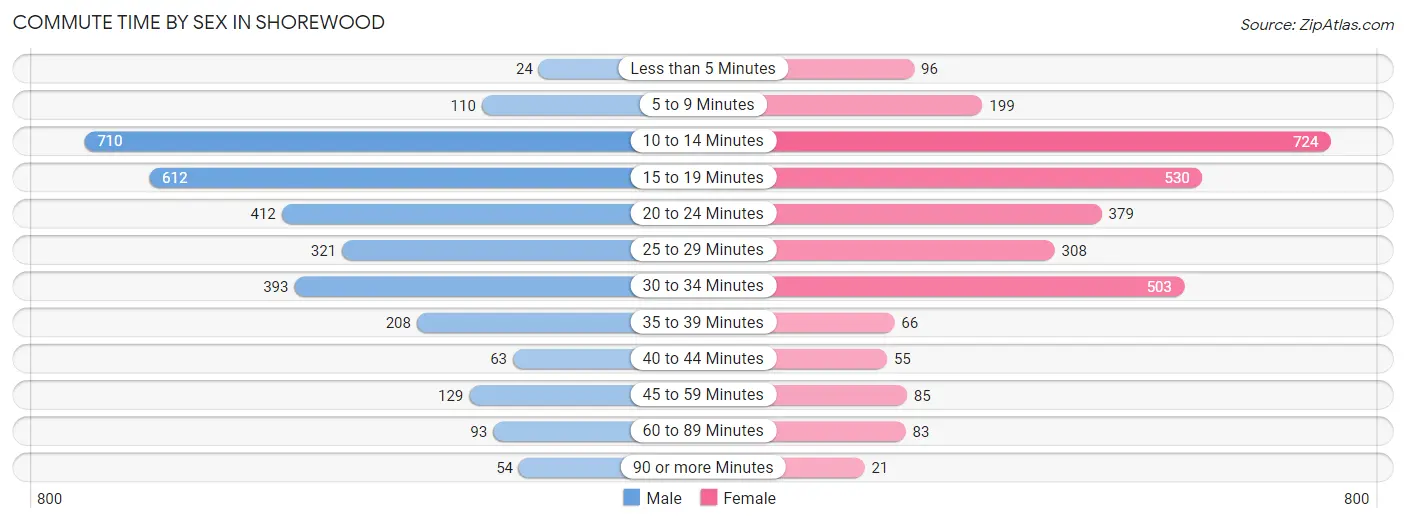
| Commute Time | Male | Female |
| Less than 5 Minutes | 24 (0.8%) | 96 (3.2%) |
| 5 to 9 Minutes | 110 (3.5%) | 199 (6.5%) |
| 10 to 14 Minutes | 710 (22.7%) | 724 (23.7%) |
| 15 to 19 Minutes | 612 (19.6%) | 530 (17.4%) |
| 20 to 24 Minutes | 412 (13.2%) | 379 (12.4%) |
| 25 to 29 Minutes | 321 (10.3%) | 308 (10.1%) |
| 30 to 34 Minutes | 393 (12.6%) | 503 (16.5%) |
| 35 to 39 Minutes | 208 (6.7%) | 66 (2.2%) |
| 40 to 44 Minutes | 63 (2.0%) | 55 (1.8%) |
| 45 to 59 Minutes | 129 (4.1%) | 85 (2.8%) |
| 60 to 89 Minutes | 93 (3.0%) | 83 (2.7%) |
| 90 or more Minutes | 54 (1.7%) | 21 (0.7%) |
Time of Departure to Work by Sex in Shorewood
The most frequent times of departure to work in Shorewood are 7:00 AM to 7:29 AM (633, 20.2%) for males and 7:30 AM to 7:59 AM (579, 19.0%) for females.
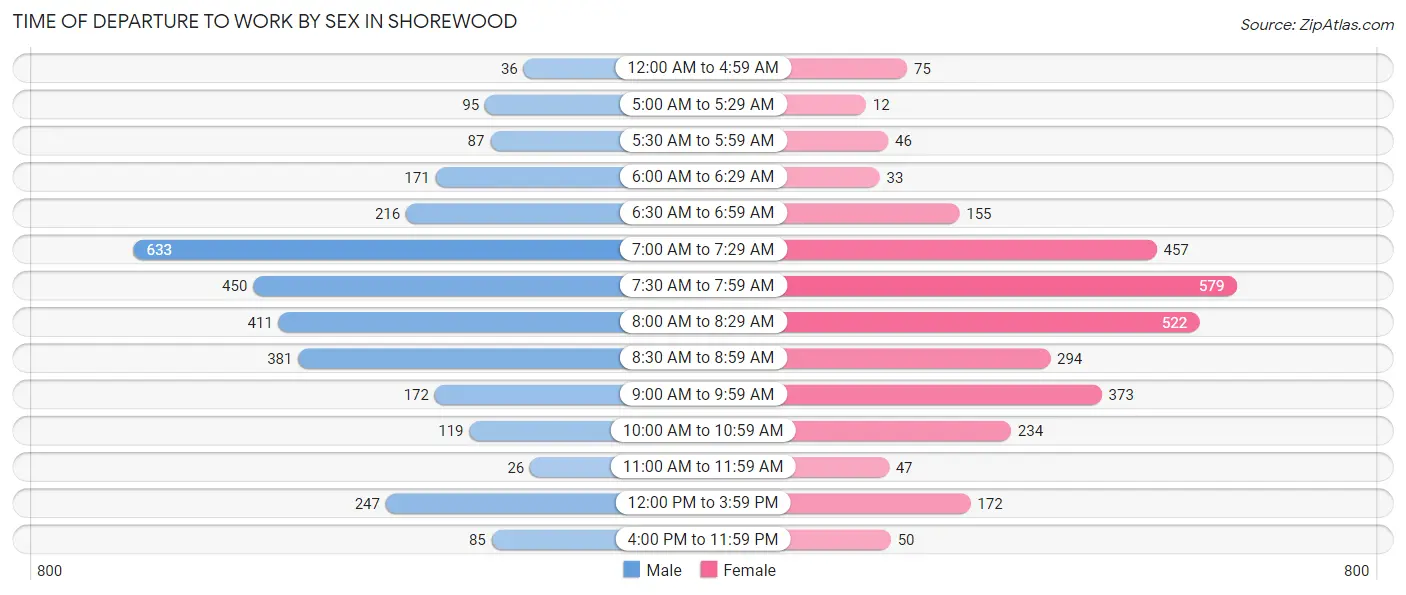
| Time of Departure | Male | Female |
| 12:00 AM to 4:59 AM | 36 (1.1%) | 75 (2.5%) |
| 5:00 AM to 5:29 AM | 95 (3.0%) | 12 (0.4%) |
| 5:30 AM to 5:59 AM | 87 (2.8%) | 46 (1.5%) |
| 6:00 AM to 6:29 AM | 171 (5.5%) | 33 (1.1%) |
| 6:30 AM to 6:59 AM | 216 (6.9%) | 155 (5.1%) |
| 7:00 AM to 7:29 AM | 633 (20.2%) | 457 (15.0%) |
| 7:30 AM to 7:59 AM | 450 (14.4%) | 579 (19.0%) |
| 8:00 AM to 8:29 AM | 411 (13.1%) | 522 (17.1%) |
| 8:30 AM to 8:59 AM | 381 (12.2%) | 294 (9.6%) |
| 9:00 AM to 9:59 AM | 172 (5.5%) | 373 (12.2%) |
| 10:00 AM to 10:59 AM | 119 (3.8%) | 234 (7.7%) |
| 11:00 AM to 11:59 AM | 26 (0.8%) | 47 (1.5%) |
| 12:00 PM to 3:59 PM | 247 (7.9%) | 172 (5.6%) |
| 4:00 PM to 11:59 PM | 85 (2.7%) | 50 (1.6%) |
| Total | 3,129 (100.0%) | 3,049 (100.0%) |
Housing Occupancy in Shorewood
Occupancy by Ownership in Shorewood
Of the total 6,681 dwellings in Shorewood, owner-occupied units account for 3,200 (47.9%), while renter-occupied units make up 3,481 (52.1%).
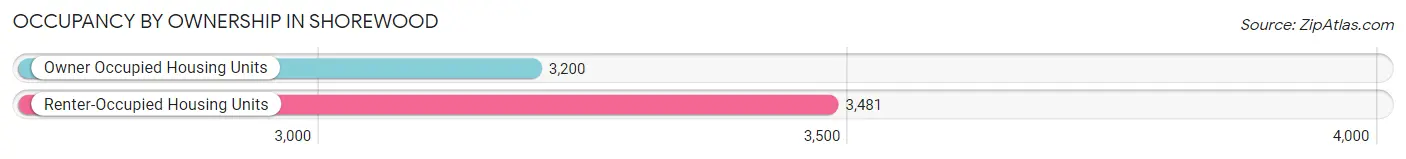
| Occupancy | # Housing Units | % Housing Units |
| Owner Occupied Housing Units | 3,200 | 47.9% |
| Renter-Occupied Housing Units | 3,481 | 52.1% |
| Total Occupied Housing Units | 6,681 | 100.0% |
Occupancy by Household Size in Shorewood
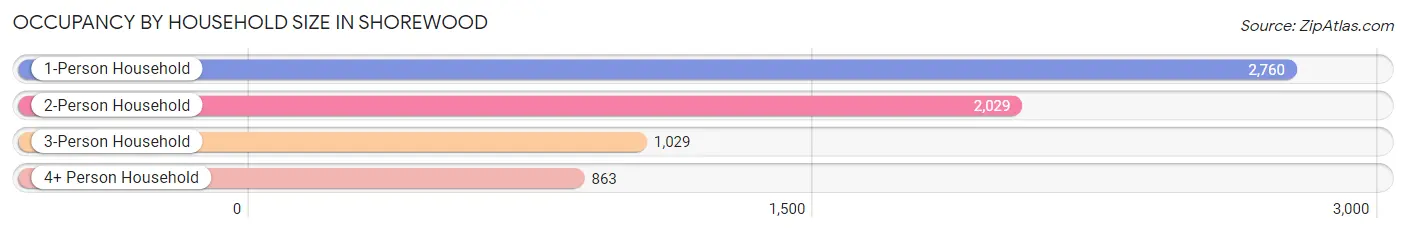
| Household Size | # Housing Units | % Housing Units |
| 1-Person Household | 2,760 | 41.3% |
| 2-Person Household | 2,029 | 30.4% |
| 3-Person Household | 1,029 | 15.4% |
| 4+ Person Household | 863 | 12.9% |
| Total Housing Units | 6,681 | 100.0% |
Occupancy by Ownership by Household Size in Shorewood
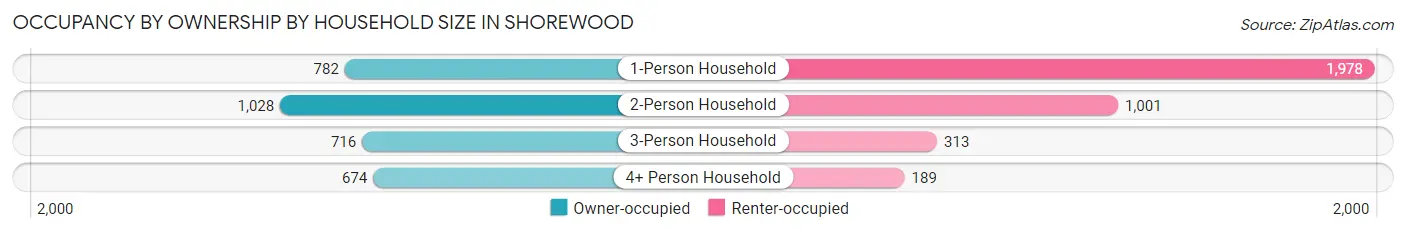
| Household Size | Owner-occupied | Renter-occupied |
| 1-Person Household | 782 (28.3%) | 1,978 (71.7%) |
| 2-Person Household | 1,028 (50.7%) | 1,001 (49.3%) |
| 3-Person Household | 716 (69.6%) | 313 (30.4%) |
| 4+ Person Household | 674 (78.1%) | 189 (21.9%) |
| Total Housing Units | 3,200 (47.9%) | 3,481 (52.1%) |
Occupancy by Educational Attainment in Shorewood
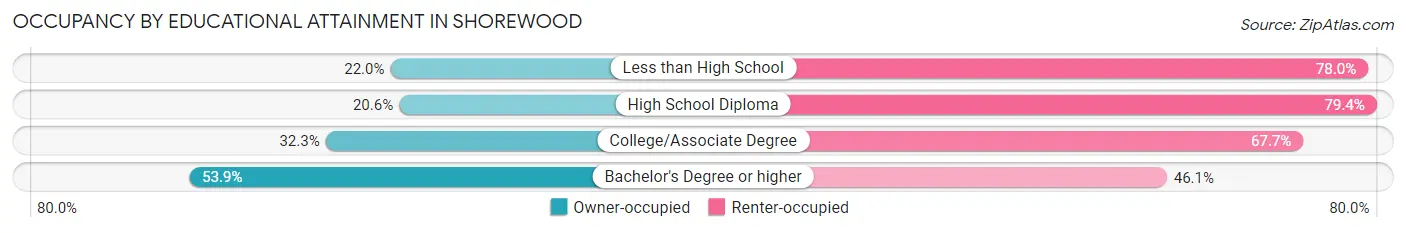
| Household Size | Owner-occupied | Renter-occupied |
| Less than High School | 11 (22.0%) | 39 (78.0%) |
| High School Diploma | 120 (20.6%) | 462 (79.4%) |
| College/Associate Degree | 286 (32.3%) | 600 (67.7%) |
| Bachelor's Degree or higher | 2,783 (53.9%) | 2,380 (46.1%) |
Occupancy by Age of Householder in Shorewood
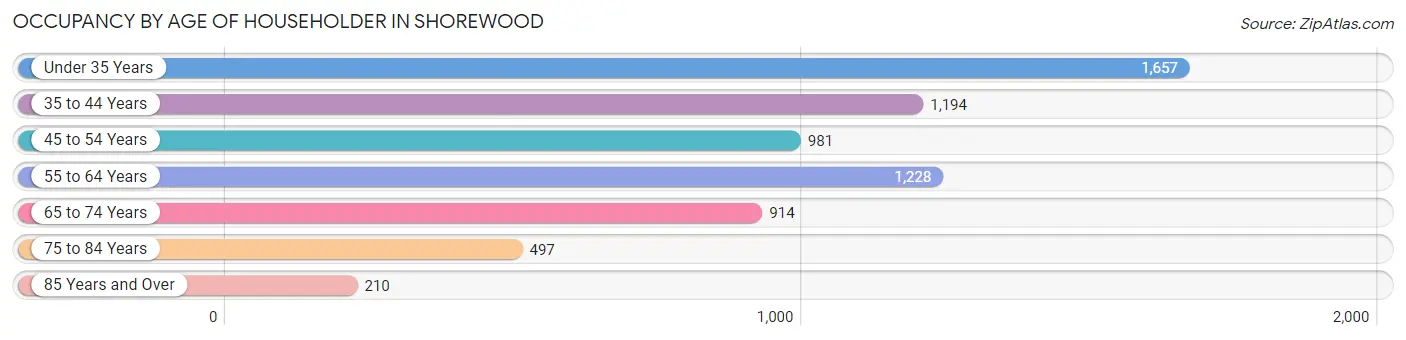
| Age Bracket | # Households | % Households |
| Under 35 Years | 1,657 | 24.8% |
| 35 to 44 Years | 1,194 | 17.9% |
| 45 to 54 Years | 981 | 14.7% |
| 55 to 64 Years | 1,228 | 18.4% |
| 65 to 74 Years | 914 | 13.7% |
| 75 to 84 Years | 497 | 7.4% |
| 85 Years and Over | 210 | 3.1% |
| Total | 6,681 | 100.0% |
Housing Finances in Shorewood
Median Income by Occupancy in Shorewood
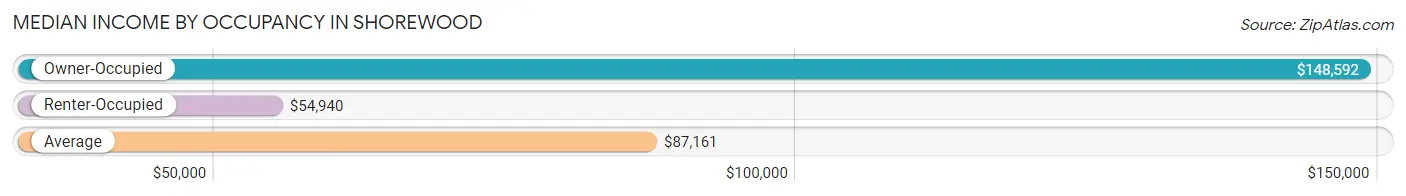
| Occupancy Type | # Households | Median Income |
| Owner-Occupied | 3,200 (47.9%) | $148,592 |
| Renter-Occupied | 3,481 (52.1%) | $54,940 |
| Average | 6,681 (100.0%) | $87,161 |
Occupancy by Householder Income Bracket in Shorewood
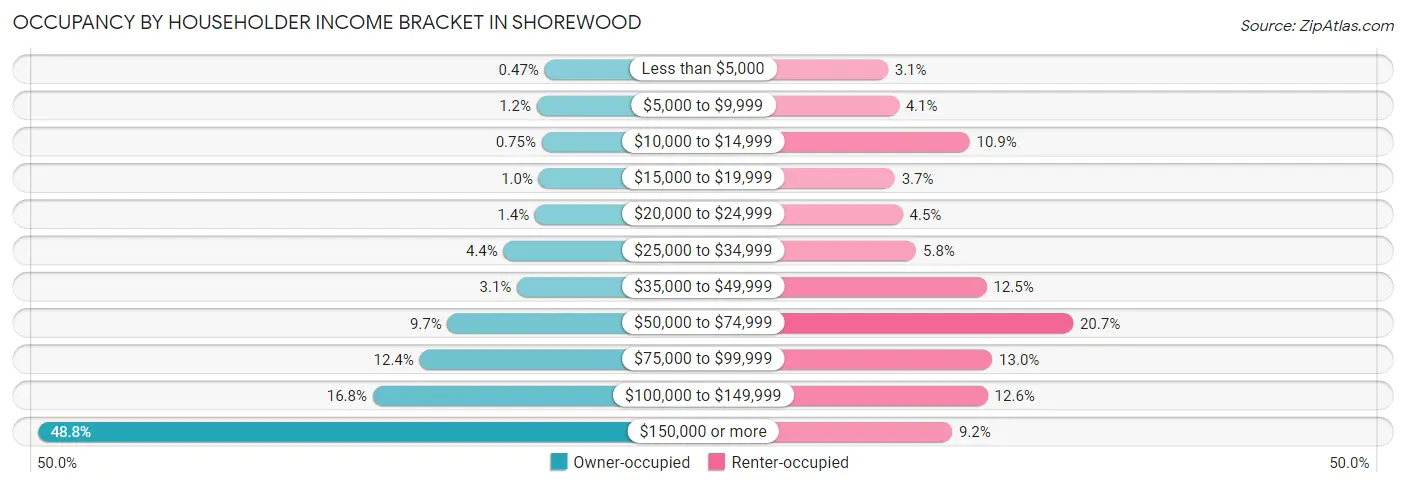
| Income Bracket | Owner-occupied | Renter-occupied |
| Less than $5,000 | 15 (0.5%) | 107 (3.1%) |
| $5,000 to $9,999 | 39 (1.2%) | 143 (4.1%) |
| $10,000 to $14,999 | 24 (0.7%) | 378 (10.9%) |
| $15,000 to $19,999 | 33 (1.0%) | 130 (3.7%) |
| $20,000 to $24,999 | 44 (1.4%) | 156 (4.5%) |
| $25,000 to $34,999 | 140 (4.4%) | 201 (5.8%) |
| $35,000 to $49,999 | 99 (3.1%) | 434 (12.5%) |
| $50,000 to $74,999 | 311 (9.7%) | 721 (20.7%) |
| $75,000 to $99,999 | 396 (12.4%) | 453 (13.0%) |
| $100,000 to $149,999 | 539 (16.8%) | 438 (12.6%) |
| $150,000 or more | 1,560 (48.7%) | 320 (9.2%) |
| Total | 3,200 (100.0%) | 3,481 (100.0%) |
Monthly Housing Cost Tiers in Shorewood
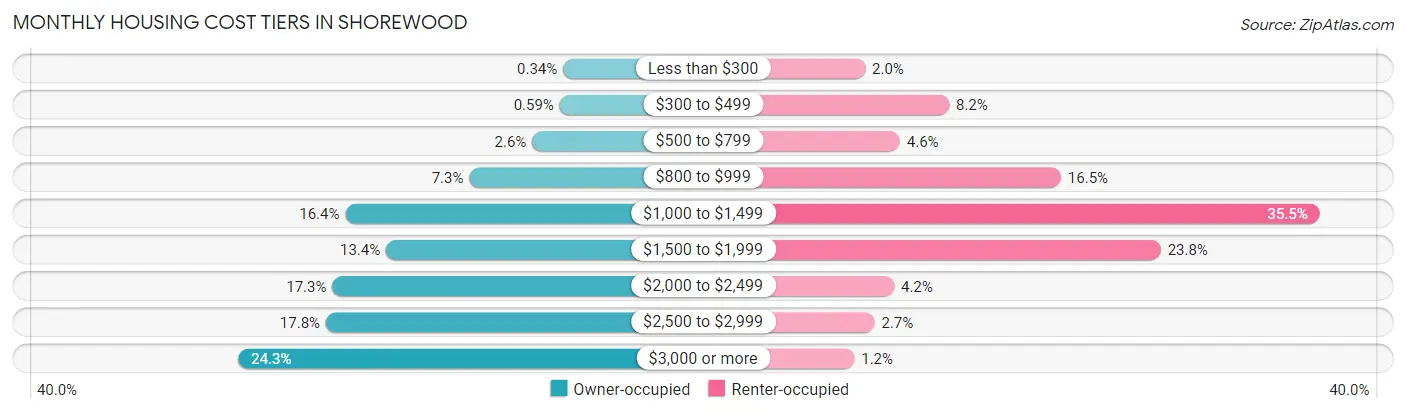
| Monthly Cost | Owner-occupied | Renter-occupied |
| Less than $300 | 11 (0.3%) | 71 (2.0%) |
| $300 to $499 | 19 (0.6%) | 286 (8.2%) |
| $500 to $799 | 84 (2.6%) | 160 (4.6%) |
| $800 to $999 | 232 (7.2%) | 573 (16.5%) |
| $1,000 to $1,499 | 524 (16.4%) | 1,236 (35.5%) |
| $1,500 to $1,999 | 428 (13.4%) | 829 (23.8%) |
| $2,000 to $2,499 | 555 (17.3%) | 145 (4.2%) |
| $2,500 to $2,999 | 570 (17.8%) | 95 (2.7%) |
| $3,000 or more | 777 (24.3%) | 43 (1.2%) |
| Total | 3,200 (100.0%) | 3,481 (100.0%) |
Physical Housing Characteristics in Shorewood
Housing Structures in Shorewood
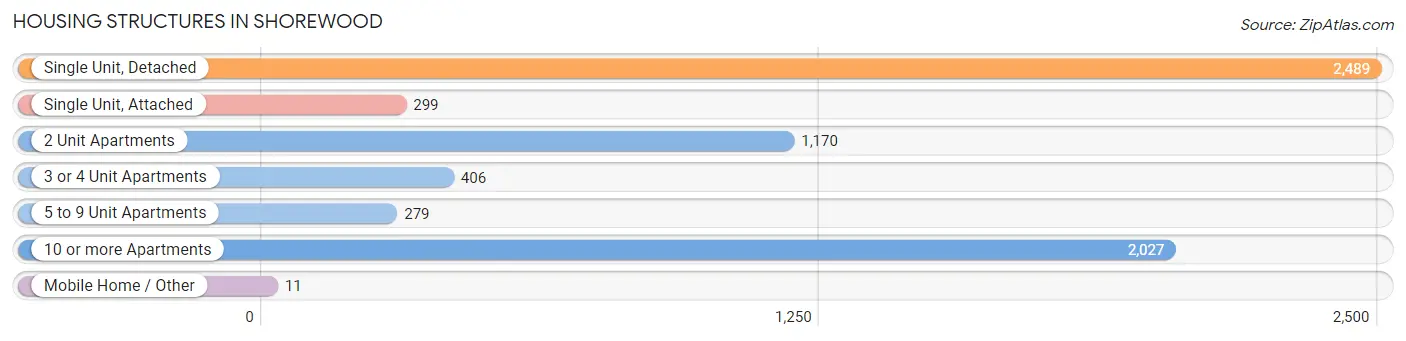
| Structure Type | # Housing Units | % Housing Units |
| Single Unit, Detached | 2,489 | 37.2% |
| Single Unit, Attached | 299 | 4.5% |
| 2 Unit Apartments | 1,170 | 17.5% |
| 3 or 4 Unit Apartments | 406 | 6.1% |
| 5 to 9 Unit Apartments | 279 | 4.2% |
| 10 or more Apartments | 2,027 | 30.3% |
| Mobile Home / Other | 11 | 0.2% |
| Total | 6,681 | 100.0% |
Housing Structures by Occupancy in Shorewood
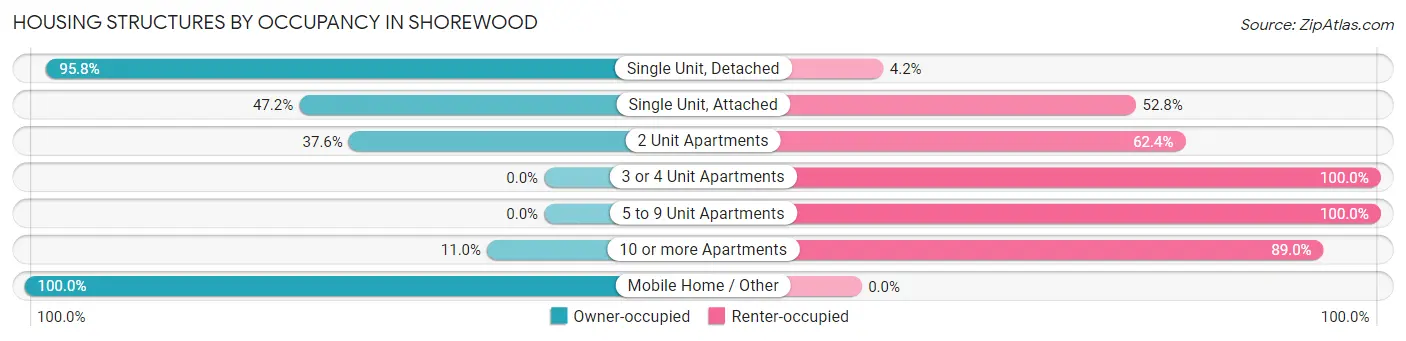
| Structure Type | Owner-occupied | Renter-occupied |
| Single Unit, Detached | 2,385 (95.8%) | 104 (4.2%) |
| Single Unit, Attached | 141 (47.2%) | 158 (52.8%) |
| 2 Unit Apartments | 440 (37.6%) | 730 (62.4%) |
| 3 or 4 Unit Apartments | 0 (0.0%) | 406 (100.0%) |
| 5 to 9 Unit Apartments | 0 (0.0%) | 279 (100.0%) |
| 10 or more Apartments | 223 (11.0%) | 1,804 (89.0%) |
| Mobile Home / Other | 11 (100.0%) | 0 (0.0%) |
| Total | 3,200 (47.9%) | 3,481 (52.1%) |
Housing Structures by Number of Rooms in Shorewood
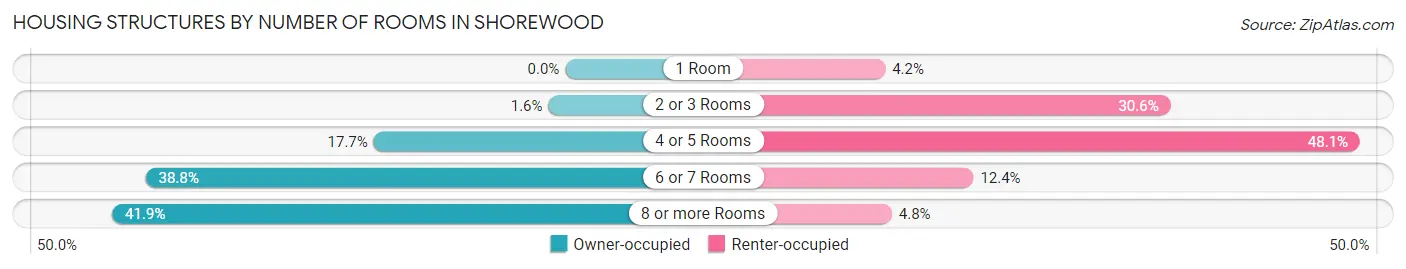
| Number of Rooms | Owner-occupied | Renter-occupied |
| 1 Room | 0 (0.0%) | 146 (4.2%) |
| 2 or 3 Rooms | 50 (1.6%) | 1,064 (30.6%) |
| 4 or 5 Rooms | 567 (17.7%) | 1,674 (48.1%) |
| 6 or 7 Rooms | 1,242 (38.8%) | 430 (12.3%) |
| 8 or more Rooms | 1,341 (41.9%) | 167 (4.8%) |
| Total | 3,200 (100.0%) | 3,481 (100.0%) |
Housing Structure by Heating Type in Shorewood
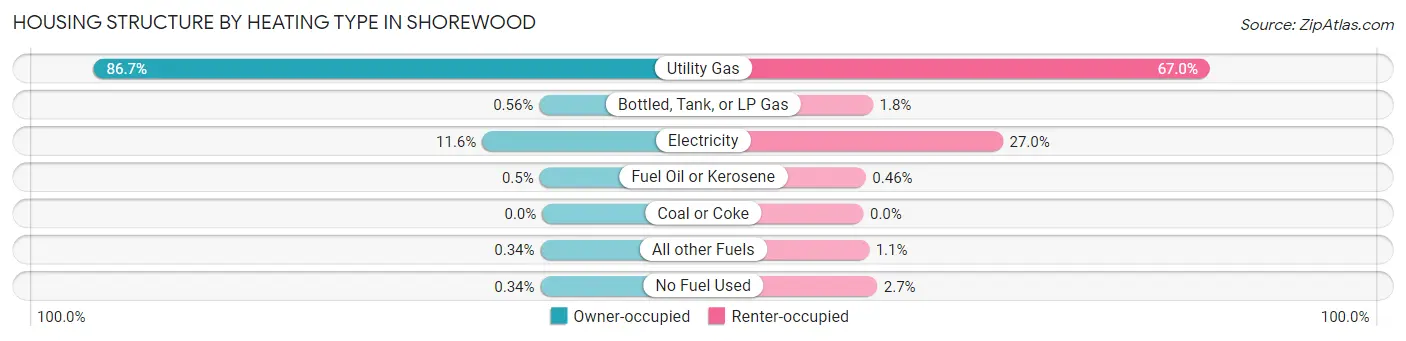
| Heating Type | Owner-occupied | Renter-occupied |
| Utility Gas | 2,773 (86.7%) | 2,332 (67.0%) |
| Bottled, Tank, or LP Gas | 18 (0.6%) | 64 (1.8%) |
| Electricity | 371 (11.6%) | 938 (27.0%) |
| Fuel Oil or Kerosene | 16 (0.5%) | 16 (0.5%) |
| Coal or Coke | 0 (0.0%) | 0 (0.0%) |
| All other Fuels | 11 (0.3%) | 38 (1.1%) |
| No Fuel Used | 11 (0.3%) | 93 (2.7%) |
| Total | 3,200 (100.0%) | 3,481 (100.0%) |
Household Vehicle Usage in Shorewood
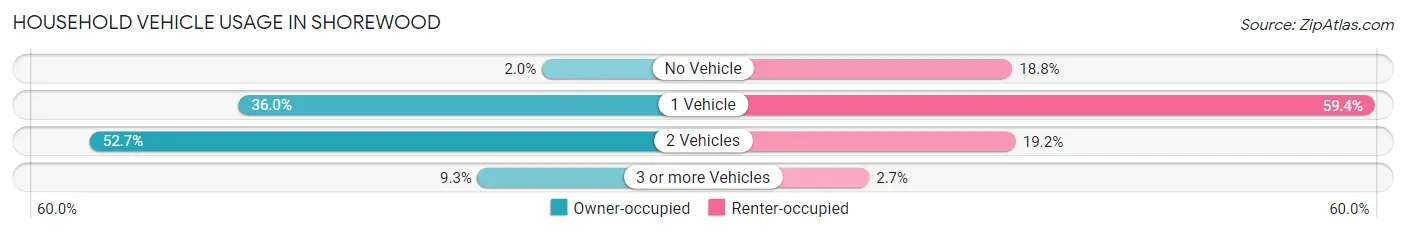
| Vehicles per Household | Owner-occupied | Renter-occupied |
| No Vehicle | 65 (2.0%) | 653 (18.8%) |
| 1 Vehicle | 1,153 (36.0%) | 2,066 (59.4%) |
| 2 Vehicles | 1,686 (52.7%) | 667 (19.2%) |
| 3 or more Vehicles | 296 (9.2%) | 95 (2.7%) |
| Total | 3,200 (100.0%) | 3,481 (100.0%) |
Real Estate & Mortgages in Shorewood
Real Estate and Mortgage Overview in Shorewood
| Characteristic | Without Mortgage | With Mortgage |
| Housing Units | 980 | 2,220 |
| Median Property Value | $376,600 | $396,700 |
| Median Household Income | $89,250 | $1,215 |
| Monthly Housing Costs | $1,142 | $748 |
| Real Estate Taxes | $9,237 | $0 |
Property Value by Mortgage Status in Shorewood
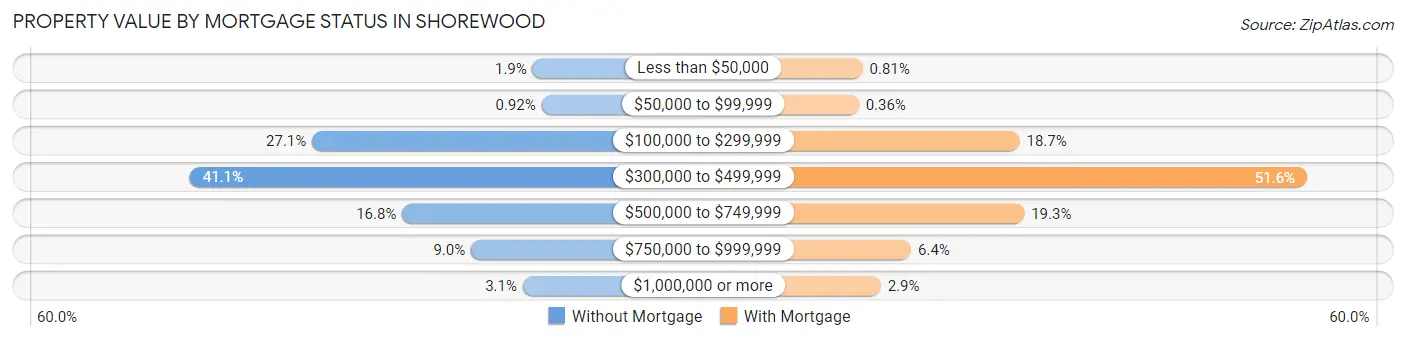
| Property Value | Without Mortgage | With Mortgage |
| Less than $50,000 | 19 (1.9%) | 18 (0.8%) |
| $50,000 to $99,999 | 9 (0.9%) | 8 (0.4%) |
| $100,000 to $299,999 | 266 (27.1%) | 416 (18.7%) |
| $300,000 to $499,999 | 403 (41.1%) | 1,145 (51.6%) |
| $500,000 to $749,999 | 165 (16.8%) | 428 (19.3%) |
| $750,000 to $999,999 | 88 (9.0%) | 141 (6.4%) |
| $1,000,000 or more | 30 (3.1%) | 64 (2.9%) |
| Total | 980 (100.0%) | 2,220 (100.0%) |
Household Income by Mortgage Status in Shorewood
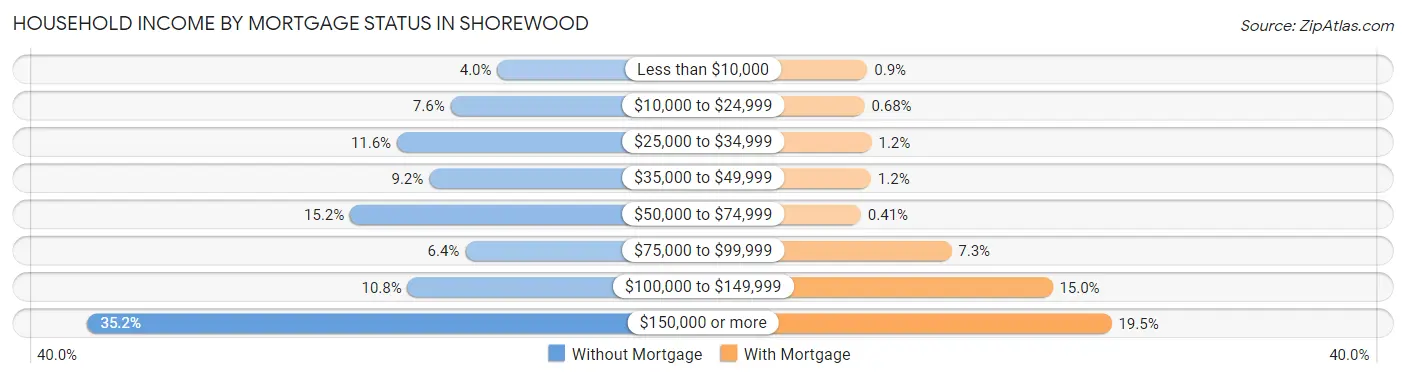
| Household Income | Without Mortgage | With Mortgage |
| Less than $10,000 | 39 (4.0%) | 20 (0.9%) |
| $10,000 to $24,999 | 74 (7.5%) | 15 (0.7%) |
| $25,000 to $34,999 | 114 (11.6%) | 27 (1.2%) |
| $35,000 to $49,999 | 90 (9.2%) | 26 (1.2%) |
| $50,000 to $74,999 | 149 (15.2%) | 9 (0.4%) |
| $75,000 to $99,999 | 63 (6.4%) | 162 (7.3%) |
| $100,000 to $149,999 | 106 (10.8%) | 333 (15.0%) |
| $150,000 or more | 345 (35.2%) | 433 (19.5%) |
| Total | 980 (100.0%) | 2,220 (100.0%) |
Property Value to Household Income Ratio in Shorewood
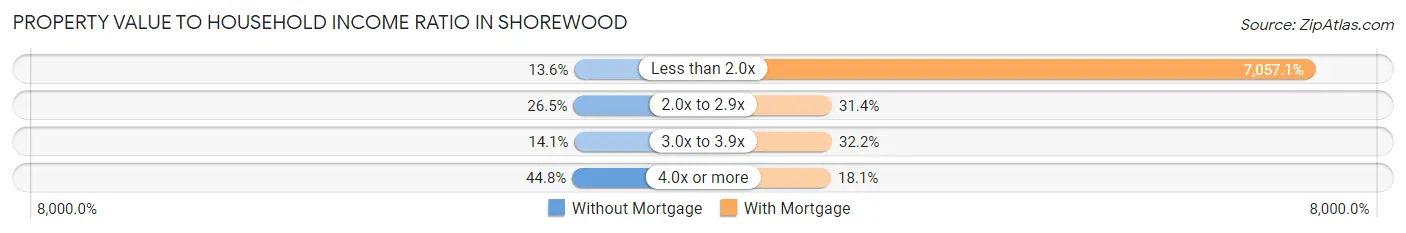
| Value-to-Income Ratio | Without Mortgage | With Mortgage |
| Less than 2.0x | 133 (13.6%) | 156,667 (7,057.1%) |
| 2.0x to 2.9x | 260 (26.5%) | 696 (31.4%) |
| 3.0x to 3.9x | 138 (14.1%) | 714 (32.2%) |
| 4.0x or more | 439 (44.8%) | 402 (18.1%) |
| Total | 980 (100.0%) | 2,220 (100.0%) |
Real Estate Taxes by Mortgage Status in Shorewood
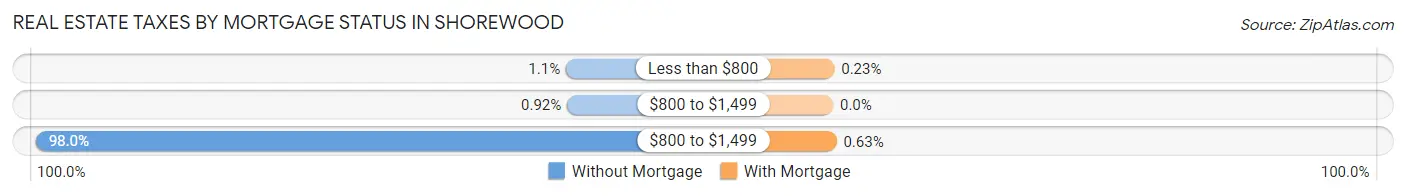
| Property Taxes | Without Mortgage | With Mortgage |
| Less than $800 | 11 (1.1%) | 5 (0.2%) |
| $800 to $1,499 | 9 (0.9%) | 0 (0.0%) |
| $800 to $1,499 | 960 (98.0%) | 14 (0.6%) |
| Total | 980 (100.0%) | 2,220 (100.0%) |
Health & Disability in Shorewood
Health Insurance Coverage by Age in Shorewood
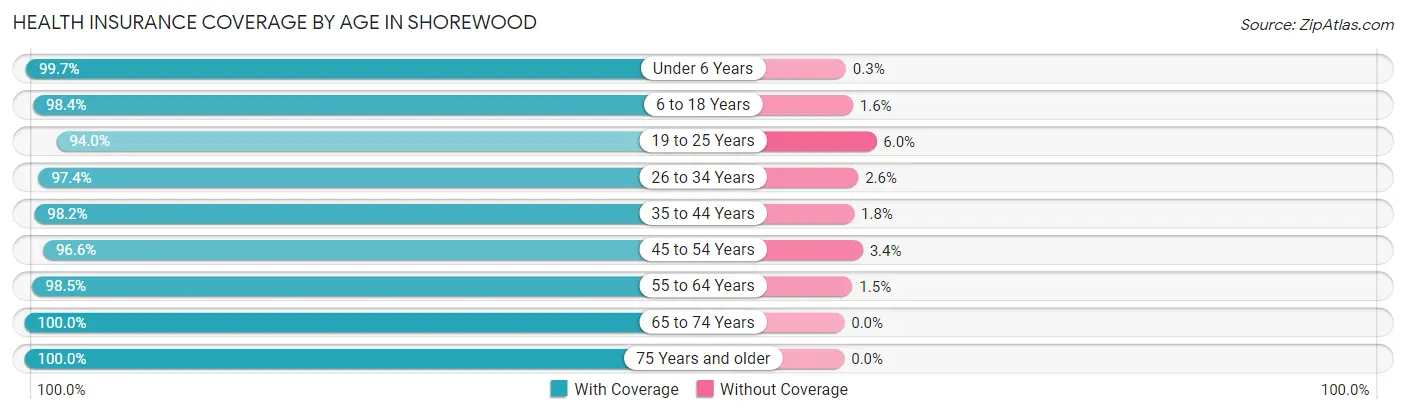
| Age Bracket | With Coverage | Without Coverage |
| Under 6 Years | 1,010 (99.7%) | 3 (0.3%) |
| 6 to 18 Years | 1,799 (98.4%) | 29 (1.6%) |
| 19 to 25 Years | 1,056 (94.0%) | 67 (6.0%) |
| 26 to 34 Years | 2,071 (97.4%) | 55 (2.6%) |
| 35 to 44 Years | 1,931 (98.2%) | 36 (1.8%) |
| 45 to 54 Years | 1,577 (96.6%) | 56 (3.4%) |
| 55 to 64 Years | 1,827 (98.5%) | 28 (1.5%) |
| 65 to 74 Years | 1,243 (100.0%) | 0 (0.0%) |
| 75 Years and older | 911 (100.0%) | 0 (0.0%) |
| Total | 13,425 (98.0%) | 274 (2.0%) |
Health Insurance Coverage by Citizenship Status in Shorewood
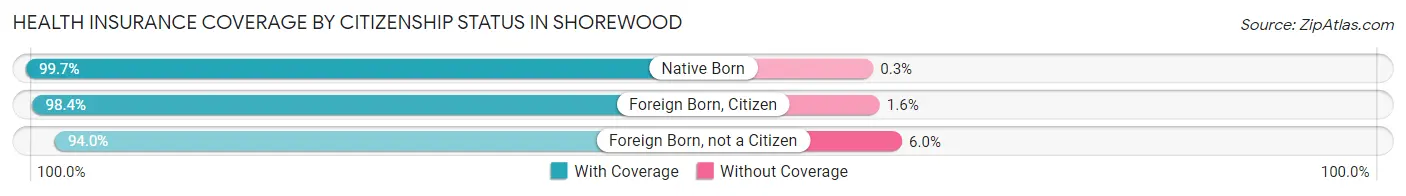
| Citizenship Status | With Coverage | Without Coverage |
| Native Born | 1,010 (99.7%) | 3 (0.3%) |
| Foreign Born, Citizen | 1,799 (98.4%) | 29 (1.6%) |
| Foreign Born, not a Citizen | 1,056 (94.0%) | 67 (6.0%) |
Health Insurance Coverage by Household Income in Shorewood
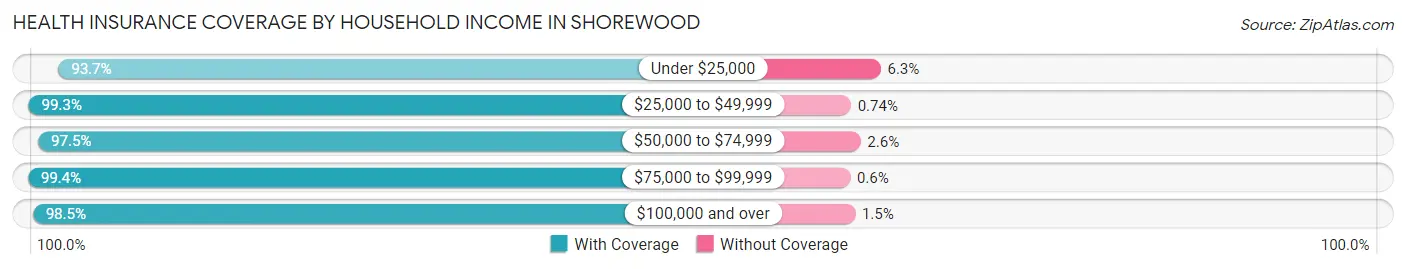
| Household Income | With Coverage | Without Coverage |
| Under $25,000 | 1,438 (93.7%) | 97 (6.3%) |
| $25,000 to $49,999 | 1,209 (99.3%) | 9 (0.7%) |
| $50,000 to $74,999 | 1,490 (97.5%) | 39 (2.5%) |
| $75,000 to $99,999 | 1,654 (99.4%) | 10 (0.6%) |
| $100,000 and over | 7,634 (98.5%) | 119 (1.5%) |
Public vs Private Health Insurance Coverage by Age in Shorewood
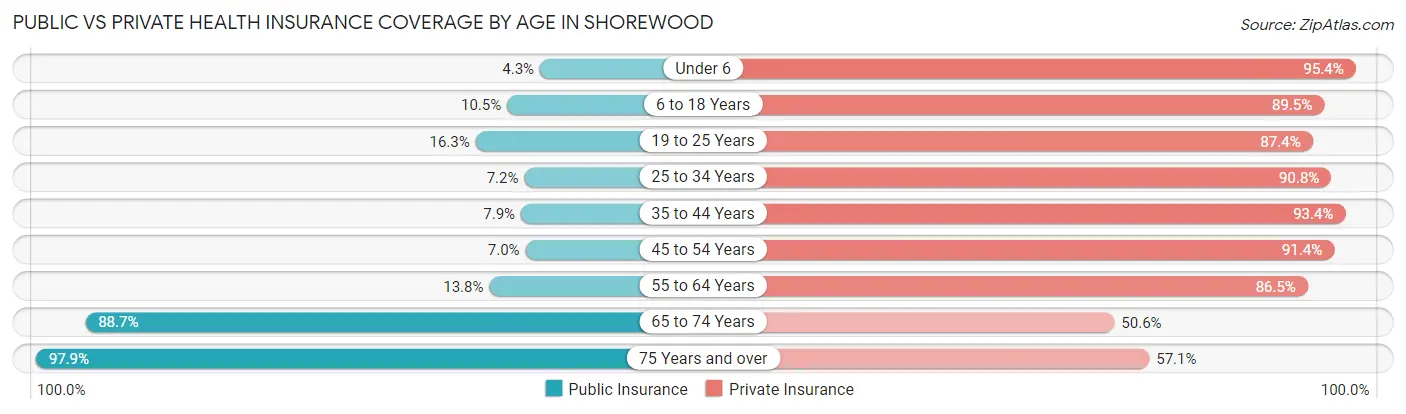
| Age Bracket | Public Insurance | Private Insurance |
| Under 6 | 44 (4.3%) | 966 (95.4%) |
| 6 to 18 Years | 191 (10.4%) | 1,636 (89.5%) |
| 19 to 25 Years | 183 (16.3%) | 981 (87.4%) |
| 25 to 34 Years | 154 (7.2%) | 1,931 (90.8%) |
| 35 to 44 Years | 155 (7.9%) | 1,838 (93.4%) |
| 45 to 54 Years | 115 (7.0%) | 1,492 (91.4%) |
| 55 to 64 Years | 255 (13.8%) | 1,604 (86.5%) |
| 65 to 74 Years | 1,103 (88.7%) | 629 (50.6%) |
| 75 Years and over | 892 (97.9%) | 520 (57.1%) |
| Total | 3,092 (22.6%) | 11,597 (84.7%) |
Disability Status by Sex by Age in Shorewood
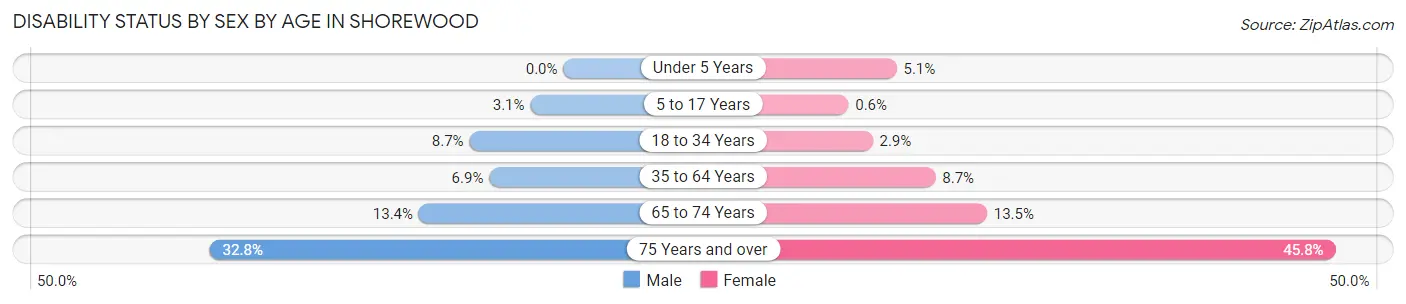
| Age Bracket | Male | Female |
| Under 5 Years | 0 (0.0%) | 20 (5.1%) |
| 5 to 17 Years | 28 (3.1%) | 6 (0.6%) |
| 18 to 34 Years | 140 (8.7%) | 49 (2.9%) |
| 35 to 64 Years | 186 (6.9%) | 239 (8.7%) |
| 65 to 74 Years | 74 (13.4%) | 93 (13.5%) |
| 75 Years and over | 107 (32.8%) | 268 (45.8%) |
Disability Class by Sex by Age in Shorewood
Disability Class: Hearing Difficulty
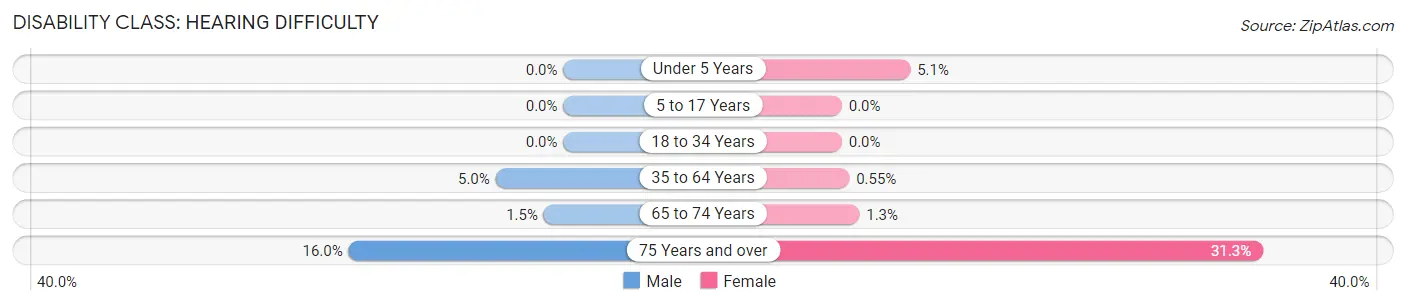
| Age Bracket | Male | Female |
| Under 5 Years | 0 (0.0%) | 20 (5.1%) |
| 5 to 17 Years | 0 (0.0%) | 0 (0.0%) |
| 18 to 34 Years | 0 (0.0%) | 0 (0.0%) |
| 35 to 64 Years | 136 (5.0%) | 15 (0.5%) |
| 65 to 74 Years | 8 (1.5%) | 9 (1.3%) |
| 75 Years and over | 52 (16.0%) | 183 (31.3%) |
Disability Class: Vision Difficulty
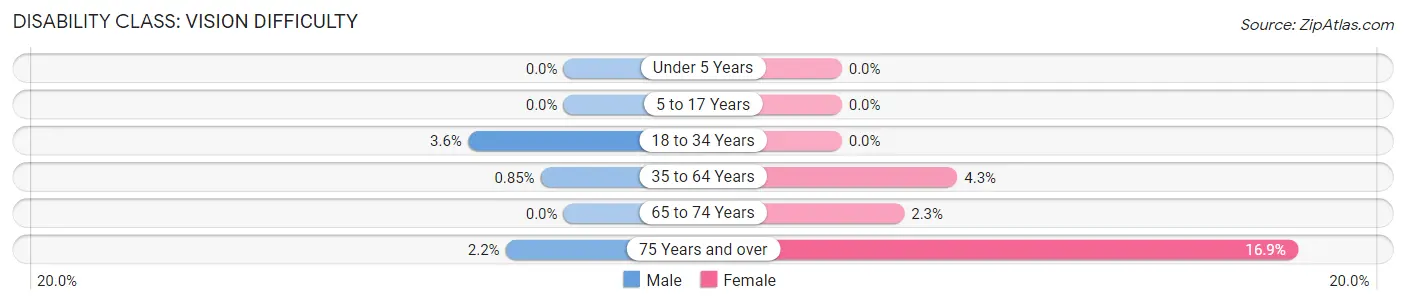
| Age Bracket | Male | Female |
| Under 5 Years | 0 (0.0%) | 0 (0.0%) |
| 5 to 17 Years | 0 (0.0%) | 0 (0.0%) |
| 18 to 34 Years | 57 (3.5%) | 0 (0.0%) |
| 35 to 64 Years | 23 (0.9%) | 118 (4.3%) |
| 65 to 74 Years | 0 (0.0%) | 16 (2.3%) |
| 75 Years and over | 7 (2.1%) | 99 (16.9%) |
Disability Class: Cognitive Difficulty
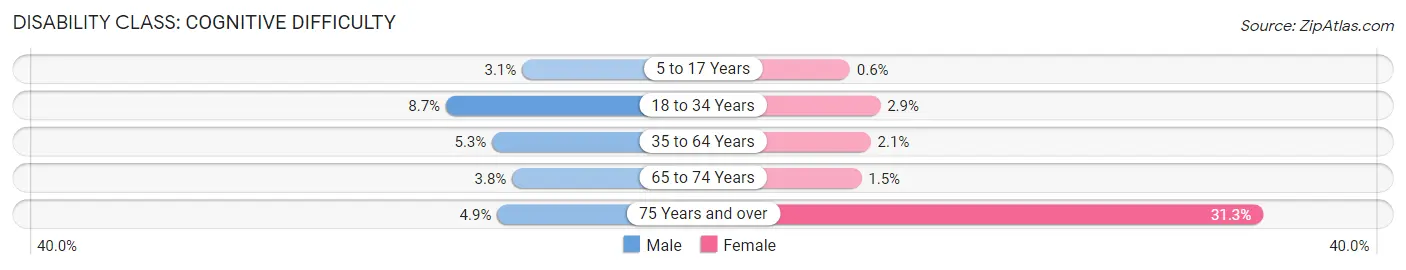
| Age Bracket | Male | Female |
| 5 to 17 Years | 28 (3.1%) | 6 (0.6%) |
| 18 to 34 Years | 140 (8.7%) | 49 (2.9%) |
| 35 to 64 Years | 143 (5.3%) | 59 (2.1%) |
| 65 to 74 Years | 21 (3.8%) | 10 (1.5%) |
| 75 Years and over | 16 (4.9%) | 183 (31.3%) |
Disability Class: Ambulatory Difficulty
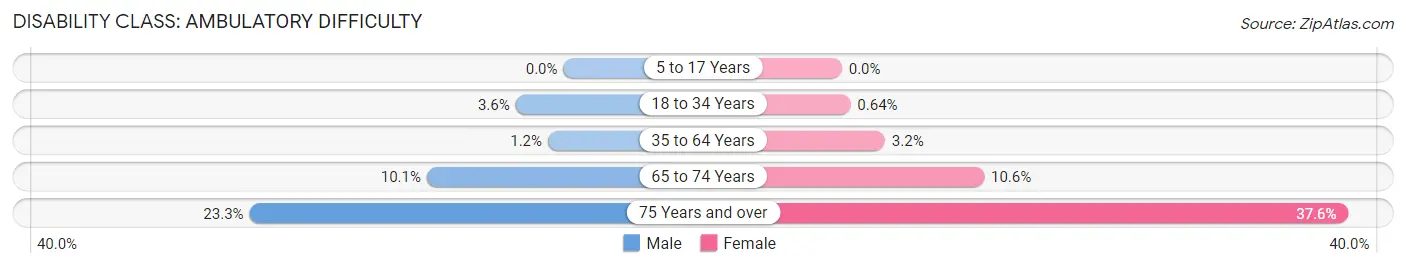
| Age Bracket | Male | Female |
| 5 to 17 Years | 0 (0.0%) | 0 (0.0%) |
| 18 to 34 Years | 57 (3.5%) | 11 (0.6%) |
| 35 to 64 Years | 31 (1.1%) | 88 (3.2%) |
| 65 to 74 Years | 56 (10.1%) | 73 (10.6%) |
| 75 Years and over | 76 (23.3%) | 220 (37.6%) |
Disability Class: Self-Care Difficulty
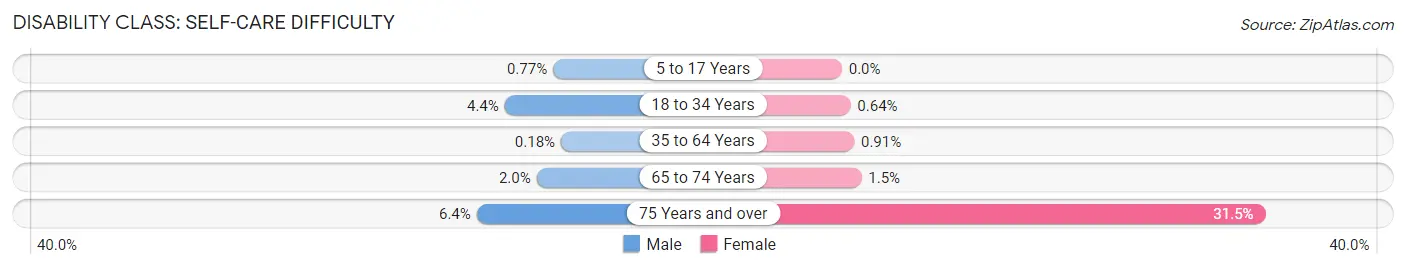
| Age Bracket | Male | Female |
| 5 to 17 Years | 7 (0.8%) | 0 (0.0%) |
| 18 to 34 Years | 70 (4.4%) | 11 (0.6%) |
| 35 to 64 Years | 5 (0.2%) | 25 (0.9%) |
| 65 to 74 Years | 11 (2.0%) | 10 (1.5%) |
| 75 Years and over | 21 (6.4%) | 184 (31.5%) |
Technology Access in Shorewood
Computing Device Access in Shorewood
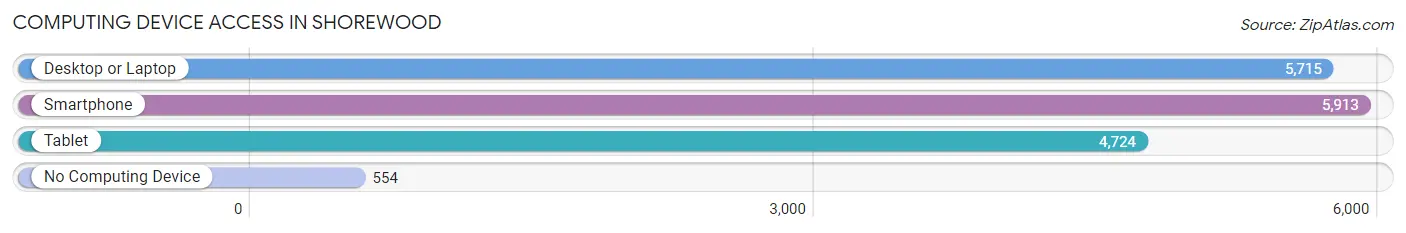
| Device Type | # Households | % Households |
| Desktop or Laptop | 5,715 | 85.5% |
| Smartphone | 5,913 | 88.5% |
| Tablet | 4,724 | 70.7% |
| No Computing Device | 554 | 8.3% |
| Total | 6,681 | 100.0% |
Internet Access in Shorewood
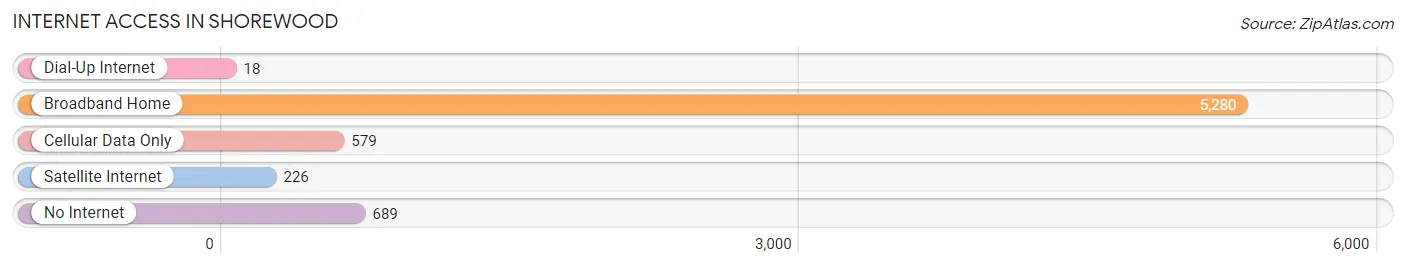
| Internet Type | # Households | % Households |
| Dial-Up Internet | 18 | 0.3% |
| Broadband Home | 5,280 | 79.0% |
| Cellular Data Only | 579 | 8.7% |
| Satellite Internet | 226 | 3.4% |
| No Internet | 689 | 10.3% |
| Total | 6,681 | 100.0% |
Shorewood Summary
Shorewood is a village located in Milwaukee County, Wisconsin, United States. It is located on the western shore of Lake Michigan, just north of Milwaukee. The population was 13,162 at the 2010 census.
History
Shorewood was first settled in 1835 by a group of German immigrants. The village was originally known as East Milwaukee, and was later renamed Shorewood in 1895. The name was chosen to reflect the village's location on the shore of Lake Michigan.
In the early 1900s, Shorewood was a popular summer resort destination for wealthy Milwaukeeans. The village was home to several grand hotels, including the Shorewood Hotel, which was built in 1906 and demolished in the 1950s.
In the 1920s, Shorewood began to experience a period of rapid growth. The village was annexed by the City of Milwaukee in 1929, and the population increased from 1,500 to over 10,000 by the 1950s.
Geography
Shorewood is located at 43°04′N 87°54′W (43.07, -87.90). According to the United States Census Bureau, the village has a total area of 2.2 square miles (5.7 km2), all of it land.
Economy
Shorewood is home to a variety of businesses, including retail stores, restaurants, and professional services. The village is also home to several corporate headquarters, including Johnson Controls, Inc., and Northwestern Mutual.
Demographics
As of the census of 2010, there were 13,162 people, 5,945 households, and 3,092 families residing in the village. The population density was 5,945.7 people per square mile (2,297.2/km2). There were 6,521 housing units at an average density of 2,945.7 per square mile (1,137.2/km2). The racial makeup of the village was 87.2% White, 4.2% African American, 0.3% Native American, 4.7% Asian, 0.1% Pacific Islander, 1.7% from other races, and 2.0% from two or more races. Hispanic or Latino of any race were 5.3% of the population.
There were 5,945 households, out of which 24.2% had children under the age of 18 living with them, 43.2% were married couples living together, 9.7% had a female householder with no husband present, and 43.7% were non-families. 35.2% of all households were made up of individuals, and 11.2% had someone living alone who was 65 years of age or older. The average household size was 2.19 and the average family size was 2.88.
In the village, the population was spread out, with 20.2% under the age of 18, 8.2% from 18 to 24, 28.2% from 25 to 44, 27.2% from 45 to 64, and 16.2% who were 65 years of age or older. The median age was 40 years. For every 100 females, there were 91.2 males. For every 100 females age 18 and over, there were 88.2 males.
The median income for a household in the village was $50,945, and the median income for a family was $68,945. Males had a median income of $45,945 versus $35,945 for females. The per capita income for the village was $30,945. About 4.2% of families and 6.2% of the population were below the poverty line, including 8.2% of those under age 18 and 4.2% of those age 65 or over.
Common Questions
What is the Total Population of Shorewood?
Total Population of Shorewood is 13,707.
What is the Total Male Population of Shorewood?
Total Male Population of Shorewood is 6,557.
What is the Total Female Population of Shorewood?
Total Female Population of Shorewood is 7,150.
What is the Ratio of Males per 100 Females in Shorewood?
There are 91.71 Males per 100 Females in Shorewood.
What is the Ratio of Females per 100 Males in Shorewood?
There are 109.04 Females per 100 Males in Shorewood.
What is the Median Population Age in Shorewood?
Median Population Age in Shorewood is 38.6 Years.
What is the Average Family Size in Shorewood
Average Family Size in Shorewood is 2.8 People.
What is the Average Household Size in Shorewood
Average Household Size in Shorewood is 2.0 People.
What is Per Capita Income in Shorewood?
Per Capita income in Shorewood is $62,155.
What is the Median Family Income in Shorewood?
Median Family Income in Shorewood is $143,583.
What is the Median Household income in Shorewood?
Median Household Income in Shorewood is $87,161.
What is Income or Wage Gap in Shorewood?
Income or Wage Gap in Shorewood is 20.8%.
Women in Shorewood earn 79.2 cents for every dollar earned by a man.
What is Inequality or Gini Index in Shorewood?
Inequality or Gini Index in Shorewood is 0.51.
How Large is the Labor Force in Shorewood?
There are 8,011 People in the Labor Forcein in Shorewood.
What is the Percentage of People in the Labor Force in Shorewood?
71.7% of People are in the Labor Force in Shorewood.
What is the Unemployment Rate in Shorewood?
Unemployment Rate in Shorewood is 3.8%.