Sheboygan Falls, WI
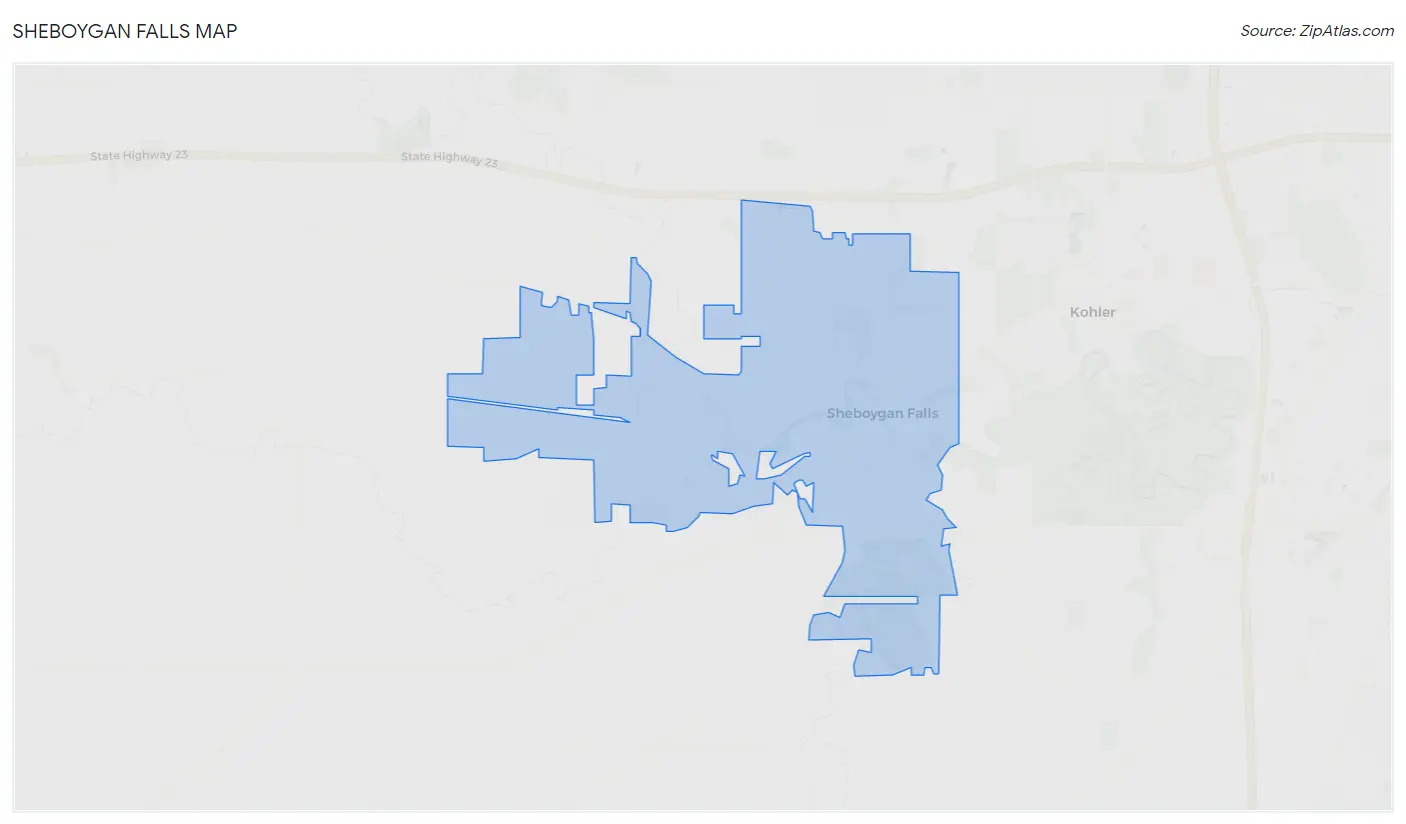
Sheboygan Falls Map
Sheboygan Falls Overview
8,163
TOTAL POPULATION
3,776
MALE POPULATION
4,387
FEMALE POPULATION
86.07
MALES / 100 FEMALES
116.18
FEMALES / 100 MALES
42.4
MEDIAN AGE
2.7
AVG FAMILY SIZE
2.2
AVG HOUSEHOLD SIZE
$37,591
PER CAPITA INCOME
$79,688
AVG FAMILY INCOME
$66,416
AVG HOUSEHOLD INCOME
22.3%
WAGE / INCOME GAP [ % ]
77.7¢/ $1
WAGE / INCOME GAP [ $ ]
0.39
INEQUALITY / GINI INDEX
4,551
LABOR FORCE [ PEOPLE ]
68.7%
PERCENT IN LABOR FORCE
1.4%
UNEMPLOYMENT RATE
Sheboygan Falls Zip Codes
Sheboygan Falls Area Codes
Race in Sheboygan Falls
The most populous races in Sheboygan Falls are White / Caucasian (7,557 | 92.6%), Hispanic or Latino (446 | 5.5%), and Asian (261 | 3.2%).
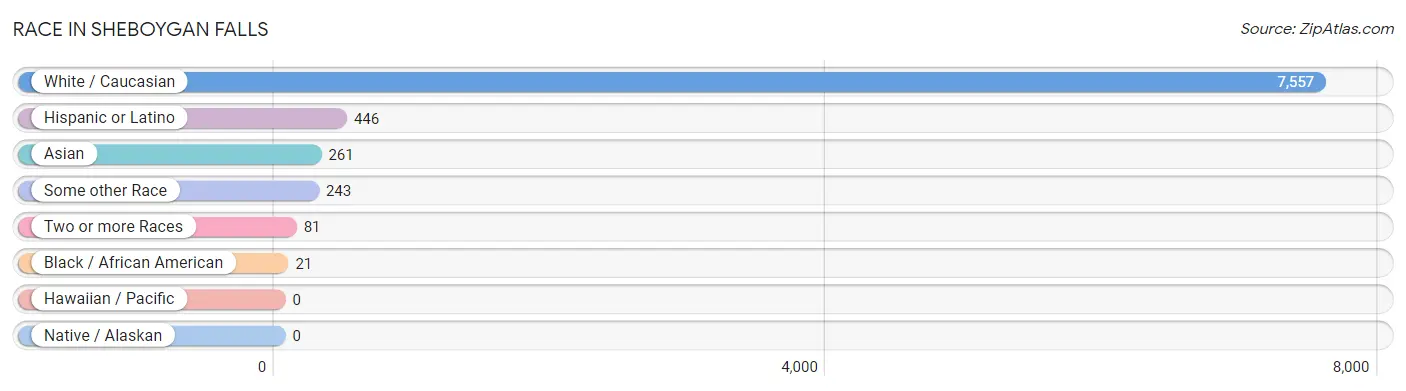
| Race | # Population | % Population |
| Asian | 261 | 3.2% |
| Black / African American | 21 | 0.3% |
| Hawaiian / Pacific | 0 | 0.0% |
| Hispanic or Latino | 446 | 5.5% |
| Native / Alaskan | 0 | 0.0% |
| White / Caucasian | 7,557 | 92.6% |
| Two or more Races | 81 | 1.0% |
| Some other Race | 243 | 3.0% |
| Total | 8,163 | 100.0% |
Ancestry in Sheboygan Falls
The most populous ancestries reported in Sheboygan Falls are German (4,566 | 55.9%), Irish (539 | 6.6%), Polish (493 | 6.0%), Mexican (398 | 4.9%), and English (373 | 4.6%), together accounting for 78.0% of all Sheboygan Falls residents.
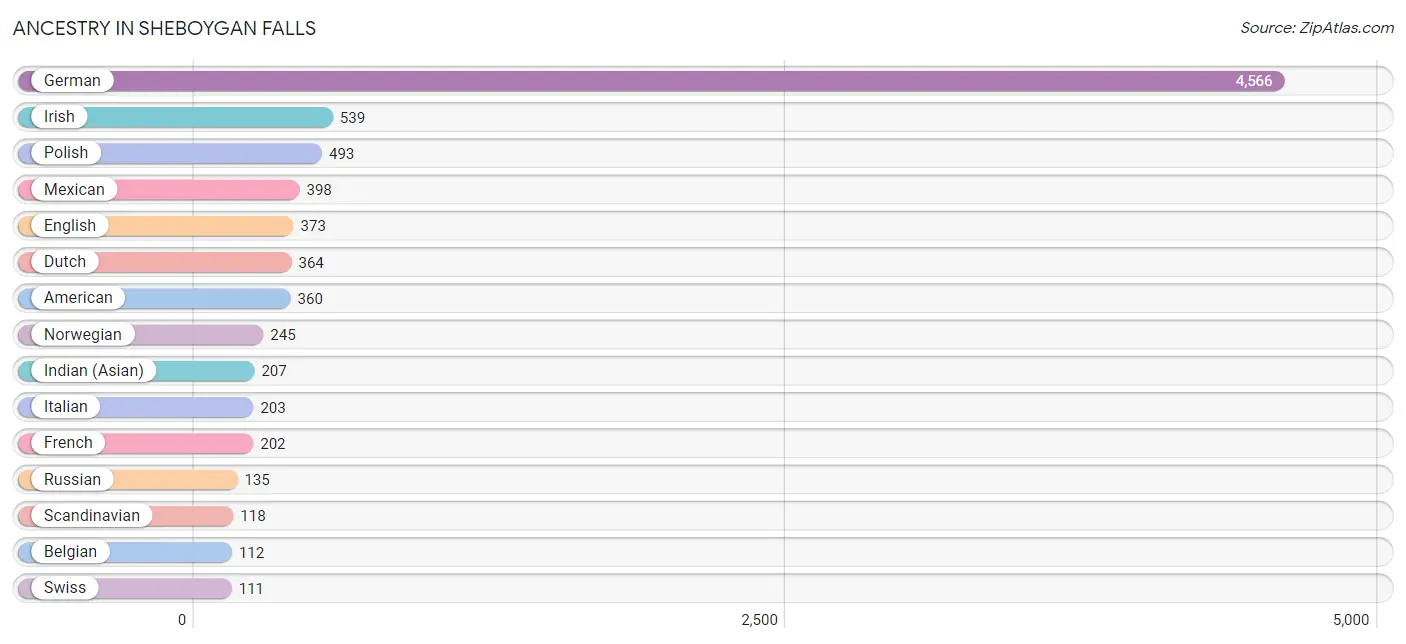
| Ancestry | # Population | % Population |
| American | 360 | 4.4% |
| Arab | 11 | 0.1% |
| Austrian | 58 | 0.7% |
| Belgian | 112 | 1.4% |
| Canadian | 7 | 0.1% |
| Cherokee | 3 | 0.0% |
| Croatian | 20 | 0.3% |
| Czech | 65 | 0.8% |
| Danish | 32 | 0.4% |
| Dutch | 364 | 4.5% |
| Eastern European | 24 | 0.3% |
| English | 373 | 4.6% |
| European | 48 | 0.6% |
| Finnish | 107 | 1.3% |
| French | 202 | 2.5% |
| French American Indian | 7 | 0.1% |
| French Canadian | 55 | 0.7% |
| German | 4,566 | 55.9% |
| Greek | 71 | 0.9% |
| Hungarian | 49 | 0.6% |
| Indian (Asian) | 207 | 2.5% |
| Irish | 539 | 6.6% |
| Italian | 203 | 2.5% |
| Lithuanian | 42 | 0.5% |
| Luxembourger | 27 | 0.3% |
| Mexican | 398 | 4.9% |
| Norwegian | 245 | 3.0% |
| Pakistani | 12 | 0.2% |
| Polish | 493 | 6.0% |
| Russian | 135 | 1.7% |
| Scandinavian | 118 | 1.5% |
| Scotch-Irish | 8 | 0.1% |
| Scottish | 81 | 1.0% |
| Serbian | 2 | 0.0% |
| Slovak | 28 | 0.3% |
| Slovene | 19 | 0.2% |
| Subsaharan African | 15 | 0.2% |
| Swedish | 55 | 0.7% |
| Swiss | 111 | 1.4% |
| Thai | 42 | 0.5% |
| Ukrainian | 1 | 0.0% |
| Welsh | 75 | 0.9% | View All 42 Rows |
Immigrants in Sheboygan Falls
The most numerous immigrant groups reported in Sheboygan Falls came from Asia (212 | 2.6%), Latin America (172 | 2.1%), China (156 | 1.9%), Eastern Asia (156 | 1.9%), and Europe (146 | 1.8%), together accounting for 10.3% of all Sheboygan Falls residents.
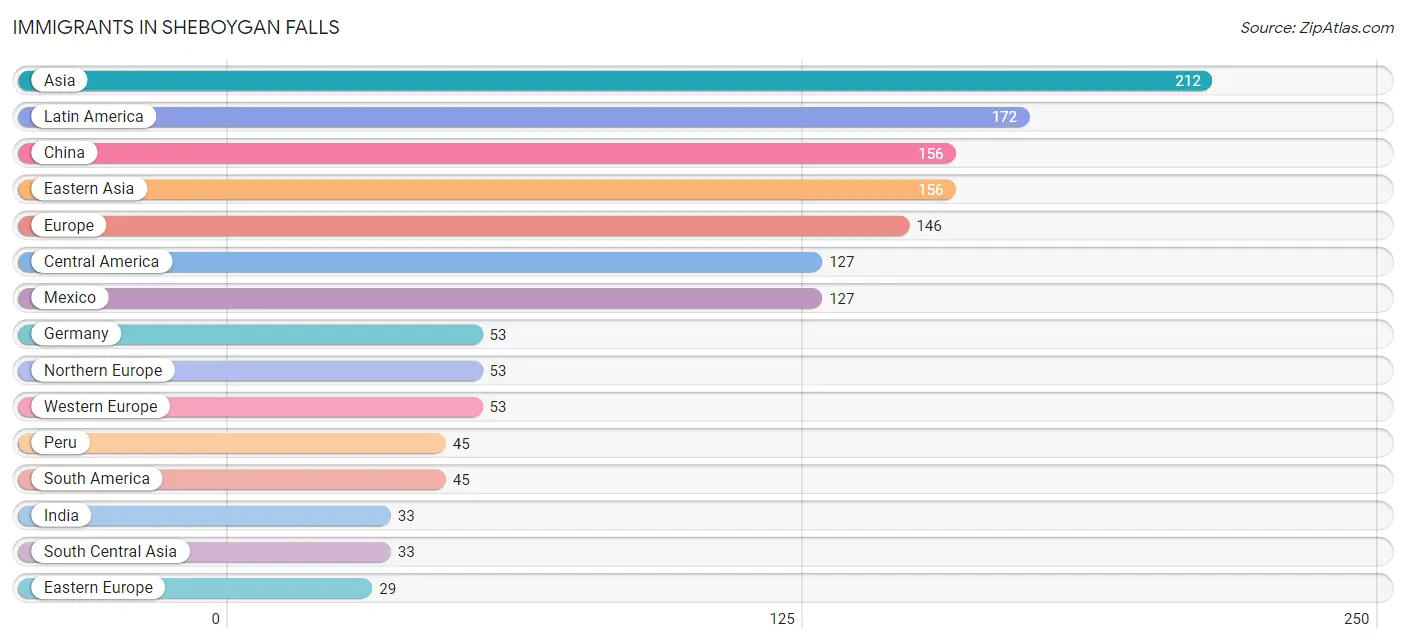
| Immigration Origin | # Population | % Population |
| Asia | 212 | 2.6% |
| Canada | 7 | 0.1% |
| Central America | 127 | 1.6% |
| China | 156 | 1.9% |
| Eastern Asia | 156 | 1.9% |
| Eastern Europe | 29 | 0.4% |
| Europe | 146 | 1.8% |
| Germany | 53 | 0.6% |
| India | 33 | 0.4% |
| Italy | 11 | 0.1% |
| Kuwait | 11 | 0.1% |
| Latin America | 172 | 2.1% |
| Mexico | 127 | 1.6% |
| Northern Europe | 53 | 0.6% |
| Peru | 45 | 0.5% |
| Russia | 27 | 0.3% |
| Serbia | 2 | 0.0% |
| South America | 45 | 0.5% |
| South Central Asia | 33 | 0.4% |
| South Eastern Asia | 12 | 0.2% |
| Southern Europe | 11 | 0.1% |
| Thailand | 12 | 0.2% |
| Western Asia | 11 | 0.1% |
| Western Europe | 53 | 0.6% | View All 24 Rows |
Sex and Age in Sheboygan Falls
Sex and Age in Sheboygan Falls
The most populous age groups in Sheboygan Falls are 50 to 54 Years (398 | 10.5%) for men and 55 to 59 Years (482 | 11.0%) for women.
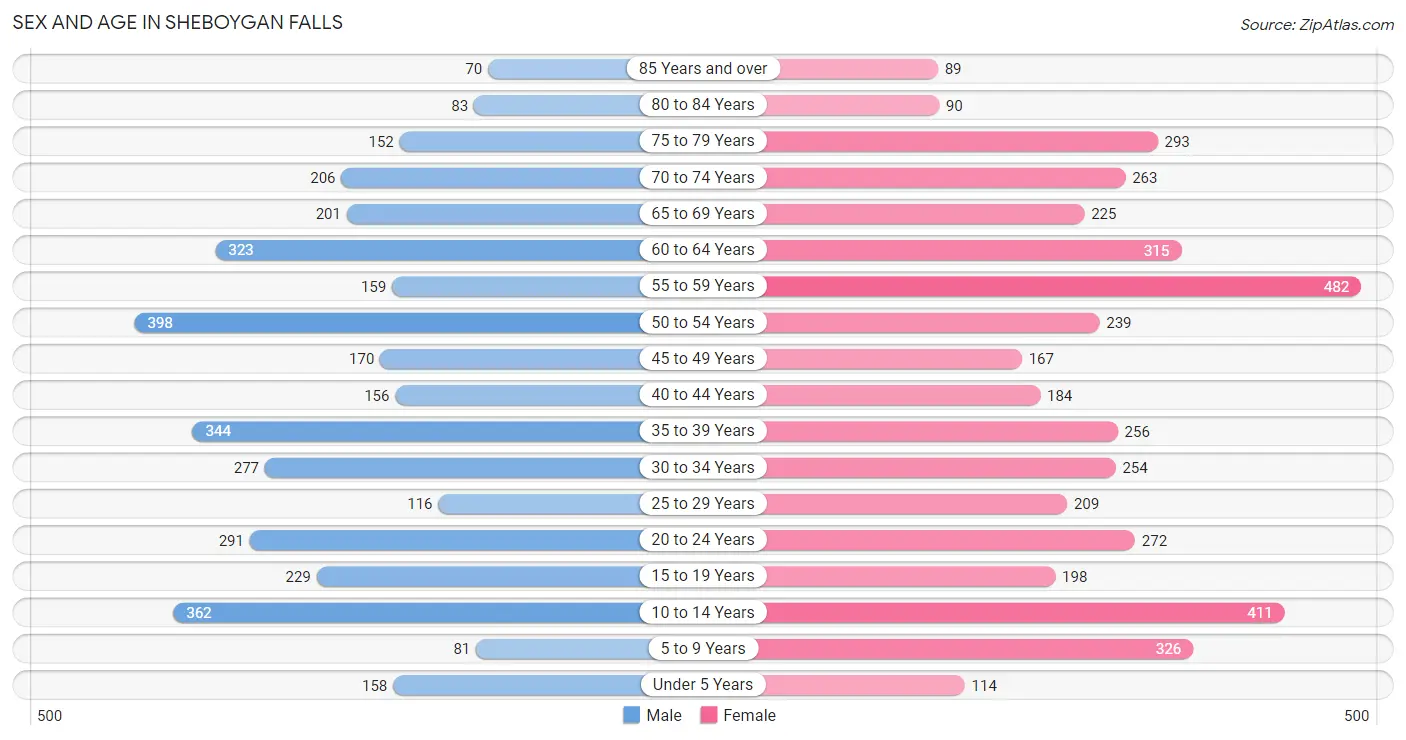
| Age Bracket | Male | Female |
| Under 5 Years | 158 (4.2%) | 114 (2.6%) |
| 5 to 9 Years | 81 (2.1%) | 326 (7.4%) |
| 10 to 14 Years | 362 (9.6%) | 411 (9.4%) |
| 15 to 19 Years | 229 (6.1%) | 198 (4.5%) |
| 20 to 24 Years | 291 (7.7%) | 272 (6.2%) |
| 25 to 29 Years | 116 (3.1%) | 209 (4.8%) |
| 30 to 34 Years | 277 (7.3%) | 254 (5.8%) |
| 35 to 39 Years | 344 (9.1%) | 256 (5.8%) |
| 40 to 44 Years | 156 (4.1%) | 184 (4.2%) |
| 45 to 49 Years | 170 (4.5%) | 167 (3.8%) |
| 50 to 54 Years | 398 (10.5%) | 239 (5.4%) |
| 55 to 59 Years | 159 (4.2%) | 482 (11.0%) |
| 60 to 64 Years | 323 (8.6%) | 315 (7.2%) |
| 65 to 69 Years | 201 (5.3%) | 225 (5.1%) |
| 70 to 74 Years | 206 (5.5%) | 263 (6.0%) |
| 75 to 79 Years | 152 (4.0%) | 293 (6.7%) |
| 80 to 84 Years | 83 (2.2%) | 90 (2.1%) |
| 85 Years and over | 70 (1.8%) | 89 (2.0%) |
| Total | 3,776 (100.0%) | 4,387 (100.0%) |
Families and Households in Sheboygan Falls
Median Family Size in Sheboygan Falls
The median family size in Sheboygan Falls is 2.67 persons per family, with single female/mother families (381 | 16.6%) accounting for the largest median family size of 3.08 persons per family. On the other hand, married-couple families (1,746 | 75.9%) represent the smallest median family size with 2.57 persons per family.
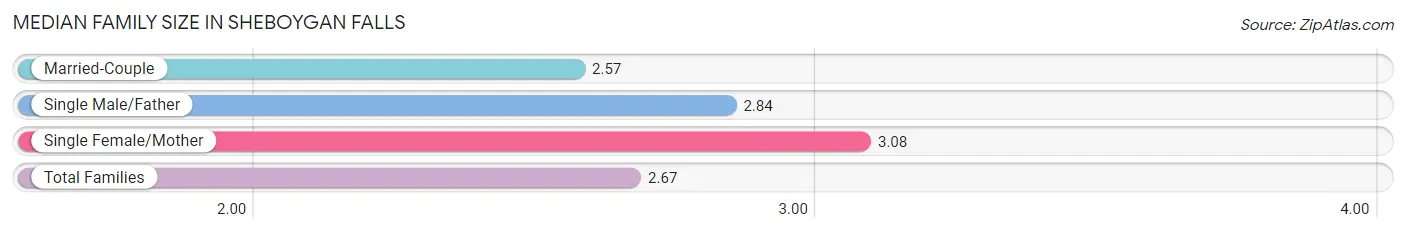
| Family Type | # Families | Family Size |
| Married-Couple | 1,746 (75.9%) | 2.57 |
| Single Male/Father | 174 (7.6%) | 2.84 |
| Single Female/Mother | 381 (16.6%) | 3.08 |
| Total Families | 2,301 (100.0%) | 2.67 |
Median Household Size in Sheboygan Falls
The median household size in Sheboygan Falls is 2.16 persons per household, with single female/mother households (381 | 10.2%) accounting for the largest median household size of 3.24 persons per household. non-family households (1,421 | 38.2%) represent the smallest median household size with 1.22 persons per household.
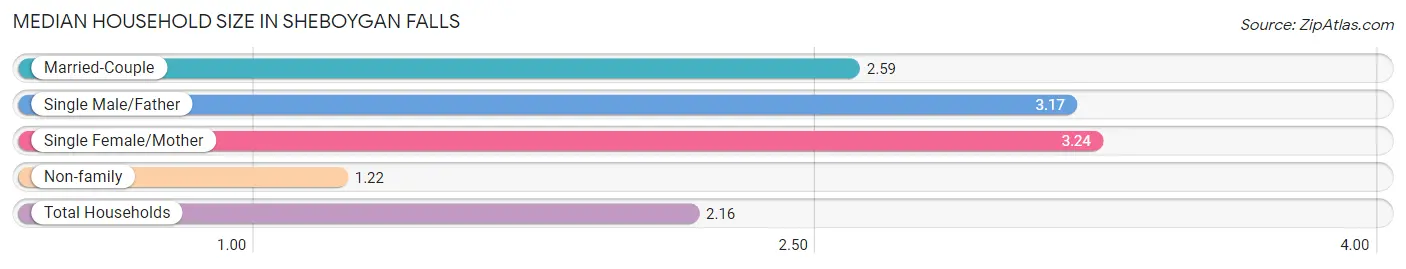
| Household Type | # Households | Household Size |
| Married-Couple | 1,746 (46.9%) | 2.59 |
| Single Male/Father | 174 (4.7%) | 3.17 |
| Single Female/Mother | 381 (10.2%) | 3.24 |
| Non-family | 1,421 (38.2%) | 1.22 |
| Total Households | 3,722 (100.0%) | 2.16 |
Household Size by Marriage Status in Sheboygan Falls
Out of a total of 3,722 households in Sheboygan Falls, 2,301 (61.8%) are family households, while 1,421 (38.2%) are nonfamily households. The most numerous type of family households are 2-person households, comprising 1,370, and the most common type of nonfamily households are 1-person households, comprising 1,089.
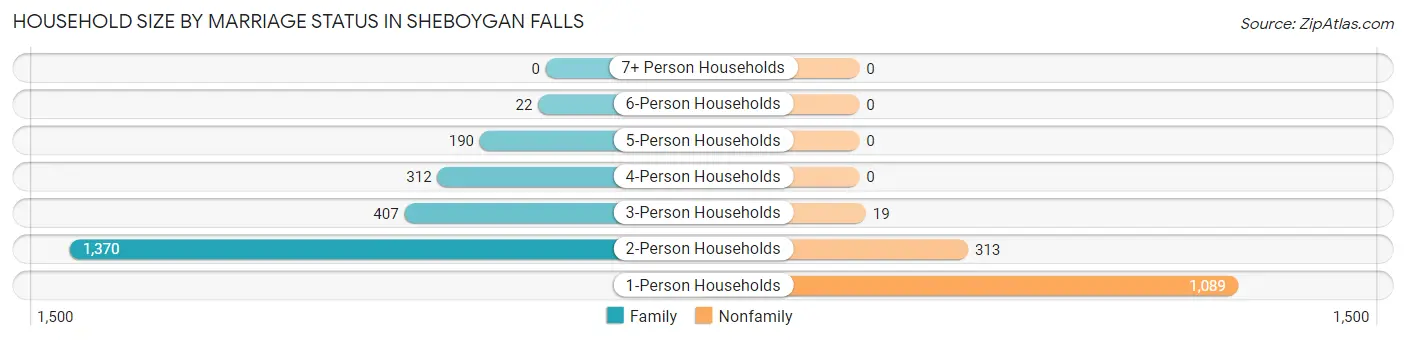
| Household Size | Family Households | Nonfamily Households |
| 1-Person Households | - | 1,089 (29.3%) |
| 2-Person Households | 1,370 (36.8%) | 313 (8.4%) |
| 3-Person Households | 407 (10.9%) | 19 (0.5%) |
| 4-Person Households | 312 (8.4%) | 0 (0.0%) |
| 5-Person Households | 190 (5.1%) | 0 (0.0%) |
| 6-Person Households | 22 (0.6%) | 0 (0.0%) |
| 7+ Person Households | 0 (0.0%) | 0 (0.0%) |
| Total | 2,301 (61.8%) | 1,421 (38.2%) |
Female Fertility in Sheboygan Falls
Fertility by Age in Sheboygan Falls
Average fertility rate in Sheboygan Falls is 46.0 births per 1,000 women. Women in the age bracket of 20 to 34 years have the highest fertility rate with 99.0 births per 1,000 women. Women in the age bracket of 20 to 34 years acount for 100.0% of all women with births.
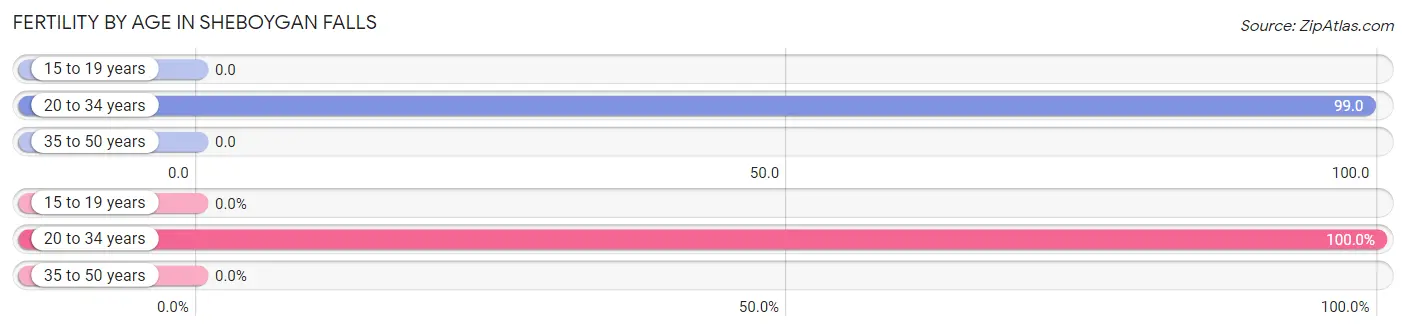
| Age Bracket | Women with Births | Births / 1,000 Women |
| 15 to 19 years | 0 (0.0%) | 0.0 |
| 20 to 34 years | 73 (100.0%) | 99.0 |
| 35 to 50 years | 0 (0.0%) | 0.0 |
| Total | 73 (100.0%) | 46.0 |
Fertility by Age by Marriage Status in Sheboygan Falls
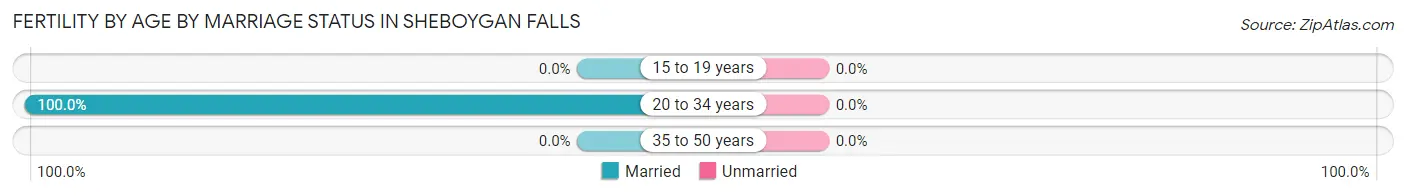
| Age Bracket | Married | Unmarried |
| 15 to 19 years | 0 (0.0%) | 0 (0.0%) |
| 20 to 34 years | 73 (100.0%) | 0 (0.0%) |
| 35 to 50 years | 0 (0.0%) | 0 (0.0%) |
| Total | 73 (100.0%) | 0 (0.0%) |
Fertility by Education in Sheboygan Falls
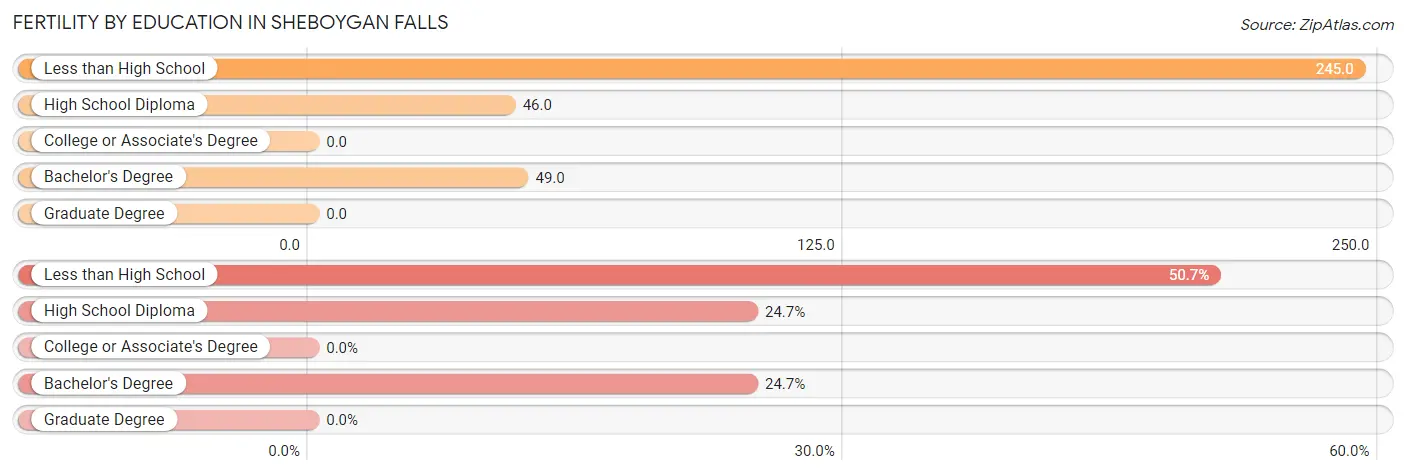
| Educational Attainment | Women with Births | Births / 1,000 Women |
| Less than High School | 37 (50.7%) | 245.0 |
| High School Diploma | 18 (24.7%) | 46.0 |
| College or Associate's Degree | 0 (0.0%) | 0.0 |
| Bachelor's Degree | 18 (24.7%) | 49.0 |
| Graduate Degree | 0 (0.0%) | 0.0 |
| Total | 73 (100.0%) | 46.0 |
Fertility by Education by Marriage Status in Sheboygan Falls
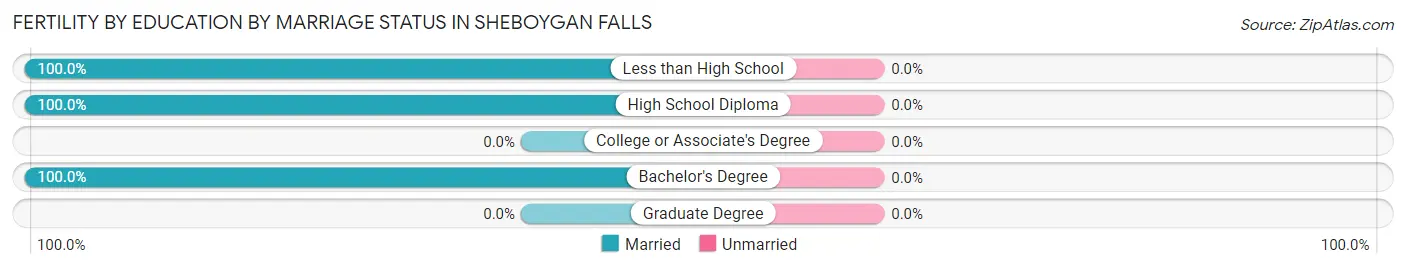
| Educational Attainment | Married | Unmarried |
| Less than High School | 37 (100.0%) | 0 (0.0%) |
| High School Diploma | 18 (100.0%) | 0 (0.0%) |
| College or Associate's Degree | 0 (0.0%) | 0 (0.0%) |
| Bachelor's Degree | 18 (100.0%) | 0 (0.0%) |
| Graduate Degree | 0 (0.0%) | 0 (0.0%) |
| Total | 73 (100.0%) | 0 (0.0%) |
Income in Sheboygan Falls
Income Overview in Sheboygan Falls
Per Capita Income in Sheboygan Falls is $37,591, while median incomes of families and households are $79,688 and $66,416 respectively.
| Characteristic | Number | Measure |
| Per Capita Income | 8,163 | $37,591 |
| Median Family Income | 2,301 | $79,688 |
| Mean Family Income | 2,301 | $98,930 |
| Median Household Income | 3,722 | $66,416 |
| Mean Household Income | 3,722 | $82,703 |
| Income Deficit | 2,301 | $0 |
| Wage / Income Gap (%) | 8,163 | 22.29% |
| Wage / Income Gap ($) | 8,163 | 77.71¢ per $1 |
| Gini / Inequality Index | 8,163 | 0.39 |
Earnings by Sex in Sheboygan Falls
Average Earnings in Sheboygan Falls are $45,559, $50,455 for men and $39,207 for women, a difference of 22.3%.
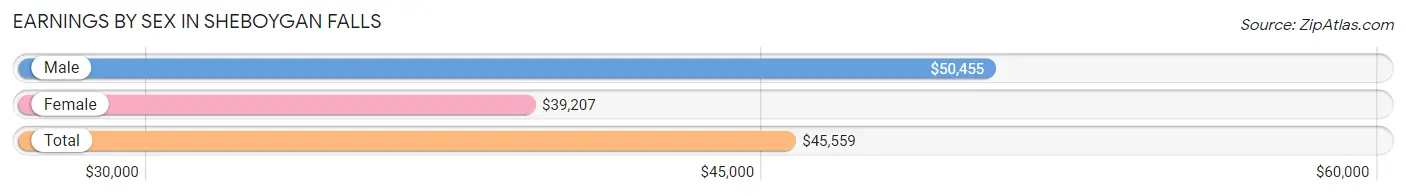
| Sex | Number | Average Earnings |
| Male | 2,368 (50.1%) | $50,455 |
| Female | 2,357 (49.9%) | $39,207 |
| Total | 4,725 (100.0%) | $45,559 |
Earnings by Sex by Income Bracket in Sheboygan Falls
The most common earnings brackets in Sheboygan Falls are $100,000+ for men (295 | 12.5%) and $65,000 to $74,999 for women (233 | 9.9%).
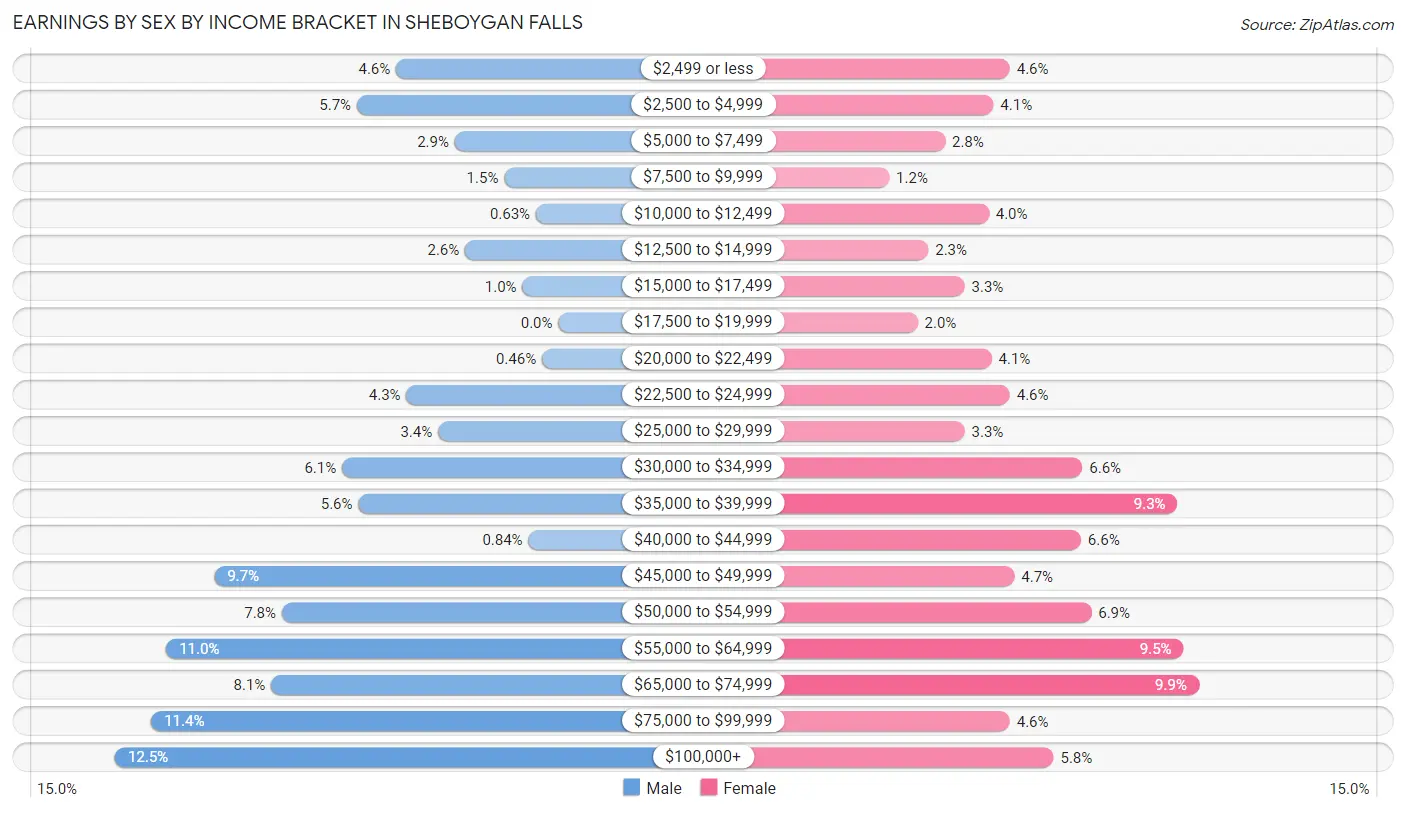
| Income | Male | Female |
| $2,499 or less | 108 (4.6%) | 108 (4.6%) |
| $2,500 to $4,999 | 134 (5.7%) | 97 (4.1%) |
| $5,000 to $7,499 | 69 (2.9%) | 65 (2.8%) |
| $7,500 to $9,999 | 36 (1.5%) | 28 (1.2%) |
| $10,000 to $12,499 | 15 (0.6%) | 94 (4.0%) |
| $12,500 to $14,999 | 62 (2.6%) | 54 (2.3%) |
| $15,000 to $17,499 | 24 (1.0%) | 78 (3.3%) |
| $17,500 to $19,999 | 0 (0.0%) | 47 (2.0%) |
| $20,000 to $22,499 | 11 (0.5%) | 96 (4.1%) |
| $22,500 to $24,999 | 101 (4.3%) | 108 (4.6%) |
| $25,000 to $29,999 | 80 (3.4%) | 78 (3.3%) |
| $30,000 to $34,999 | 144 (6.1%) | 156 (6.6%) |
| $35,000 to $39,999 | 133 (5.6%) | 219 (9.3%) |
| $40,000 to $44,999 | 20 (0.8%) | 155 (6.6%) |
| $45,000 to $49,999 | 229 (9.7%) | 111 (4.7%) |
| $50,000 to $54,999 | 184 (7.8%) | 162 (6.9%) |
| $55,000 to $64,999 | 261 (11.0%) | 223 (9.5%) |
| $65,000 to $74,999 | 191 (8.1%) | 233 (9.9%) |
| $75,000 to $99,999 | 271 (11.4%) | 108 (4.6%) |
| $100,000+ | 295 (12.5%) | 137 (5.8%) |
| Total | 2,368 (100.0%) | 2,357 (100.0%) |
Earnings by Sex by Educational Attainment in Sheboygan Falls
Average earnings in Sheboygan Falls are $55,449 for men and $40,433 for women, a difference of 27.1%. Men with an educational attainment of graduate degree enjoy the highest average annual earnings of $115,417, while those with high school diploma education earn the least with $46,713. Women with an educational attainment of bachelor's degree earn the most with the average annual earnings of $58,000, while those with high school diploma education have the smallest earnings of $31,151.
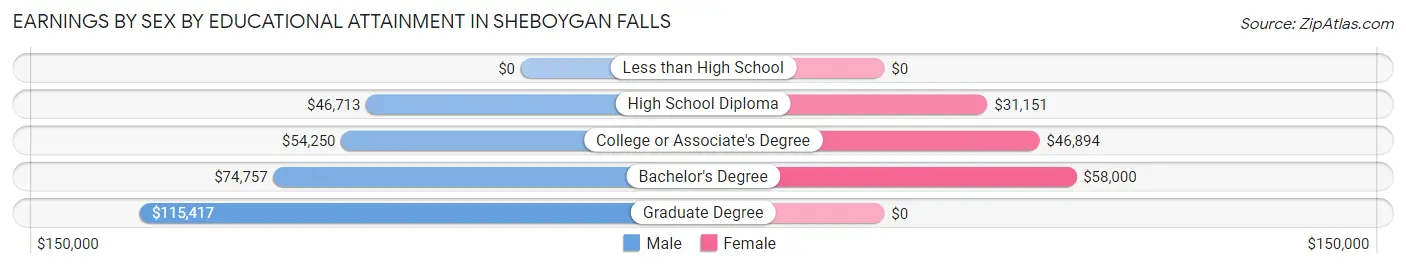
| Educational Attainment | Male Income | Female Income |
| Less than High School | - | - |
| High School Diploma | $46,713 | $31,151 |
| College or Associate's Degree | $54,250 | $46,894 |
| Bachelor's Degree | $74,757 | $58,000 |
| Graduate Degree | $115,417 | $0 |
| Total | $55,449 | $40,433 |
Family Income in Sheboygan Falls
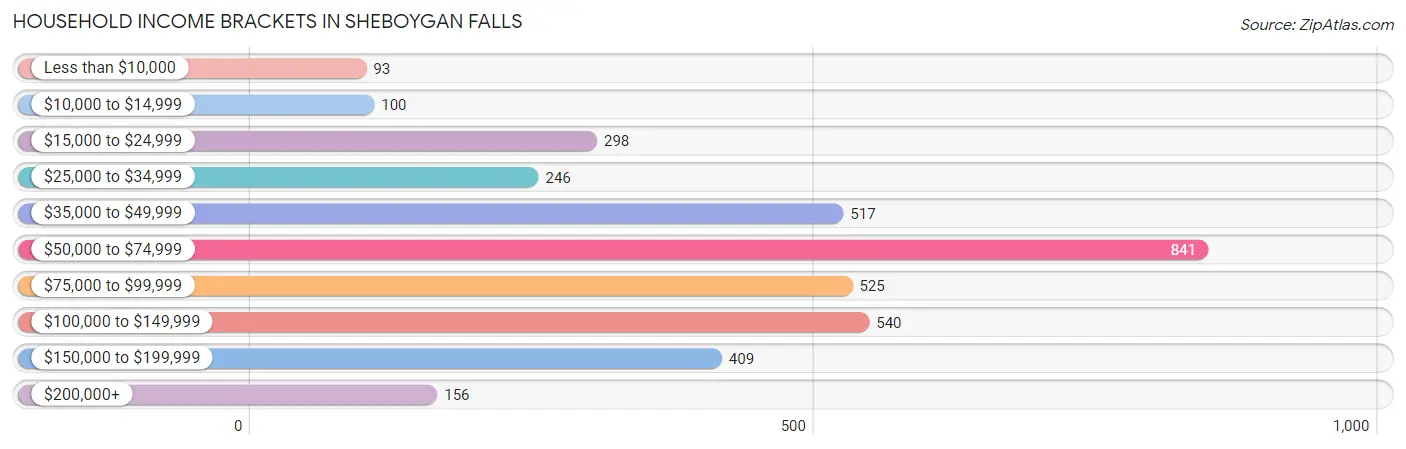
Family Income Brackets in Sheboygan Falls
According to the Sheboygan Falls family income data, there are 561 families falling into the $50,000 to $74,999 income range, which is the most common income bracket and makes up 24.4% of all families. Conversely, the less than $10,000 income bracket is the least frequent group with only 2 families (0.1%) belonging to this category.
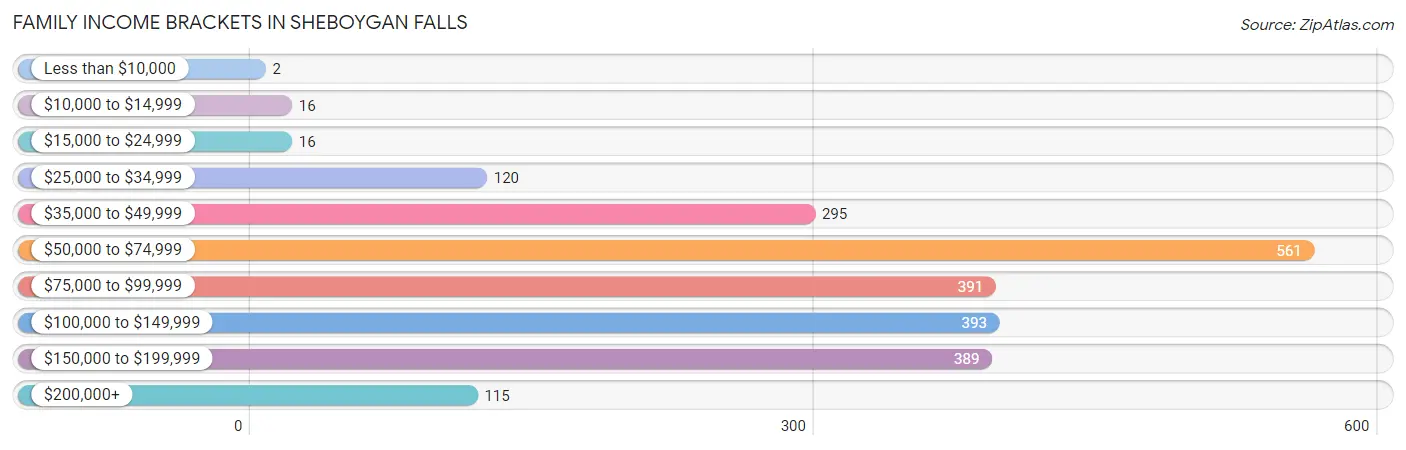
| Income Bracket | # Families | % Families |
| Less than $10,000 | 2 | 0.1% |
| $10,000 to $14,999 | 16 | 0.7% |
| $15,000 to $24,999 | 16 | 0.7% |
| $25,000 to $34,999 | 120 | 5.2% |
| $35,000 to $49,999 | 295 | 12.8% |
| $50,000 to $74,999 | 561 | 24.4% |
| $75,000 to $99,999 | 391 | 17.0% |
| $100,000 to $149,999 | 393 | 17.1% |
| $150,000 to $199,999 | 389 | 16.9% |
| $200,000+ | 115 | 5.0% |
Family Income by Famaliy Size in Sheboygan Falls
5-person families (185 | 8.0%) account for the highest median family income in Sheboygan Falls with $114,875 per family, while 2-person families (1,458 | 63.4%) have the highest median income of $40,040 per family member.
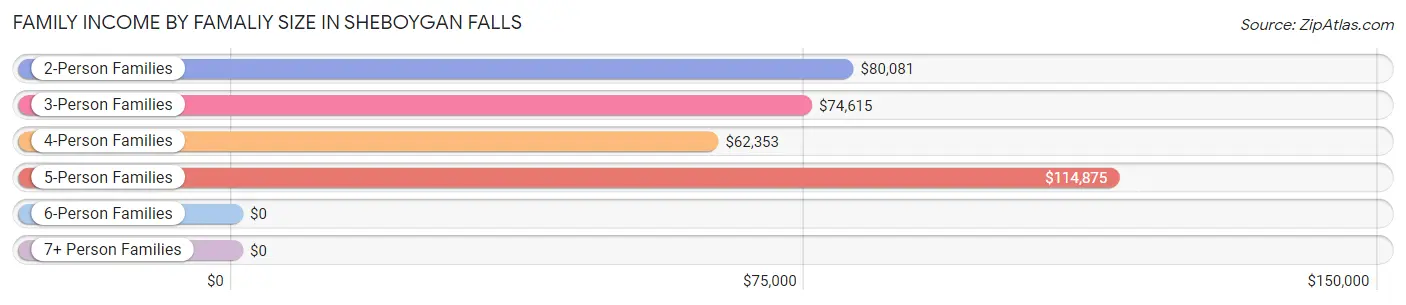
| Income Bracket | # Families | Median Income |
| 2-Person Families | 1,458 (63.4%) | $80,081 |
| 3-Person Families | 390 (17.0%) | $74,615 |
| 4-Person Families | 268 (11.7%) | $62,353 |
| 5-Person Families | 185 (8.0%) | $114,875 |
| 6-Person Families | 0 (0.0%) | $0 |
| 7+ Person Families | 0 (0.0%) | $0 |
| Total | 2,301 (100.0%) | $79,688 |
Family Income by Number of Earners in Sheboygan Falls
The median family income in Sheboygan Falls is $79,688, with families comprising 3+ earners (234) having the highest median family income of $156,364, while families with 1 earner (667) have the lowest median family income of $54,635, accounting for 10.2% and 29.0% of families, respectively.
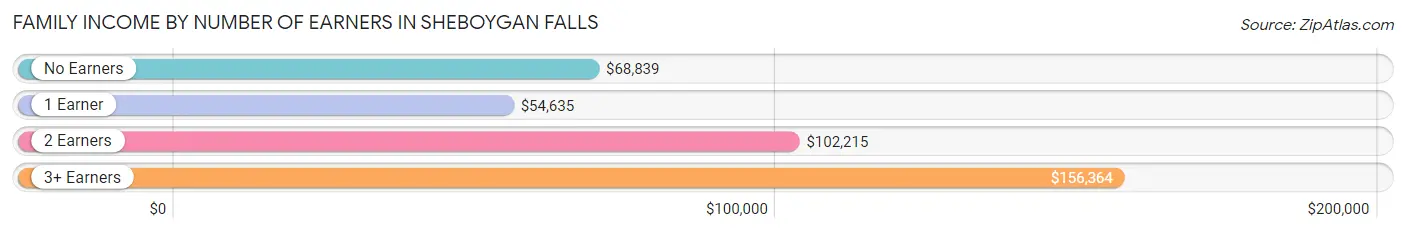
| Number of Earners | # Families | Median Income |
| No Earners | 383 (16.6%) | $68,839 |
| 1 Earner | 667 (29.0%) | $54,635 |
| 2 Earners | 1,017 (44.2%) | $102,215 |
| 3+ Earners | 234 (10.2%) | $156,364 |
| Total | 2,301 (100.0%) | $79,688 |
Household Income in Sheboygan Falls
Household Income Brackets in Sheboygan Falls
With 841 households falling in the category, the $50,000 to $74,999 income range is the most frequent in Sheboygan Falls, accounting for 22.6% of all households. In contrast, only 93 households (2.5%) fall into the less than $10,000 income bracket, making it the least populous group.
| Income Bracket | # Households | % Households |
| Less than $10,000 | 93 | 2.5% |
| $10,000 to $14,999 | 100 | 2.7% |
| $15,000 to $24,999 | 298 | 8.0% |
| $25,000 to $34,999 | 246 | 6.6% |
| $35,000 to $49,999 | 517 | 13.9% |
| $50,000 to $74,999 | 841 | 22.6% |
| $75,000 to $99,999 | 525 | 14.1% |
| $100,000 to $149,999 | 540 | 14.5% |
| $150,000 to $199,999 | 409 | 11.0% |
| $200,000+ | 156 | 4.2% |
Household Income by Householder Age in Sheboygan Falls
The median household income in Sheboygan Falls is $66,416, with the highest median household income of $79,514 found in the 45 to 64 years age bracket for the primary householder. A total of 1,408 households (37.8%) fall into this category. Meanwhile, the 65+ years age bracket for the primary householder has the lowest median household income of $53,693, with 995 households (26.7%) in this group.
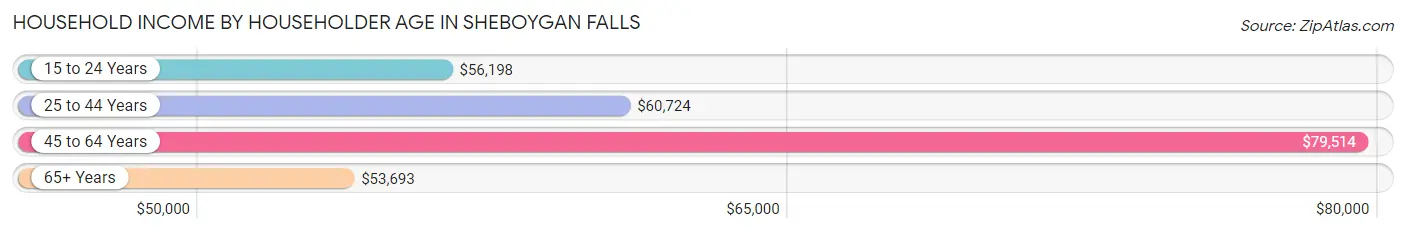
| Income Bracket | # Households | Median Income |
| 15 to 24 Years | 251 (6.7%) | $56,198 |
| 25 to 44 Years | 1,068 (28.7%) | $60,724 |
| 45 to 64 Years | 1,408 (37.8%) | $79,514 |
| 65+ Years | 995 (26.7%) | $53,693 |
| Total | 3,722 (100.0%) | $66,416 |
Poverty in Sheboygan Falls
Income Below Poverty by Sex and Age in Sheboygan Falls
With 5.3% poverty level for males and 8.6% for females among the residents of Sheboygan Falls, 6 to 11 year old males and 25 to 34 year old females are the most vulnerable to poverty, with 31 males (14.8%) and 85 females (18.4%) in their respective age groups living below the poverty level.
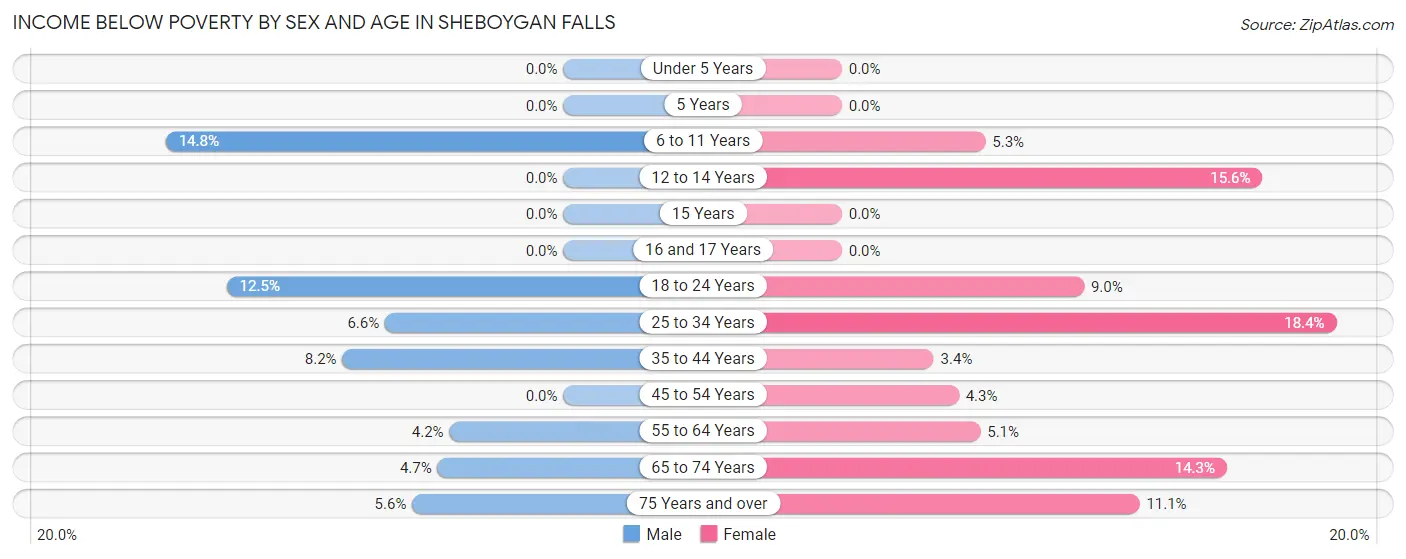
| Age Bracket | Male | Female |
| Under 5 Years | 0 (0.0%) | 0 (0.0%) |
| 5 Years | 0 (0.0%) | 0 (0.0%) |
| 6 to 11 Years | 31 (14.8%) | 16 (5.3%) |
| 12 to 14 Years | 0 (0.0%) | 47 (15.6%) |
| 15 Years | 0 (0.0%) | 0 (0.0%) |
| 16 and 17 Years | 0 (0.0%) | 0 (0.0%) |
| 18 to 24 Years | 46 (12.5%) | 32 (9.0%) |
| 25 to 34 Years | 26 (6.6%) | 85 (18.4%) |
| 35 to 44 Years | 41 (8.2%) | 15 (3.4%) |
| 45 to 54 Years | 0 (0.0%) | 17 (4.3%) |
| 55 to 64 Years | 20 (4.2%) | 41 (5.1%) |
| 65 to 74 Years | 19 (4.7%) | 68 (14.3%) |
| 75 Years and over | 17 (5.6%) | 43 (11.1%) |
| Total | 200 (5.3%) | 364 (8.6%) |
Income Above Poverty by Sex and Age in Sheboygan Falls
According to the poverty statistics in Sheboygan Falls, males aged under 5 years and females aged under 5 years are the age groups that are most secure financially, with 100.0% of males and 100.0% of females in these age groups living above the poverty line.
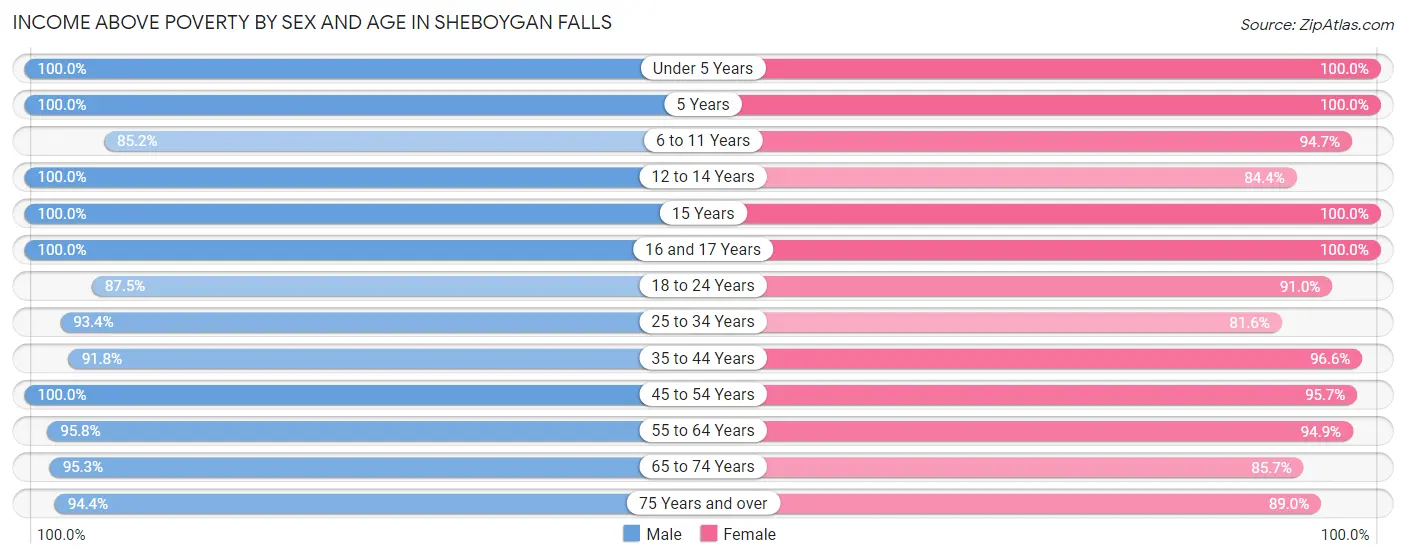
| Age Bracket | Male | Female |
| Under 5 Years | 158 (100.0%) | 114 (100.0%) |
| 5 Years | 23 (100.0%) | 100 (100.0%) |
| 6 to 11 Years | 179 (85.2%) | 284 (94.7%) |
| 12 to 14 Years | 195 (100.0%) | 254 (84.4%) |
| 15 Years | 56 (100.0%) | 31 (100.0%) |
| 16 and 17 Years | 96 (100.0%) | 83 (100.0%) |
| 18 to 24 Years | 322 (87.5%) | 324 (91.0%) |
| 25 to 34 Years | 367 (93.4%) | 378 (81.6%) |
| 35 to 44 Years | 459 (91.8%) | 425 (96.6%) |
| 45 to 54 Years | 568 (100.0%) | 375 (95.7%) |
| 55 to 64 Years | 453 (95.8%) | 756 (94.9%) |
| 65 to 74 Years | 388 (95.3%) | 408 (85.7%) |
| 75 Years and over | 286 (94.4%) | 346 (88.9%) |
| Total | 3,550 (94.7%) | 3,878 (91.4%) |
Income Below Poverty Among Married-Couple Families in Sheboygan Falls
The poverty statistics for married-couple families in Sheboygan Falls show that 2.1% or 36 of the total 1,746 families live below the poverty line. Families with 1 or 2 children have the highest poverty rate of 5.4%, comprising of 17 families. On the other hand, families with 3 or 4 children have the lowest poverty rate of 0.0%, which includes 0 families.
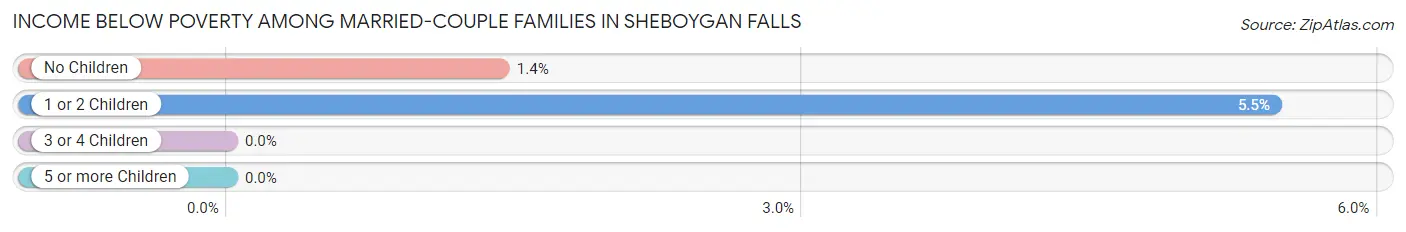
| Children | Above Poverty | Below Poverty |
| No Children | 1,316 (98.6%) | 19 (1.4%) |
| 1 or 2 Children | 295 (94.6%) | 17 (5.4%) |
| 3 or 4 Children | 99 (100.0%) | 0 (0.0%) |
| 5 or more Children | 0 (0.0%) | 0 (0.0%) |
| Total | 1,710 (97.9%) | 36 (2.1%) |
Income Below Poverty Among Single-Parent Households in Sheboygan Falls
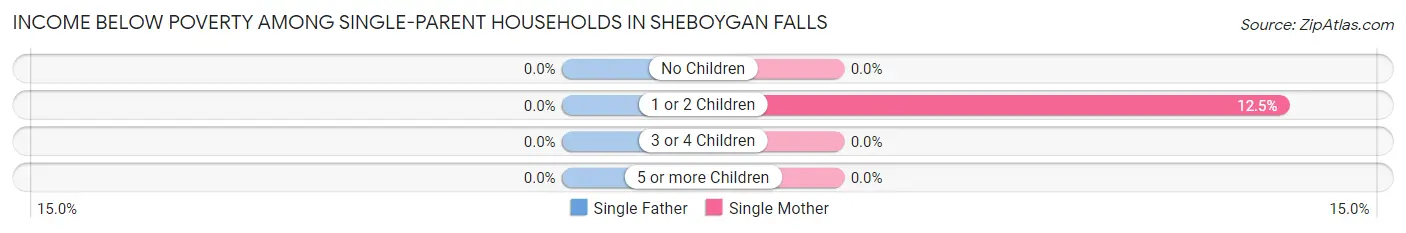
| Children | Single Father | Single Mother |
| No Children | 0 (0.0%) | 0 (0.0%) |
| 1 or 2 Children | 0 (0.0%) | 33 (12.4%) |
| 3 or 4 Children | 0 (0.0%) | 0 (0.0%) |
| 5 or more Children | 0 (0.0%) | 0 (0.0%) |
| Total | 0 (0.0%) | 33 (8.7%) |
Income Below Poverty Among Married-Couple vs Single-Parent Households in Sheboygan Falls
The poverty data for Sheboygan Falls shows that 36 of the married-couple family households (2.1%) and 33 of the single-parent households (5.9%) are living below the poverty level. Within the married-couple family households, those with 1 or 2 children have the highest poverty rate, with 17 households (5.4%) falling below the poverty line. Among the single-parent households, those with 1 or 2 children have the highest poverty rate, with 33 household (9.4%) living below poverty.
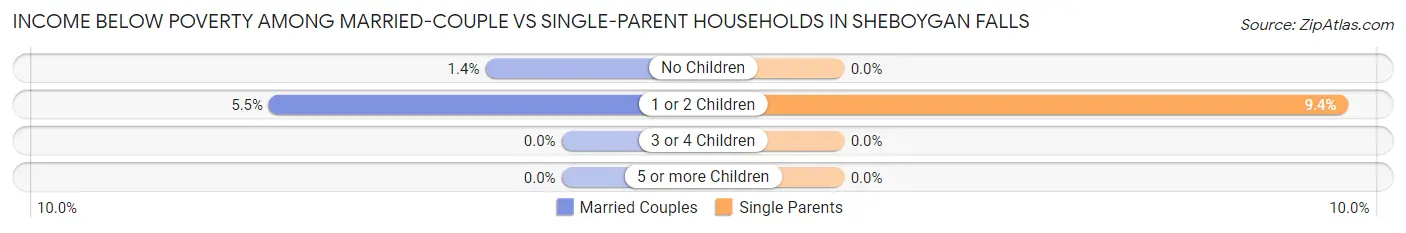
| Children | Married-Couple Families | Single-Parent Households |
| No Children | 19 (1.4%) | 0 (0.0%) |
| 1 or 2 Children | 17 (5.4%) | 33 (9.4%) |
| 3 or 4 Children | 0 (0.0%) | 0 (0.0%) |
| 5 or more Children | 0 (0.0%) | 0 (0.0%) |
| Total | 36 (2.1%) | 33 (5.9%) |
Employment Characteristics in Sheboygan Falls
Employment by Class of Employer in Sheboygan Falls
Among the 4,441 employed individuals in Sheboygan Falls, private company employees (3,426 | 77.1%), not-for-profit organizations (334 | 7.5%), and self-employed (not incorporated) (309 | 7.0%) make up the most common classes of employment.
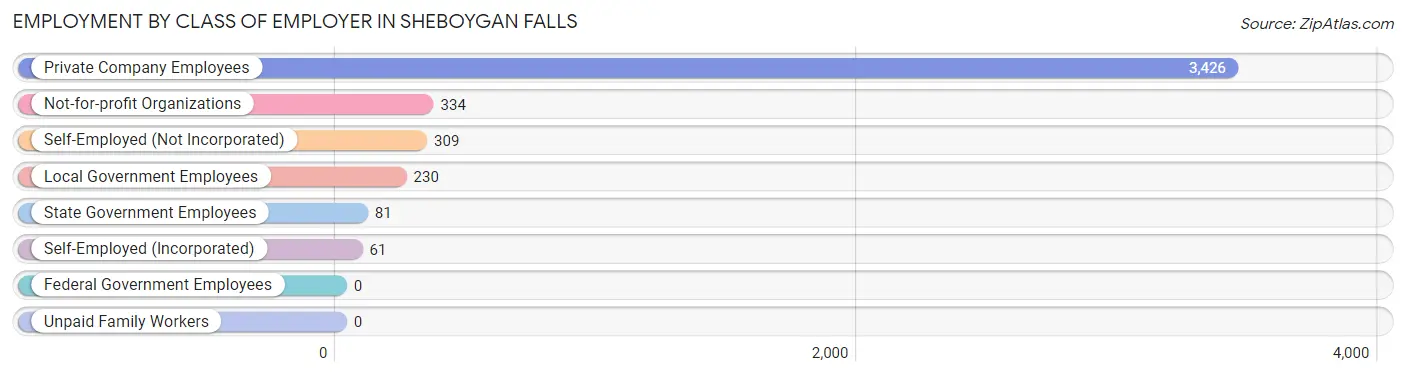
| Employer Class | # Employees | % Employees |
| Private Company Employees | 3,426 | 77.1% |
| Self-Employed (Incorporated) | 61 | 1.4% |
| Self-Employed (Not Incorporated) | 309 | 7.0% |
| Not-for-profit Organizations | 334 | 7.5% |
| Local Government Employees | 230 | 5.2% |
| State Government Employees | 81 | 1.8% |
| Federal Government Employees | 0 | 0.0% |
| Unpaid Family Workers | 0 | 0.0% |
| Total | 4,441 | 100.0% |
Employment Status by Age in Sheboygan Falls
According to the labor force statistics for Sheboygan Falls, out of the total population over 16 years of age (6,624), 68.7% or 4,551 individuals are in the labor force, with 1.4% or 64 of them unemployed. The age group with the highest labor force participation rate is 30 to 34 years, with 95.5% or 507 individuals in the labor force. Within the labor force, the 25 to 29 years age range has the highest percentage of unemployed individuals, with 10.7% or 26 of them being unemployed.
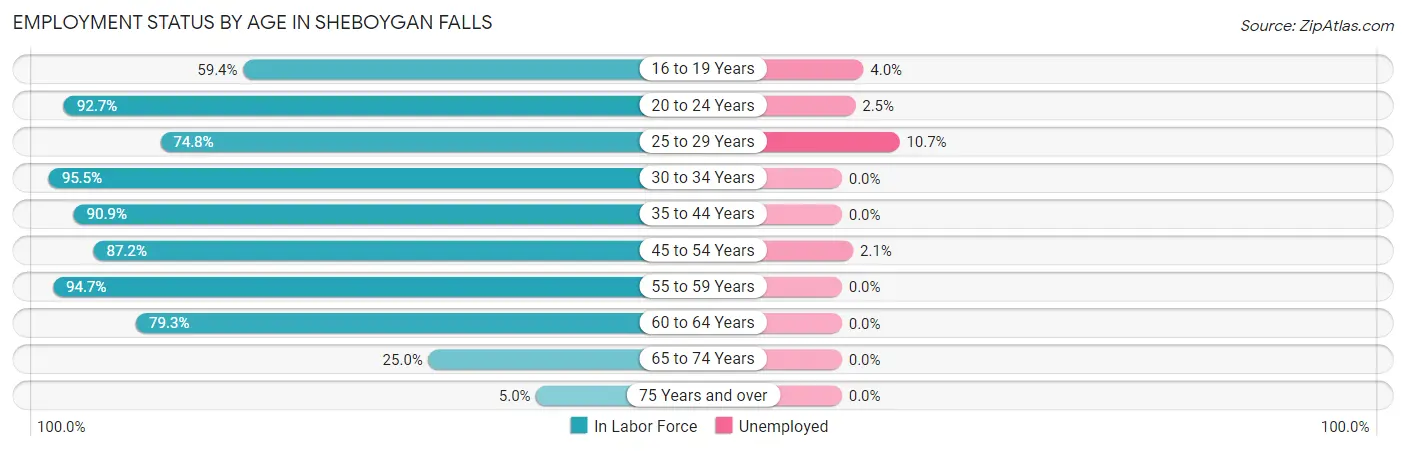
| Age Bracket | In Labor Force | Unemployed |
| 16 to 19 Years | 202 (59.4%) | 8 (4.0%) |
| 20 to 24 Years | 522 (92.7%) | 13 (2.5%) |
| 25 to 29 Years | 243 (74.8%) | 26 (10.7%) |
| 30 to 34 Years | 507 (95.5%) | 0 (0.0%) |
| 35 to 44 Years | 854 (90.9%) | 0 (0.0%) |
| 45 to 54 Years | 849 (87.2%) | 18 (2.1%) |
| 55 to 59 Years | 607 (94.7%) | 0 (0.0%) |
| 60 to 64 Years | 506 (79.3%) | 0 (0.0%) |
| 65 to 74 Years | 224 (25.0%) | 0 (0.0%) |
| 75 Years and over | 39 (5.0%) | 0 (0.0%) |
| Total | 4,551 (68.7%) | 64 (1.4%) |
Employment Status by Educational Attainment in Sheboygan Falls
According to labor force statistics for Sheboygan Falls, 88.1% of individuals (3,567) out of the total population between 25 and 64 years of age (4,049) are in the labor force, with 1.2% or 43 of them being unemployed. The group with the highest labor force participation rate are those with the educational attainment of less than high school, with 100.0% or 65 individuals in the labor force. Within the labor force, individuals with high school diploma education have the highest percentage of unemployment, with 2.6% or 26 of them being unemployed.
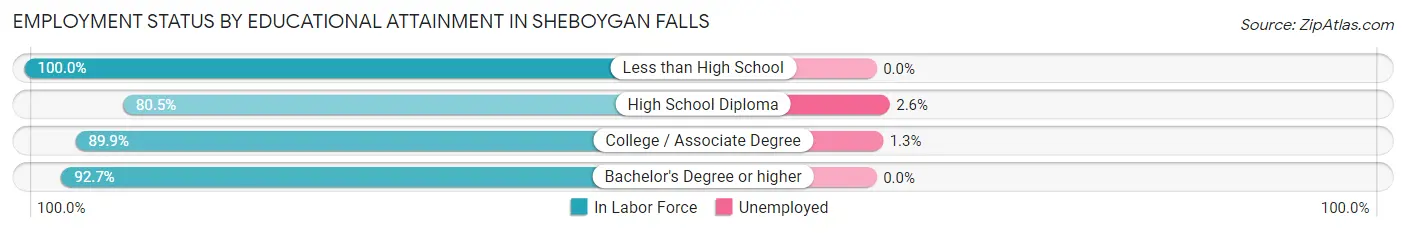
| Educational Attainment | In Labor Force | Unemployed |
| Less than High School | 65 (100.0%) | 0 (0.0%) |
| High School Diploma | 988 (80.5%) | 32 (2.6%) |
| College / Associate Degree | 1,403 (89.9%) | 20 (1.3%) |
| Bachelor's Degree or higher | 1,109 (92.7%) | 0 (0.0%) |
| Total | 3,567 (88.1%) | 49 (1.2%) |
Employment Occupations by Sex in Sheboygan Falls
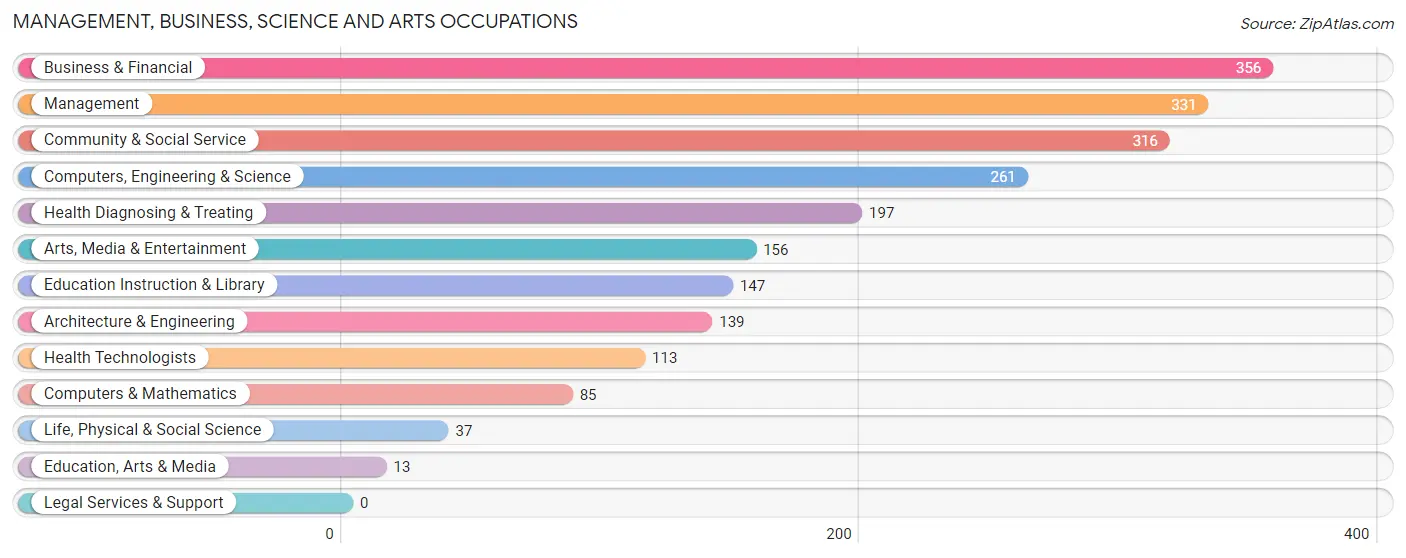
Management, Business, Science and Arts Occupations
The most common Management, Business, Science and Arts occupations in Sheboygan Falls are Business & Financial (356 | 7.9%), Management (331 | 7.4%), Community & Social Service (316 | 7.0%), Computers, Engineering & Science (261 | 5.8%), and Health Diagnosing & Treating (197 | 4.4%).
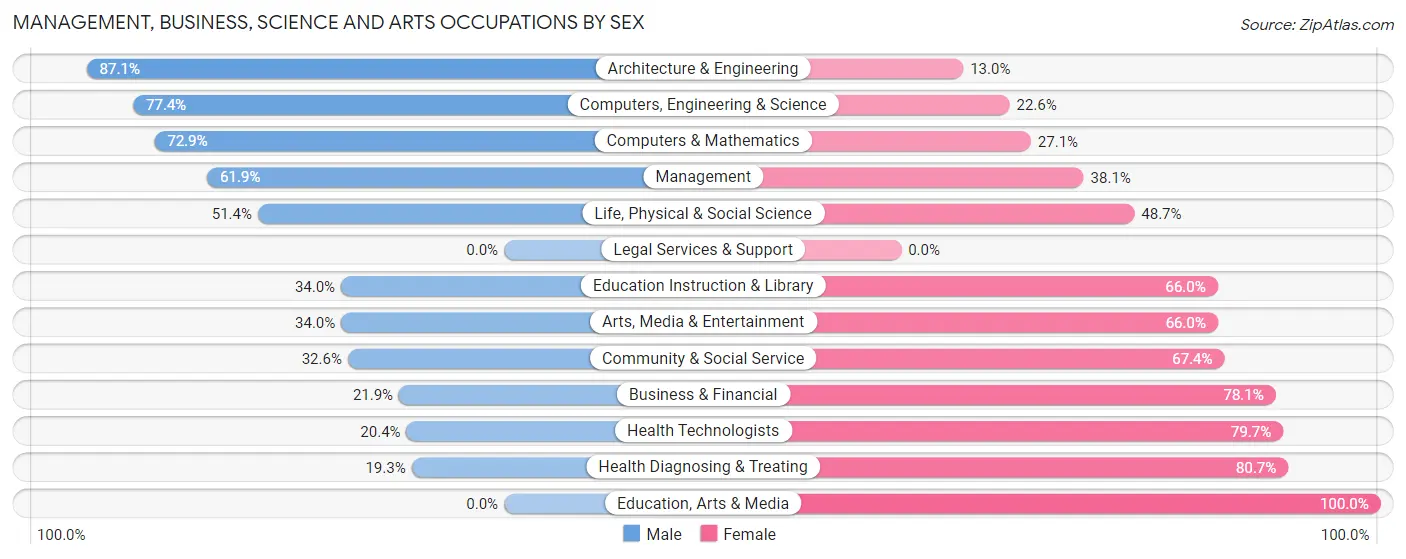
Management, Business, Science and Arts Occupations by Sex
Within the Management, Business, Science and Arts occupations in Sheboygan Falls, the most male-oriented occupations are Architecture & Engineering (87.1%), Computers, Engineering & Science (77.4%), and Computers & Mathematics (72.9%), while the most female-oriented occupations are Education, Arts & Media (100.0%), Health Diagnosing & Treating (80.7%), and Health Technologists (79.6%).
| Occupation | Male | Female |
| Management | 205 (61.9%) | 126 (38.1%) |
| Business & Financial | 78 (21.9%) | 278 (78.1%) |
| Computers, Engineering & Science | 202 (77.4%) | 59 (22.6%) |
| Computers & Mathematics | 62 (72.9%) | 23 (27.1%) |
| Architecture & Engineering | 121 (87.1%) | 18 (13.0%) |
| Life, Physical & Social Science | 19 (51.3%) | 18 (48.6%) |
| Community & Social Service | 103 (32.6%) | 213 (67.4%) |
| Education, Arts & Media | 0 (0.0%) | 13 (100.0%) |
| Legal Services & Support | 0 (0.0%) | 0 (0.0%) |
| Education Instruction & Library | 50 (34.0%) | 97 (66.0%) |
| Arts, Media & Entertainment | 53 (34.0%) | 103 (66.0%) |
| Health Diagnosing & Treating | 38 (19.3%) | 159 (80.7%) |
| Health Technologists | 23 (20.3%) | 90 (79.6%) |
| Total (Category) | 626 (42.8%) | 835 (57.2%) |
| Total (Overall) | 2,247 (50.1%) | 2,241 (49.9%) |
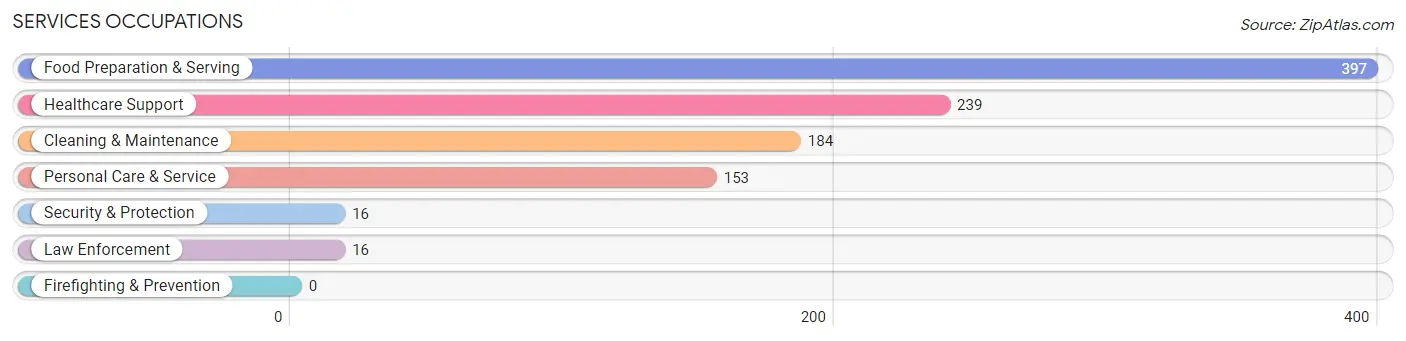
Services Occupations
The most common Services occupations in Sheboygan Falls are Food Preparation & Serving (397 | 8.8%), Healthcare Support (239 | 5.3%), Cleaning & Maintenance (184 | 4.1%), Personal Care & Service (153 | 3.4%), and Security & Protection (16 | 0.4%).
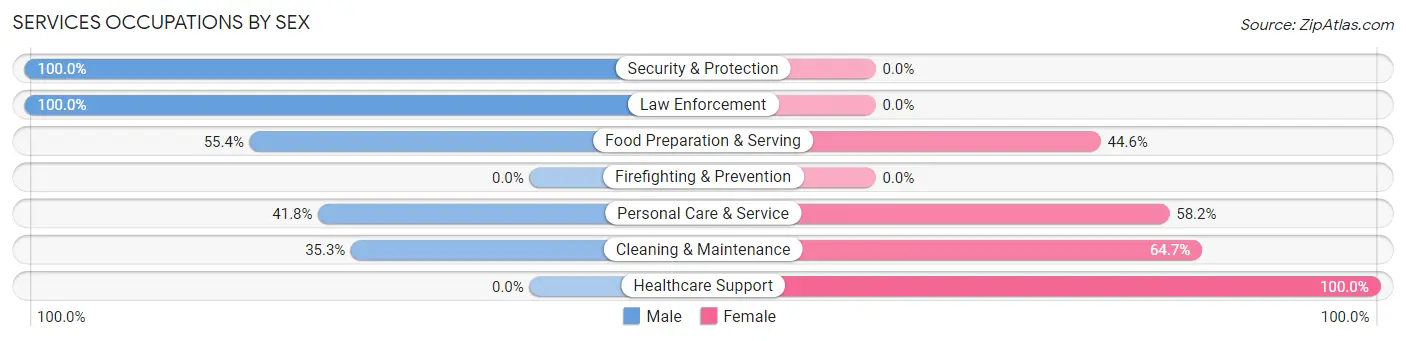
Services Occupations by Sex
Within the Services occupations in Sheboygan Falls, the most male-oriented occupations are Security & Protection (100.0%), Law Enforcement (100.0%), and Food Preparation & Serving (55.4%), while the most female-oriented occupations are Healthcare Support (100.0%), Cleaning & Maintenance (64.7%), and Personal Care & Service (58.2%).
| Occupation | Male | Female |
| Healthcare Support | 0 (0.0%) | 239 (100.0%) |
| Security & Protection | 16 (100.0%) | 0 (0.0%) |
| Firefighting & Prevention | 0 (0.0%) | 0 (0.0%) |
| Law Enforcement | 16 (100.0%) | 0 (0.0%) |
| Food Preparation & Serving | 220 (55.4%) | 177 (44.6%) |
| Cleaning & Maintenance | 65 (35.3%) | 119 (64.7%) |
| Personal Care & Service | 64 (41.8%) | 89 (58.2%) |
| Total (Category) | 365 (36.9%) | 624 (63.1%) |
| Total (Overall) | 2,247 (50.1%) | 2,241 (49.9%) |
Sales and Office Occupations
The most common Sales and Office occupations in Sheboygan Falls are Office & Administration (497 | 11.1%), and Sales & Related (281 | 6.3%).
Sales and Office Occupations by Sex
| Occupation | Male | Female |
| Sales & Related | 150 (53.4%) | 131 (46.6%) |
| Office & Administration | 92 (18.5%) | 405 (81.5%) |
| Total (Category) | 242 (31.1%) | 536 (68.9%) |
| Total (Overall) | 2,247 (50.1%) | 2,241 (49.9%) |
Natural Resources, Construction and Maintenance Occupations
The most common Natural Resources, Construction and Maintenance occupations in Sheboygan Falls are Installation, Maintenance & Repair (94 | 2.1%), Construction & Extraction (38 | 0.9%), and Farming, Fishing & Forestry (27 | 0.6%).
Natural Resources, Construction and Maintenance Occupations by Sex
| Occupation | Male | Female |
| Farming, Fishing & Forestry | 27 (100.0%) | 0 (0.0%) |
| Construction & Extraction | 38 (100.0%) | 0 (0.0%) |
| Installation, Maintenance & Repair | 76 (80.8%) | 18 (19.2%) |
| Total (Category) | 141 (88.7%) | 18 (11.3%) |
| Total (Overall) | 2,247 (50.1%) | 2,241 (49.9%) |
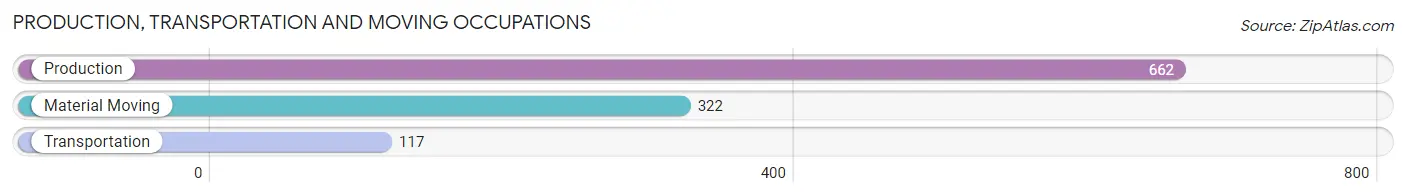
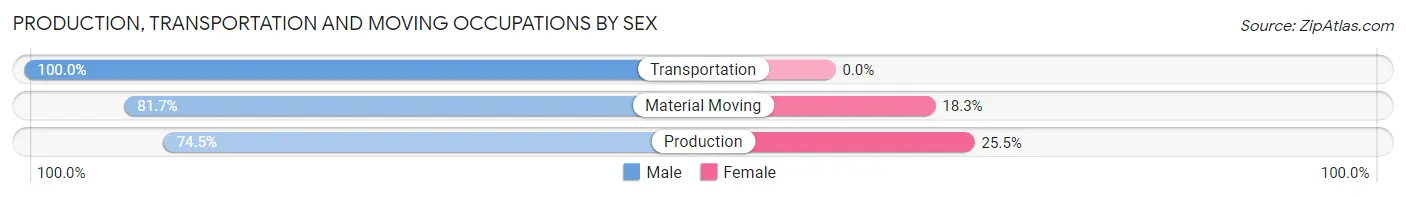
Production, Transportation and Moving Occupations
The most common Production, Transportation and Moving occupations in Sheboygan Falls are Production (662 | 14.7%), Material Moving (322 | 7.2%), and Transportation (117 | 2.6%).
Production, Transportation and Moving Occupations by Sex
| Occupation | Male | Female |
| Production | 493 (74.5%) | 169 (25.5%) |
| Transportation | 117 (100.0%) | 0 (0.0%) |
| Material Moving | 263 (81.7%) | 59 (18.3%) |
| Total (Category) | 873 (79.3%) | 228 (20.7%) |
| Total (Overall) | 2,247 (50.1%) | 2,241 (49.9%) |
Employment Industries by Sex in Sheboygan Falls
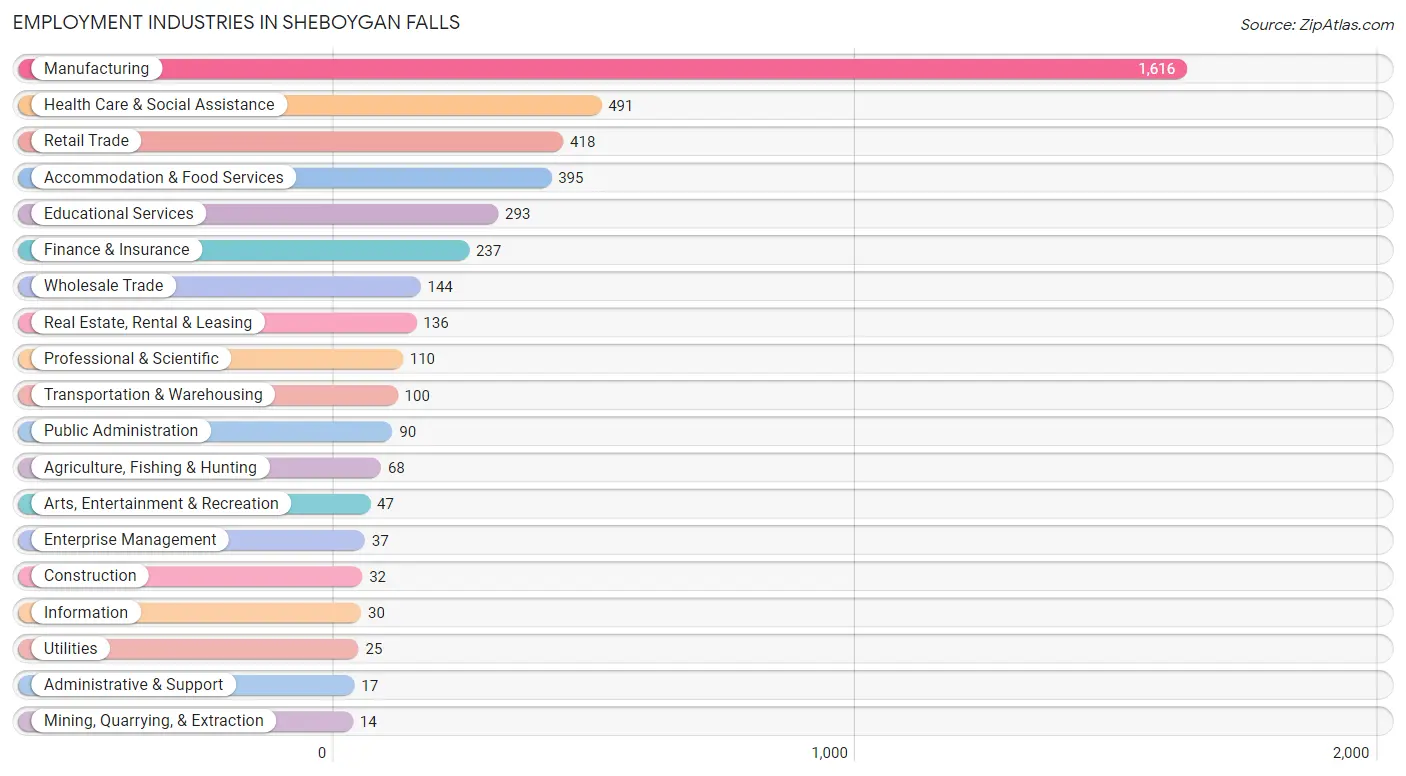
Employment Industries in Sheboygan Falls
The major employment industries in Sheboygan Falls include Manufacturing (1,616 | 36.0%), Health Care & Social Assistance (491 | 10.9%), Retail Trade (418 | 9.3%), Accommodation & Food Services (395 | 8.8%), and Educational Services (293 | 6.5%).
Employment Industries by Sex in Sheboygan Falls
The Sheboygan Falls industries that see more men than women are Construction (100.0%), Utilities (100.0%), and Administrative & Support (100.0%), whereas the industries that tend to have a higher number of women are Mining, Quarrying, & Extraction (100.0%), Enterprise Management (100.0%), and Arts, Entertainment & Recreation (100.0%).
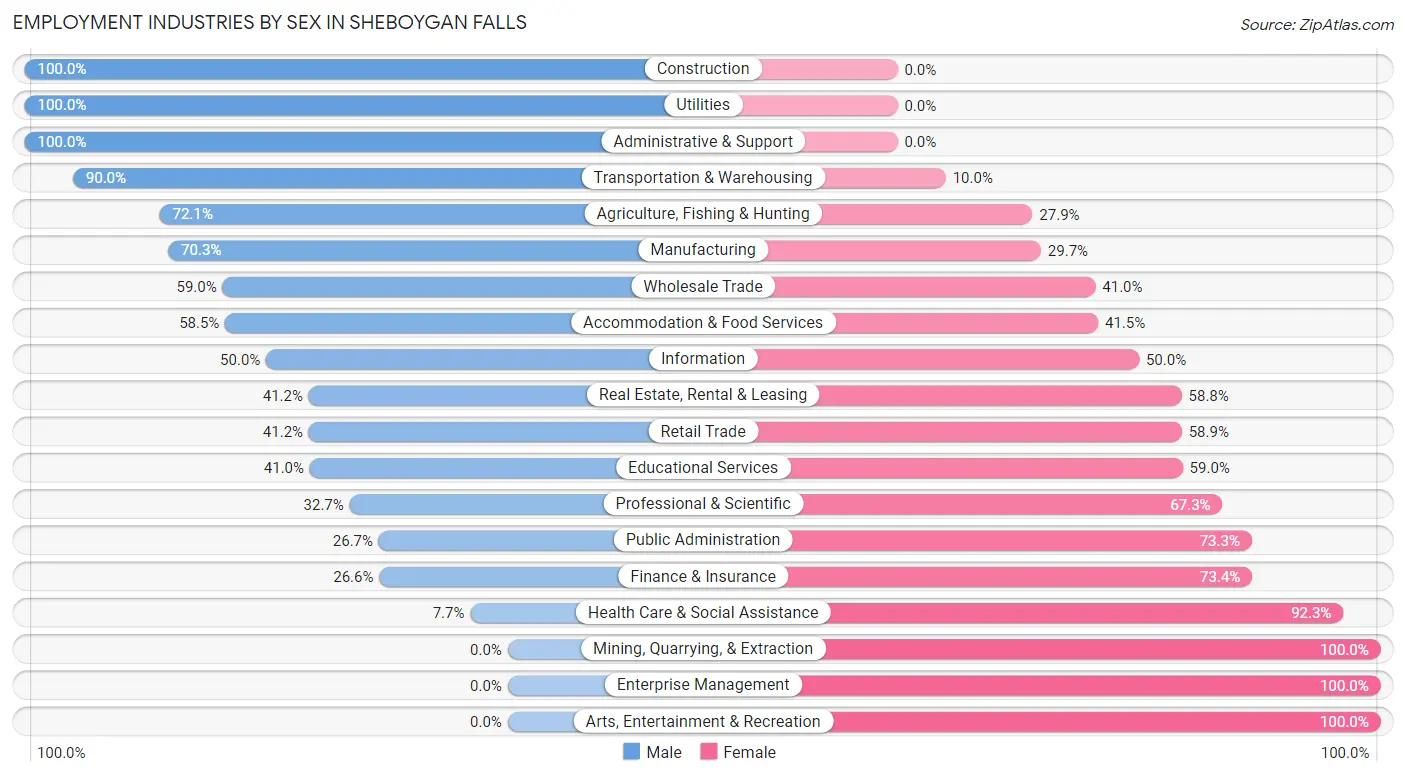
| Industry | Male | Female |
| Agriculture, Fishing & Hunting | 49 (72.1%) | 19 (27.9%) |
| Mining, Quarrying, & Extraction | 0 (0.0%) | 14 (100.0%) |
| Construction | 32 (100.0%) | 0 (0.0%) |
| Manufacturing | 1,136 (70.3%) | 480 (29.7%) |
| Wholesale Trade | 85 (59.0%) | 59 (41.0%) |
| Retail Trade | 172 (41.1%) | 246 (58.9%) |
| Transportation & Warehousing | 90 (90.0%) | 10 (10.0%) |
| Utilities | 25 (100.0%) | 0 (0.0%) |
| Information | 15 (50.0%) | 15 (50.0%) |
| Finance & Insurance | 63 (26.6%) | 174 (73.4%) |
| Real Estate, Rental & Leasing | 56 (41.2%) | 80 (58.8%) |
| Professional & Scientific | 36 (32.7%) | 74 (67.3%) |
| Enterprise Management | 0 (0.0%) | 37 (100.0%) |
| Administrative & Support | 17 (100.0%) | 0 (0.0%) |
| Educational Services | 120 (41.0%) | 173 (59.0%) |
| Health Care & Social Assistance | 38 (7.7%) | 453 (92.3%) |
| Arts, Entertainment & Recreation | 0 (0.0%) | 47 (100.0%) |
| Accommodation & Food Services | 231 (58.5%) | 164 (41.5%) |
| Public Administration | 24 (26.7%) | 66 (73.3%) |
| Total | 2,247 (50.1%) | 2,241 (49.9%) |
Education in Sheboygan Falls
School Enrollment in Sheboygan Falls
The most common levels of schooling among the 2,028 students in Sheboygan Falls are middle school (637 | 31.4%), college / undergraduate (463 | 22.8%), and elementary school (381 | 18.8%).
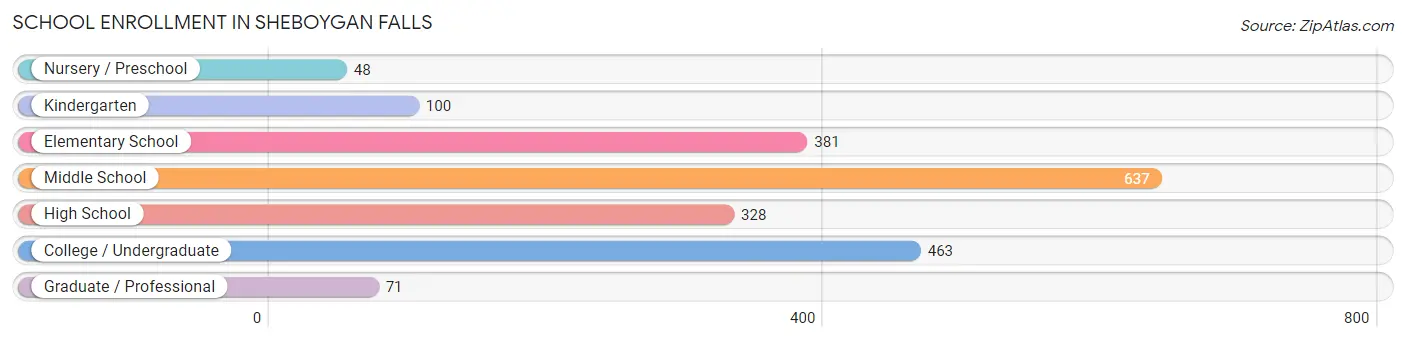
| School Level | # Students | % Students |
| Nursery / Preschool | 48 | 2.4% |
| Kindergarten | 100 | 4.9% |
| Elementary School | 381 | 18.8% |
| Middle School | 637 | 31.4% |
| High School | 328 | 16.2% |
| College / Undergraduate | 463 | 22.8% |
| Graduate / Professional | 71 | 3.5% |
| Total | 2,028 | 100.0% |
School Enrollment by Age by Funding Source in Sheboygan Falls
Out of a total of 2,028 students who are enrolled in schools in Sheboygan Falls, 290 (14.3%) attend a private institution, while the remaining 1,738 (85.7%) are enrolled in public schools. The age group of 3 to 4 year olds has the highest likelihood of being enrolled in private schools, with 25 (100.0% in the age bracket) enrolled. Conversely, the age group of 5 to 9 year old has the lowest likelihood of being enrolled in a private school, with 390 (95.8% in the age bracket) attending a public institution.
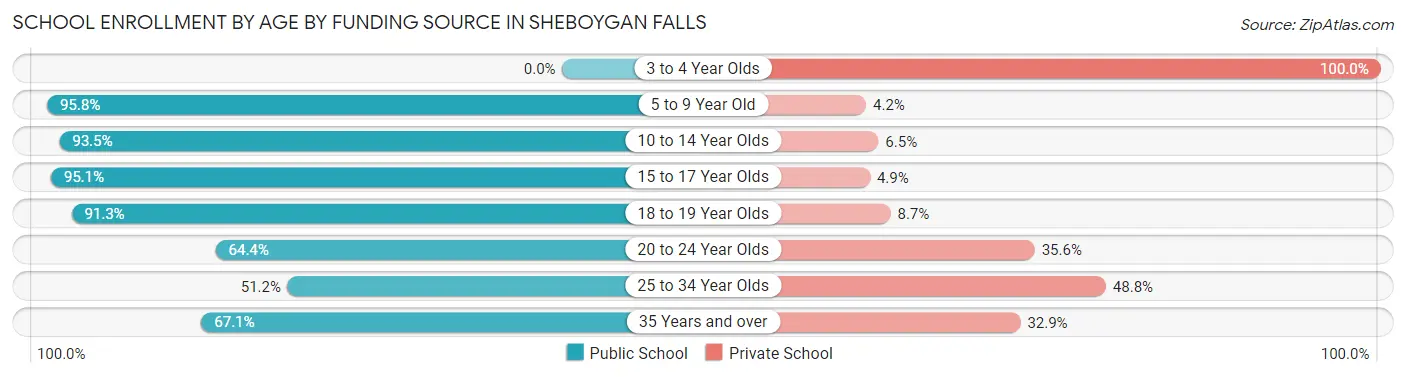
| Age Bracket | Public School | Private School |
| 3 to 4 Year Olds | 0 (0.0%) | 25 (100.0%) |
| 5 to 9 Year Old | 390 (95.8%) | 17 (4.2%) |
| 10 to 14 Year Olds | 708 (93.5%) | 49 (6.5%) |
| 15 to 17 Year Olds | 253 (95.1%) | 13 (4.9%) |
| 18 to 19 Year Olds | 115 (91.3%) | 11 (8.7%) |
| 20 to 24 Year Olds | 152 (64.4%) | 84 (35.6%) |
| 25 to 34 Year Olds | 66 (51.2%) | 63 (48.8%) |
| 35 Years and over | 55 (67.1%) | 27 (32.9%) |
| Total | 1,738 (85.7%) | 290 (14.3%) |
Educational Attainment by Field of Study in Sheboygan Falls
Business (303 | 20.1%), engineering (185 | 12.3%), education (180 | 11.9%), bio, nature & agricultural (144 | 9.6%), and science & technology (112 | 7.4%) are the most common fields of study among 1,506 individuals in Sheboygan Falls who have obtained a bachelor's degree or higher.
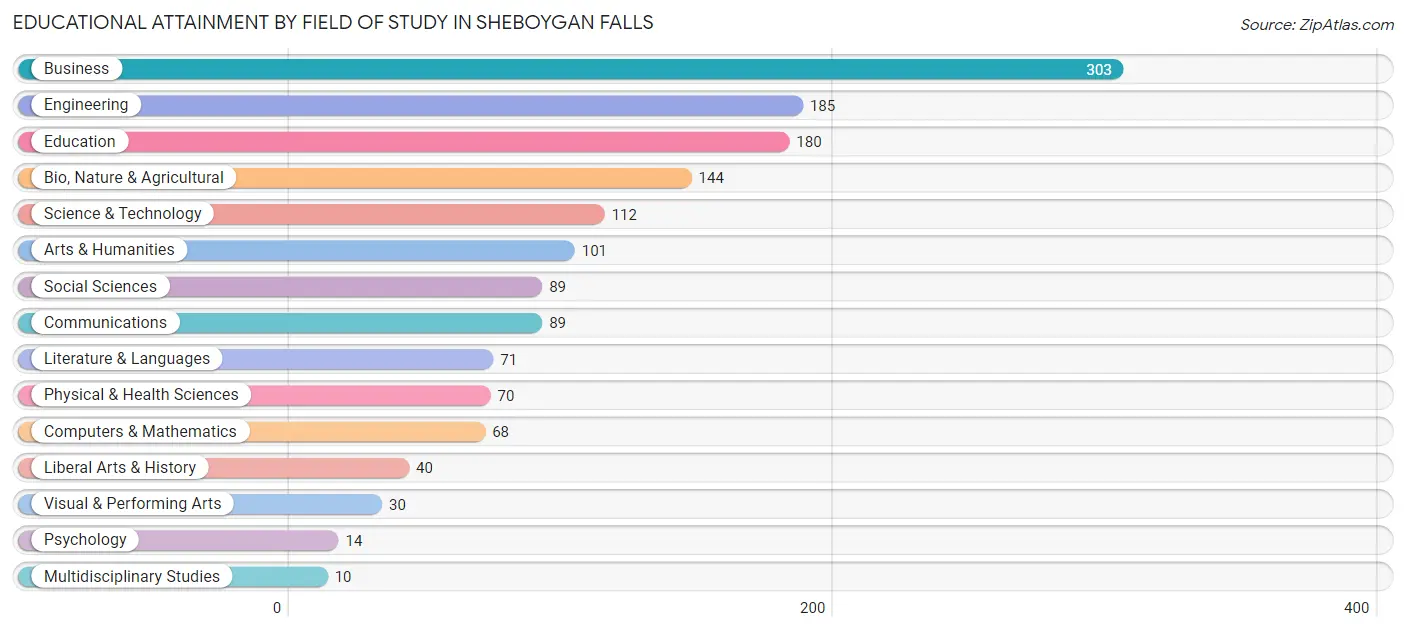
| Field of Study | # Graduates | % Graduates |
| Computers & Mathematics | 68 | 4.5% |
| Bio, Nature & Agricultural | 144 | 9.6% |
| Physical & Health Sciences | 70 | 4.6% |
| Psychology | 14 | 0.9% |
| Social Sciences | 89 | 5.9% |
| Engineering | 185 | 12.3% |
| Multidisciplinary Studies | 10 | 0.7% |
| Science & Technology | 112 | 7.4% |
| Business | 303 | 20.1% |
| Education | 180 | 11.9% |
| Literature & Languages | 71 | 4.7% |
| Liberal Arts & History | 40 | 2.7% |
| Visual & Performing Arts | 30 | 2.0% |
| Communications | 89 | 5.9% |
| Arts & Humanities | 101 | 6.7% |
| Total | 1,506 | 100.0% |
Transportation & Commute in Sheboygan Falls
Vehicle Availability by Sex in Sheboygan Falls
The most prevalent vehicle ownership categories in Sheboygan Falls are males with 2 vehicles (1,136, accounting for 51.4%) and females with 2 vehicles (1,135, making up 50.9%).
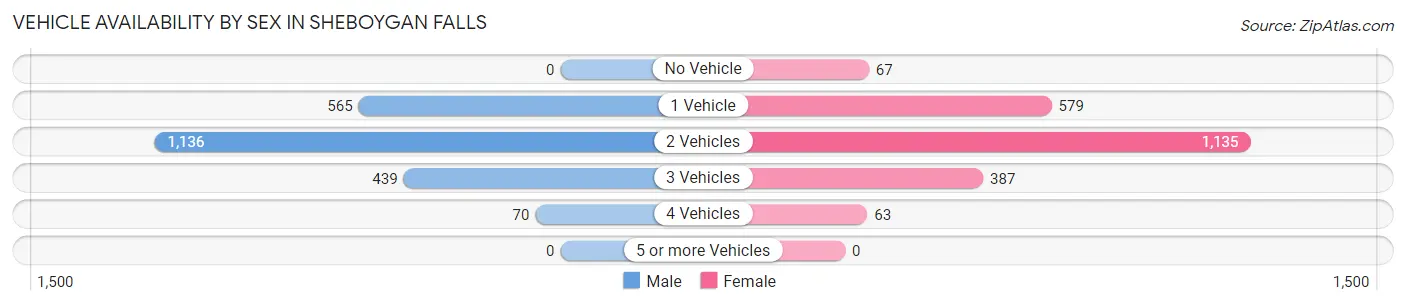
| Vehicles Available | Male | Female |
| No Vehicle | 0 (0.0%) | 67 (3.0%) |
| 1 Vehicle | 565 (25.6%) | 579 (26.0%) |
| 2 Vehicles | 1,136 (51.4%) | 1,135 (50.9%) |
| 3 Vehicles | 439 (19.9%) | 387 (17.3%) |
| 4 Vehicles | 70 (3.2%) | 63 (2.8%) |
| 5 or more Vehicles | 0 (0.0%) | 0 (0.0%) |
| Total | 2,210 (100.0%) | 2,231 (100.0%) |
Commute Time in Sheboygan Falls
The most frequently occuring commute durations in Sheboygan Falls are 10 to 14 minutes (1,013 commuters, 25.5%), 15 to 19 minutes (886 commuters, 22.3%), and 5 to 9 minutes (819 commuters, 20.6%).
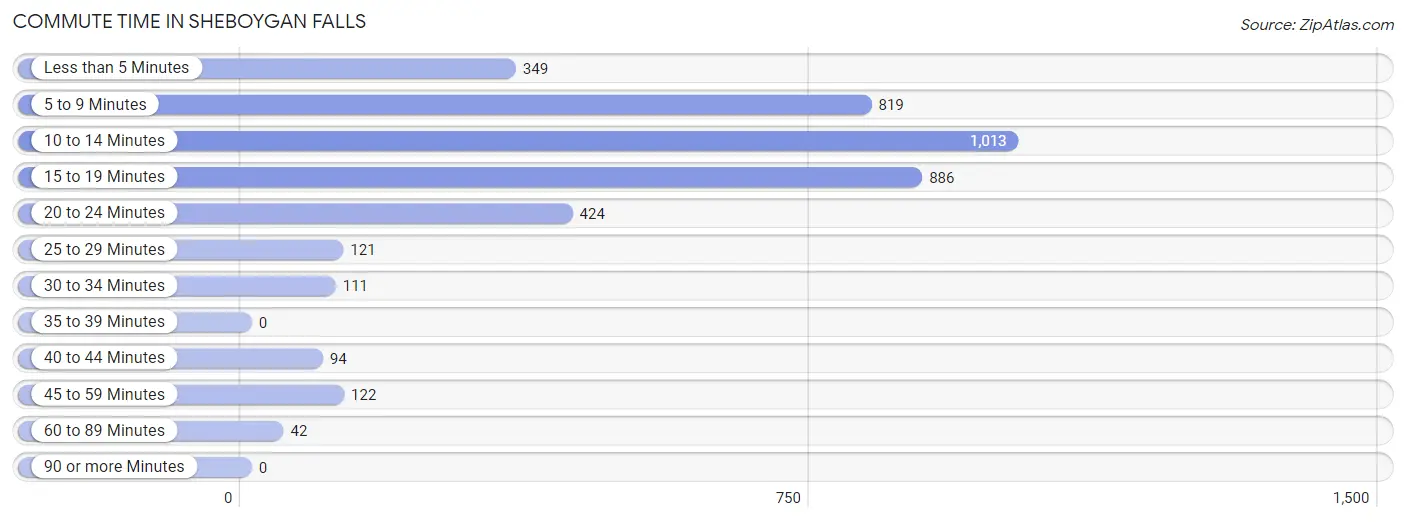
| Commute Time | # Commuters | % Commuters |
| Less than 5 Minutes | 349 | 8.8% |
| 5 to 9 Minutes | 819 | 20.6% |
| 10 to 14 Minutes | 1,013 | 25.5% |
| 15 to 19 Minutes | 886 | 22.3% |
| 20 to 24 Minutes | 424 | 10.6% |
| 25 to 29 Minutes | 121 | 3.0% |
| 30 to 34 Minutes | 111 | 2.8% |
| 35 to 39 Minutes | 0 | 0.0% |
| 40 to 44 Minutes | 94 | 2.4% |
| 45 to 59 Minutes | 122 | 3.1% |
| 60 to 89 Minutes | 42 | 1.1% |
| 90 or more Minutes | 0 | 0.0% |
Commute Time by Sex in Sheboygan Falls
The most common commute times in Sheboygan Falls are 15 to 19 minutes (487 commuters, 23.8%) for males and 10 to 14 minutes (577 commuters, 29.9%) for females.
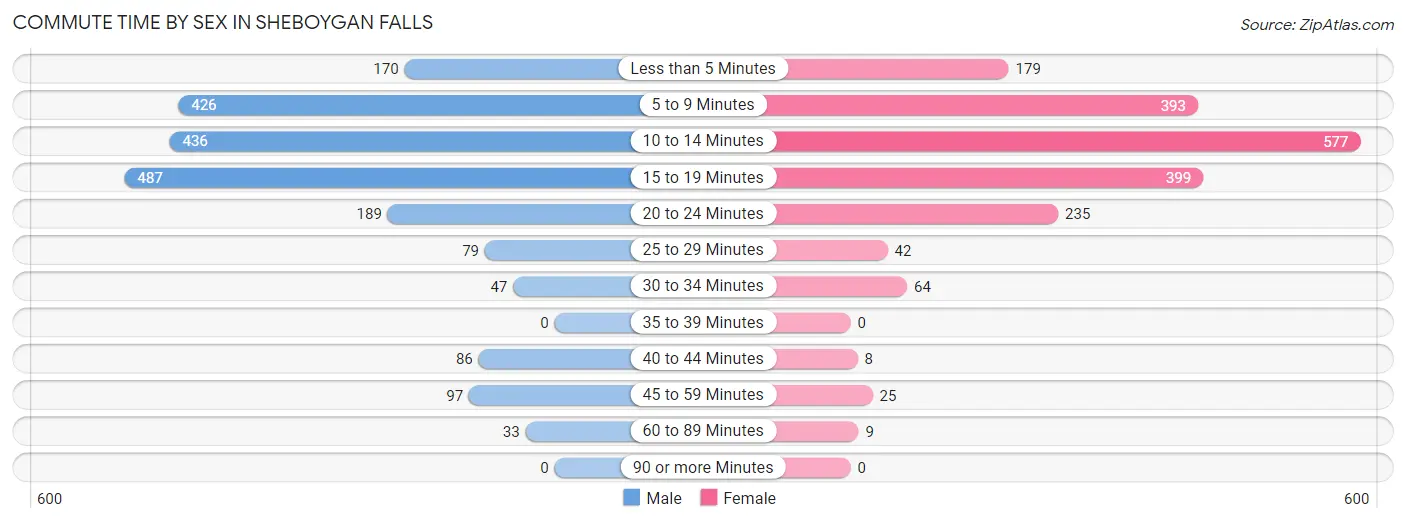
| Commute Time | Male | Female |
| Less than 5 Minutes | 170 (8.3%) | 179 (9.3%) |
| 5 to 9 Minutes | 426 (20.8%) | 393 (20.3%) |
| 10 to 14 Minutes | 436 (21.3%) | 577 (29.9%) |
| 15 to 19 Minutes | 487 (23.8%) | 399 (20.7%) |
| 20 to 24 Minutes | 189 (9.2%) | 235 (12.2%) |
| 25 to 29 Minutes | 79 (3.8%) | 42 (2.2%) |
| 30 to 34 Minutes | 47 (2.3%) | 64 (3.3%) |
| 35 to 39 Minutes | 0 (0.0%) | 0 (0.0%) |
| 40 to 44 Minutes | 86 (4.2%) | 8 (0.4%) |
| 45 to 59 Minutes | 97 (4.7%) | 25 (1.3%) |
| 60 to 89 Minutes | 33 (1.6%) | 9 (0.5%) |
| 90 or more Minutes | 0 (0.0%) | 0 (0.0%) |
Time of Departure to Work by Sex in Sheboygan Falls
The most frequent times of departure to work in Sheboygan Falls are 4:00 PM to 11:59 PM (316, 15.4%) for males and 7:00 AM to 7:29 AM (489, 25.3%) for females.
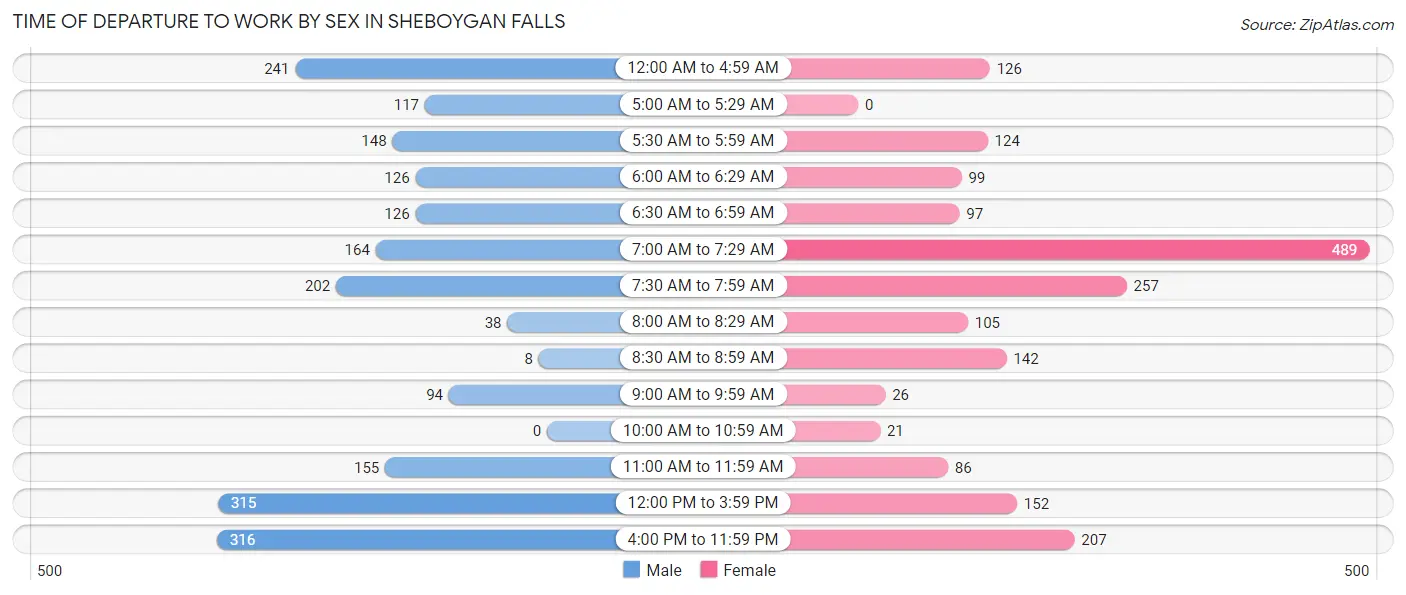
| Time of Departure | Male | Female |
| 12:00 AM to 4:59 AM | 241 (11.8%) | 126 (6.5%) |
| 5:00 AM to 5:29 AM | 117 (5.7%) | 0 (0.0%) |
| 5:30 AM to 5:59 AM | 148 (7.2%) | 124 (6.4%) |
| 6:00 AM to 6:29 AM | 126 (6.1%) | 99 (5.1%) |
| 6:30 AM to 6:59 AM | 126 (6.1%) | 97 (5.0%) |
| 7:00 AM to 7:29 AM | 164 (8.0%) | 489 (25.3%) |
| 7:30 AM to 7:59 AM | 202 (9.9%) | 257 (13.3%) |
| 8:00 AM to 8:29 AM | 38 (1.8%) | 105 (5.4%) |
| 8:30 AM to 8:59 AM | 8 (0.4%) | 142 (7.3%) |
| 9:00 AM to 9:59 AM | 94 (4.6%) | 26 (1.3%) |
| 10:00 AM to 10:59 AM | 0 (0.0%) | 21 (1.1%) |
| 11:00 AM to 11:59 AM | 155 (7.6%) | 86 (4.4%) |
| 12:00 PM to 3:59 PM | 315 (15.4%) | 152 (7.9%) |
| 4:00 PM to 11:59 PM | 316 (15.4%) | 207 (10.7%) |
| Total | 2,050 (100.0%) | 1,931 (100.0%) |
Housing Occupancy in Sheboygan Falls
Occupancy by Ownership in Sheboygan Falls
Of the total 3,722 dwellings in Sheboygan Falls, owner-occupied units account for 2,517 (67.6%), while renter-occupied units make up 1,205 (32.4%).
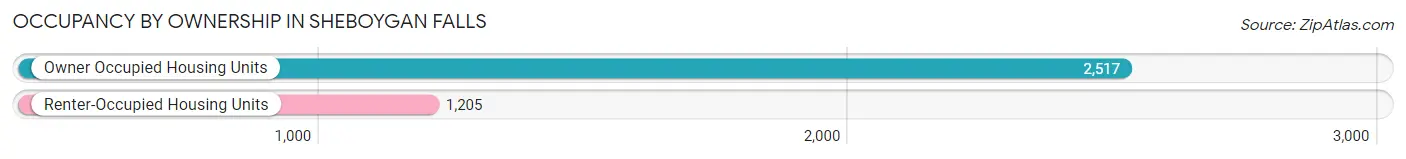
| Occupancy | # Housing Units | % Housing Units |
| Owner Occupied Housing Units | 2,517 | 67.6% |
| Renter-Occupied Housing Units | 1,205 | 32.4% |
| Total Occupied Housing Units | 3,722 | 100.0% |
Occupancy by Household Size in Sheboygan Falls
| Household Size | # Housing Units | % Housing Units |
| 1-Person Household | 1,089 | 29.3% |
| 2-Person Household | 1,683 | 45.2% |
| 3-Person Household | 426 | 11.5% |
| 4+ Person Household | 524 | 14.1% |
| Total Housing Units | 3,722 | 100.0% |
Occupancy by Ownership by Household Size in Sheboygan Falls
| Household Size | Owner-occupied | Renter-occupied |
| 1-Person Household | 511 (46.9%) | 578 (53.1%) |
| 2-Person Household | 1,295 (76.9%) | 388 (23.1%) |
| 3-Person Household | 299 (70.2%) | 127 (29.8%) |
| 4+ Person Household | 412 (78.6%) | 112 (21.4%) |
| Total Housing Units | 2,517 (67.6%) | 1,205 (32.4%) |
Occupancy by Educational Attainment in Sheboygan Falls
| Household Size | Owner-occupied | Renter-occupied |
| Less than High School | 47 (38.2%) | 76 (61.8%) |
| High School Diploma | 874 (75.5%) | 284 (24.5%) |
| College/Associate Degree | 861 (61.3%) | 543 (38.7%) |
| Bachelor's Degree or higher | 735 (70.9%) | 302 (29.1%) |
Occupancy by Age of Householder in Sheboygan Falls
| Age Bracket | # Households | % Households |
| Under 35 Years | 674 | 18.1% |
| 35 to 44 Years | 645 | 17.3% |
| 45 to 54 Years | 607 | 16.3% |
| 55 to 64 Years | 801 | 21.5% |
| 65 to 74 Years | 509 | 13.7% |
| 75 to 84 Years | 395 | 10.6% |
| 85 Years and Over | 91 | 2.4% |
| Total | 3,722 | 100.0% |
Housing Finances in Sheboygan Falls
Median Income by Occupancy in Sheboygan Falls
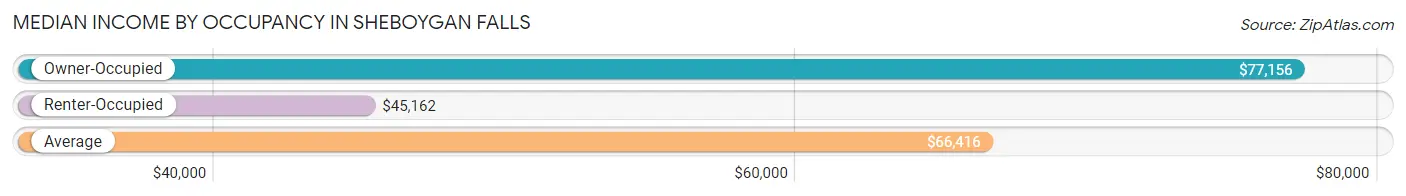
| Occupancy Type | # Households | Median Income |
| Owner-Occupied | 2,517 (67.6%) | $77,156 |
| Renter-Occupied | 1,205 (32.4%) | $45,162 |
| Average | 3,722 (100.0%) | $66,416 |
Occupancy by Householder Income Bracket in Sheboygan Falls
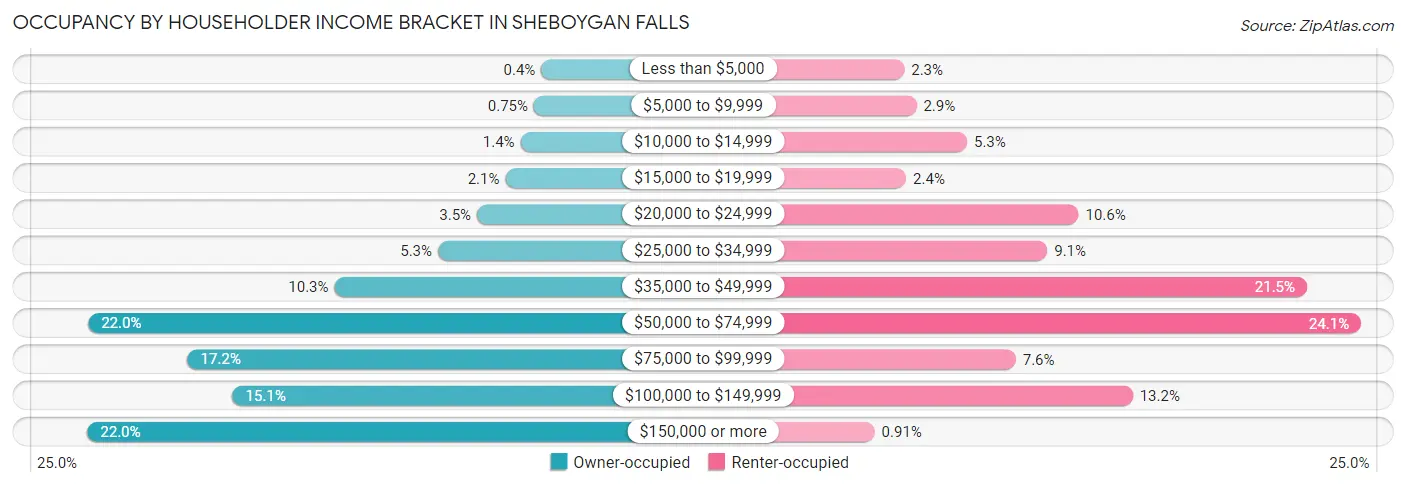
| Income Bracket | Owner-occupied | Renter-occupied |
| Less than $5,000 | 10 (0.4%) | 28 (2.3%) |
| $5,000 to $9,999 | 19 (0.7%) | 35 (2.9%) |
| $10,000 to $14,999 | 35 (1.4%) | 64 (5.3%) |
| $15,000 to $19,999 | 53 (2.1%) | 29 (2.4%) |
| $20,000 to $24,999 | 87 (3.5%) | 128 (10.6%) |
| $25,000 to $34,999 | 134 (5.3%) | 110 (9.1%) |
| $35,000 to $49,999 | 258 (10.2%) | 259 (21.5%) |
| $50,000 to $74,999 | 553 (22.0%) | 290 (24.1%) |
| $75,000 to $99,999 | 434 (17.2%) | 92 (7.6%) |
| $100,000 to $149,999 | 380 (15.1%) | 159 (13.2%) |
| $150,000 or more | 554 (22.0%) | 11 (0.9%) |
| Total | 2,517 (100.0%) | 1,205 (100.0%) |
Monthly Housing Cost Tiers in Sheboygan Falls
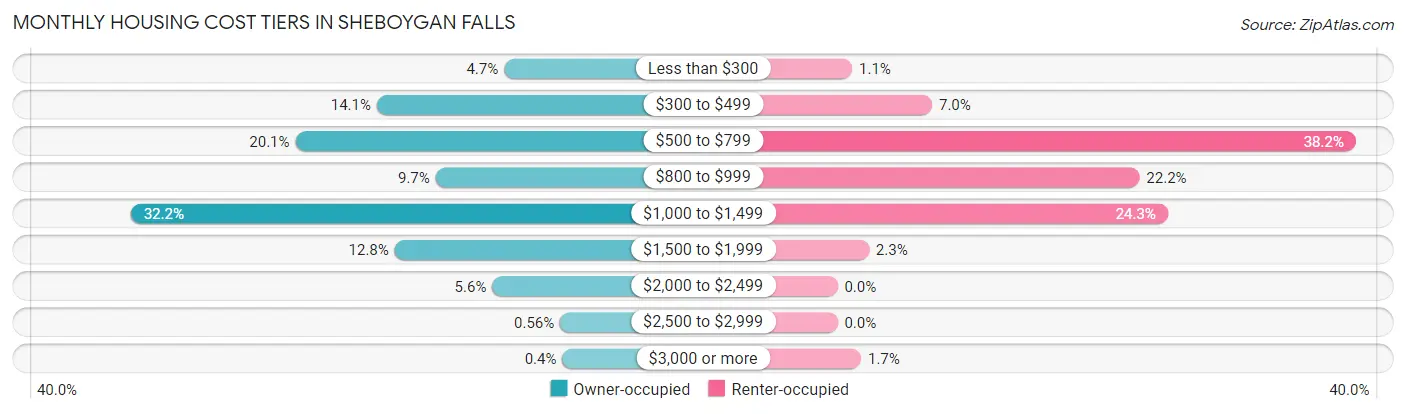
| Monthly Cost | Owner-occupied | Renter-occupied |
| Less than $300 | 118 (4.7%) | 13 (1.1%) |
| $300 to $499 | 354 (14.1%) | 84 (7.0%) |
| $500 to $799 | 505 (20.1%) | 460 (38.2%) |
| $800 to $999 | 245 (9.7%) | 268 (22.2%) |
| $1,000 to $1,499 | 810 (32.2%) | 293 (24.3%) |
| $1,500 to $1,999 | 321 (12.8%) | 28 (2.3%) |
| $2,000 to $2,499 | 140 (5.6%) | 0 (0.0%) |
| $2,500 to $2,999 | 14 (0.6%) | 0 (0.0%) |
| $3,000 or more | 10 (0.4%) | 21 (1.7%) |
| Total | 2,517 (100.0%) | 1,205 (100.0%) |
Physical Housing Characteristics in Sheboygan Falls
Housing Structures in Sheboygan Falls
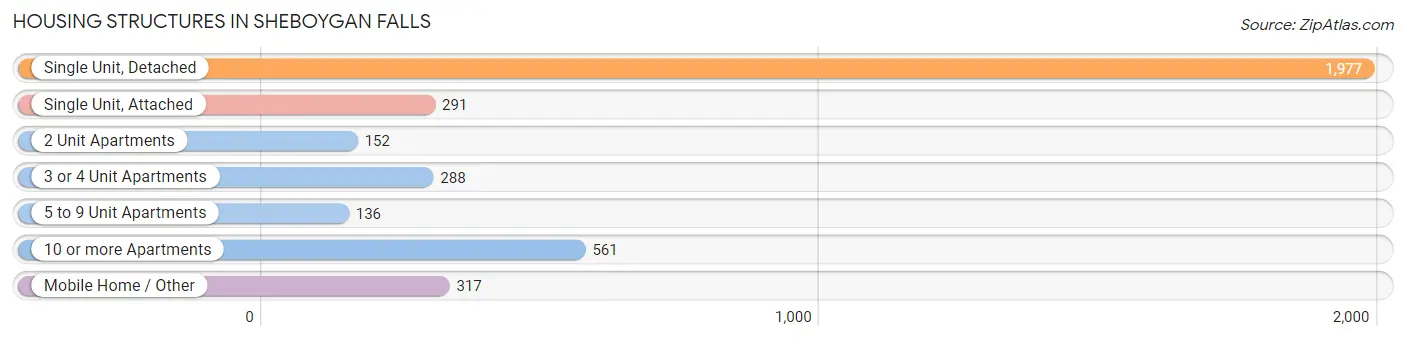
| Structure Type | # Housing Units | % Housing Units |
| Single Unit, Detached | 1,977 | 53.1% |
| Single Unit, Attached | 291 | 7.8% |
| 2 Unit Apartments | 152 | 4.1% |
| 3 or 4 Unit Apartments | 288 | 7.7% |
| 5 to 9 Unit Apartments | 136 | 3.6% |
| 10 or more Apartments | 561 | 15.1% |
| Mobile Home / Other | 317 | 8.5% |
| Total | 3,722 | 100.0% |
Housing Structures by Occupancy in Sheboygan Falls
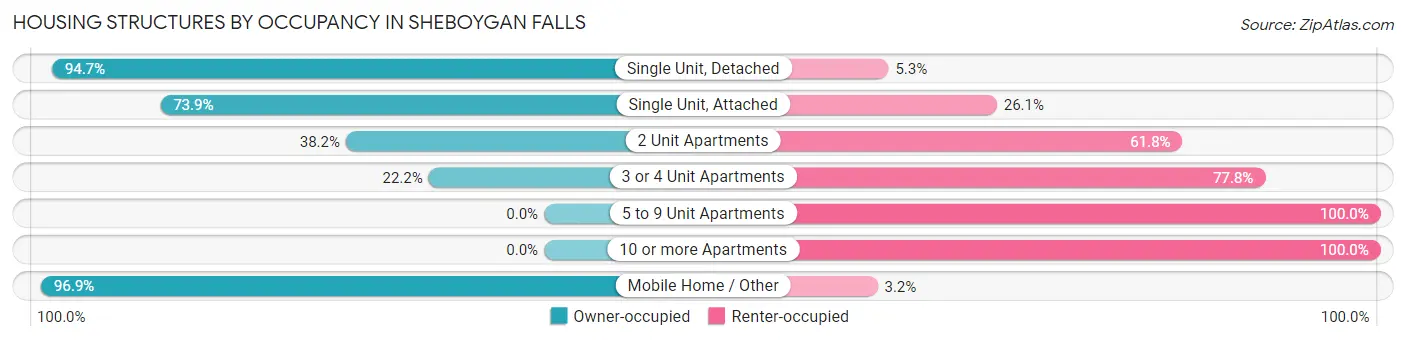
| Structure Type | Owner-occupied | Renter-occupied |
| Single Unit, Detached | 1,873 (94.7%) | 104 (5.3%) |
| Single Unit, Attached | 215 (73.9%) | 76 (26.1%) |
| 2 Unit Apartments | 58 (38.2%) | 94 (61.8%) |
| 3 or 4 Unit Apartments | 64 (22.2%) | 224 (77.8%) |
| 5 to 9 Unit Apartments | 0 (0.0%) | 136 (100.0%) |
| 10 or more Apartments | 0 (0.0%) | 561 (100.0%) |
| Mobile Home / Other | 307 (96.9%) | 10 (3.2%) |
| Total | 2,517 (67.6%) | 1,205 (32.4%) |
Housing Structures by Number of Rooms in Sheboygan Falls
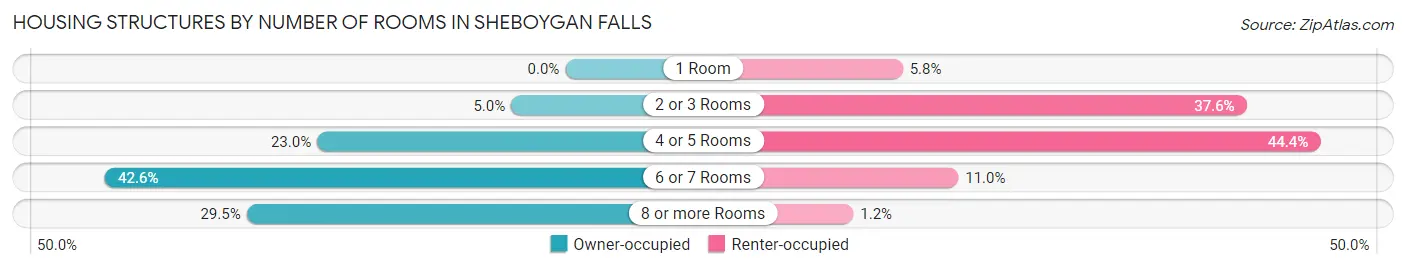
| Number of Rooms | Owner-occupied | Renter-occupied |
| 1 Room | 0 (0.0%) | 70 (5.8%) |
| 2 or 3 Rooms | 126 (5.0%) | 453 (37.6%) |
| 4 or 5 Rooms | 578 (23.0%) | 535 (44.4%) |
| 6 or 7 Rooms | 1,071 (42.5%) | 132 (11.0%) |
| 8 or more Rooms | 742 (29.5%) | 15 (1.2%) |
| Total | 2,517 (100.0%) | 1,205 (100.0%) |
Housing Structure by Heating Type in Sheboygan Falls
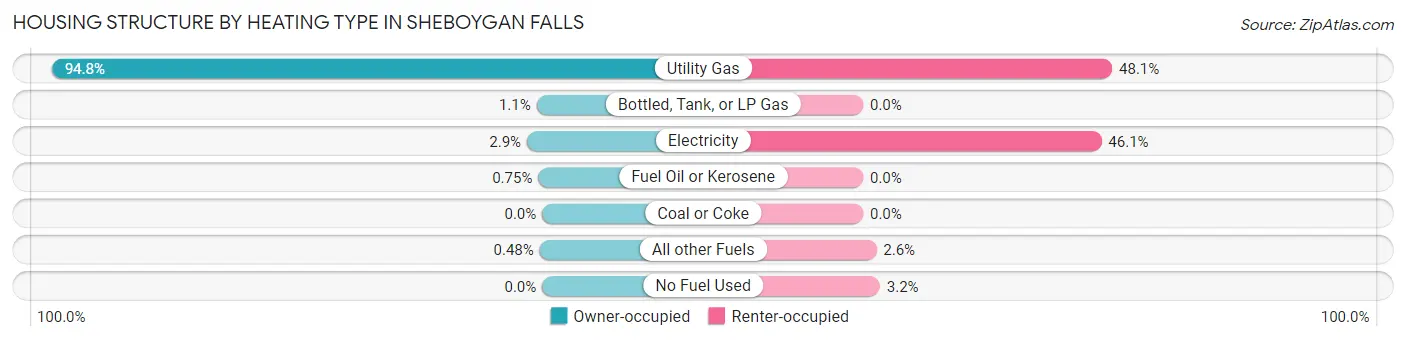
| Heating Type | Owner-occupied | Renter-occupied |
| Utility Gas | 2,385 (94.8%) | 580 (48.1%) |
| Bottled, Tank, or LP Gas | 27 (1.1%) | 0 (0.0%) |
| Electricity | 74 (2.9%) | 555 (46.1%) |
| Fuel Oil or Kerosene | 19 (0.7%) | 0 (0.0%) |
| Coal or Coke | 0 (0.0%) | 0 (0.0%) |
| All other Fuels | 12 (0.5%) | 31 (2.6%) |
| No Fuel Used | 0 (0.0%) | 39 (3.2%) |
| Total | 2,517 (100.0%) | 1,205 (100.0%) |
Household Vehicle Usage in Sheboygan Falls
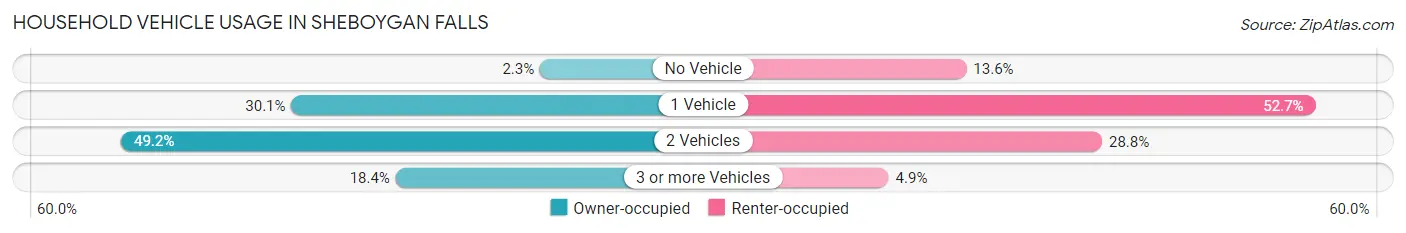
| Vehicles per Household | Owner-occupied | Renter-occupied |
| No Vehicle | 57 (2.3%) | 164 (13.6%) |
| 1 Vehicle | 758 (30.1%) | 635 (52.7%) |
| 2 Vehicles | 1,238 (49.2%) | 347 (28.8%) |
| 3 or more Vehicles | 464 (18.4%) | 59 (4.9%) |
| Total | 2,517 (100.0%) | 1,205 (100.0%) |
Real Estate & Mortgages in Sheboygan Falls
Real Estate and Mortgage Overview in Sheboygan Falls
| Characteristic | Without Mortgage | With Mortgage |
| Housing Units | 996 | 1,521 |
| Median Property Value | $177,100 | $189,400 |
| Median Household Income | $59,444 | $457 |
| Monthly Housing Costs | $528 | $10 |
| Real Estate Taxes | $2,982 | $119 |
Property Value by Mortgage Status in Sheboygan Falls
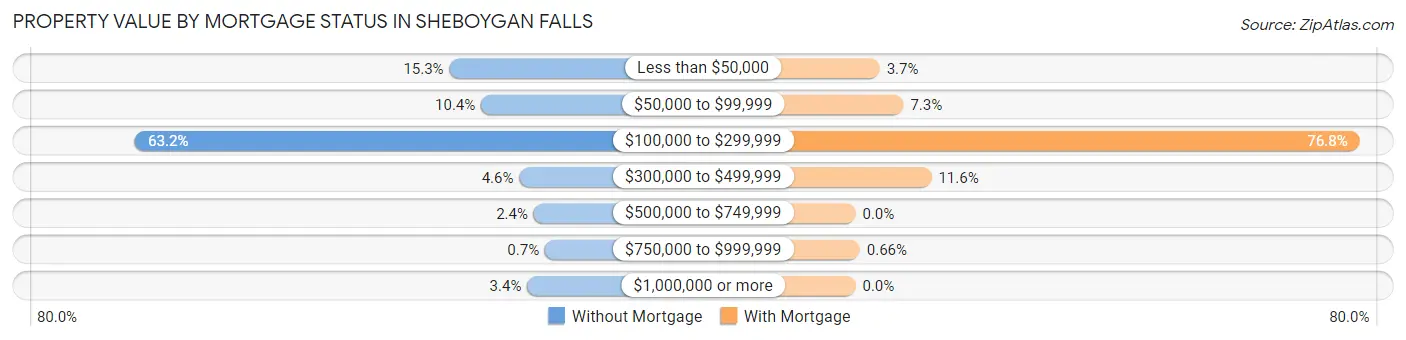
| Property Value | Without Mortgage | With Mortgage |
| Less than $50,000 | 152 (15.3%) | 56 (3.7%) |
| $50,000 to $99,999 | 104 (10.4%) | 111 (7.3%) |
| $100,000 to $299,999 | 629 (63.1%) | 1,168 (76.8%) |
| $300,000 to $499,999 | 46 (4.6%) | 176 (11.6%) |
| $500,000 to $749,999 | 24 (2.4%) | 0 (0.0%) |
| $750,000 to $999,999 | 7 (0.7%) | 10 (0.7%) |
| $1,000,000 or more | 34 (3.4%) | 0 (0.0%) |
| Total | 996 (100.0%) | 1,521 (100.0%) |
Household Income by Mortgage Status in Sheboygan Falls
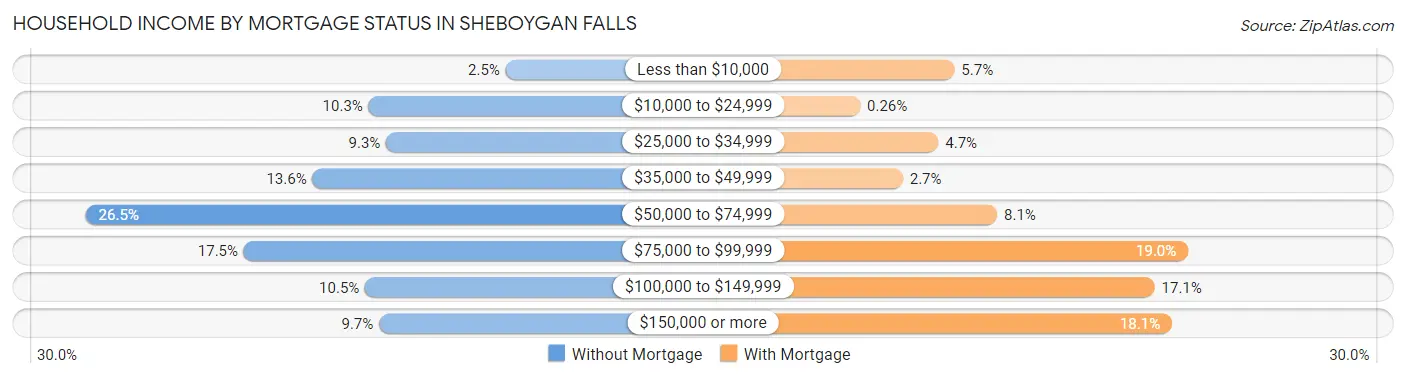
| Household Income | Without Mortgage | With Mortgage |
| Less than $10,000 | 25 (2.5%) | 86 (5.7%) |
| $10,000 to $24,999 | 103 (10.3%) | 4 (0.3%) |
| $25,000 to $34,999 | 93 (9.3%) | 72 (4.7%) |
| $35,000 to $49,999 | 135 (13.6%) | 41 (2.7%) |
| $50,000 to $74,999 | 264 (26.5%) | 123 (8.1%) |
| $75,000 to $99,999 | 174 (17.5%) | 289 (19.0%) |
| $100,000 to $149,999 | 105 (10.5%) | 260 (17.1%) |
| $150,000 or more | 97 (9.7%) | 275 (18.1%) |
| Total | 996 (100.0%) | 1,521 (100.0%) |
Property Value to Household Income Ratio in Sheboygan Falls
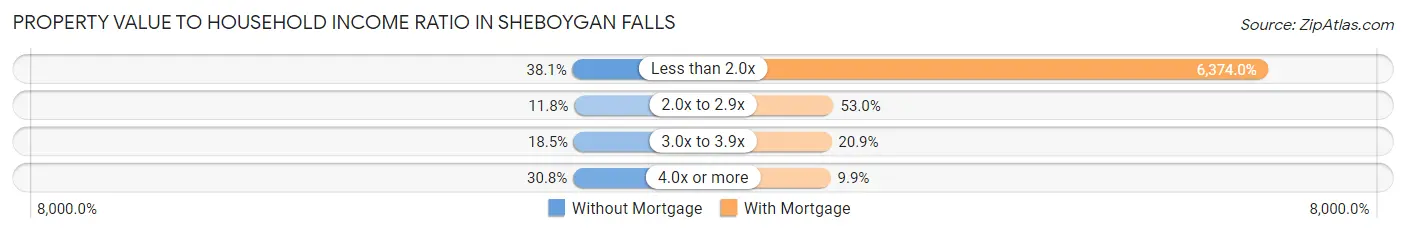
| Value-to-Income Ratio | Without Mortgage | With Mortgage |
| Less than 2.0x | 379 (38.1%) | 96,949 (6,374.0%) |
| 2.0x to 2.9x | 117 (11.7%) | 806 (53.0%) |
| 3.0x to 3.9x | 184 (18.5%) | 318 (20.9%) |
| 4.0x or more | 307 (30.8%) | 150 (9.9%) |
| Total | 996 (100.0%) | 1,521 (100.0%) |
Real Estate Taxes by Mortgage Status in Sheboygan Falls
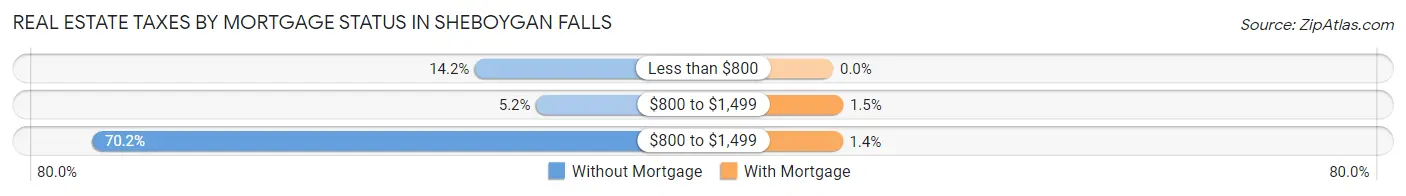
| Property Taxes | Without Mortgage | With Mortgage |
| Less than $800 | 141 (14.2%) | 0 (0.0%) |
| $800 to $1,499 | 52 (5.2%) | 22 (1.5%) |
| $800 to $1,499 | 699 (70.2%) | 21 (1.4%) |
| Total | 996 (100.0%) | 1,521 (100.0%) |
Health & Disability in Sheboygan Falls
Health Insurance Coverage by Age in Sheboygan Falls
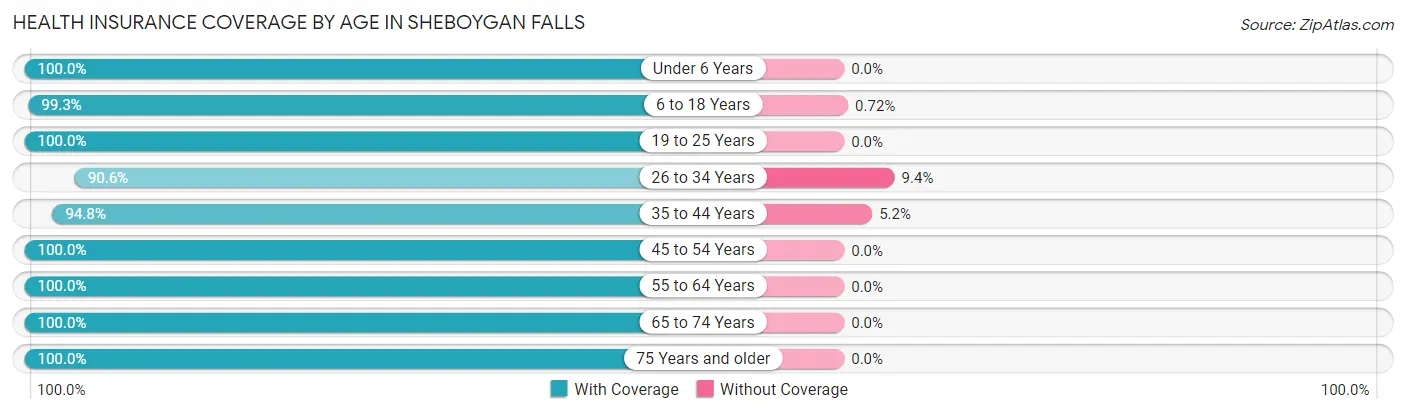
| Age Bracket | With Coverage | Without Coverage |
| Under 6 Years | 395 (100.0%) | 0 (0.0%) |
| 6 to 18 Years | 1,381 (99.3%) | 10 (0.7%) |
| 19 to 25 Years | 671 (100.0%) | 0 (0.0%) |
| 26 to 34 Years | 762 (90.6%) | 79 (9.4%) |
| 35 to 44 Years | 891 (94.8%) | 49 (5.2%) |
| 45 to 54 Years | 960 (100.0%) | 0 (0.0%) |
| 55 to 64 Years | 1,270 (100.0%) | 0 (0.0%) |
| 65 to 74 Years | 883 (100.0%) | 0 (0.0%) |
| 75 Years and older | 692 (100.0%) | 0 (0.0%) |
| Total | 7,905 (98.3%) | 138 (1.7%) |
Health Insurance Coverage by Citizenship Status in Sheboygan Falls
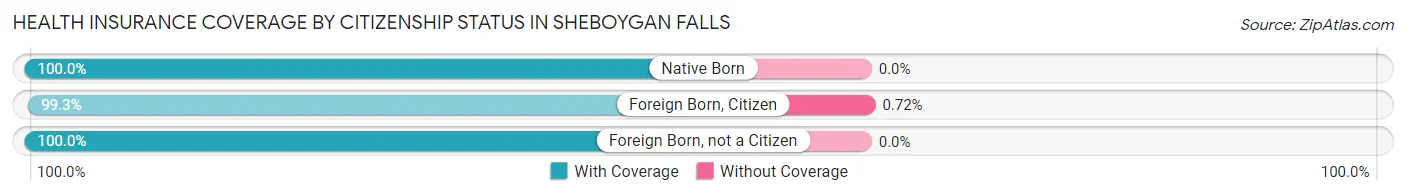
| Citizenship Status | With Coverage | Without Coverage |
| Native Born | 395 (100.0%) | 0 (0.0%) |
| Foreign Born, Citizen | 1,381 (99.3%) | 10 (0.7%) |
| Foreign Born, not a Citizen | 671 (100.0%) | 0 (0.0%) |
Health Insurance Coverage by Household Income in Sheboygan Falls
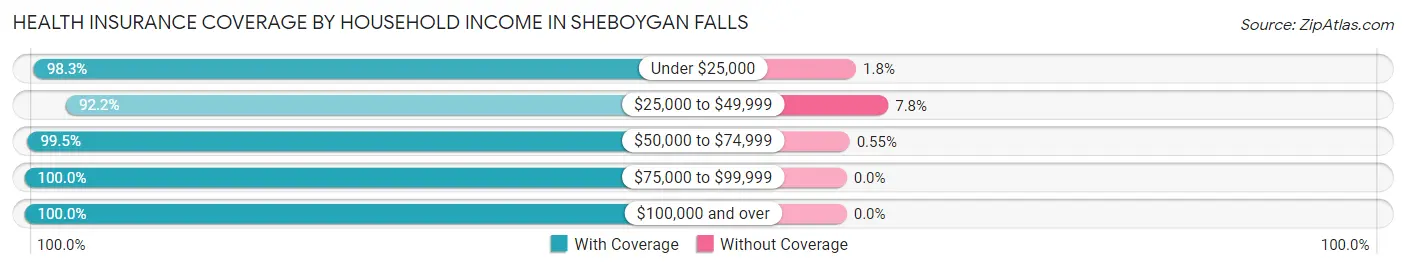
| Household Income | With Coverage | Without Coverage |
| Under $25,000 | 619 (98.3%) | 11 (1.8%) |
| $25,000 to $49,999 | 1,388 (92.2%) | 117 (7.8%) |
| $50,000 to $74,999 | 1,818 (99.5%) | 10 (0.5%) |
| $75,000 to $99,999 | 1,310 (100.0%) | 0 (0.0%) |
| $100,000 and over | 2,764 (100.0%) | 0 (0.0%) |
Public vs Private Health Insurance Coverage by Age in Sheboygan Falls
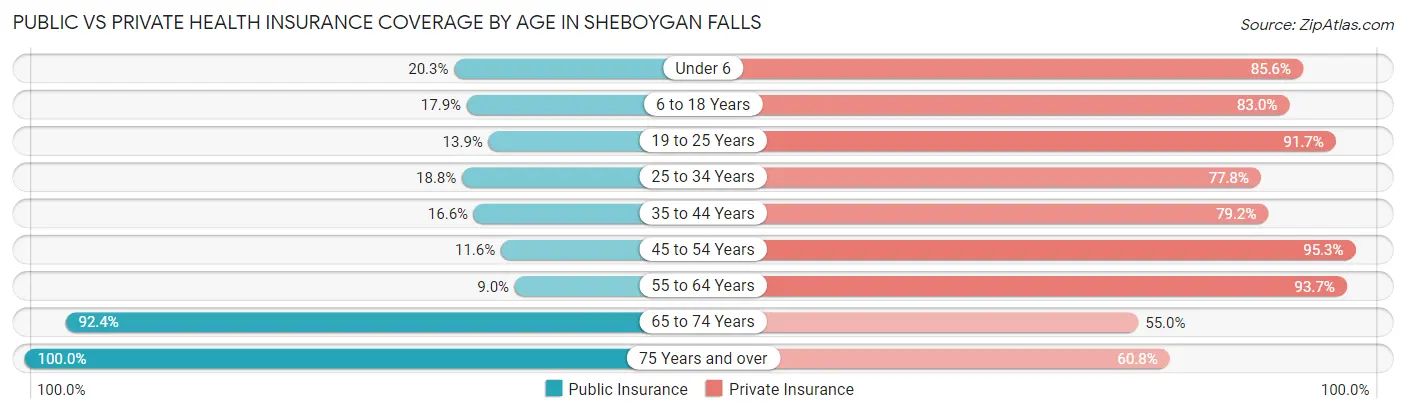
| Age Bracket | Public Insurance | Private Insurance |
| Under 6 | 80 (20.3%) | 338 (85.6%) |
| 6 to 18 Years | 249 (17.9%) | 1,155 (83.0%) |
| 19 to 25 Years | 93 (13.9%) | 615 (91.6%) |
| 25 to 34 Years | 158 (18.8%) | 654 (77.8%) |
| 35 to 44 Years | 156 (16.6%) | 744 (79.1%) |
| 45 to 54 Years | 111 (11.6%) | 915 (95.3%) |
| 55 to 64 Years | 114 (9.0%) | 1,190 (93.7%) |
| 65 to 74 Years | 816 (92.4%) | 486 (55.0%) |
| 75 Years and over | 692 (100.0%) | 421 (60.8%) |
| Total | 2,469 (30.7%) | 6,518 (81.0%) |
Disability Status by Sex by Age in Sheboygan Falls
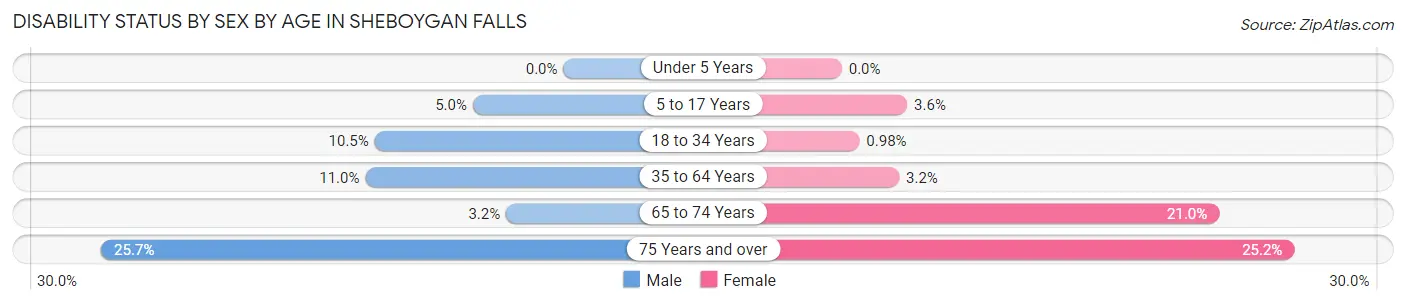
| Age Bracket | Male | Female |
| Under 5 Years | 0 (0.0%) | 0 (0.0%) |
| 5 to 17 Years | 30 (5.0%) | 31 (3.6%) |
| 18 to 34 Years | 80 (10.5%) | 8 (1.0%) |
| 35 to 64 Years | 170 (11.0%) | 52 (3.2%) |
| 65 to 74 Years | 13 (3.2%) | 100 (21.0%) |
| 75 Years and over | 78 (25.7%) | 98 (25.2%) |
Disability Class by Sex by Age in Sheboygan Falls
Disability Class: Hearing Difficulty
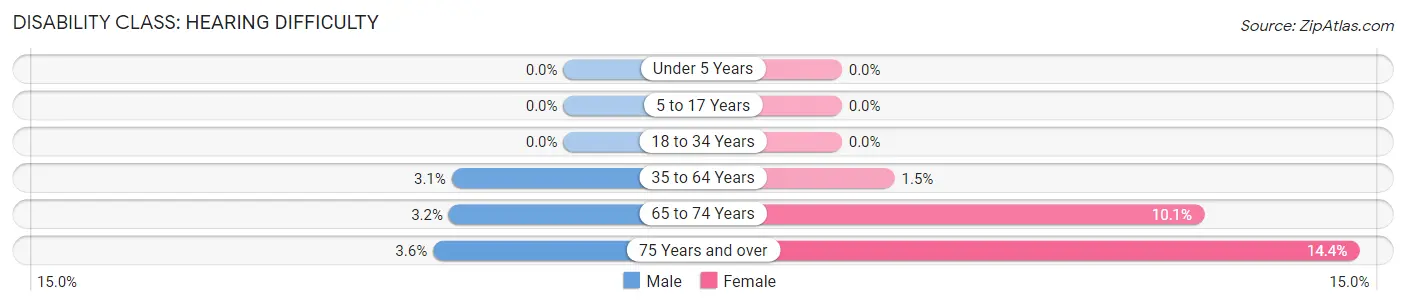
| Age Bracket | Male | Female |
| Under 5 Years | 0 (0.0%) | 0 (0.0%) |
| 5 to 17 Years | 0 (0.0%) | 0 (0.0%) |
| 18 to 34 Years | 0 (0.0%) | 0 (0.0%) |
| 35 to 64 Years | 48 (3.1%) | 24 (1.5%) |
| 65 to 74 Years | 13 (3.2%) | 48 (10.1%) |
| 75 Years and over | 11 (3.6%) | 56 (14.4%) |
Disability Class: Vision Difficulty
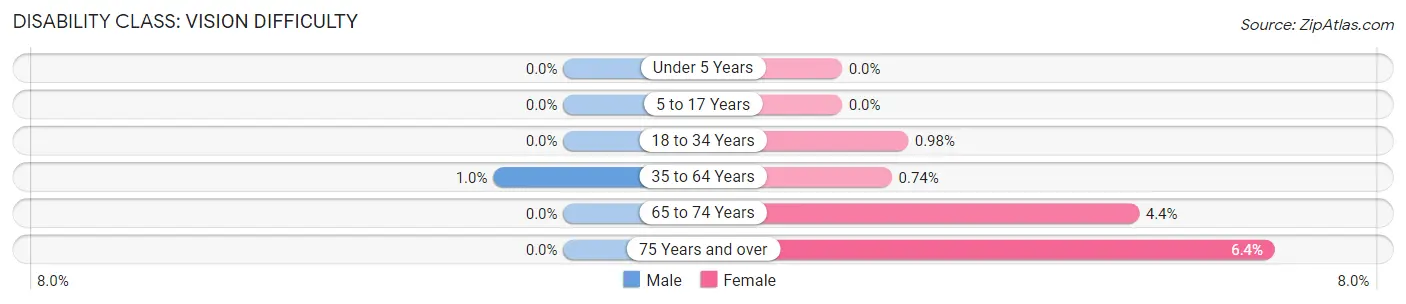
| Age Bracket | Male | Female |
| Under 5 Years | 0 (0.0%) | 0 (0.0%) |
| 5 to 17 Years | 0 (0.0%) | 0 (0.0%) |
| 18 to 34 Years | 0 (0.0%) | 8 (1.0%) |
| 35 to 64 Years | 16 (1.0%) | 12 (0.7%) |
| 65 to 74 Years | 0 (0.0%) | 21 (4.4%) |
| 75 Years and over | 0 (0.0%) | 25 (6.4%) |
Disability Class: Cognitive Difficulty
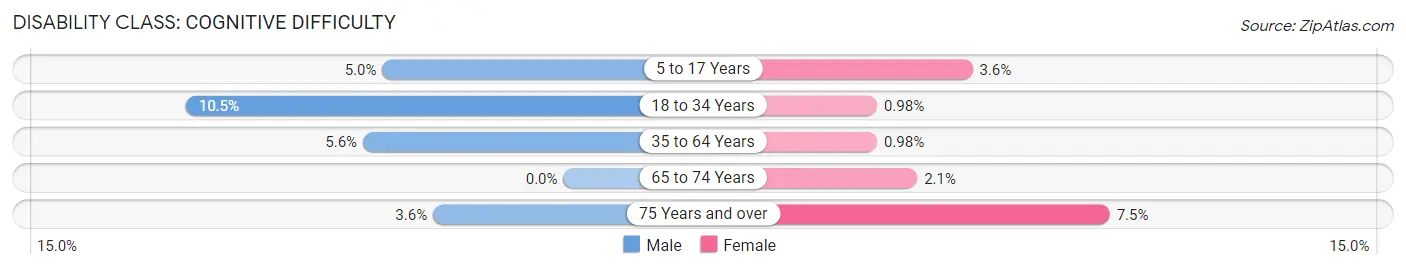
| Age Bracket | Male | Female |
| 5 to 17 Years | 30 (5.0%) | 31 (3.6%) |
| 18 to 34 Years | 80 (10.5%) | 8 (1.0%) |
| 35 to 64 Years | 86 (5.6%) | 16 (1.0%) |
| 65 to 74 Years | 0 (0.0%) | 10 (2.1%) |
| 75 Years and over | 11 (3.6%) | 29 (7.5%) |
Disability Class: Ambulatory Difficulty
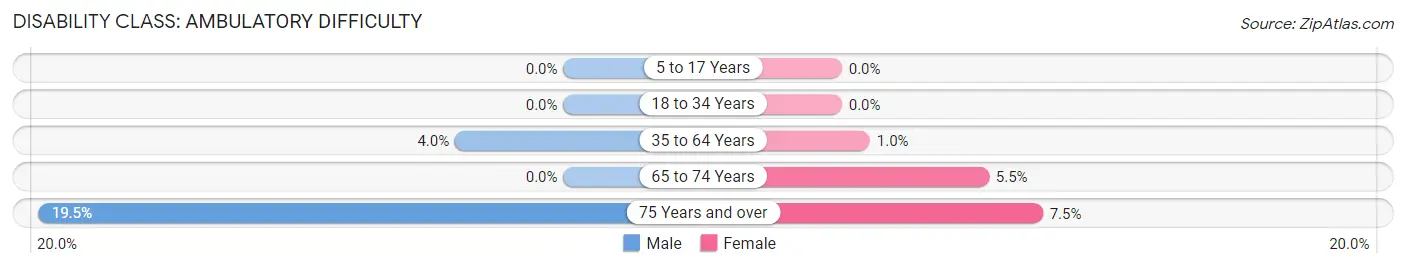
| Age Bracket | Male | Female |
| 5 to 17 Years | 0 (0.0%) | 0 (0.0%) |
| 18 to 34 Years | 0 (0.0%) | 0 (0.0%) |
| 35 to 64 Years | 62 (4.0%) | 17 (1.0%) |
| 65 to 74 Years | 0 (0.0%) | 26 (5.5%) |
| 75 Years and over | 59 (19.5%) | 29 (7.5%) |
Disability Class: Self-Care Difficulty
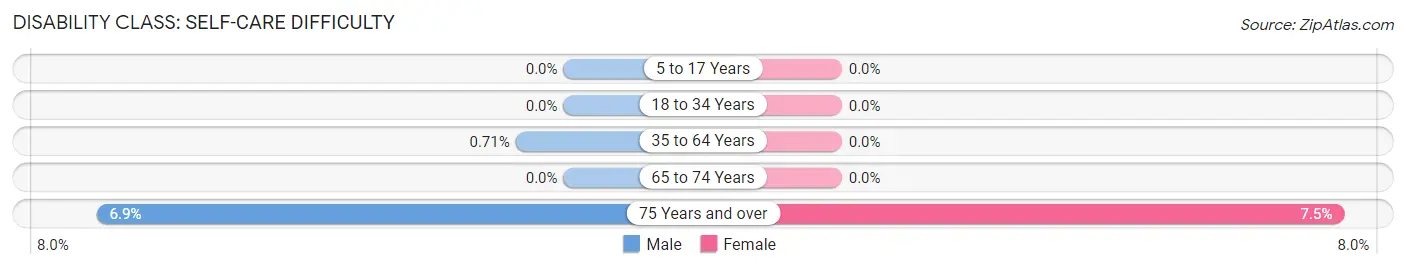
| Age Bracket | Male | Female |
| 5 to 17 Years | 0 (0.0%) | 0 (0.0%) |
| 18 to 34 Years | 0 (0.0%) | 0 (0.0%) |
| 35 to 64 Years | 11 (0.7%) | 0 (0.0%) |
| 65 to 74 Years | 0 (0.0%) | 0 (0.0%) |
| 75 Years and over | 21 (6.9%) | 29 (7.5%) |
Technology Access in Sheboygan Falls
Computing Device Access in Sheboygan Falls
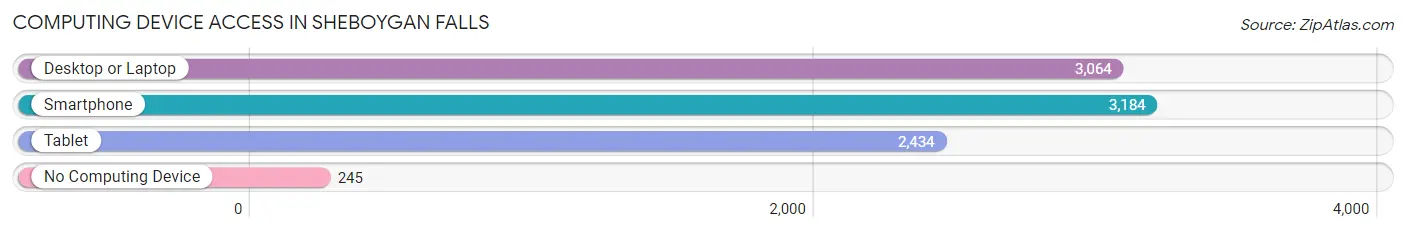
| Device Type | # Households | % Households |
| Desktop or Laptop | 3,064 | 82.3% |
| Smartphone | 3,184 | 85.6% |
| Tablet | 2,434 | 65.4% |
| No Computing Device | 245 | 6.6% |
| Total | 3,722 | 100.0% |
Internet Access in Sheboygan Falls
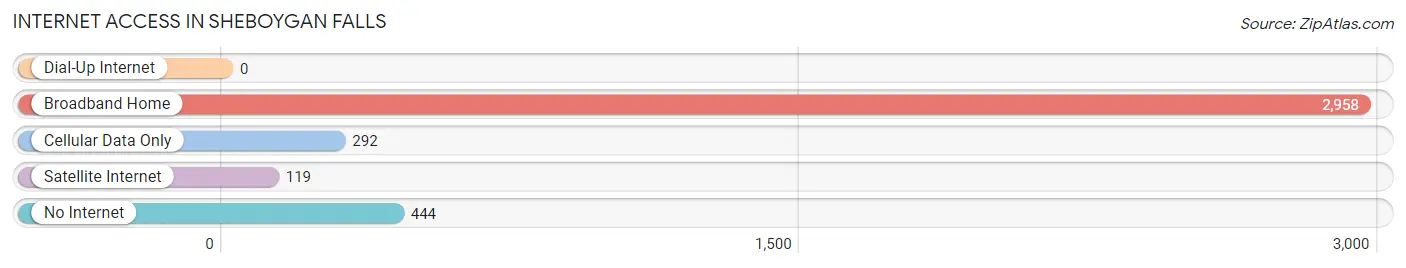
| Internet Type | # Households | % Households |
| Dial-Up Internet | 0 | 0.0% |
| Broadband Home | 2,958 | 79.5% |
| Cellular Data Only | 292 | 7.9% |
| Satellite Internet | 119 | 3.2% |
| No Internet | 444 | 11.9% |
| Total | 3,722 | 100.0% |
Sheboygan Falls Summary
Sheboygan Falls, Wisconsin is a small city located in Sheboygan County, Wisconsin. It is situated on the banks of the Sheboygan River, about 30 miles north of Milwaukee. The city has a population of 7,775 as of the 2010 census, making it the fourth largest city in Sheboygan County.
History
The area that is now Sheboygan Falls was first settled in 1845 by a group of German immigrants. The city was officially incorporated in 1853 and was named after the nearby Sheboygan Falls. The city was originally a farming community, but it soon developed into a manufacturing center. The city was home to several factories, including the Sheboygan Chair Company, which was founded in 1876 and was one of the largest furniture manufacturers in the United States. The city also had a thriving lumber industry, which was centered around the Sheboygan River.
Geography
Sheboygan Falls is located in the southeastern corner of Sheboygan County, Wisconsin. It is situated on the banks of the Sheboygan River, about 30 miles north of Milwaukee. The city has a total area of 4.2 square miles, all of which is land. The city is located in the Central Plain region of Wisconsin, which is characterized by flat terrain and rolling hills. The city is bordered by the towns of Wilson, Mosel, and Sheboygan.
Economy
Sheboygan Falls is a small city with a diverse economy. The city is home to several manufacturing companies, including the Sheboygan Chair Company, which is one of the largest furniture manufacturers in the United States. The city also has a thriving tourism industry, with several popular attractions, such as the Sheboygan Falls Historical Society Museum and the Sheboygan County Historical Society. The city is also home to several retail stores, restaurants, and other businesses.
Demographics
As of the 2010 census, Sheboygan Falls had a population of 7,775. The racial makeup of the city was 95.2% White, 0.7% African American, 0.3% Native American, 1.2% Asian, 0.1% Pacific Islander, 1.2% from other races, and 1.4% from two or more races. Hispanic or Latino of any race were 3.2% of the population. The median household income in Sheboygan Falls was $50,945, and the median family income was $60,945. The per capita income for the city was $25,945. About 5.2% of families and 6.7% of the population were below the poverty line, including 8.2% of those under age 18 and 5.2% of those age 65 or over.
Common Questions
What is the Total Population of Sheboygan Falls?
Total Population of Sheboygan Falls is 8,163.
What is the Total Male Population of Sheboygan Falls?
Total Male Population of Sheboygan Falls is 3,776.
What is the Total Female Population of Sheboygan Falls?
Total Female Population of Sheboygan Falls is 4,387.
What is the Ratio of Males per 100 Females in Sheboygan Falls?
There are 86.07 Males per 100 Females in Sheboygan Falls.
What is the Ratio of Females per 100 Males in Sheboygan Falls?
There are 116.18 Females per 100 Males in Sheboygan Falls.
What is the Median Population Age in Sheboygan Falls?
Median Population Age in Sheboygan Falls is 42.4 Years.
What is the Average Family Size in Sheboygan Falls
Average Family Size in Sheboygan Falls is 2.7 People.
What is the Average Household Size in Sheboygan Falls
Average Household Size in Sheboygan Falls is 2.2 People.
What is Per Capita Income in Sheboygan Falls?
Per Capita income in Sheboygan Falls is $37,591.
What is the Median Family Income in Sheboygan Falls?
Median Family Income in Sheboygan Falls is $79,688.
What is the Median Household income in Sheboygan Falls?
Median Household Income in Sheboygan Falls is $66,416.
What is Income or Wage Gap in Sheboygan Falls?
Income or Wage Gap in Sheboygan Falls is 22.3%.
Women in Sheboygan Falls earn 77.7 cents for every dollar earned by a man.
What is Inequality or Gini Index in Sheboygan Falls?
Inequality or Gini Index in Sheboygan Falls is 0.39.
How Large is the Labor Force in Sheboygan Falls?
There are 4,551 People in the Labor Forcein in Sheboygan Falls.
What is the Percentage of People in the Labor Force in Sheboygan Falls?
68.7% of People are in the Labor Force in Sheboygan Falls.
What is the Unemployment Rate in Sheboygan Falls?
Unemployment Rate in Sheboygan Falls is 1.4%.