Watertown, WI
Watertown Map
Watertown Overview
22,978
TOTAL POPULATION
10,675
MALE POPULATION
12,303
FEMALE POPULATION
86.77
MALES / 100 FEMALES
115.25
FEMALES / 100 MALES
39.3
MEDIAN AGE
3.1
AVG FAMILY SIZE
2.5
AVG HOUSEHOLD SIZE
$31,580
PER CAPITA INCOME
$78,443
AVG FAMILY INCOME
$67,189
AVG HOUSEHOLD INCOME
39.4%
WAGE / INCOME GAP [ % ]
60.6¢/ $1
WAGE / INCOME GAP [ $ ]
$10,050
FAMILY INCOME DEFICIT
0.37
INEQUALITY / GINI INDEX
12,789
LABOR FORCE [ PEOPLE ]
68.2%
PERCENT IN LABOR FORCE
4.4%
UNEMPLOYMENT RATE
Watertown Area Codes
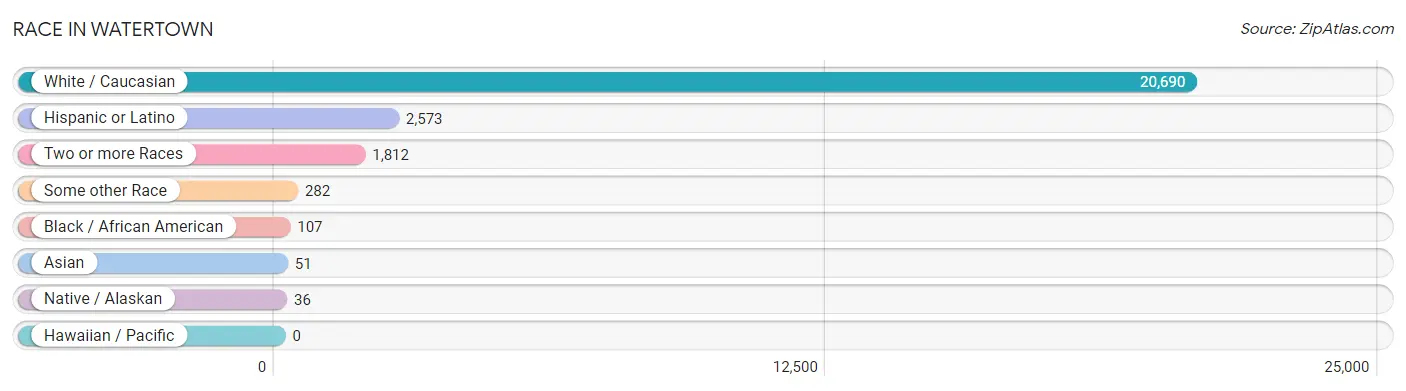
Race in Watertown
The most populous races in Watertown are White / Caucasian (20,690 | 90.0%), Hispanic or Latino (2,573 | 11.2%), and Two or more Races (1,812 | 7.9%).
| Race | # Population | % Population |
| Asian | 51 | 0.2% |
| Black / African American | 107 | 0.5% |
| Hawaiian / Pacific | 0 | 0.0% |
| Hispanic or Latino | 2,573 | 11.2% |
| Native / Alaskan | 36 | 0.2% |
| White / Caucasian | 20,690 | 90.0% |
| Two or more Races | 1,812 | 7.9% |
| Some other Race | 282 | 1.2% |
| Total | 22,978 | 100.0% |
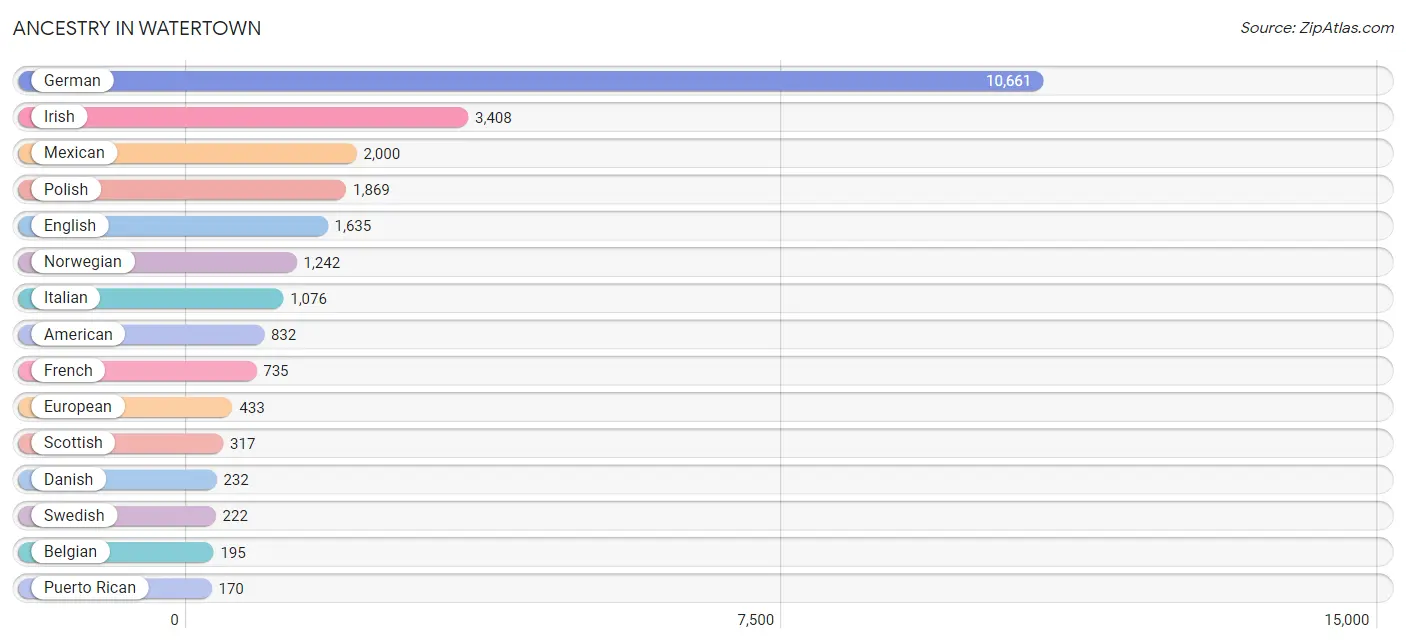
Ancestry in Watertown
The most populous ancestries reported in Watertown are German (10,661 | 46.4%), Irish (3,408 | 14.8%), Mexican (2,000 | 8.7%), Polish (1,869 | 8.1%), and English (1,635 | 7.1%), together accounting for 85.2% of all Watertown residents.
| Ancestry | # Population | % Population |
| African | 10 | 0.0% |
| Albanian | 96 | 0.4% |
| American | 832 | 3.6% |
| Arab | 4 | 0.0% |
| Austrian | 45 | 0.2% |
| Bangladeshi | 14 | 0.1% |
| Belgian | 195 | 0.9% |
| Bhutanese | 34 | 0.2% |
| British | 30 | 0.1% |
| Canadian | 58 | 0.3% |
| Central American | 148 | 0.6% |
| Central American Indian | 64 | 0.3% |
| Cherokee | 14 | 0.1% |
| Chippewa | 7 | 0.0% |
| Croatian | 70 | 0.3% |
| Cuban | 4 | 0.0% |
| Czech | 129 | 0.6% |
| Czechoslovakian | 14 | 0.1% |
| Danish | 232 | 1.0% |
| Dutch | 128 | 0.6% |
| Eastern European | 26 | 0.1% |
| Ecuadorian | 120 | 0.5% |
| English | 1,635 | 7.1% |
| European | 433 | 1.9% |
| Finnish | 14 | 0.1% |
| French | 735 | 3.2% |
| French American Indian | 10 | 0.0% |
| French Canadian | 123 | 0.5% |
| German | 10,661 | 46.4% |
| German Russian | 68 | 0.3% |
| Greek | 23 | 0.1% |
| Honduran | 53 | 0.2% |
| Hungarian | 44 | 0.2% |
| Indian (Asian) | 6 | 0.0% |
| Irish | 3,408 | 14.8% |
| Italian | 1,076 | 4.7% |
| Korean | 113 | 0.5% |
| Lebanese | 4 | 0.0% |
| Lithuanian | 17 | 0.1% |
| Mexican | 2,000 | 8.7% |
| Mexican American Indian | 13 | 0.1% |
| Nicaraguan | 95 | 0.4% |
| Norwegian | 1,242 | 5.4% |
| Peruvian | 30 | 0.1% |
| Polish | 1,869 | 8.1% |
| Puerto Rican | 170 | 0.7% |
| Romanian | 8 | 0.0% |
| Russian | 152 | 0.7% |
| Scandinavian | 75 | 0.3% |
| Scotch-Irish | 111 | 0.5% |
| Scottish | 317 | 1.4% |
| Slovak | 33 | 0.1% |
| Slovene | 23 | 0.1% |
| South American | 152 | 0.7% |
| Spaniard | 80 | 0.4% |
| Spanish | 6 | 0.0% |
| Subsaharan African | 10 | 0.0% |
| Swedish | 222 | 1.0% |
| Swiss | 119 | 0.5% |
| Ukrainian | 15 | 0.1% |
| Venezuelan | 2 | 0.0% |
| Welsh | 132 | 0.6% | View All 62 Rows |
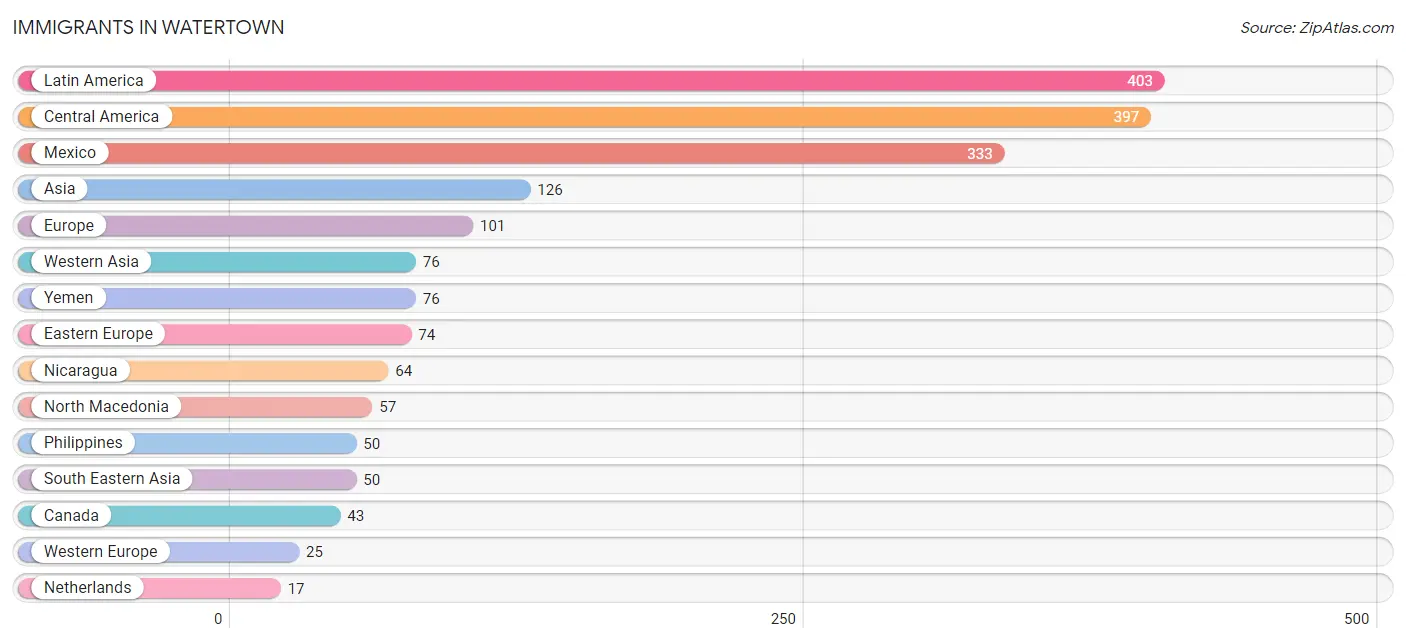
Immigrants in Watertown
The most numerous immigrant groups reported in Watertown came from Latin America (403 | 1.8%), Central America (397 | 1.7%), Mexico (333 | 1.5%), Asia (126 | 0.5%), and Europe (101 | 0.4%), together accounting for 5.9% of all Watertown residents.
| Immigration Origin | # Population | % Population |
| Asia | 126 | 0.5% |
| Australia | 9 | 0.0% |
| Canada | 43 | 0.2% |
| Caribbean | 4 | 0.0% |
| Central America | 397 | 1.7% |
| Cuba | 4 | 0.0% |
| Eastern Europe | 74 | 0.3% |
| England | 2 | 0.0% |
| Europe | 101 | 0.4% |
| Germany | 8 | 0.0% |
| Latin America | 403 | 1.8% |
| Mexico | 333 | 1.5% |
| Netherlands | 17 | 0.1% |
| Nicaragua | 64 | 0.3% |
| North Macedonia | 57 | 0.3% |
| Northern Europe | 2 | 0.0% |
| Oceania | 9 | 0.0% |
| Philippines | 50 | 0.2% |
| Romania | 8 | 0.0% |
| Russia | 9 | 0.0% |
| South America | 2 | 0.0% |
| South Eastern Asia | 50 | 0.2% |
| Venezuela | 2 | 0.0% |
| Western Asia | 76 | 0.3% |
| Western Europe | 25 | 0.1% |
| Yemen | 76 | 0.3% | View All 26 Rows |
Sex and Age in Watertown
Sex and Age in Watertown
The most populous age groups in Watertown are 20 to 24 Years (915 | 8.6%) for men and 20 to 24 Years (1,161 | 9.4%) for women.
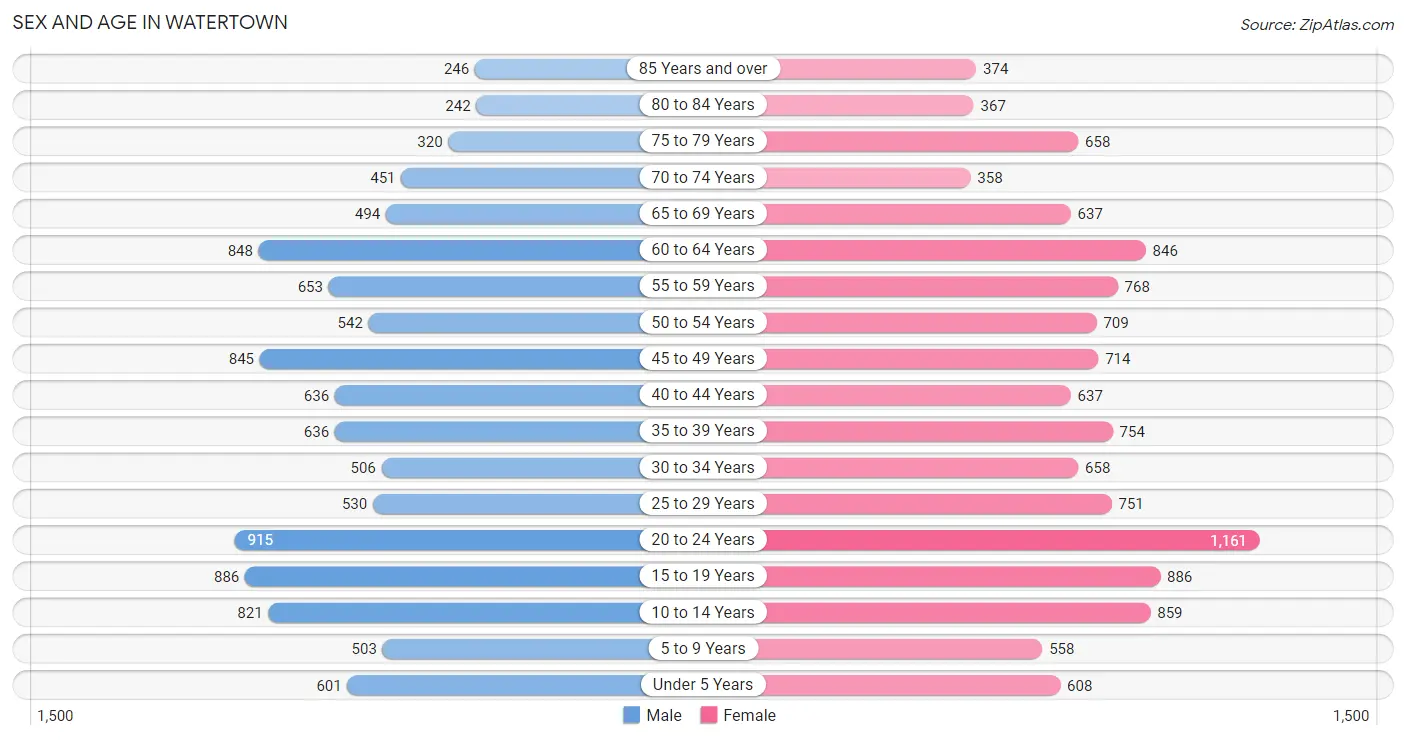
| Age Bracket | Male | Female |
| Under 5 Years | 601 (5.6%) | 608 (4.9%) |
| 5 to 9 Years | 503 (4.7%) | 558 (4.5%) |
| 10 to 14 Years | 821 (7.7%) | 859 (7.0%) |
| 15 to 19 Years | 886 (8.3%) | 886 (7.2%) |
| 20 to 24 Years | 915 (8.6%) | 1,161 (9.4%) |
| 25 to 29 Years | 530 (5.0%) | 751 (6.1%) |
| 30 to 34 Years | 506 (4.7%) | 658 (5.3%) |
| 35 to 39 Years | 636 (6.0%) | 754 (6.1%) |
| 40 to 44 Years | 636 (6.0%) | 637 (5.2%) |
| 45 to 49 Years | 845 (7.9%) | 714 (5.8%) |
| 50 to 54 Years | 542 (5.1%) | 709 (5.8%) |
| 55 to 59 Years | 653 (6.1%) | 768 (6.2%) |
| 60 to 64 Years | 848 (7.9%) | 846 (6.9%) |
| 65 to 69 Years | 494 (4.6%) | 637 (5.2%) |
| 70 to 74 Years | 451 (4.2%) | 358 (2.9%) |
| 75 to 79 Years | 320 (3.0%) | 658 (5.3%) |
| 80 to 84 Years | 242 (2.3%) | 367 (3.0%) |
| 85 Years and over | 246 (2.3%) | 374 (3.0%) |
| Total | 10,675 (100.0%) | 12,303 (100.0%) |
Families and Households in Watertown
Median Family Size in Watertown
The median family size in Watertown is 3.13 persons per family, with single male/father families (471 | 8.4%) accounting for the largest median family size of 3.22 persons per family. On the other hand, single female/mother families (1,089 | 19.5%) represent the smallest median family size with 3.08 persons per family.
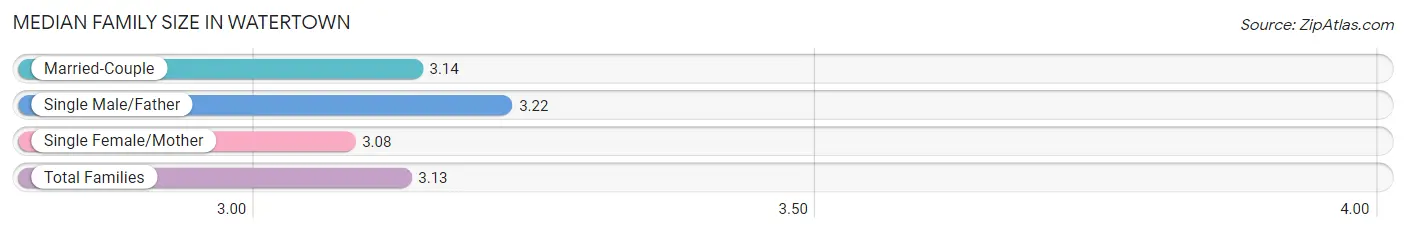
| Family Type | # Families | Family Size |
| Married-Couple | 4,040 (72.1%) | 3.14 |
| Single Male/Father | 471 (8.4%) | 3.22 |
| Single Female/Mother | 1,089 (19.5%) | 3.08 |
| Total Families | 5,600 (100.0%) | 3.13 |
Median Household Size in Watertown
The median household size in Watertown is 2.52 persons per household, with single male/father households (471 | 5.4%) accounting for the largest median household size of 3.64 persons per household. non-family households (3,156 | 36.0%) represent the smallest median household size with 1.21 persons per household.
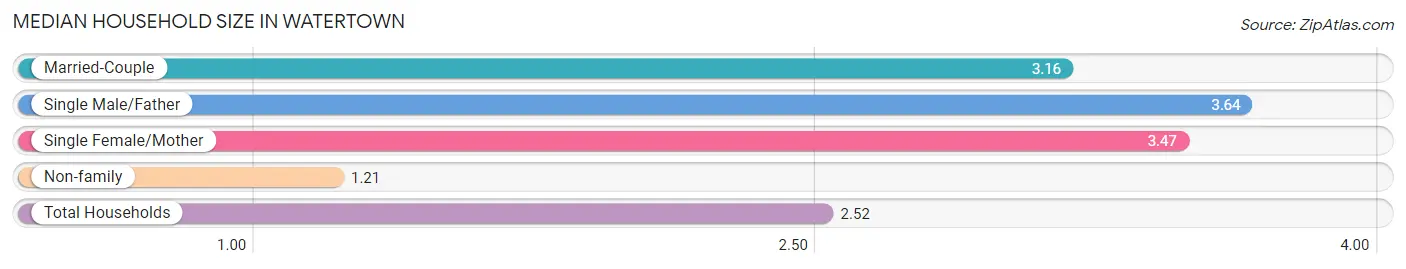
| Household Type | # Households | Household Size |
| Married-Couple | 4,040 (46.1%) | 3.16 |
| Single Male/Father | 471 (5.4%) | 3.64 |
| Single Female/Mother | 1,089 (12.4%) | 3.47 |
| Non-family | 3,156 (36.0%) | 1.21 |
| Total Households | 8,756 (100.0%) | 2.52 |
Household Size by Marriage Status in Watertown
Out of a total of 8,756 households in Watertown, 5,600 (64.0%) are family households, while 3,156 (36.0%) are nonfamily households. The most numerous type of family households are 2-person households, comprising 2,490, and the most common type of nonfamily households are 1-person households, comprising 2,622.
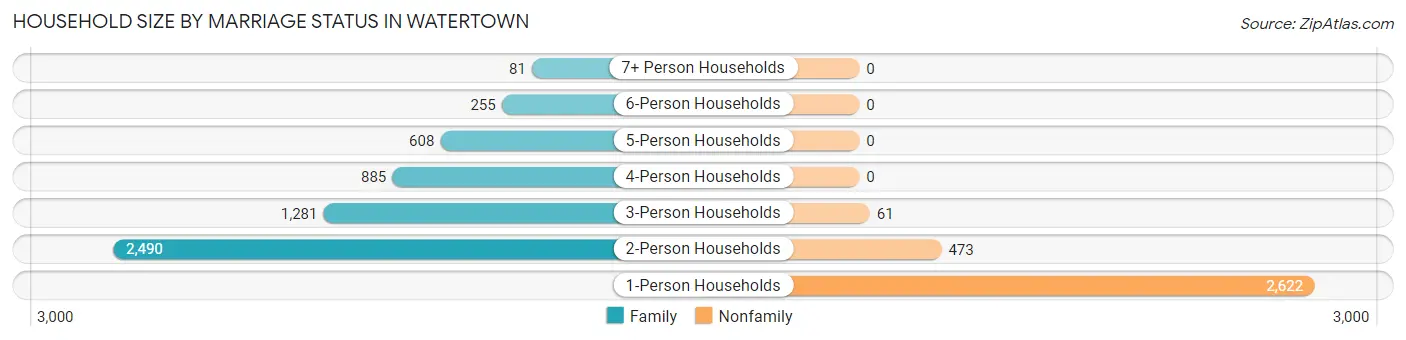
| Household Size | Family Households | Nonfamily Households |
| 1-Person Households | - | 2,622 (29.9%) |
| 2-Person Households | 2,490 (28.4%) | 473 (5.4%) |
| 3-Person Households | 1,281 (14.6%) | 61 (0.7%) |
| 4-Person Households | 885 (10.1%) | 0 (0.0%) |
| 5-Person Households | 608 (6.9%) | 0 (0.0%) |
| 6-Person Households | 255 (2.9%) | 0 (0.0%) |
| 7+ Person Households | 81 (0.9%) | 0 (0.0%) |
| Total | 5,600 (64.0%) | 3,156 (36.0%) |
Female Fertility in Watertown
Fertility by Age in Watertown
Average fertility rate in Watertown is 31.0 births per 1,000 women. Women in the age bracket of 20 to 34 years have the highest fertility rate with 67.0 births per 1,000 women. Women in the age bracket of 20 to 34 years acount for 97.7% of all women with births.
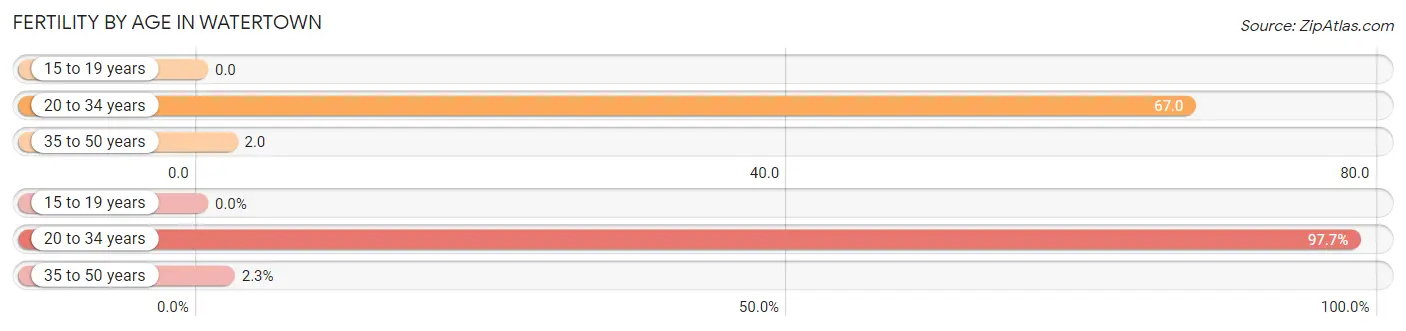
| Age Bracket | Women with Births | Births / 1,000 Women |
| 15 to 19 years | 0 (0.0%) | 0.0 |
| 20 to 34 years | 172 (97.7%) | 67.0 |
| 35 to 50 years | 4 (2.3%) | 2.0 |
| Total | 176 (100.0%) | 31.0 |
Fertility by Age by Marriage Status in Watertown
58.0% of women with births (176) in Watertown are married. The highest percentage of unmarried women with births falls into 20 to 34 years age bracket with 43.0% of them unmarried at the time of birth, while the lowest percentage of unmarried women with births belong to 35 to 50 years age bracket with 0.0% of them unmarried.
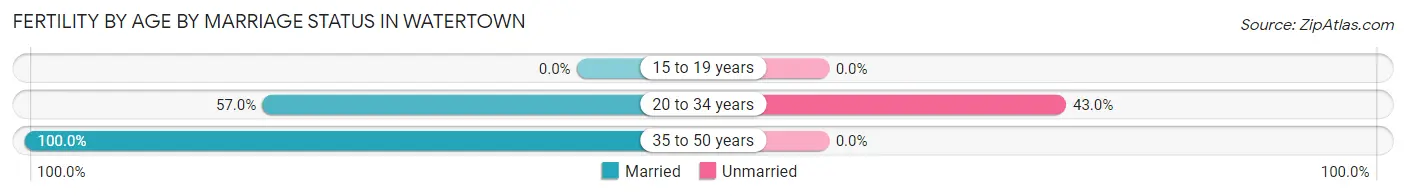
| Age Bracket | Married | Unmarried |
| 15 to 19 years | 0 (0.0%) | 0 (0.0%) |
| 20 to 34 years | 98 (57.0%) | 74 (43.0%) |
| 35 to 50 years | 4 (100.0%) | 0 (0.0%) |
| Total | 102 (58.0%) | 74 (42.0%) |
Fertility by Education in Watertown
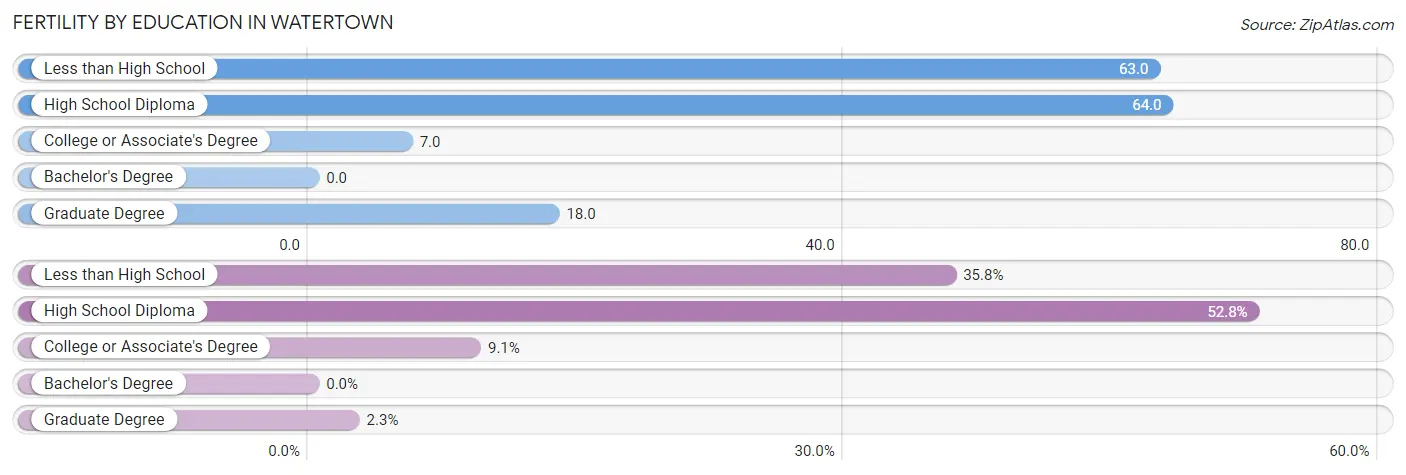
| Educational Attainment | Women with Births | Births / 1,000 Women |
| Less than High School | 63 (35.8%) | 63.0 |
| High School Diploma | 93 (52.8%) | 64.0 |
| College or Associate's Degree | 16 (9.1%) | 7.0 |
| Bachelor's Degree | 0 (0.0%) | 0.0 |
| Graduate Degree | 4 (2.3%) | 18.0 |
| Total | 176 (100.0%) | 31.0 |
Fertility by Education by Marriage Status in Watertown
42.0% of women with births in Watertown are unmarried. Women with the educational attainment of graduate degree are most likely to be married with 100.0% of them married at childbirth, while women with the educational attainment of less than high school are least likely to be married with 76.2% of them unmarried at childbirth.
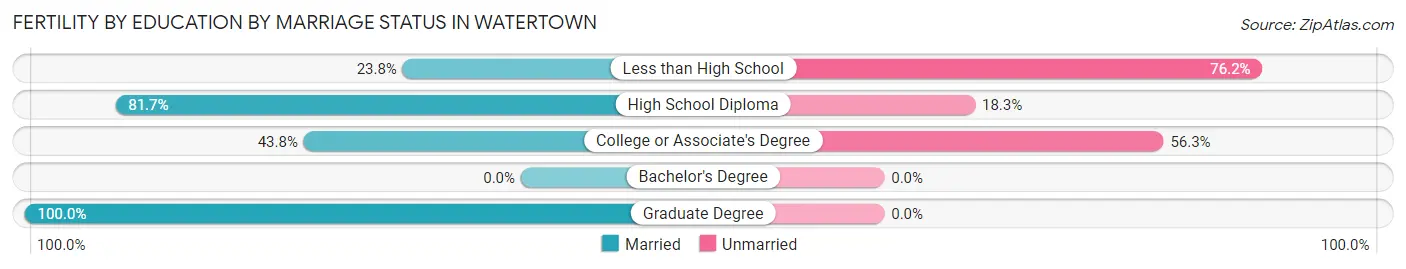
| Educational Attainment | Married | Unmarried |
| Less than High School | 15 (23.8%) | 48 (76.2%) |
| High School Diploma | 76 (81.7%) | 17 (18.3%) |
| College or Associate's Degree | 7 (43.8%) | 9 (56.2%) |
| Bachelor's Degree | 0 (0.0%) | 0 (0.0%) |
| Graduate Degree | 4 (100.0%) | 0 (0.0%) |
| Total | 102 (58.0%) | 74 (42.0%) |
Income in Watertown
Income Overview in Watertown
Per Capita Income in Watertown is $31,580, while median incomes of families and households are $78,443 and $67,189 respectively.
| Characteristic | Number | Measure |
| Per Capita Income | 22,978 | $31,580 |
| Median Family Income | 5,600 | $78,443 |
| Mean Family Income | 5,600 | $88,672 |
| Median Household Income | 8,756 | $67,189 |
| Mean Household Income | 8,756 | $78,292 |
| Income Deficit | 5,600 | $10,050 |
| Wage / Income Gap (%) | 22,978 | 39.42% |
| Wage / Income Gap ($) | 22,978 | 60.58¢ per $1 |
| Gini / Inequality Index | 22,978 | 0.37 |
Earnings by Sex in Watertown
Average Earnings in Watertown are $34,659, $46,379 for men and $28,097 for women, a difference of 39.4%.
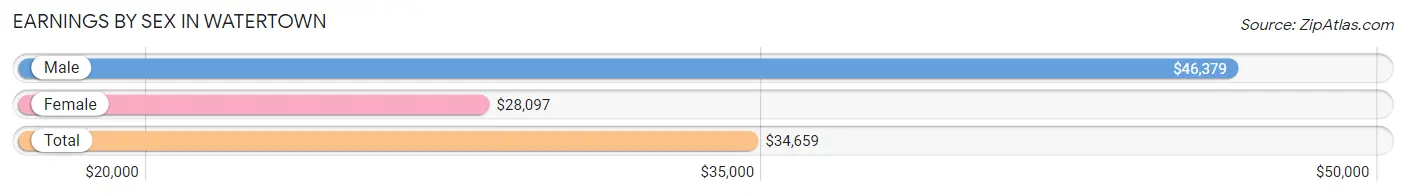
| Sex | Number | Average Earnings |
| Male | 6,516 (49.3%) | $46,379 |
| Female | 6,690 (50.7%) | $28,097 |
| Total | 13,206 (100.0%) | $34,659 |
Earnings by Sex by Income Bracket in Watertown
The most common earnings brackets in Watertown are $75,000 to $99,999 for men (726 | 11.1%) and $25,000 to $29,999 for women (724 | 10.8%).
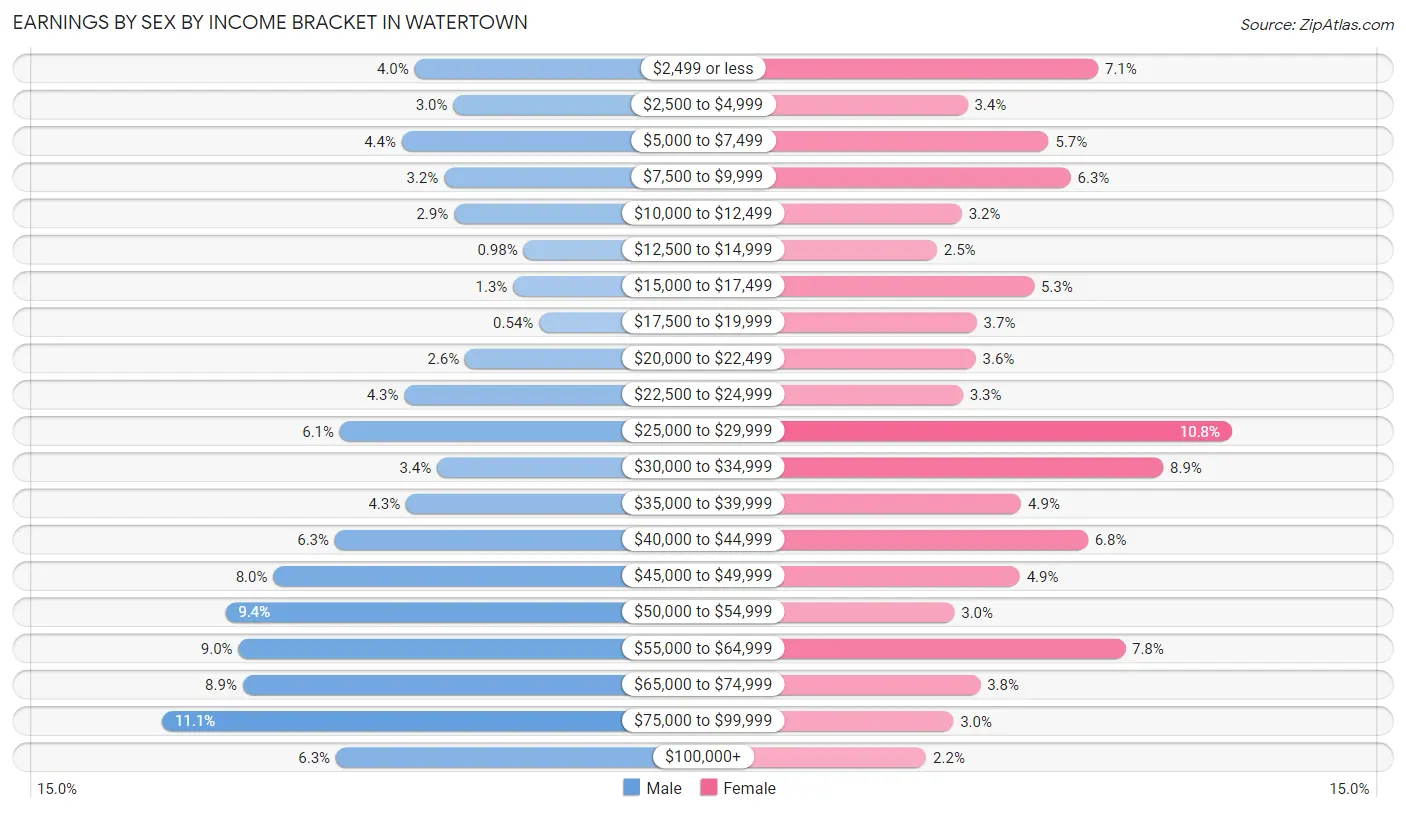
| Income | Male | Female |
| $2,499 or less | 263 (4.0%) | 472 (7.1%) |
| $2,500 to $4,999 | 192 (2.9%) | 227 (3.4%) |
| $5,000 to $7,499 | 287 (4.4%) | 379 (5.7%) |
| $7,500 to $9,999 | 209 (3.2%) | 421 (6.3%) |
| $10,000 to $12,499 | 191 (2.9%) | 216 (3.2%) |
| $12,500 to $14,999 | 64 (1.0%) | 169 (2.5%) |
| $15,000 to $17,499 | 83 (1.3%) | 352 (5.3%) |
| $17,500 to $19,999 | 35 (0.5%) | 244 (3.6%) |
| $20,000 to $22,499 | 171 (2.6%) | 242 (3.6%) |
| $22,500 to $24,999 | 282 (4.3%) | 218 (3.3%) |
| $25,000 to $29,999 | 400 (6.1%) | 724 (10.8%) |
| $30,000 to $34,999 | 222 (3.4%) | 595 (8.9%) |
| $35,000 to $39,999 | 279 (4.3%) | 328 (4.9%) |
| $40,000 to $44,999 | 409 (6.3%) | 453 (6.8%) |
| $45,000 to $49,999 | 522 (8.0%) | 325 (4.9%) |
| $50,000 to $54,999 | 610 (9.4%) | 202 (3.0%) |
| $55,000 to $64,999 | 586 (9.0%) | 523 (7.8%) |
| $65,000 to $74,999 | 578 (8.9%) | 251 (3.7%) |
| $75,000 to $99,999 | 726 (11.1%) | 200 (3.0%) |
| $100,000+ | 407 (6.2%) | 149 (2.2%) |
| Total | 6,516 (100.0%) | 6,690 (100.0%) |
Earnings by Sex by Educational Attainment in Watertown
Average earnings in Watertown are $51,491 for men and $32,078 for women, a difference of 37.7%. Men with an educational attainment of bachelor's degree enjoy the highest average annual earnings of $54,601, while those with less than high school education earn the least with $45,141. Women with an educational attainment of graduate degree earn the most with the average annual earnings of $46,691, while those with high school diploma education have the smallest earnings of $27,273.
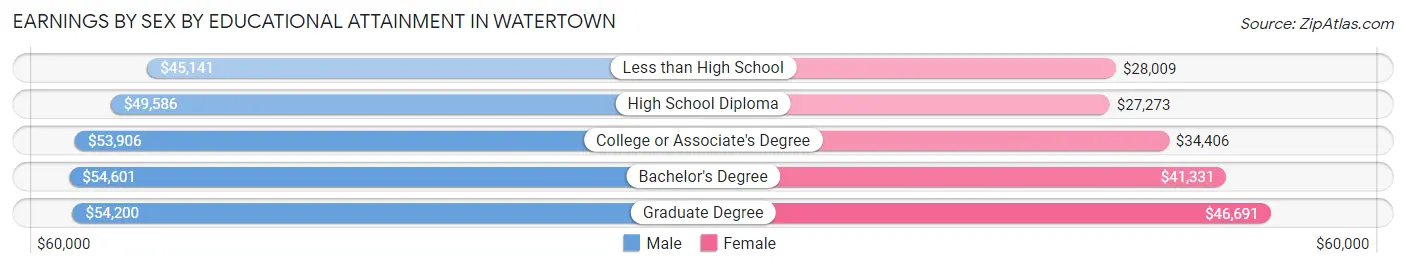
| Educational Attainment | Male Income | Female Income |
| Less than High School | $45,141 | $28,009 |
| High School Diploma | $49,586 | $27,273 |
| College or Associate's Degree | $53,906 | $34,406 |
| Bachelor's Degree | $54,601 | $41,331 |
| Graduate Degree | $54,200 | $46,691 |
| Total | $51,491 | $32,078 |
Family Income in Watertown
Family Income Brackets in Watertown
According to the Watertown family income data, there are 1,406 families falling into the $100,000 to $149,999 income range, which is the most common income bracket and makes up 25.1% of all families. Conversely, the $10,000 to $14,999 income bracket is the least frequent group with only 17 families (0.3%) belonging to this category.
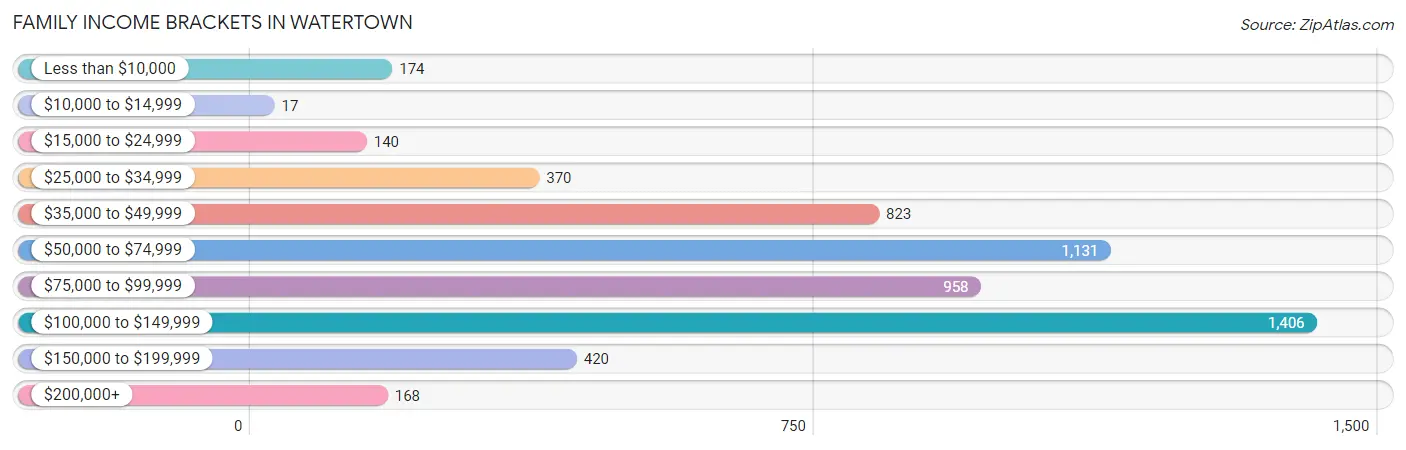
| Income Bracket | # Families | % Families |
| Less than $10,000 | 174 | 3.1% |
| $10,000 to $14,999 | 17 | 0.3% |
| $15,000 to $24,999 | 140 | 2.5% |
| $25,000 to $34,999 | 370 | 6.6% |
| $35,000 to $49,999 | 823 | 14.7% |
| $50,000 to $74,999 | 1,131 | 20.2% |
| $75,000 to $99,999 | 958 | 17.1% |
| $100,000 to $149,999 | 1,406 | 25.1% |
| $150,000 to $199,999 | 420 | 7.5% |
| $200,000+ | 168 | 3.0% |
Family Income by Famaliy Size in Watertown
5-person families (481 | 8.6%) account for the highest median family income in Watertown with $113,438 per family, while 2-person families (2,723 | 48.6%) have the highest median income of $36,046 per family member.
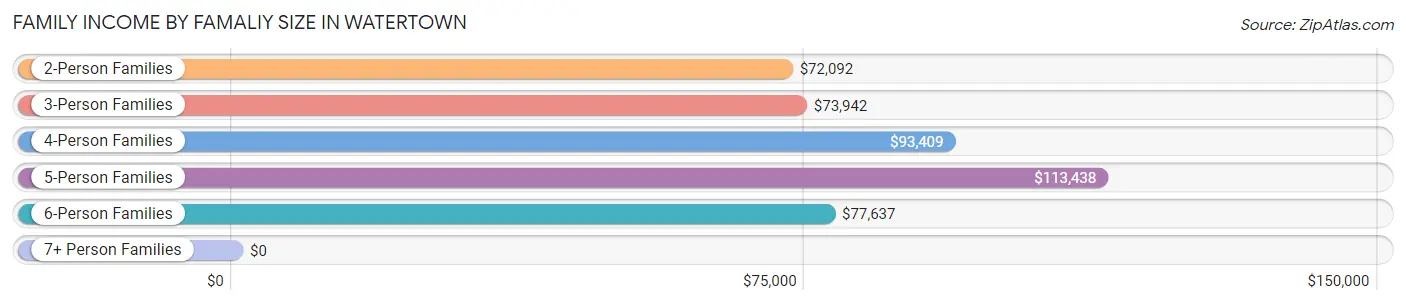
| Income Bracket | # Families | Median Income |
| 2-Person Families | 2,723 (48.6%) | $72,092 |
| 3-Person Families | 1,243 (22.2%) | $73,942 |
| 4-Person Families | 846 (15.1%) | $93,409 |
| 5-Person Families | 481 (8.6%) | $113,438 |
| 6-Person Families | 276 (4.9%) | $77,637 |
| 7+ Person Families | 31 (0.5%) | $0 |
| Total | 5,600 (100.0%) | $78,443 |
Family Income by Number of Earners in Watertown
The median family income in Watertown is $78,443, with families comprising 3+ earners (850) having the highest median family income of $111,875, while families with 1 earner (1,769) have the lowest median family income of $54,856, accounting for 15.2% and 31.6% of families, respectively.
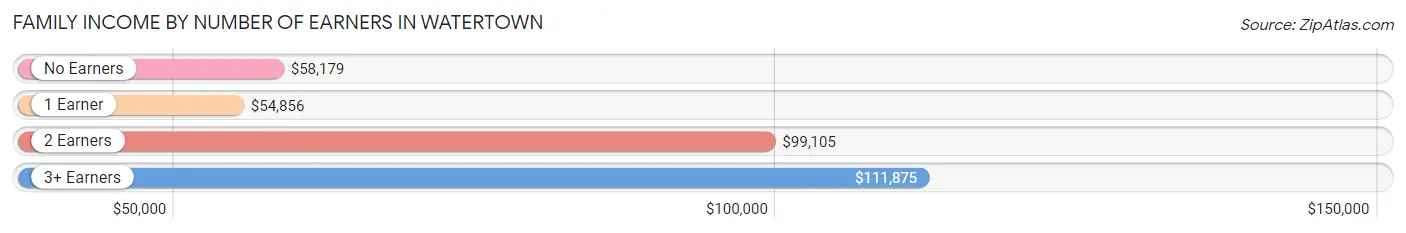
| Number of Earners | # Families | Median Income |
| No Earners | 669 (11.9%) | $58,179 |
| 1 Earner | 1,769 (31.6%) | $54,856 |
| 2 Earners | 2,312 (41.3%) | $99,105 |
| 3+ Earners | 850 (15.2%) | $111,875 |
| Total | 5,600 (100.0%) | $78,443 |
Household Income in Watertown
Household Income Brackets in Watertown
With 1,918 households falling in the category, the $50,000 to $74,999 income range is the most frequent in Watertown, accounting for 21.9% of all households. In contrast, only 114 households (1.3%) fall into the $10,000 to $14,999 income bracket, making it the least populous group.
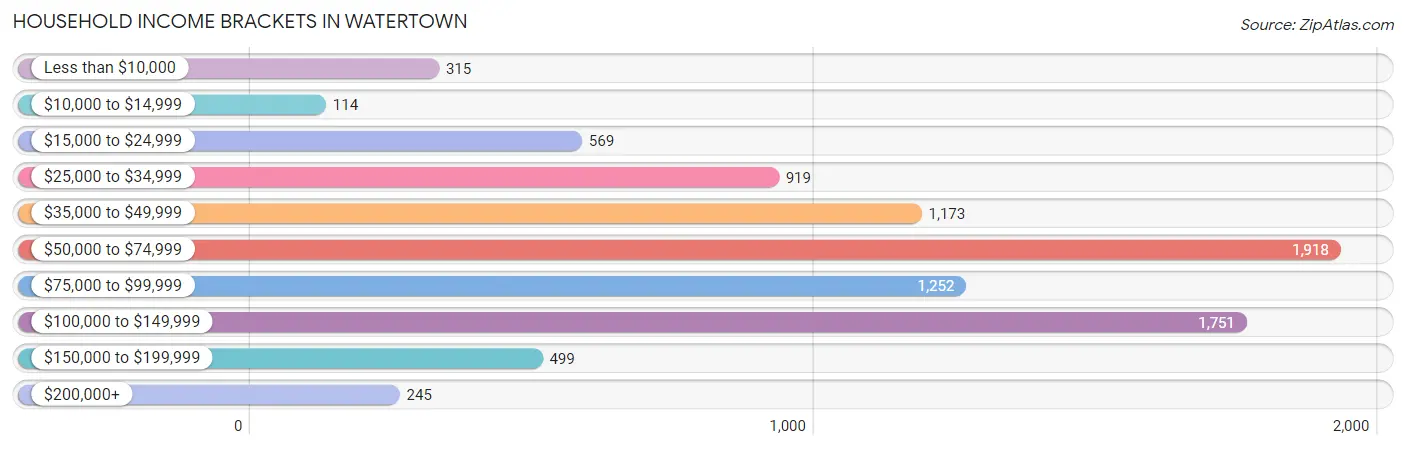
| Income Bracket | # Households | % Households |
| Less than $10,000 | 315 | 3.6% |
| $10,000 to $14,999 | 114 | 1.3% |
| $15,000 to $24,999 | 569 | 6.5% |
| $25,000 to $34,999 | 919 | 10.5% |
| $35,000 to $49,999 | 1,173 | 13.4% |
| $50,000 to $74,999 | 1,918 | 21.9% |
| $75,000 to $99,999 | 1,252 | 14.3% |
| $100,000 to $149,999 | 1,751 | 20.0% |
| $150,000 to $199,999 | 499 | 5.7% |
| $200,000+ | 245 | 2.8% |
Household Income by Householder Age in Watertown
The median household income in Watertown is $67,189, with the highest median household income of $80,848 found in the 45 to 64 years age bracket for the primary householder. A total of 3,169 households (36.2%) fall into this category. Meanwhile, the 65+ years age bracket for the primary householder has the lowest median household income of $47,644, with 2,638 households (30.1%) in this group.
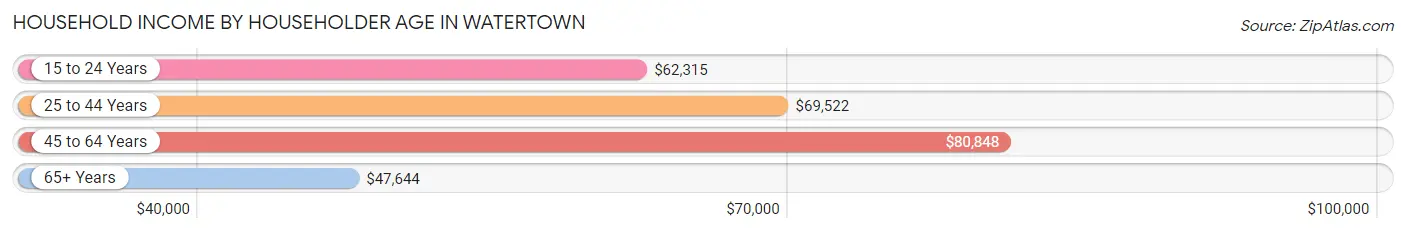
| Income Bracket | # Households | Median Income |
| 15 to 24 Years | 440 (5.0%) | $62,315 |
| 25 to 44 Years | 2,509 (28.6%) | $69,522 |
| 45 to 64 Years | 3,169 (36.2%) | $80,848 |
| 65+ Years | 2,638 (30.1%) | $47,644 |
| Total | 8,756 (100.0%) | $67,189 |
Poverty in Watertown
Income Below Poverty by Sex and Age in Watertown
With 6.8% poverty level for males and 9.4% for females among the residents of Watertown, under 5 year old males and 35 to 44 year old females are the most vulnerable to poverty, with 273 males (45.4%) and 252 females (18.1%) in their respective age groups living below the poverty level.
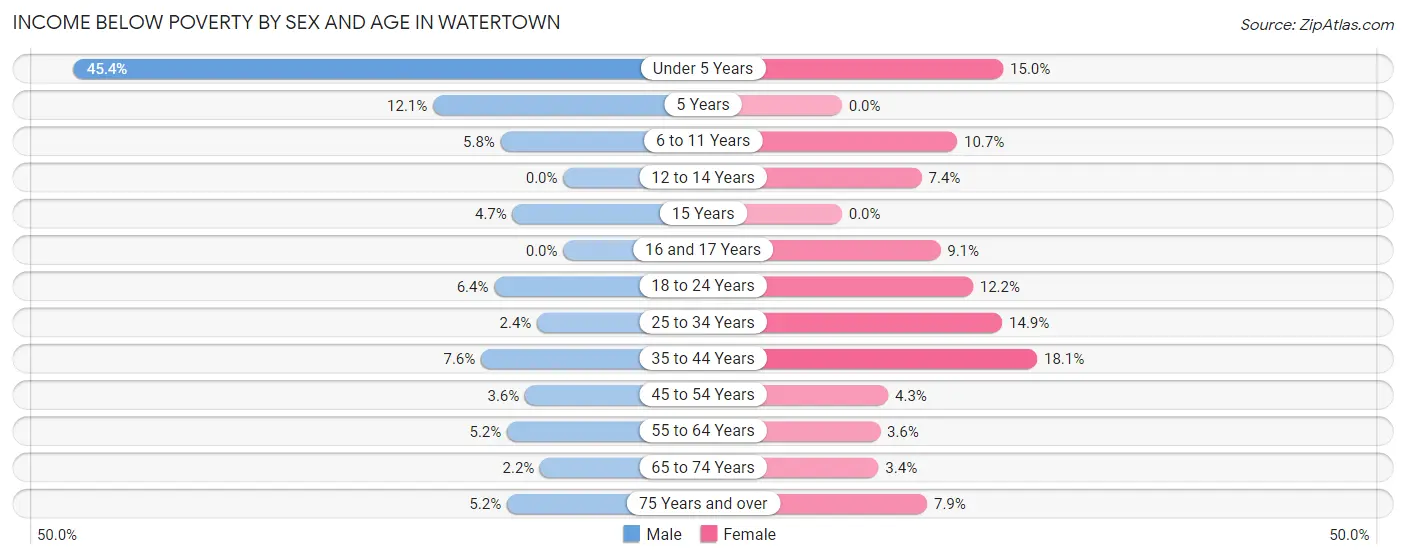
| Age Bracket | Male | Female |
| Under 5 Years | 273 (45.4%) | 91 (15.0%) |
| 5 Years | 11 (12.1%) | 0 (0.0%) |
| 6 to 11 Years | 34 (5.8%) | 76 (10.7%) |
| 12 to 14 Years | 0 (0.0%) | 38 (7.4%) |
| 15 Years | 8 (4.7%) | 0 (0.0%) |
| 16 and 17 Years | 0 (0.0%) | 34 (9.1%) |
| 18 to 24 Years | 66 (6.4%) | 160 (12.2%) |
| 25 to 34 Years | 25 (2.4%) | 208 (14.9%) |
| 35 to 44 Years | 97 (7.6%) | 252 (18.1%) |
| 45 to 54 Years | 49 (3.5%) | 61 (4.3%) |
| 55 to 64 Years | 78 (5.2%) | 57 (3.5%) |
| 65 to 74 Years | 20 (2.1%) | 33 (3.4%) |
| 75 Years and over | 40 (5.2%) | 101 (7.9%) |
| Total | 701 (6.8%) | 1,111 (9.4%) |
Income Above Poverty by Sex and Age in Watertown
According to the poverty statistics in Watertown, males aged 12 to 14 years and females aged 5 years are the age groups that are most secure financially, with 100.0% of males and 100.0% of females in these age groups living above the poverty line.
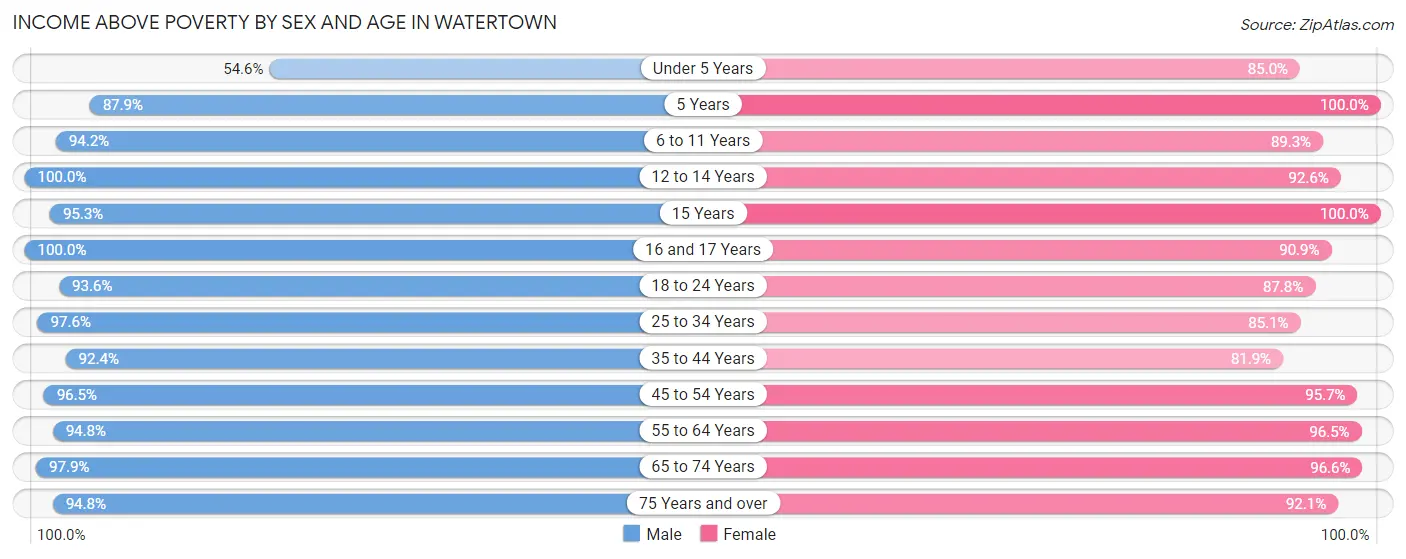
| Age Bracket | Male | Female |
| Under 5 Years | 328 (54.6%) | 517 (85.0%) |
| 5 Years | 80 (87.9%) | 129 (100.0%) |
| 6 to 11 Years | 550 (94.2%) | 634 (89.3%) |
| 12 to 14 Years | 610 (100.0%) | 475 (92.6%) |
| 15 Years | 162 (95.3%) | 106 (100.0%) |
| 16 and 17 Years | 314 (100.0%) | 338 (90.9%) |
| 18 to 24 Years | 964 (93.6%) | 1,156 (87.8%) |
| 25 to 34 Years | 1,003 (97.6%) | 1,190 (85.1%) |
| 35 to 44 Years | 1,175 (92.4%) | 1,139 (81.9%) |
| 45 to 54 Years | 1,331 (96.5%) | 1,358 (95.7%) |
| 55 to 64 Years | 1,415 (94.8%) | 1,548 (96.5%) |
| 65 to 74 Years | 912 (97.9%) | 938 (96.6%) |
| 75 Years and over | 725 (94.8%) | 1,176 (92.1%) |
| Total | 9,569 (93.2%) | 10,704 (90.6%) |
Income Below Poverty Among Married-Couple Families in Watertown
The poverty statistics for married-couple families in Watertown show that 2.6% or 104 of the total 4,040 families live below the poverty line. Families with 3 or 4 children have the highest poverty rate of 7.8%, comprising of 34 families. On the other hand, families with no children have the lowest poverty rate of 1.8%, which includes 46 families.
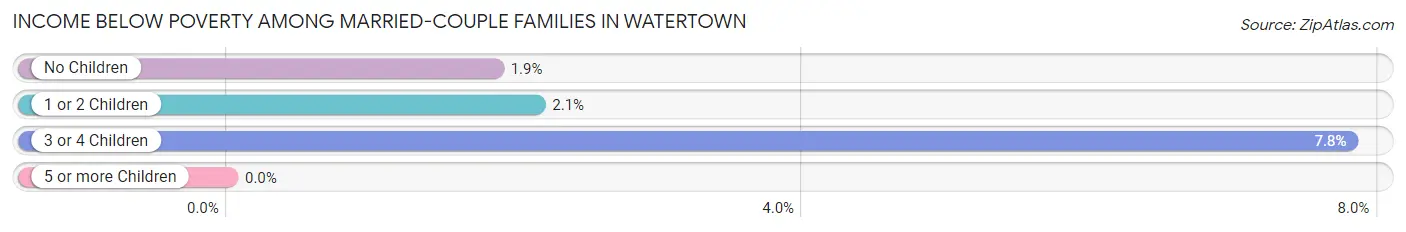
| Children | Above Poverty | Below Poverty |
| No Children | 2,437 (98.2%) | 46 (1.8%) |
| 1 or 2 Children | 1,097 (97.9%) | 24 (2.1%) |
| 3 or 4 Children | 402 (92.2%) | 34 (7.8%) |
| 5 or more Children | 0 (0.0%) | 0 (0.0%) |
| Total | 3,936 (97.4%) | 104 (2.6%) |
Income Below Poverty Among Single-Parent Households in Watertown
According to the poverty data in Watertown, 16.1% or 76 single-father households and 15.7% or 171 single-mother households are living below the poverty line. Among single-father households, those with 3 or 4 children have the highest poverty rate, with 39 households (49.4%) experiencing poverty. Likewise, among single-mother households, those with 1 or 2 children have the highest poverty rate, with 125 households (22.3%) falling below the poverty line.
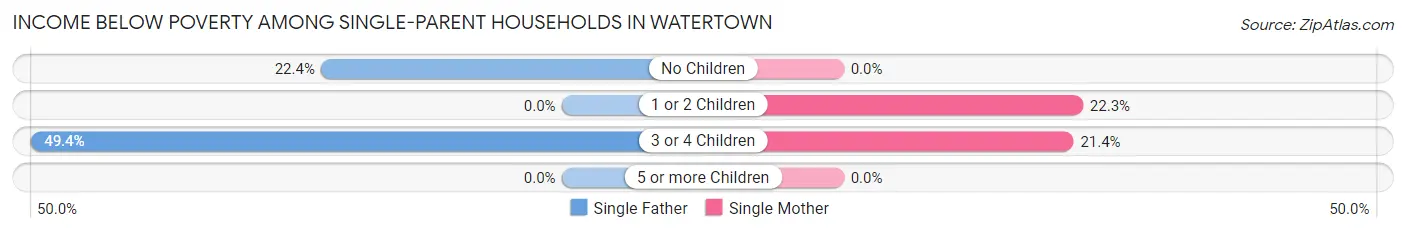
| Children | Single Father | Single Mother |
| No Children | 37 (22.4%) | 0 (0.0%) |
| 1 or 2 Children | 0 (0.0%) | 125 (22.3%) |
| 3 or 4 Children | 39 (49.4%) | 46 (21.4%) |
| 5 or more Children | 0 (0.0%) | 0 (0.0%) |
| Total | 76 (16.1%) | 171 (15.7%) |
Income Below Poverty Among Married-Couple vs Single-Parent Households in Watertown
The poverty data for Watertown shows that 104 of the married-couple family households (2.6%) and 247 of the single-parent households (15.8%) are living below the poverty level. Within the married-couple family households, those with 3 or 4 children have the highest poverty rate, with 34 households (7.8%) falling below the poverty line. Among the single-parent households, those with 3 or 4 children have the highest poverty rate, with 85 household (28.9%) living below poverty.
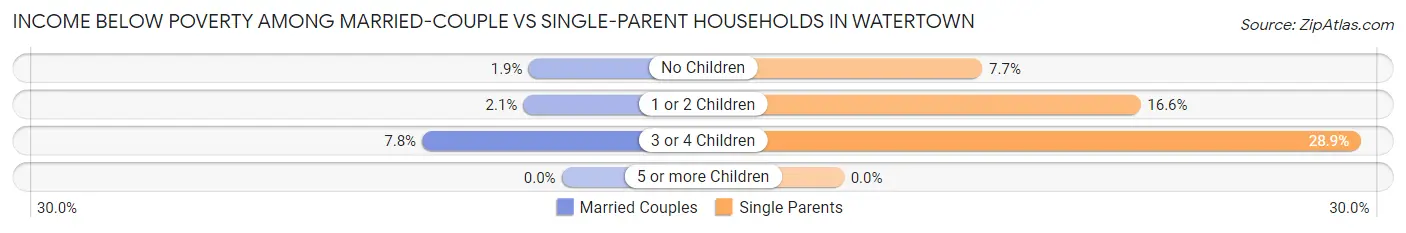
| Children | Married-Couple Families | Single-Parent Households |
| No Children | 46 (1.8%) | 37 (7.7%) |
| 1 or 2 Children | 24 (2.1%) | 125 (16.6%) |
| 3 or 4 Children | 34 (7.8%) | 85 (28.9%) |
| 5 or more Children | 0 (0.0%) | 0 (0.0%) |
| Total | 104 (2.6%) | 247 (15.8%) |
Employment Characteristics in Watertown
Employment by Class of Employer in Watertown
Among the 11,838 employed individuals in Watertown, private company employees (8,817 | 74.5%), not-for-profit organizations (1,504 | 12.7%), and local government employees (671 | 5.7%) make up the most common classes of employment.
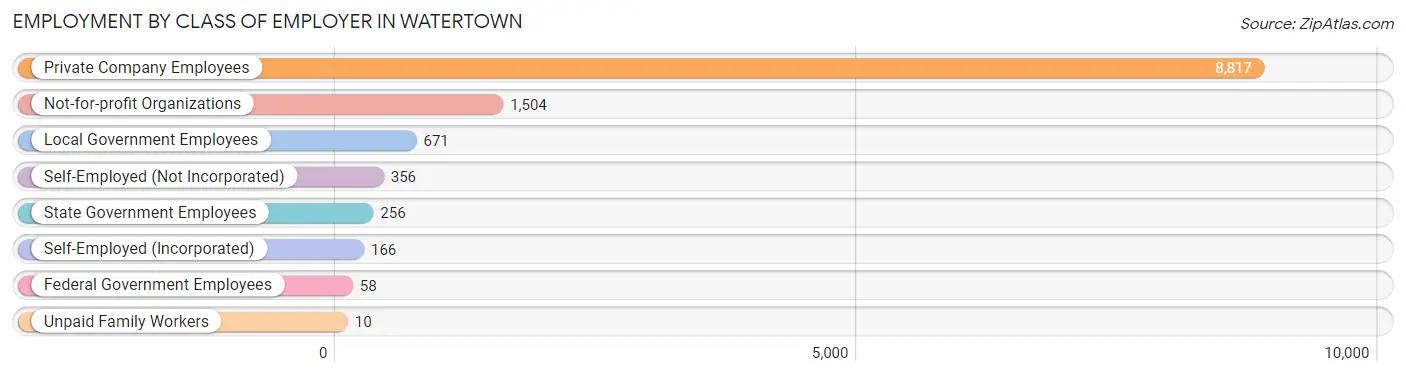
| Employer Class | # Employees | % Employees |
| Private Company Employees | 8,817 | 74.5% |
| Self-Employed (Incorporated) | 166 | 1.4% |
| Self-Employed (Not Incorporated) | 356 | 3.0% |
| Not-for-profit Organizations | 1,504 | 12.7% |
| Local Government Employees | 671 | 5.7% |
| State Government Employees | 256 | 2.2% |
| Federal Government Employees | 58 | 0.5% |
| Unpaid Family Workers | 10 | 0.1% |
| Total | 11,838 | 100.0% |
Employment Status by Age in Watertown
According to the labor force statistics for Watertown, out of the total population over 16 years of age (18,752), 68.2% or 12,789 individuals are in the labor force, with 4.4% or 563 of them unemployed. The age group with the highest labor force participation rate is 35 to 44 years, with 90.0% or 2,397 individuals in the labor force. Within the labor force, the 16 to 19 years age range has the highest percentage of unemployed individuals, with 13.6% or 134 of them being unemployed.
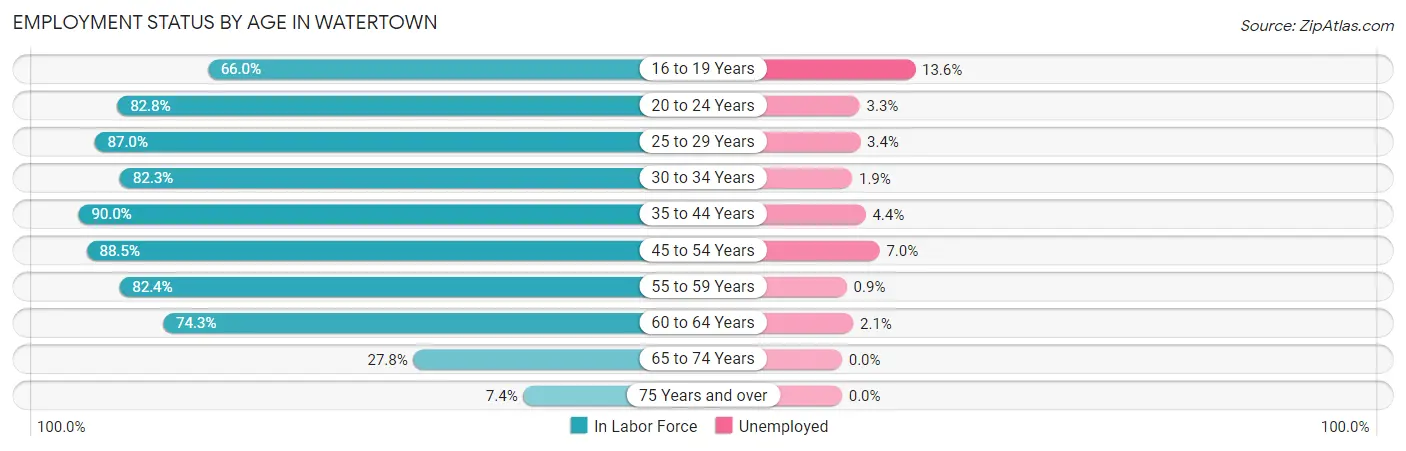
| Age Bracket | In Labor Force | Unemployed |
| 16 to 19 Years | 987 (66.0%) | 134 (13.6%) |
| 20 to 24 Years | 1,719 (82.8%) | 57 (3.3%) |
| 25 to 29 Years | 1,114 (87.0%) | 38 (3.4%) |
| 30 to 34 Years | 958 (82.3%) | 18 (1.9%) |
| 35 to 44 Years | 2,397 (90.0%) | 105 (4.4%) |
| 45 to 54 Years | 2,487 (88.5%) | 174 (7.0%) |
| 55 to 59 Years | 1,171 (82.4%) | 11 (0.9%) |
| 60 to 64 Years | 1,259 (74.3%) | 26 (2.1%) |
| 65 to 74 Years | 539 (27.8%) | 0 (0.0%) |
| 75 Years and over | 163 (7.4%) | 0 (0.0%) |
| Total | 12,789 (68.2%) | 563 (4.4%) |
Employment Status by Educational Attainment in Watertown
According to labor force statistics for Watertown, 85.1% of individuals (9,389) out of the total population between 25 and 64 years of age (11,033) are in the labor force, with 4.0% or 376 of them being unemployed. The group with the highest labor force participation rate are those with the educational attainment of bachelor's degree or higher, with 89.5% or 1,988 individuals in the labor force. Within the labor force, individuals with less than high school education have the highest percentage of unemployment, with 11.1% or 70 of them being unemployed.
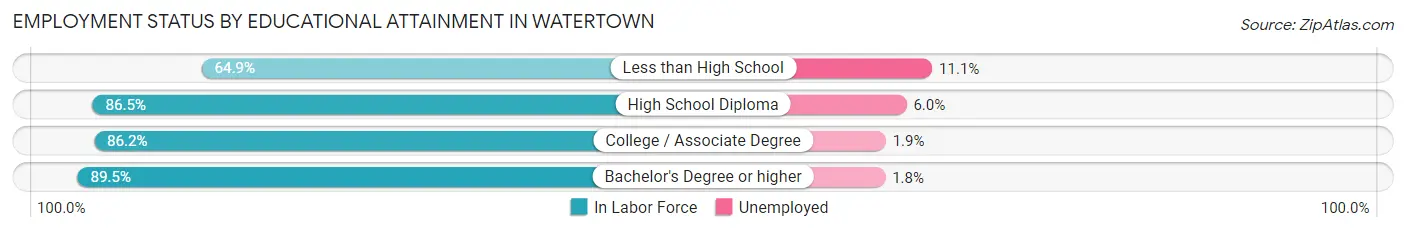
| Educational Attainment | In Labor Force | Unemployed |
| Less than High School | 631 (64.9%) | 108 (11.1%) |
| High School Diploma | 3,353 (86.5%) | 233 (6.0%) |
| College / Associate Degree | 3,417 (86.2%) | 75 (1.9%) |
| Bachelor's Degree or higher | 1,988 (89.5%) | 40 (1.8%) |
| Total | 9,389 (85.1%) | 441 (4.0%) |
Employment Occupations by Sex in Watertown
Management, Business, Science and Arts Occupations
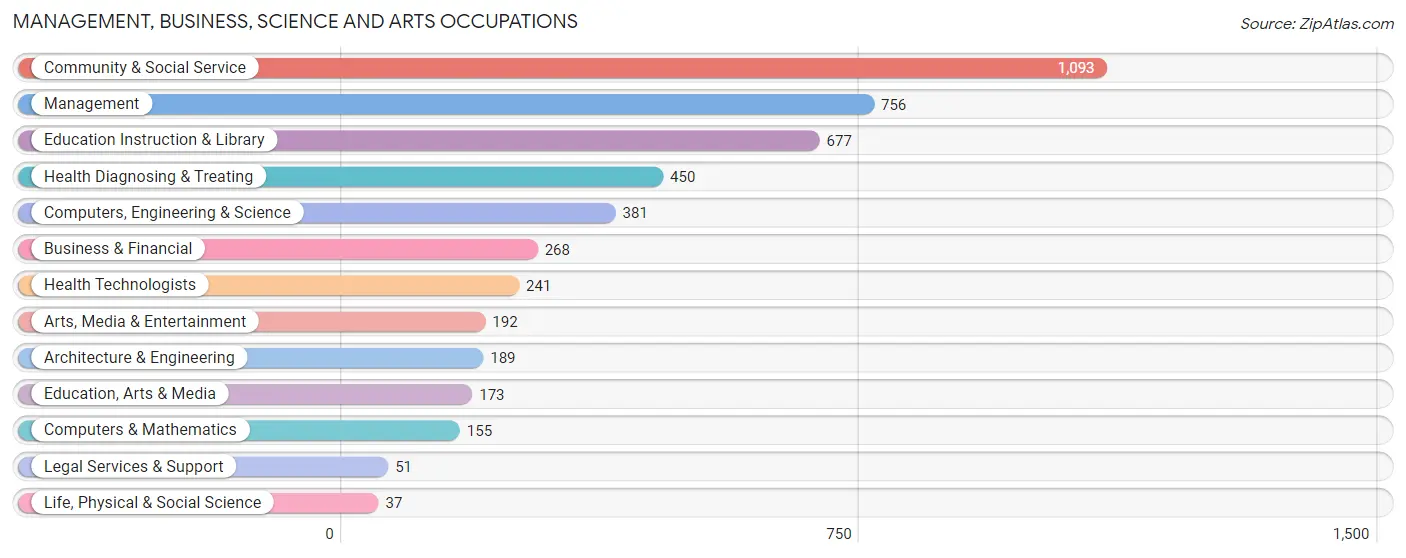
The most common Management, Business, Science and Arts occupations in Watertown are Community & Social Service (1,093 | 8.9%), Management (756 | 6.2%), Education Instruction & Library (677 | 5.5%), Health Diagnosing & Treating (450 | 3.7%), and Computers, Engineering & Science (381 | 3.1%).
Management, Business, Science and Arts Occupations by Sex
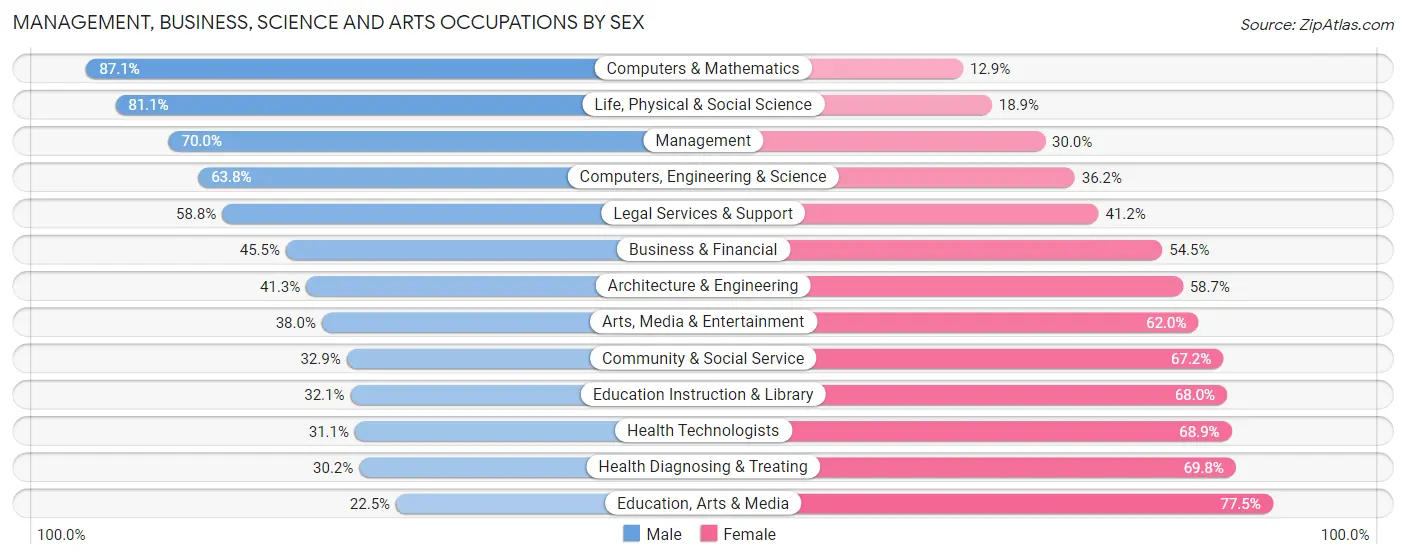
Within the Management, Business, Science and Arts occupations in Watertown, the most male-oriented occupations are Computers & Mathematics (87.1%), Life, Physical & Social Science (81.1%), and Management (70.0%), while the most female-oriented occupations are Education, Arts & Media (77.5%), Health Diagnosing & Treating (69.8%), and Health Technologists (68.9%).
| Occupation | Male | Female |
| Management | 529 (70.0%) | 227 (30.0%) |
| Business & Financial | 122 (45.5%) | 146 (54.5%) |
| Computers, Engineering & Science | 243 (63.8%) | 138 (36.2%) |
| Computers & Mathematics | 135 (87.1%) | 20 (12.9%) |
| Architecture & Engineering | 78 (41.3%) | 111 (58.7%) |
| Life, Physical & Social Science | 30 (81.1%) | 7 (18.9%) |
| Community & Social Service | 359 (32.9%) | 734 (67.1%) |
| Education, Arts & Media | 39 (22.5%) | 134 (77.5%) |
| Legal Services & Support | 30 (58.8%) | 21 (41.2%) |
| Education Instruction & Library | 217 (32.1%) | 460 (67.9%) |
| Arts, Media & Entertainment | 73 (38.0%) | 119 (62.0%) |
| Health Diagnosing & Treating | 136 (30.2%) | 314 (69.8%) |
| Health Technologists | 75 (31.1%) | 166 (68.9%) |
| Total (Category) | 1,389 (47.1%) | 1,559 (52.9%) |
| Total (Overall) | 5,937 (48.5%) | 6,291 (51.4%) |
Services Occupations
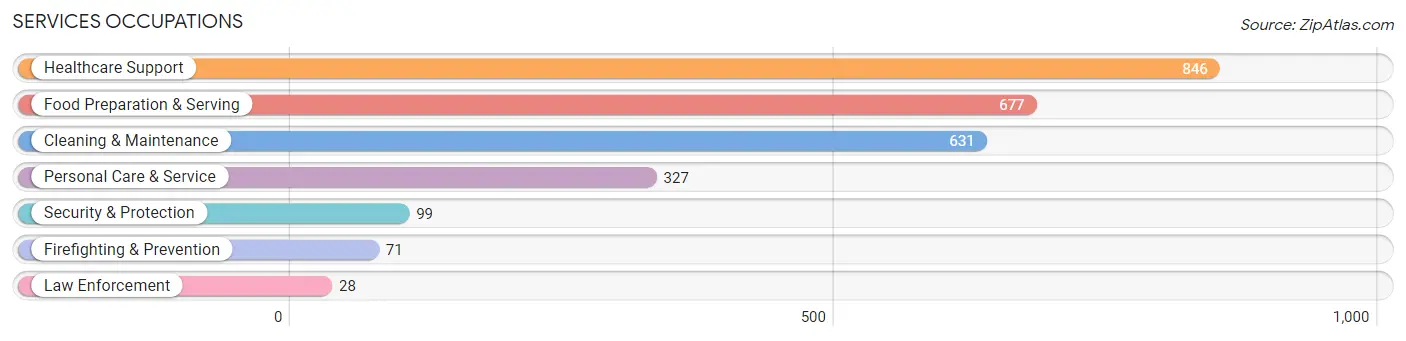
The most common Services occupations in Watertown are Healthcare Support (846 | 6.9%), Food Preparation & Serving (677 | 5.5%), Cleaning & Maintenance (631 | 5.2%), Personal Care & Service (327 | 2.7%), and Security & Protection (99 | 0.8%).
Services Occupations by Sex
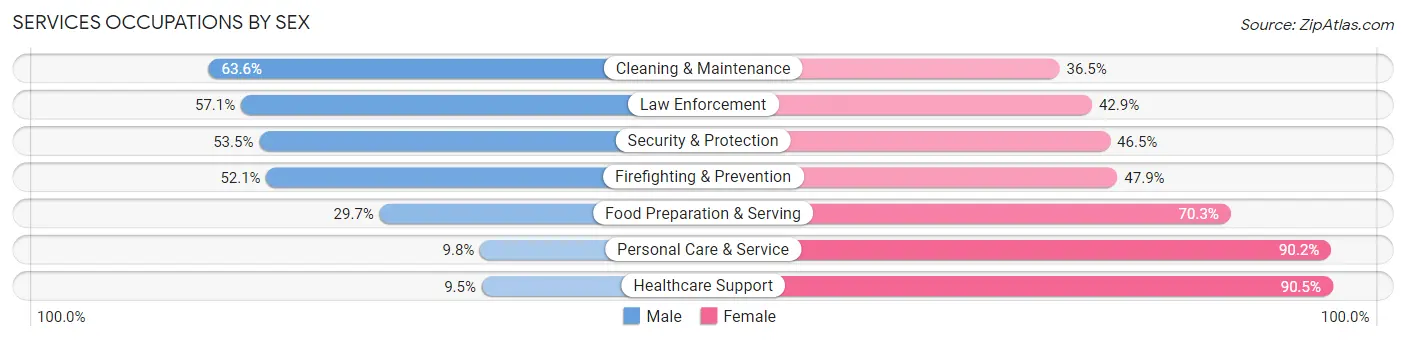
Within the Services occupations in Watertown, the most male-oriented occupations are Cleaning & Maintenance (63.5%), Law Enforcement (57.1%), and Security & Protection (53.5%), while the most female-oriented occupations are Healthcare Support (90.5%), Personal Care & Service (90.2%), and Food Preparation & Serving (70.3%).
| Occupation | Male | Female |
| Healthcare Support | 80 (9.5%) | 766 (90.5%) |
| Security & Protection | 53 (53.5%) | 46 (46.5%) |
| Firefighting & Prevention | 37 (52.1%) | 34 (47.9%) |
| Law Enforcement | 16 (57.1%) | 12 (42.9%) |
| Food Preparation & Serving | 201 (29.7%) | 476 (70.3%) |
| Cleaning & Maintenance | 401 (63.5%) | 230 (36.4%) |
| Personal Care & Service | 32 (9.8%) | 295 (90.2%) |
| Total (Category) | 767 (29.7%) | 1,813 (70.3%) |
| Total (Overall) | 5,937 (48.5%) | 6,291 (51.4%) |
Sales and Office Occupations
The most common Sales and Office occupations in Watertown are Office & Administration (1,496 | 12.2%), and Sales & Related (1,226 | 10.0%).
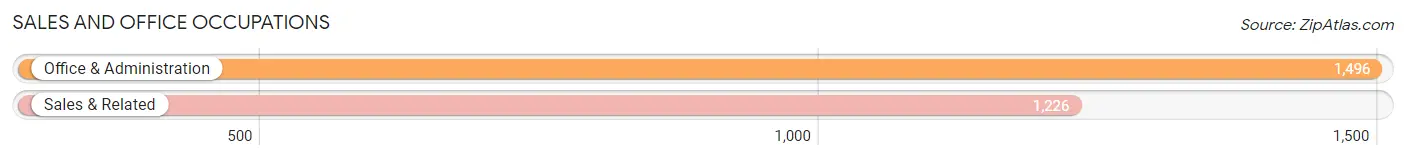
Sales and Office Occupations by Sex

| Occupation | Male | Female |
| Sales & Related | 450 (36.7%) | 776 (63.3%) |
| Office & Administration | 228 (15.2%) | 1,268 (84.8%) |
| Total (Category) | 678 (24.9%) | 2,044 (75.1%) |
| Total (Overall) | 5,937 (48.5%) | 6,291 (51.4%) |
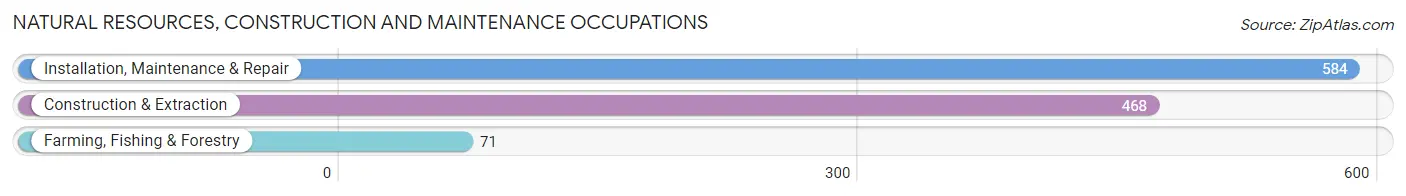
Natural Resources, Construction and Maintenance Occupations
The most common Natural Resources, Construction and Maintenance occupations in Watertown are Installation, Maintenance & Repair (584 | 4.8%), Construction & Extraction (468 | 3.8%), and Farming, Fishing & Forestry (71 | 0.6%).
Natural Resources, Construction and Maintenance Occupations by Sex
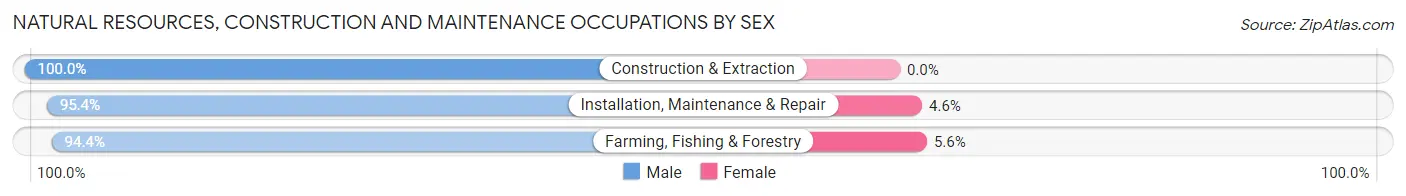
| Occupation | Male | Female |
| Farming, Fishing & Forestry | 67 (94.4%) | 4 (5.6%) |
| Construction & Extraction | 468 (100.0%) | 0 (0.0%) |
| Installation, Maintenance & Repair | 557 (95.4%) | 27 (4.6%) |
| Total (Category) | 1,092 (97.2%) | 31 (2.8%) |
| Total (Overall) | 5,937 (48.5%) | 6,291 (51.4%) |
Production, Transportation and Moving Occupations
The most common Production, Transportation and Moving occupations in Watertown are Production (1,605 | 13.1%), Material Moving (893 | 7.3%), and Transportation (357 | 2.9%).
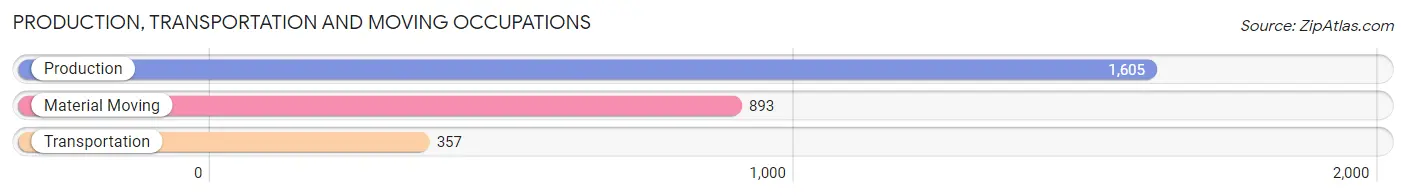
Production, Transportation and Moving Occupations by Sex
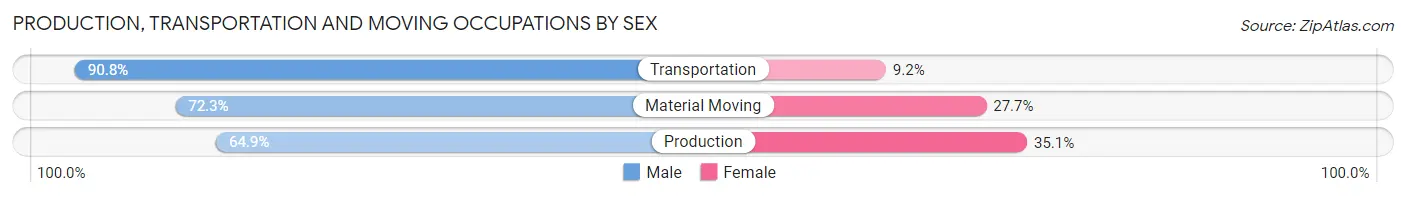
| Occupation | Male | Female |
| Production | 1,041 (64.9%) | 564 (35.1%) |
| Transportation | 324 (90.8%) | 33 (9.2%) |
| Material Moving | 646 (72.3%) | 247 (27.7%) |
| Total (Category) | 2,011 (70.4%) | 844 (29.6%) |
| Total (Overall) | 5,937 (48.5%) | 6,291 (51.4%) |
Employment Industries by Sex in Watertown
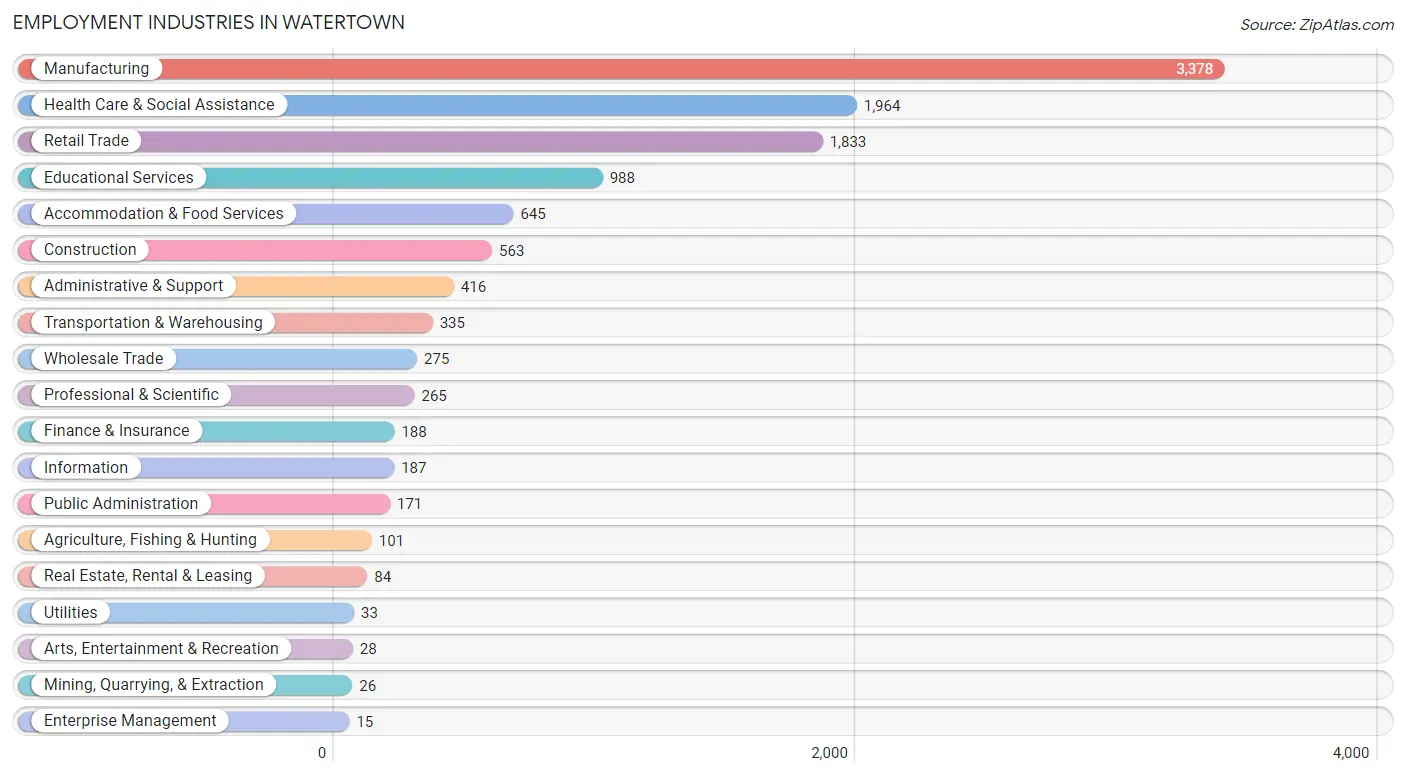
Employment Industries in Watertown
The major employment industries in Watertown include Manufacturing (3,378 | 27.6%), Health Care & Social Assistance (1,964 | 16.1%), Retail Trade (1,833 | 15.0%), Educational Services (988 | 8.1%), and Accommodation & Food Services (645 | 5.3%).
Employment Industries by Sex in Watertown
The Watertown industries that see more men than women are Mining, Quarrying, & Extraction (100.0%), Real Estate, Rental & Leasing (100.0%), and Construction (92.2%), whereas the industries that tend to have a higher number of women are Utilities (100.0%), Enterprise Management (100.0%), and Health Care & Social Assistance (87.1%).
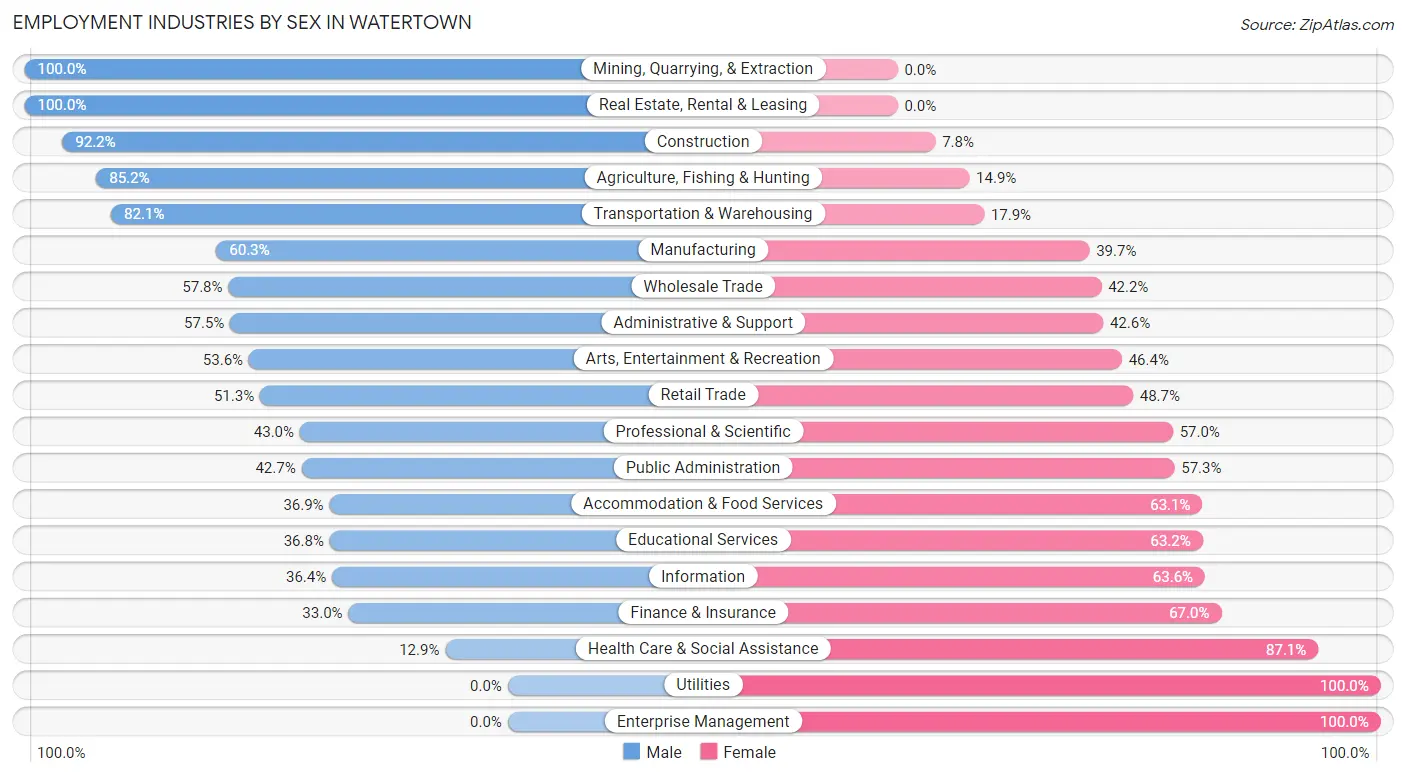
| Industry | Male | Female |
| Agriculture, Fishing & Hunting | 86 (85.2%) | 15 (14.8%) |
| Mining, Quarrying, & Extraction | 26 (100.0%) | 0 (0.0%) |
| Construction | 519 (92.2%) | 44 (7.8%) |
| Manufacturing | 2,037 (60.3%) | 1,341 (39.7%) |
| Wholesale Trade | 159 (57.8%) | 116 (42.2%) |
| Retail Trade | 940 (51.3%) | 893 (48.7%) |
| Transportation & Warehousing | 275 (82.1%) | 60 (17.9%) |
| Utilities | 0 (0.0%) | 33 (100.0%) |
| Information | 68 (36.4%) | 119 (63.6%) |
| Finance & Insurance | 62 (33.0%) | 126 (67.0%) |
| Real Estate, Rental & Leasing | 84 (100.0%) | 0 (0.0%) |
| Professional & Scientific | 114 (43.0%) | 151 (57.0%) |
| Enterprise Management | 0 (0.0%) | 15 (100.0%) |
| Administrative & Support | 239 (57.5%) | 177 (42.5%) |
| Educational Services | 364 (36.8%) | 624 (63.2%) |
| Health Care & Social Assistance | 254 (12.9%) | 1,710 (87.1%) |
| Arts, Entertainment & Recreation | 15 (53.6%) | 13 (46.4%) |
| Accommodation & Food Services | 238 (36.9%) | 407 (63.1%) |
| Public Administration | 73 (42.7%) | 98 (57.3%) |
| Total | 5,937 (48.5%) | 6,291 (51.4%) |
Education in Watertown
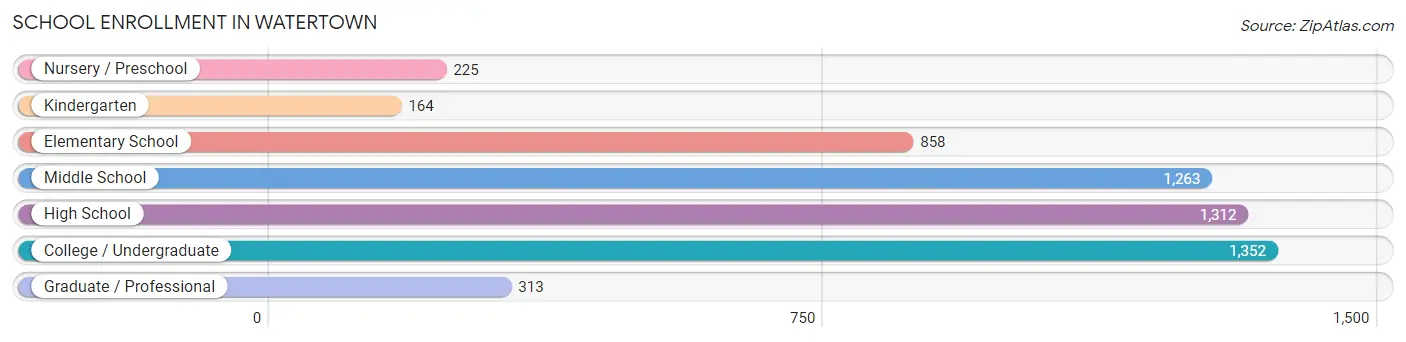
School Enrollment in Watertown
The most common levels of schooling among the 5,487 students in Watertown are college / undergraduate (1,352 | 24.6%), high school (1,312 | 23.9%), and middle school (1,263 | 23.0%).
| School Level | # Students | % Students |
| Nursery / Preschool | 225 | 4.1% |
| Kindergarten | 164 | 3.0% |
| Elementary School | 858 | 15.6% |
| Middle School | 1,263 | 23.0% |
| High School | 1,312 | 23.9% |
| College / Undergraduate | 1,352 | 24.6% |
| Graduate / Professional | 313 | 5.7% |
| Total | 5,487 | 100.0% |
School Enrollment by Age by Funding Source in Watertown
Out of a total of 5,487 students who are enrolled in schools in Watertown, 1,405 (25.6%) attend a private institution, while the remaining 4,082 (74.4%) are enrolled in public schools. The age group of 35 years and over has the highest likelihood of being enrolled in private schools, with 200 (61.4% in the age bracket) enrolled. Conversely, the age group of 15 to 17 year olds has the lowest likelihood of being enrolled in a private school, with 786 (85.8% in the age bracket) attending a public institution.
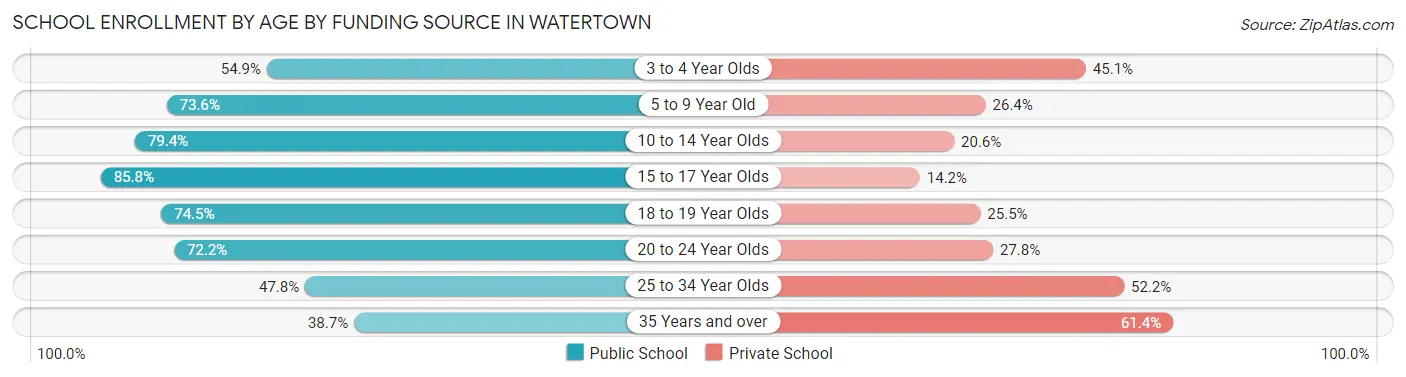
| Age Bracket | Public School | Private School |
| 3 to 4 Year Olds | 90 (54.9%) | 74 (45.1%) |
| 5 to 9 Year Old | 701 (73.6%) | 252 (26.4%) |
| 10 to 14 Year Olds | 1,306 (79.4%) | 338 (20.6%) |
| 15 to 17 Year Olds | 786 (85.8%) | 130 (14.2%) |
| 18 to 19 Year Olds | 515 (74.5%) | 176 (25.5%) |
| 20 to 24 Year Olds | 524 (72.2%) | 202 (27.8%) |
| 25 to 34 Year Olds | 32 (47.8%) | 35 (52.2%) |
| 35 Years and over | 126 (38.7%) | 200 (61.4%) |
| Total | 4,082 (74.4%) | 1,405 (25.6%) |
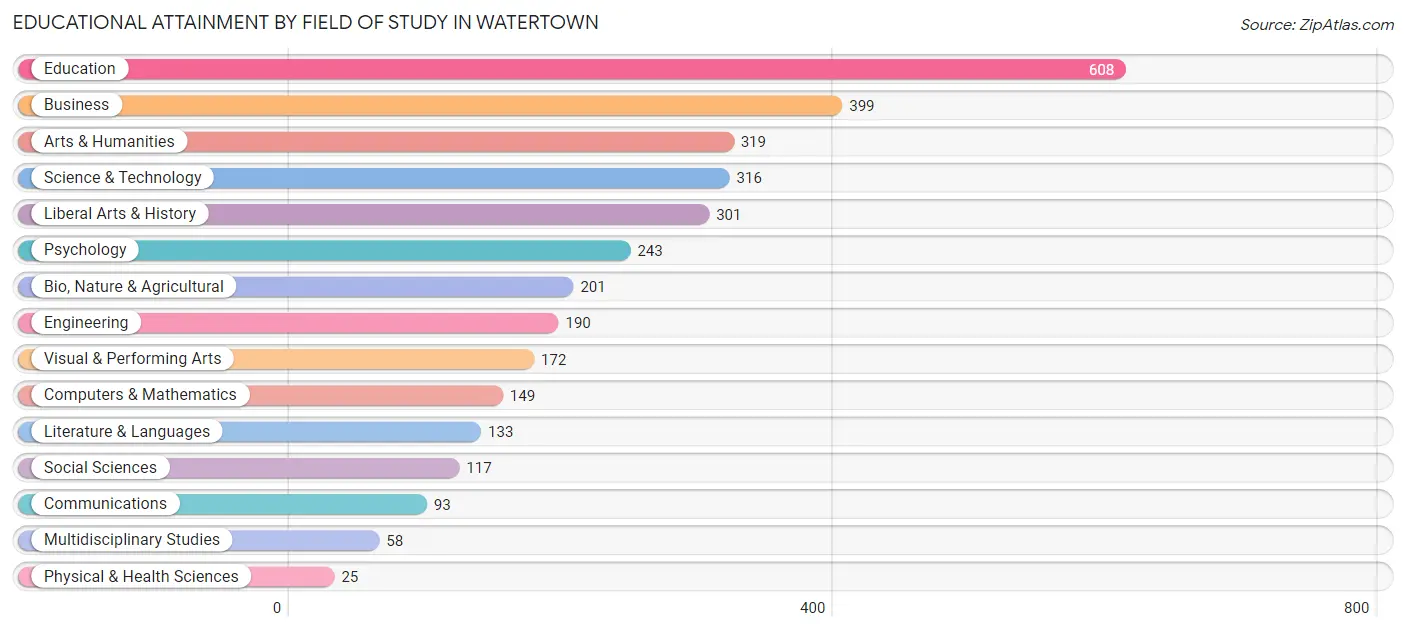
Educational Attainment by Field of Study in Watertown
Education (608 | 18.3%), business (399 | 12.0%), arts & humanities (319 | 9.6%), science & technology (316 | 9.5%), and liberal arts & history (301 | 9.1%) are the most common fields of study among 3,324 individuals in Watertown who have obtained a bachelor's degree or higher.
| Field of Study | # Graduates | % Graduates |
| Computers & Mathematics | 149 | 4.5% |
| Bio, Nature & Agricultural | 201 | 6.0% |
| Physical & Health Sciences | 25 | 0.7% |
| Psychology | 243 | 7.3% |
| Social Sciences | 117 | 3.5% |
| Engineering | 190 | 5.7% |
| Multidisciplinary Studies | 58 | 1.7% |
| Science & Technology | 316 | 9.5% |
| Business | 399 | 12.0% |
| Education | 608 | 18.3% |
| Literature & Languages | 133 | 4.0% |
| Liberal Arts & History | 301 | 9.1% |
| Visual & Performing Arts | 172 | 5.2% |
| Communications | 93 | 2.8% |
| Arts & Humanities | 319 | 9.6% |
| Total | 3,324 | 100.0% |
Transportation & Commute in Watertown
Vehicle Availability by Sex in Watertown
The most prevalent vehicle ownership categories in Watertown are males with 2 vehicles (2,790, accounting for 50.2%) and females with 2 vehicles (2,302, making up 46.9%).
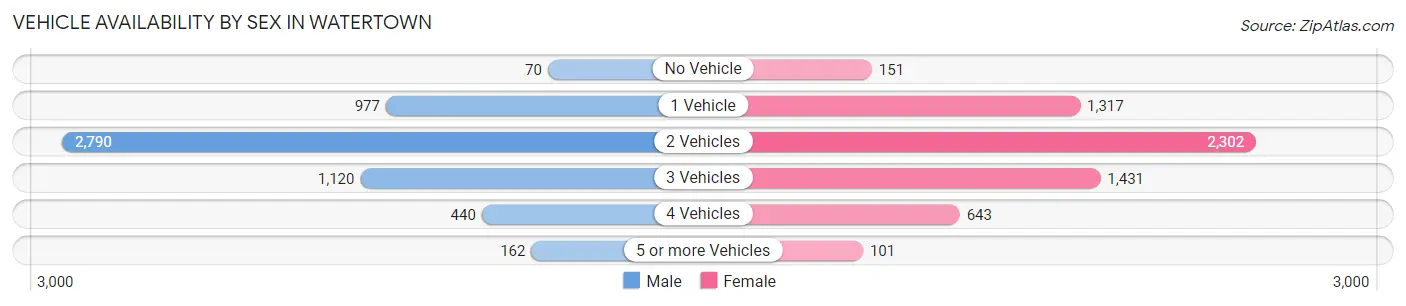
| Vehicles Available | Male | Female |
| No Vehicle | 70 (1.3%) | 151 (2.5%) |
| 1 Vehicle | 977 (17.6%) | 1,317 (22.2%) |
| 2 Vehicles | 2,790 (50.2%) | 2,302 (38.7%) |
| 3 Vehicles | 1,120 (20.2%) | 1,431 (24.1%) |
| 4 Vehicles | 440 (7.9%) | 643 (10.8%) |
| 5 or more Vehicles | 162 (2.9%) | 101 (1.7%) |
| Total | 5,559 (100.0%) | 5,945 (100.0%) |
Commute Time in Watertown
The most frequently occuring commute durations in Watertown are 5 to 9 minutes (1,977 commuters, 17.6%), 10 to 14 minutes (1,929 commuters, 17.1%), and 30 to 34 minutes (1,396 commuters, 12.4%).
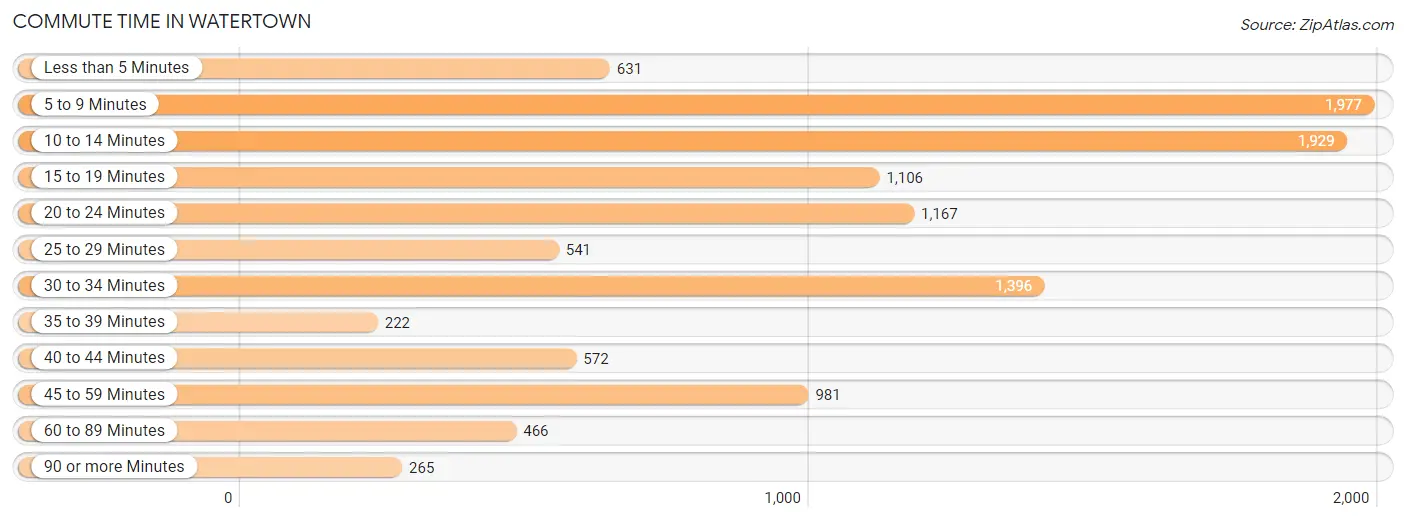
| Commute Time | # Commuters | % Commuters |
| Less than 5 Minutes | 631 | 5.6% |
| 5 to 9 Minutes | 1,977 | 17.6% |
| 10 to 14 Minutes | 1,929 | 17.1% |
| 15 to 19 Minutes | 1,106 | 9.8% |
| 20 to 24 Minutes | 1,167 | 10.4% |
| 25 to 29 Minutes | 541 | 4.8% |
| 30 to 34 Minutes | 1,396 | 12.4% |
| 35 to 39 Minutes | 222 | 2.0% |
| 40 to 44 Minutes | 572 | 5.1% |
| 45 to 59 Minutes | 981 | 8.7% |
| 60 to 89 Minutes | 466 | 4.1% |
| 90 or more Minutes | 265 | 2.4% |
Commute Time by Sex in Watertown
The most common commute times in Watertown are 5 to 9 minutes (821 commuters, 15.0%) for males and 10 to 14 minutes (1,165 commuters, 20.1%) for females.
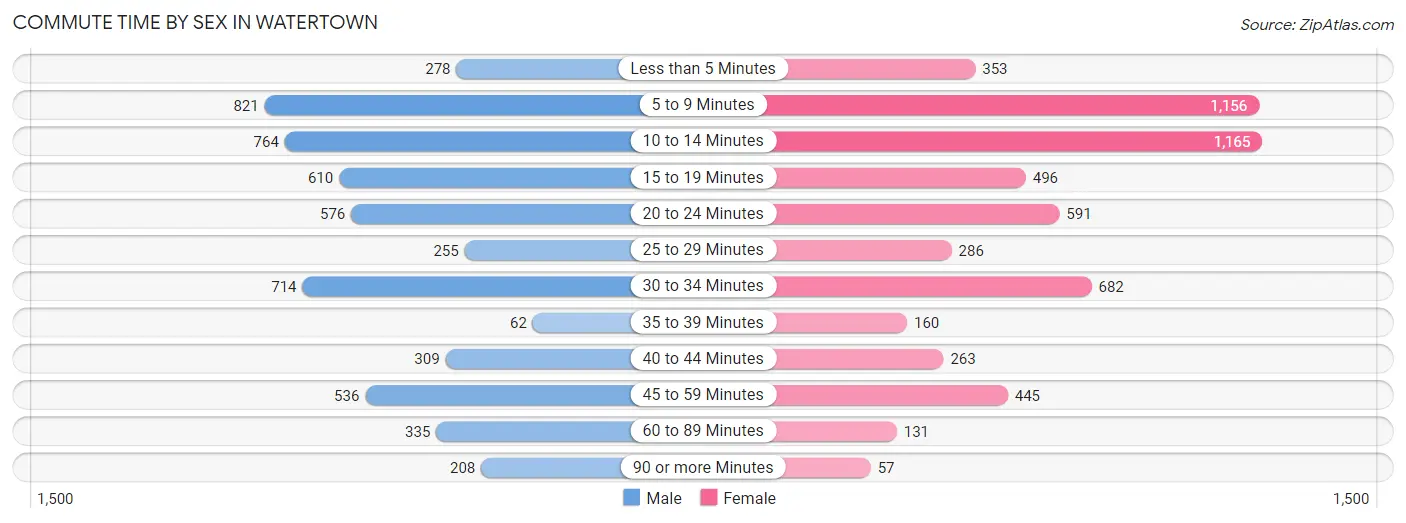
| Commute Time | Male | Female |
| Less than 5 Minutes | 278 (5.1%) | 353 (6.1%) |
| 5 to 9 Minutes | 821 (15.0%) | 1,156 (20.0%) |
| 10 to 14 Minutes | 764 (14.0%) | 1,165 (20.1%) |
| 15 to 19 Minutes | 610 (11.2%) | 496 (8.6%) |
| 20 to 24 Minutes | 576 (10.5%) | 591 (10.2%) |
| 25 to 29 Minutes | 255 (4.7%) | 286 (4.9%) |
| 30 to 34 Minutes | 714 (13.1%) | 682 (11.8%) |
| 35 to 39 Minutes | 62 (1.1%) | 160 (2.8%) |
| 40 to 44 Minutes | 309 (5.7%) | 263 (4.5%) |
| 45 to 59 Minutes | 536 (9.8%) | 445 (7.7%) |
| 60 to 89 Minutes | 335 (6.1%) | 131 (2.3%) |
| 90 or more Minutes | 208 (3.8%) | 57 (1.0%) |
Time of Departure to Work by Sex in Watertown
The most frequent times of departure to work in Watertown are 12:00 AM to 4:59 AM (698, 12.8%) for males and 7:00 AM to 7:29 AM (712, 12.3%) for females.
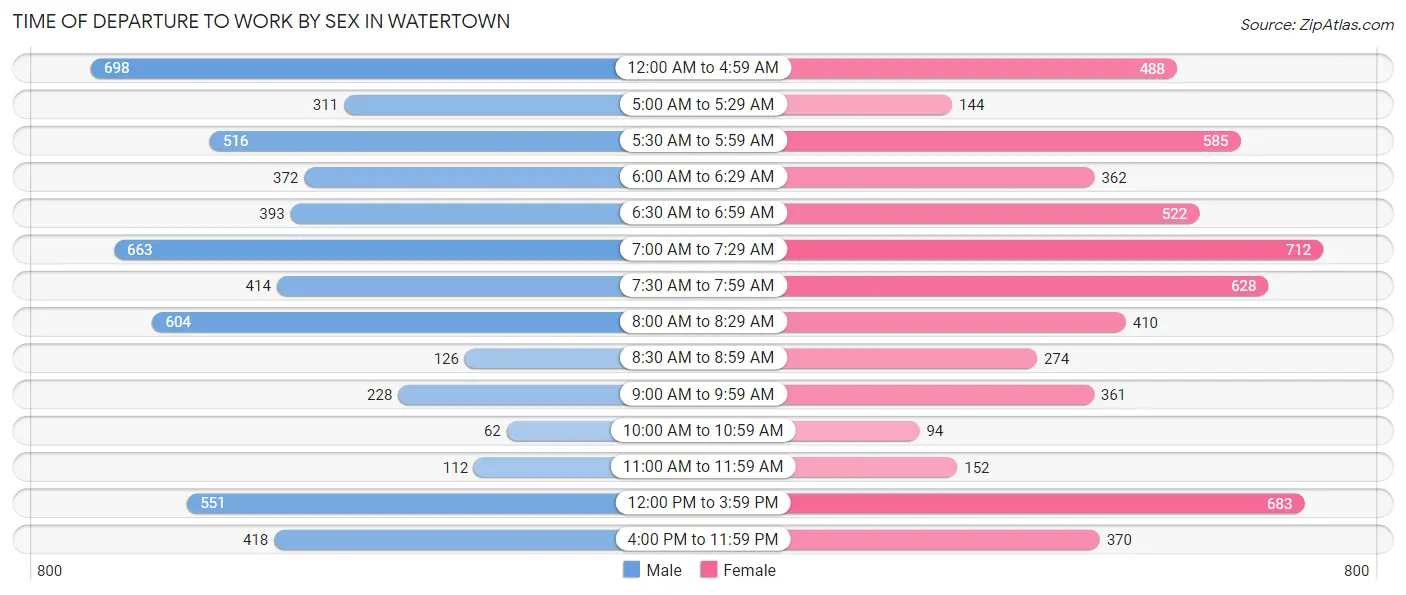
| Time of Departure | Male | Female |
| 12:00 AM to 4:59 AM | 698 (12.8%) | 488 (8.4%) |
| 5:00 AM to 5:29 AM | 311 (5.7%) | 144 (2.5%) |
| 5:30 AM to 5:59 AM | 516 (9.4%) | 585 (10.1%) |
| 6:00 AM to 6:29 AM | 372 (6.8%) | 362 (6.3%) |
| 6:30 AM to 6:59 AM | 393 (7.2%) | 522 (9.0%) |
| 7:00 AM to 7:29 AM | 663 (12.1%) | 712 (12.3%) |
| 7:30 AM to 7:59 AM | 414 (7.6%) | 628 (10.9%) |
| 8:00 AM to 8:29 AM | 604 (11.1%) | 410 (7.1%) |
| 8:30 AM to 8:59 AM | 126 (2.3%) | 274 (4.7%) |
| 9:00 AM to 9:59 AM | 228 (4.2%) | 361 (6.2%) |
| 10:00 AM to 10:59 AM | 62 (1.1%) | 94 (1.6%) |
| 11:00 AM to 11:59 AM | 112 (2.1%) | 152 (2.6%) |
| 12:00 PM to 3:59 PM | 551 (10.1%) | 683 (11.8%) |
| 4:00 PM to 11:59 PM | 418 (7.6%) | 370 (6.4%) |
| Total | 5,468 (100.0%) | 5,785 (100.0%) |
Housing Occupancy in Watertown
Occupancy by Ownership in Watertown
Of the total 8,756 dwellings in Watertown, owner-occupied units account for 5,243 (59.9%), while renter-occupied units make up 3,513 (40.1%).
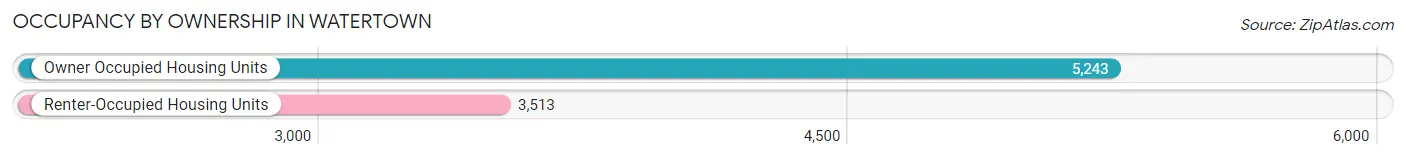
| Occupancy | # Housing Units | % Housing Units |
| Owner Occupied Housing Units | 5,243 | 59.9% |
| Renter-Occupied Housing Units | 3,513 | 40.1% |
| Total Occupied Housing Units | 8,756 | 100.0% |
Occupancy by Household Size in Watertown
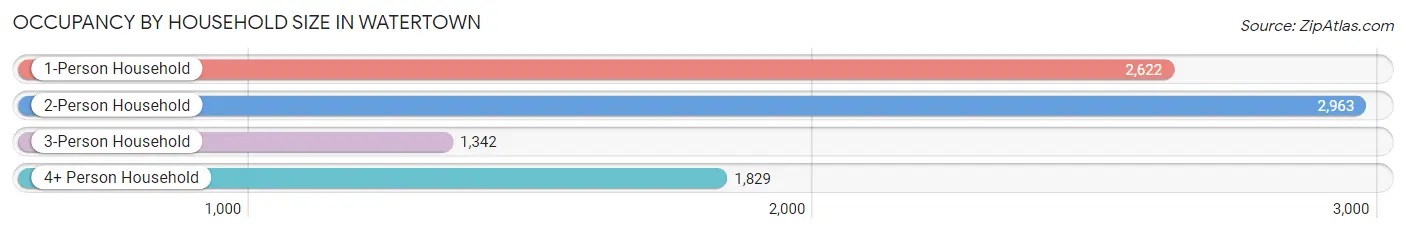
| Household Size | # Housing Units | % Housing Units |
| 1-Person Household | 2,622 | 29.9% |
| 2-Person Household | 2,963 | 33.8% |
| 3-Person Household | 1,342 | 15.3% |
| 4+ Person Household | 1,829 | 20.9% |
| Total Housing Units | 8,756 | 100.0% |
Occupancy by Ownership by Household Size in Watertown
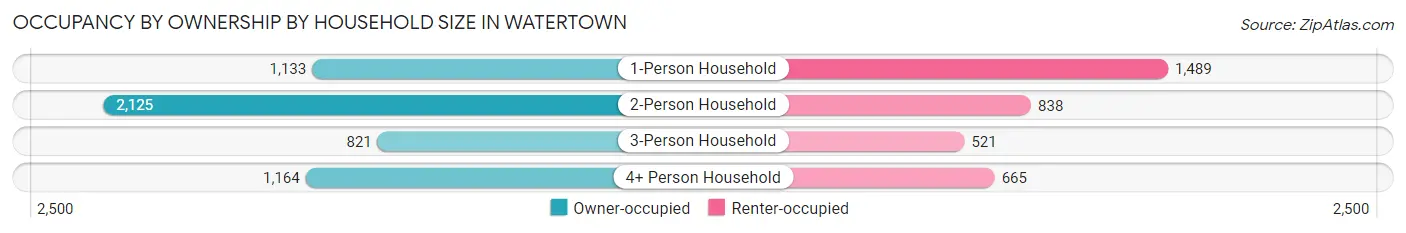
| Household Size | Owner-occupied | Renter-occupied |
| 1-Person Household | 1,133 (43.2%) | 1,489 (56.8%) |
| 2-Person Household | 2,125 (71.7%) | 838 (28.3%) |
| 3-Person Household | 821 (61.2%) | 521 (38.8%) |
| 4+ Person Household | 1,164 (63.6%) | 665 (36.4%) |
| Total Housing Units | 5,243 (59.9%) | 3,513 (40.1%) |
Occupancy by Educational Attainment in Watertown
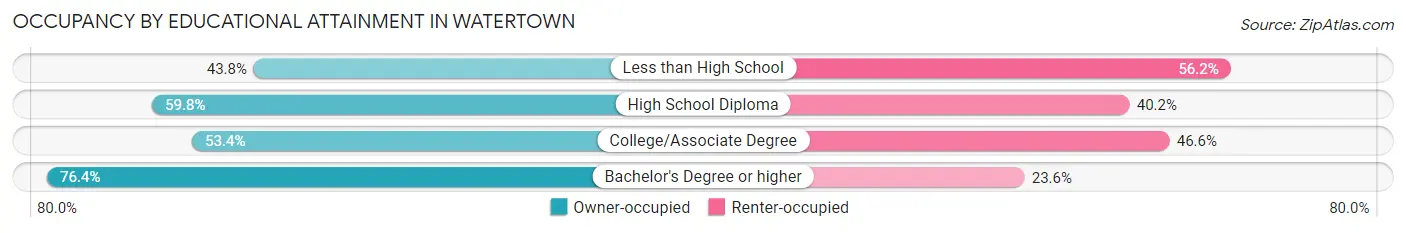
| Household Size | Owner-occupied | Renter-occupied |
| Less than High School | 244 (43.8%) | 313 (56.2%) |
| High School Diploma | 1,899 (59.8%) | 1,278 (40.2%) |
| College/Associate Degree | 1,715 (53.4%) | 1,495 (46.6%) |
| Bachelor's Degree or higher | 1,385 (76.4%) | 427 (23.6%) |
Occupancy by Age of Householder in Watertown
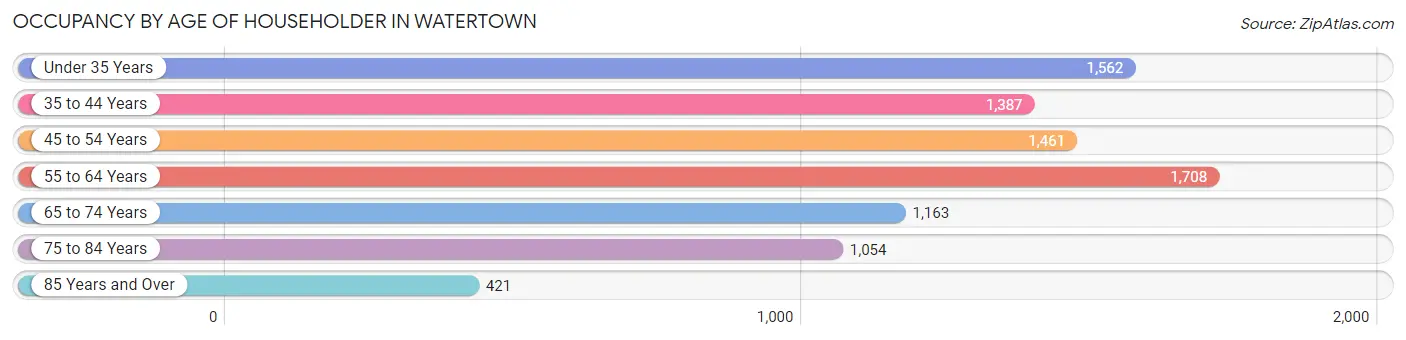
| Age Bracket | # Households | % Households |
| Under 35 Years | 1,562 | 17.8% |
| 35 to 44 Years | 1,387 | 15.8% |
| 45 to 54 Years | 1,461 | 16.7% |
| 55 to 64 Years | 1,708 | 19.5% |
| 65 to 74 Years | 1,163 | 13.3% |
| 75 to 84 Years | 1,054 | 12.0% |
| 85 Years and Over | 421 | 4.8% |
| Total | 8,756 | 100.0% |
Housing Finances in Watertown
Median Income by Occupancy in Watertown
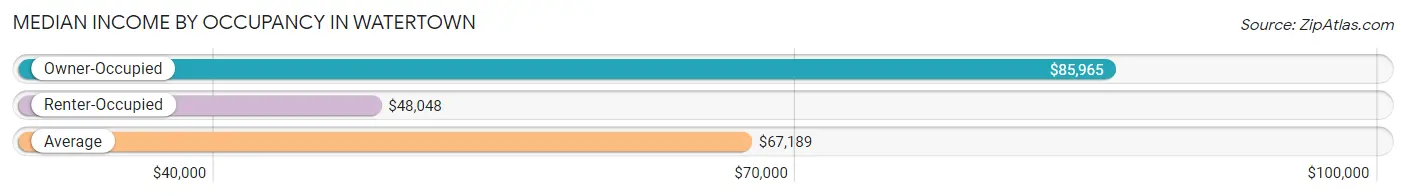
| Occupancy Type | # Households | Median Income |
| Owner-Occupied | 5,243 (59.9%) | $85,965 |
| Renter-Occupied | 3,513 (40.1%) | $48,048 |
| Average | 8,756 (100.0%) | $67,189 |
Occupancy by Householder Income Bracket in Watertown
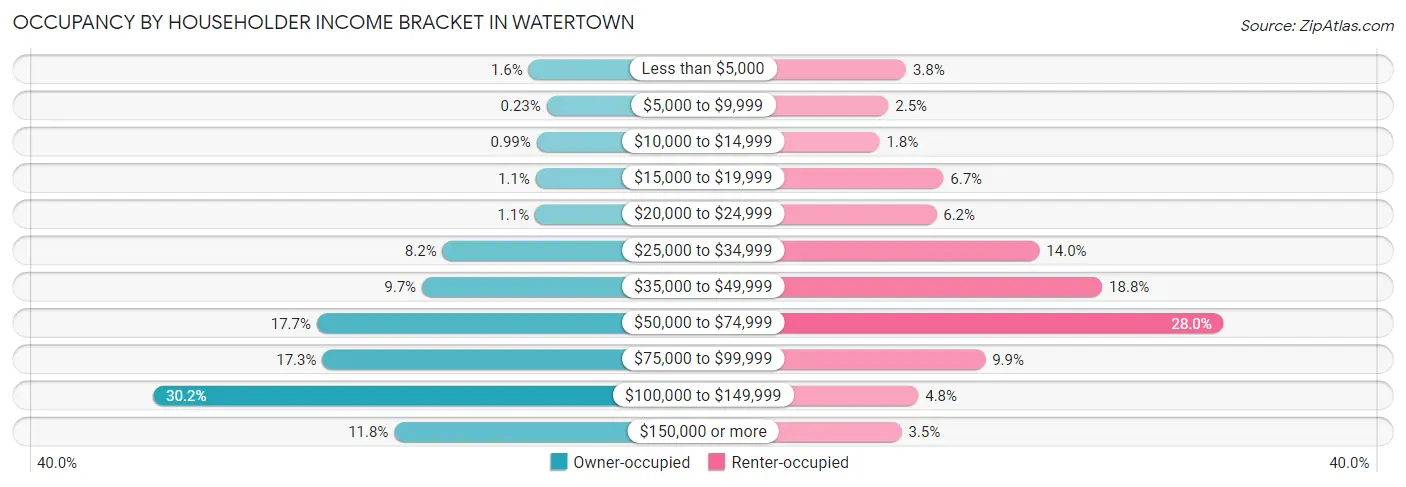
| Income Bracket | Owner-occupied | Renter-occupied |
| Less than $5,000 | 84 (1.6%) | 135 (3.8%) |
| $5,000 to $9,999 | 12 (0.2%) | 88 (2.5%) |
| $10,000 to $14,999 | 52 (1.0%) | 64 (1.8%) |
| $15,000 to $19,999 | 56 (1.1%) | 235 (6.7%) |
| $20,000 to $24,999 | 58 (1.1%) | 216 (6.1%) |
| $25,000 to $34,999 | 428 (8.2%) | 492 (14.0%) |
| $35,000 to $49,999 | 510 (9.7%) | 660 (18.8%) |
| $50,000 to $74,999 | 930 (17.7%) | 985 (28.0%) |
| $75,000 to $99,999 | 908 (17.3%) | 347 (9.9%) |
| $100,000 to $149,999 | 1,584 (30.2%) | 168 (4.8%) |
| $150,000 or more | 621 (11.8%) | 123 (3.5%) |
| Total | 5,243 (100.0%) | 3,513 (100.0%) |
Monthly Housing Cost Tiers in Watertown
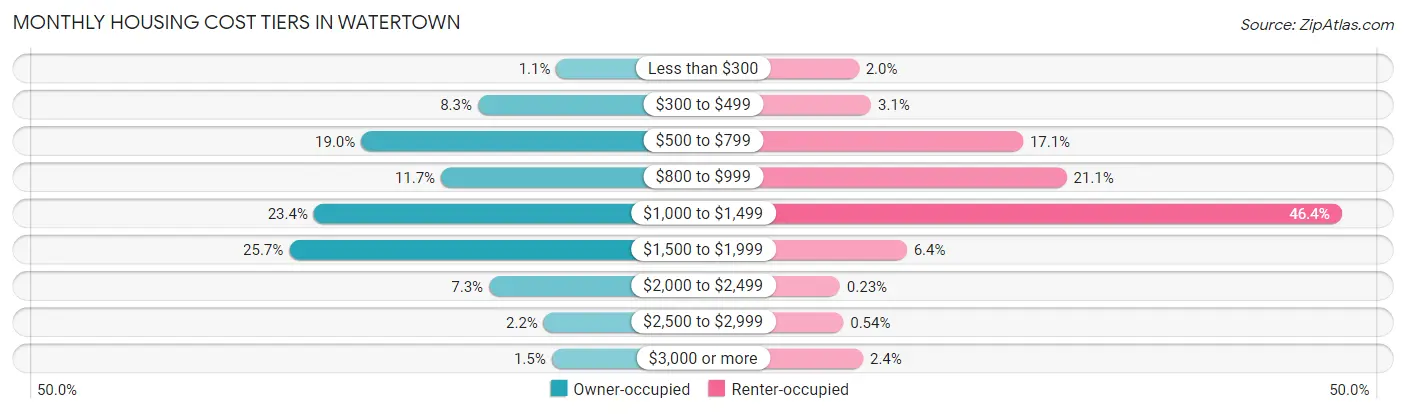
| Monthly Cost | Owner-occupied | Renter-occupied |
| Less than $300 | 55 (1.1%) | 69 (2.0%) |
| $300 to $499 | 434 (8.3%) | 109 (3.1%) |
| $500 to $799 | 997 (19.0%) | 600 (17.1%) |
| $800 to $999 | 612 (11.7%) | 741 (21.1%) |
| $1,000 to $1,499 | 1,226 (23.4%) | 1,630 (46.4%) |
| $1,500 to $1,999 | 1,345 (25.7%) | 224 (6.4%) |
| $2,000 to $2,499 | 380 (7.2%) | 8 (0.2%) |
| $2,500 to $2,999 | 116 (2.2%) | 19 (0.5%) |
| $3,000 or more | 78 (1.5%) | 83 (2.4%) |
| Total | 5,243 (100.0%) | 3,513 (100.0%) |
Physical Housing Characteristics in Watertown
Housing Structures in Watertown
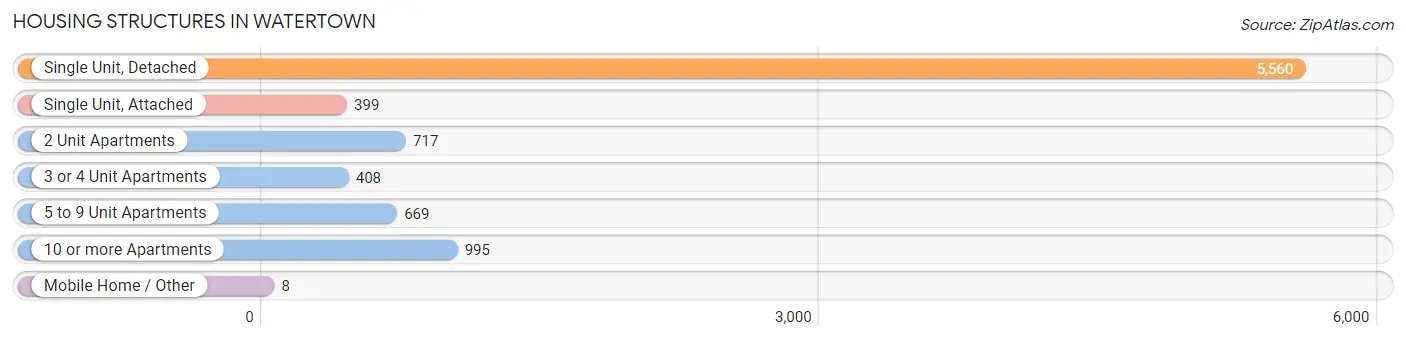
| Structure Type | # Housing Units | % Housing Units |
| Single Unit, Detached | 5,560 | 63.5% |
| Single Unit, Attached | 399 | 4.6% |
| 2 Unit Apartments | 717 | 8.2% |
| 3 or 4 Unit Apartments | 408 | 4.7% |
| 5 to 9 Unit Apartments | 669 | 7.6% |
| 10 or more Apartments | 995 | 11.4% |
| Mobile Home / Other | 8 | 0.1% |
| Total | 8,756 | 100.0% |
Housing Structures by Occupancy in Watertown
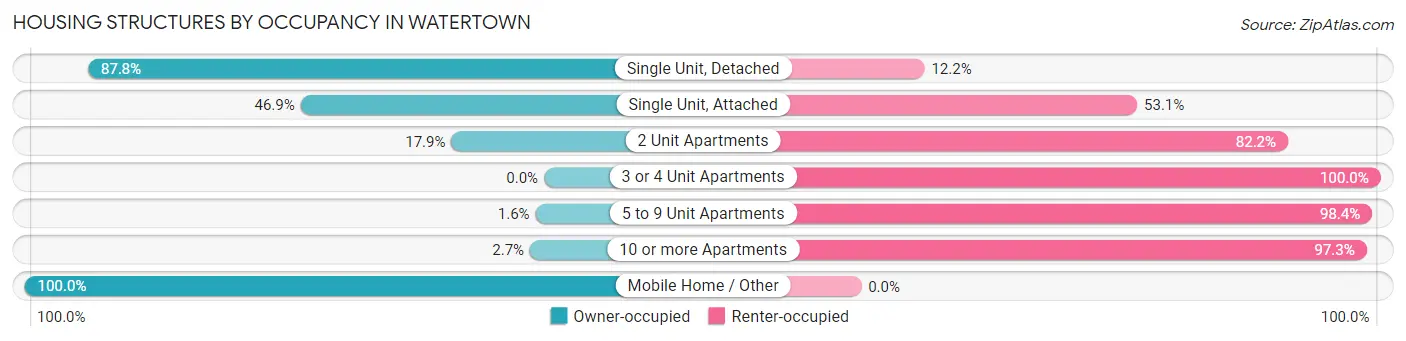
| Structure Type | Owner-occupied | Renter-occupied |
| Single Unit, Detached | 4,882 (87.8%) | 678 (12.2%) |
| Single Unit, Attached | 187 (46.9%) | 212 (53.1%) |
| 2 Unit Apartments | 128 (17.8%) | 589 (82.2%) |
| 3 or 4 Unit Apartments | 0 (0.0%) | 408 (100.0%) |
| 5 to 9 Unit Apartments | 11 (1.6%) | 658 (98.4%) |
| 10 or more Apartments | 27 (2.7%) | 968 (97.3%) |
| Mobile Home / Other | 8 (100.0%) | 0 (0.0%) |
| Total | 5,243 (59.9%) | 3,513 (40.1%) |
Housing Structures by Number of Rooms in Watertown
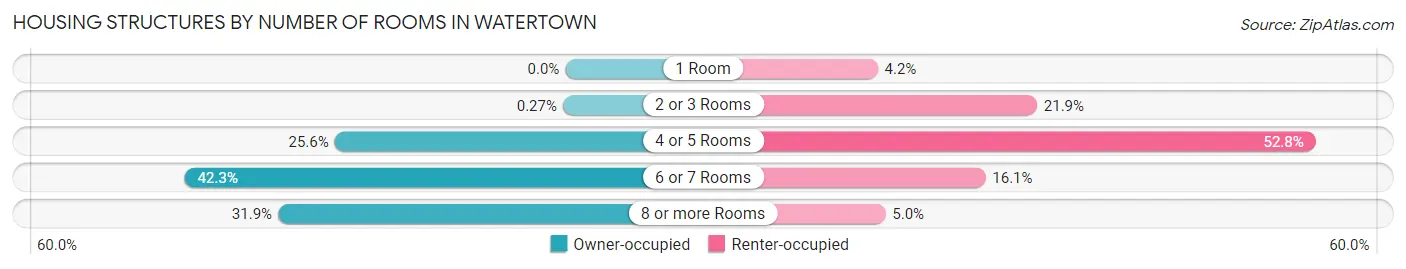
| Number of Rooms | Owner-occupied | Renter-occupied |
| 1 Room | 0 (0.0%) | 147 (4.2%) |
| 2 or 3 Rooms | 14 (0.3%) | 768 (21.9%) |
| 4 or 5 Rooms | 1,342 (25.6%) | 1,854 (52.8%) |
| 6 or 7 Rooms | 2,215 (42.2%) | 567 (16.1%) |
| 8 or more Rooms | 1,672 (31.9%) | 177 (5.0%) |
| Total | 5,243 (100.0%) | 3,513 (100.0%) |
Housing Structure by Heating Type in Watertown
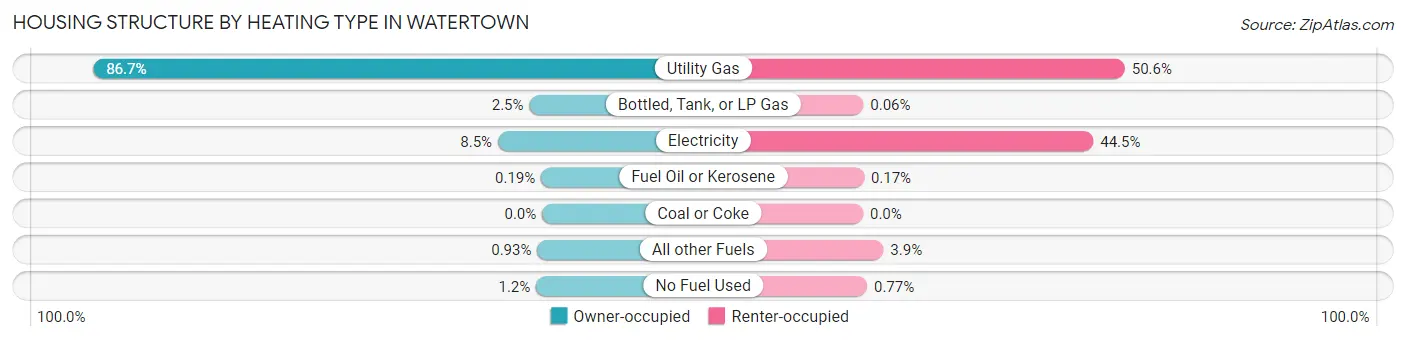
| Heating Type | Owner-occupied | Renter-occupied |
| Utility Gas | 4,547 (86.7%) | 1,777 (50.6%) |
| Bottled, Tank, or LP Gas | 129 (2.5%) | 2 (0.1%) |
| Electricity | 447 (8.5%) | 1,563 (44.5%) |
| Fuel Oil or Kerosene | 10 (0.2%) | 6 (0.2%) |
| Coal or Coke | 0 (0.0%) | 0 (0.0%) |
| All other Fuels | 49 (0.9%) | 138 (3.9%) |
| No Fuel Used | 61 (1.2%) | 27 (0.8%) |
| Total | 5,243 (100.0%) | 3,513 (100.0%) |
Household Vehicle Usage in Watertown
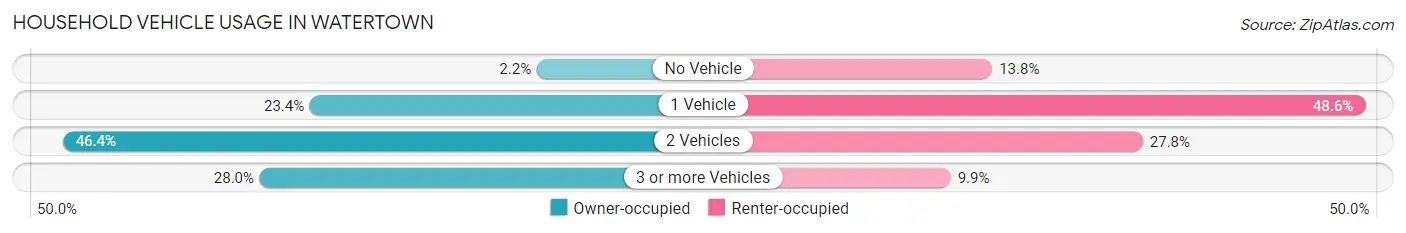
| Vehicles per Household | Owner-occupied | Renter-occupied |
| No Vehicle | 114 (2.2%) | 483 (13.8%) |
| 1 Vehicle | 1,224 (23.4%) | 1,706 (48.6%) |
| 2 Vehicles | 2,435 (46.4%) | 977 (27.8%) |
| 3 or more Vehicles | 1,470 (28.0%) | 347 (9.9%) |
| Total | 5,243 (100.0%) | 3,513 (100.0%) |
Real Estate & Mortgages in Watertown
Real Estate and Mortgage Overview in Watertown
| Characteristic | Without Mortgage | With Mortgage |
| Housing Units | 1,930 | 3,313 |
| Median Property Value | $201,000 | $192,700 |
| Median Household Income | $80,160 | $403 |
| Monthly Housing Costs | $628 | $78 |
| Real Estate Taxes | $3,732 | $14 |
Property Value by Mortgage Status in Watertown
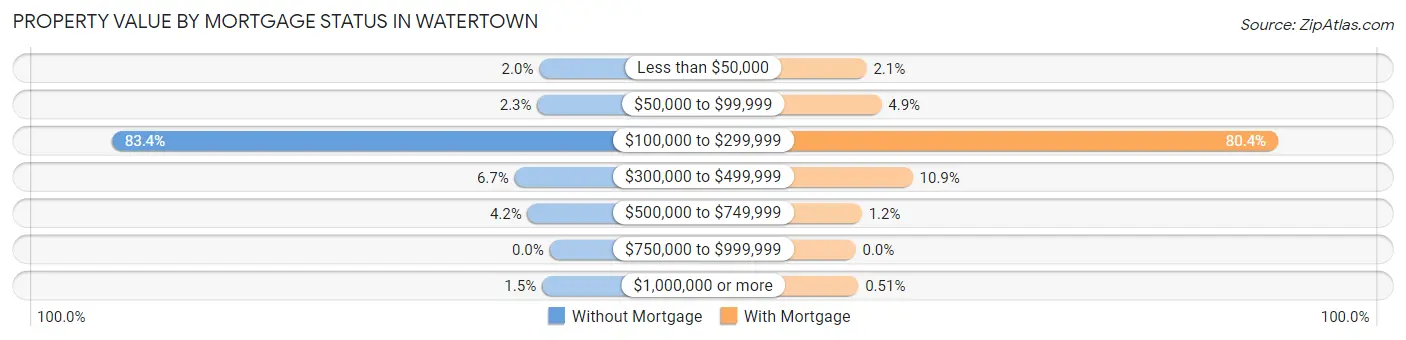
| Property Value | Without Mortgage | With Mortgage |
| Less than $50,000 | 38 (2.0%) | 69 (2.1%) |
| $50,000 to $99,999 | 45 (2.3%) | 163 (4.9%) |
| $100,000 to $299,999 | 1,609 (83.4%) | 2,665 (80.4%) |
| $300,000 to $499,999 | 129 (6.7%) | 360 (10.9%) |
| $500,000 to $749,999 | 81 (4.2%) | 39 (1.2%) |
| $750,000 to $999,999 | 0 (0.0%) | 0 (0.0%) |
| $1,000,000 or more | 28 (1.5%) | 17 (0.5%) |
| Total | 1,930 (100.0%) | 3,313 (100.0%) |
Household Income by Mortgage Status in Watertown
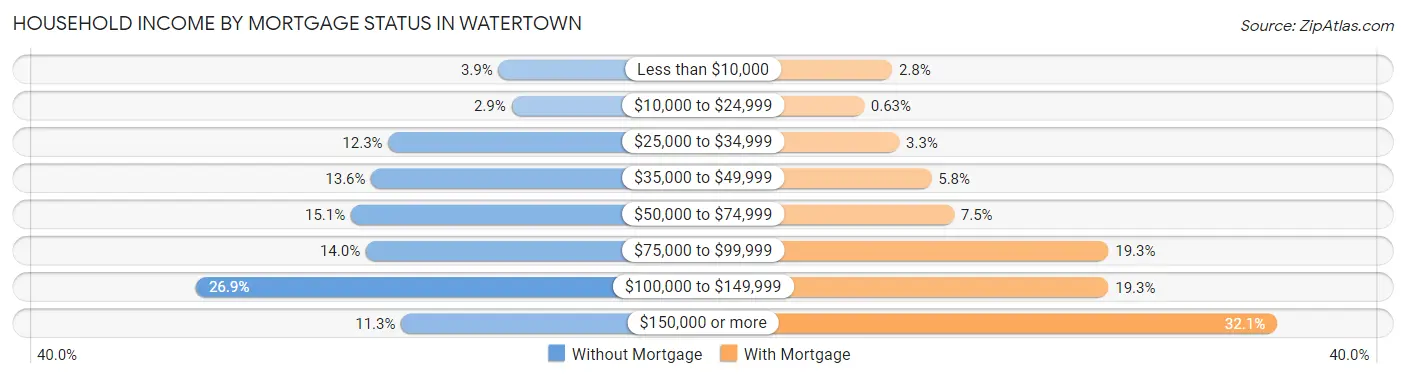
| Household Income | Without Mortgage | With Mortgage |
| Less than $10,000 | 75 (3.9%) | 92 (2.8%) |
| $10,000 to $24,999 | 56 (2.9%) | 21 (0.6%) |
| $25,000 to $34,999 | 237 (12.3%) | 110 (3.3%) |
| $35,000 to $49,999 | 262 (13.6%) | 191 (5.8%) |
| $50,000 to $74,999 | 292 (15.1%) | 248 (7.5%) |
| $75,000 to $99,999 | 270 (14.0%) | 638 (19.3%) |
| $100,000 to $149,999 | 520 (26.9%) | 638 (19.3%) |
| $150,000 or more | 218 (11.3%) | 1,064 (32.1%) |
| Total | 1,930 (100.0%) | 3,313 (100.0%) |
Property Value to Household Income Ratio in Watertown
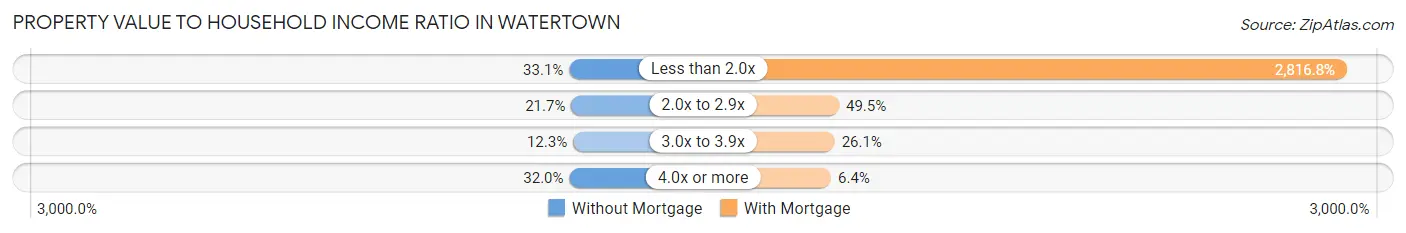
| Value-to-Income Ratio | Without Mortgage | With Mortgage |
| Less than 2.0x | 638 (33.1%) | 93,320 (2,816.8%) |
| 2.0x to 2.9x | 419 (21.7%) | 1,640 (49.5%) |
| 3.0x to 3.9x | 238 (12.3%) | 863 (26.1%) |
| 4.0x or more | 618 (32.0%) | 211 (6.4%) |
| Total | 1,930 (100.0%) | 3,313 (100.0%) |
Real Estate Taxes by Mortgage Status in Watertown
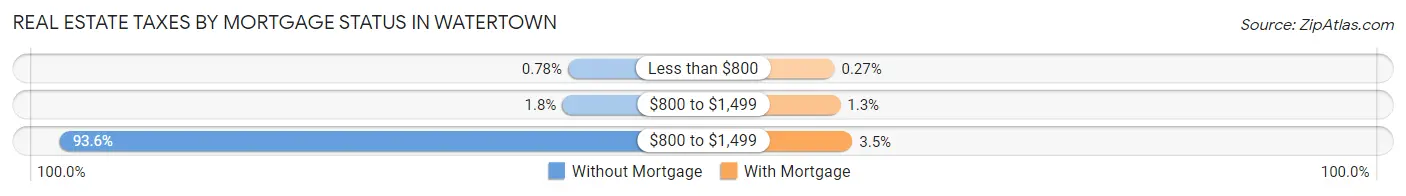
| Property Taxes | Without Mortgage | With Mortgage |
| Less than $800 | 15 (0.8%) | 9 (0.3%) |
| $800 to $1,499 | 35 (1.8%) | 44 (1.3%) |
| $800 to $1,499 | 1,806 (93.6%) | 117 (3.5%) |
| Total | 1,930 (100.0%) | 3,313 (100.0%) |
Health & Disability in Watertown
Health Insurance Coverage by Age in Watertown
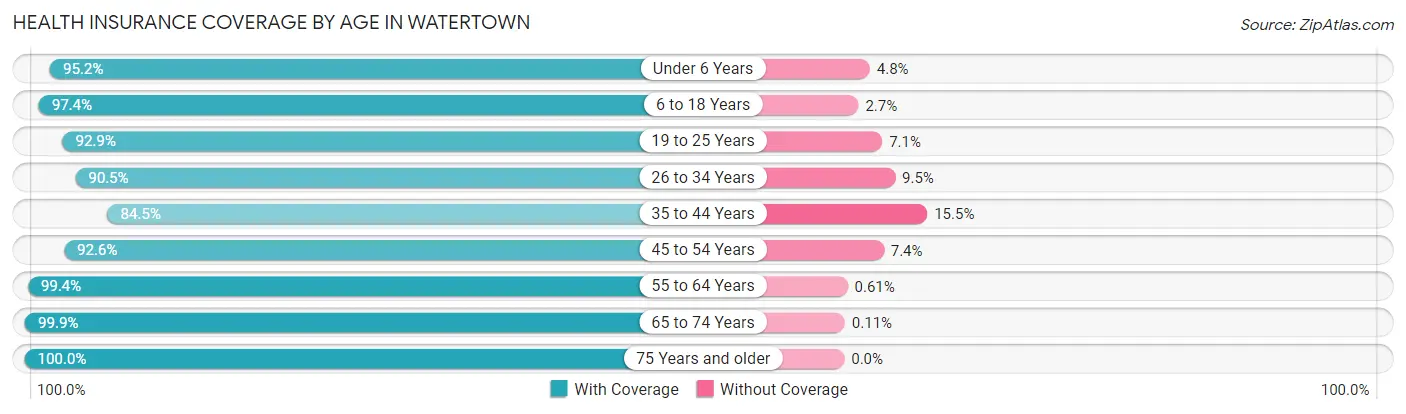
| Age Bracket | With Coverage | Without Coverage |
| Under 6 Years | 1,361 (95.2%) | 68 (4.8%) |
| 6 to 18 Years | 3,856 (97.4%) | 105 (2.6%) |
| 19 to 25 Years | 2,440 (92.9%) | 186 (7.1%) |
| 26 to 34 Years | 1,997 (90.5%) | 209 (9.5%) |
| 35 to 44 Years | 2,251 (84.5%) | 412 (15.5%) |
| 45 to 54 Years | 2,593 (92.6%) | 206 (7.4%) |
| 55 to 64 Years | 3,079 (99.4%) | 19 (0.6%) |
| 65 to 74 Years | 1,901 (99.9%) | 2 (0.1%) |
| 75 Years and older | 2,042 (100.0%) | 0 (0.0%) |
| Total | 21,520 (94.7%) | 1,207 (5.3%) |
Health Insurance Coverage by Citizenship Status in Watertown
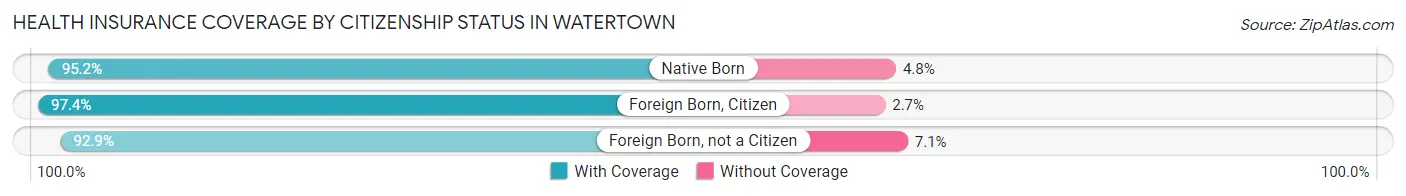
| Citizenship Status | With Coverage | Without Coverage |
| Native Born | 1,361 (95.2%) | 68 (4.8%) |
| Foreign Born, Citizen | 3,856 (97.4%) | 105 (2.6%) |
| Foreign Born, not a Citizen | 2,440 (92.9%) | 186 (7.1%) |
Health Insurance Coverage by Household Income in Watertown
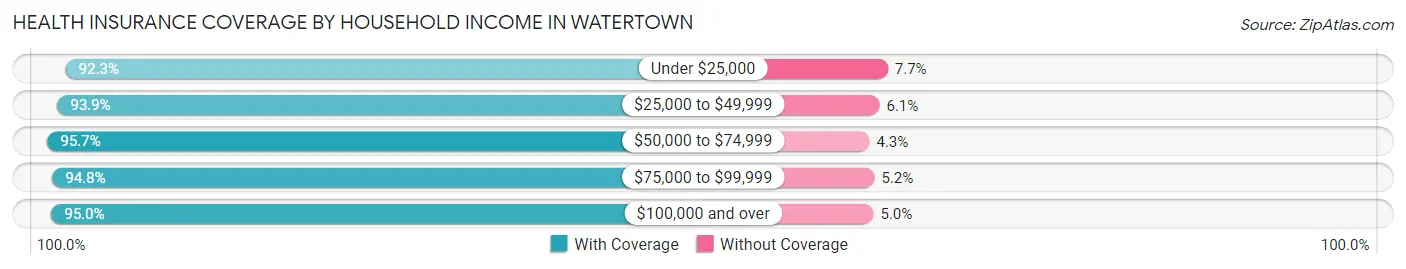
| Household Income | With Coverage | Without Coverage |
| Under $25,000 | 1,417 (92.3%) | 118 (7.7%) |
| $25,000 to $49,999 | 3,829 (93.9%) | 250 (6.1%) |
| $50,000 to $74,999 | 4,445 (95.7%) | 198 (4.3%) |
| $75,000 to $99,999 | 3,465 (94.8%) | 190 (5.2%) |
| $100,000 and over | 7,732 (95.0%) | 408 (5.0%) |
Public vs Private Health Insurance Coverage by Age in Watertown
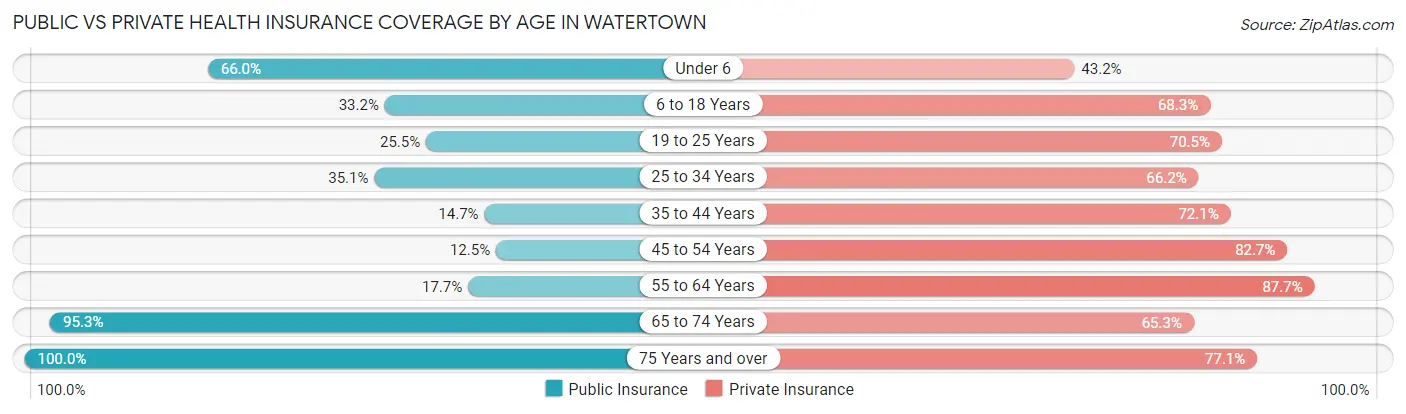
| Age Bracket | Public Insurance | Private Insurance |
| Under 6 | 943 (66.0%) | 617 (43.2%) |
| 6 to 18 Years | 1,313 (33.2%) | 2,707 (68.3%) |
| 19 to 25 Years | 669 (25.5%) | 1,852 (70.5%) |
| 25 to 34 Years | 774 (35.1%) | 1,461 (66.2%) |
| 35 to 44 Years | 390 (14.6%) | 1,921 (72.1%) |
| 45 to 54 Years | 350 (12.5%) | 2,314 (82.7%) |
| 55 to 64 Years | 548 (17.7%) | 2,718 (87.7%) |
| 65 to 74 Years | 1,813 (95.3%) | 1,243 (65.3%) |
| 75 Years and over | 2,042 (100.0%) | 1,574 (77.1%) |
| Total | 8,842 (38.9%) | 16,407 (72.2%) |
Disability Status by Sex by Age in Watertown
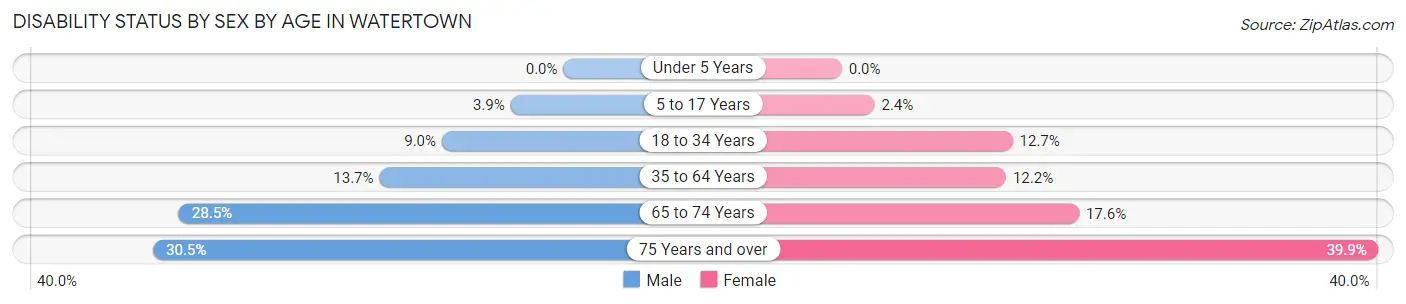
| Age Bracket | Male | Female |
| Under 5 Years | 0 (0.0%) | 0 (0.0%) |
| 5 to 17 Years | 71 (3.9%) | 46 (2.4%) |
| 18 to 34 Years | 211 (9.0%) | 376 (12.7%) |
| 35 to 64 Years | 566 (13.7%) | 538 (12.2%) |
| 65 to 74 Years | 266 (28.5%) | 171 (17.6%) |
| 75 Years and over | 233 (30.5%) | 509 (39.9%) |
Disability Class by Sex by Age in Watertown
Disability Class: Hearing Difficulty
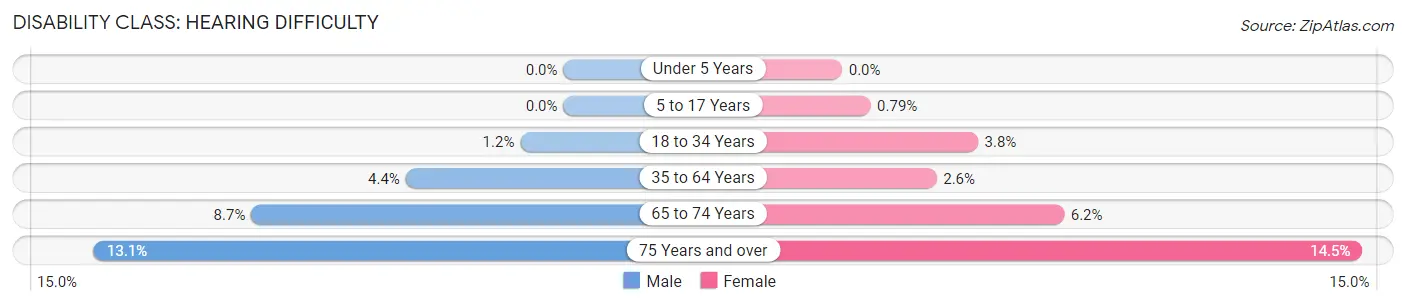
| Age Bracket | Male | Female |
| Under 5 Years | 0 (0.0%) | 0 (0.0%) |
| 5 to 17 Years | 0 (0.0%) | 15 (0.8%) |
| 18 to 34 Years | 28 (1.2%) | 112 (3.8%) |
| 35 to 64 Years | 182 (4.4%) | 116 (2.6%) |
| 65 to 74 Years | 81 (8.7%) | 60 (6.2%) |
| 75 Years and over | 100 (13.1%) | 185 (14.5%) |
Disability Class: Vision Difficulty
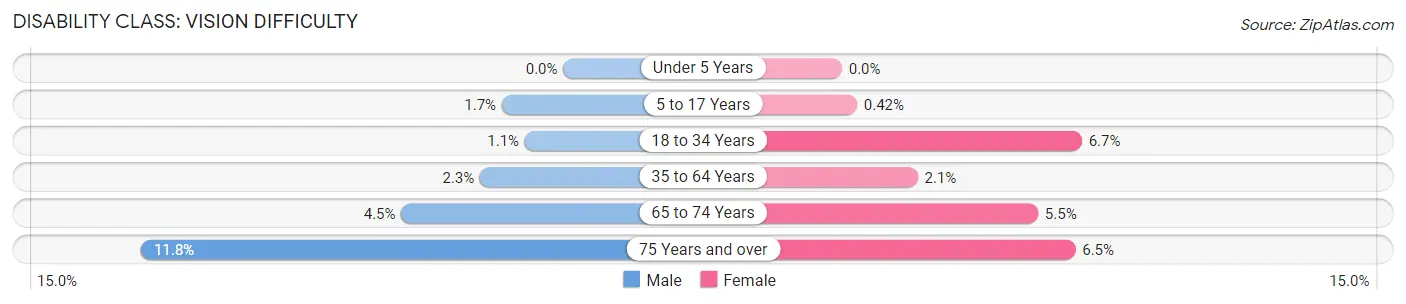
| Age Bracket | Male | Female |
| Under 5 Years | 0 (0.0%) | 0 (0.0%) |
| 5 to 17 Years | 31 (1.7%) | 8 (0.4%) |
| 18 to 34 Years | 25 (1.1%) | 198 (6.7%) |
| 35 to 64 Years | 96 (2.3%) | 93 (2.1%) |
| 65 to 74 Years | 42 (4.5%) | 53 (5.5%) |
| 75 Years and over | 90 (11.8%) | 83 (6.5%) |
Disability Class: Cognitive Difficulty
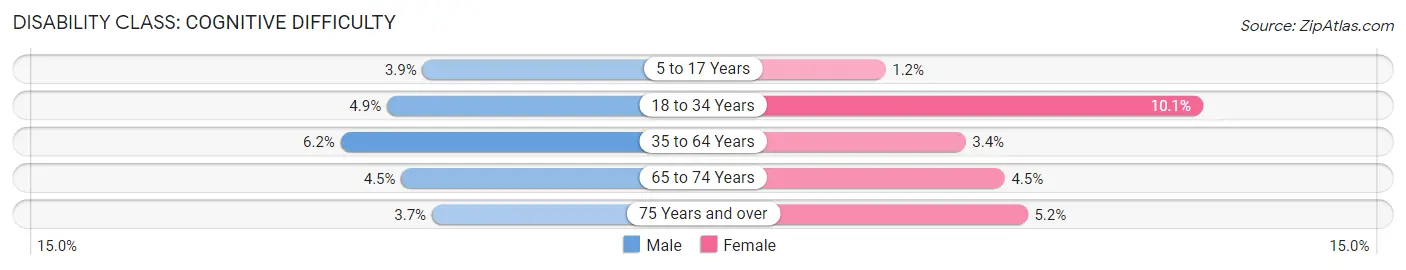
| Age Bracket | Male | Female |
| 5 to 17 Years | 71 (3.9%) | 23 (1.2%) |
| 18 to 34 Years | 115 (4.9%) | 298 (10.1%) |
| 35 to 64 Years | 257 (6.2%) | 152 (3.4%) |
| 65 to 74 Years | 42 (4.5%) | 44 (4.5%) |
| 75 Years and over | 28 (3.7%) | 66 (5.2%) |
Disability Class: Ambulatory Difficulty
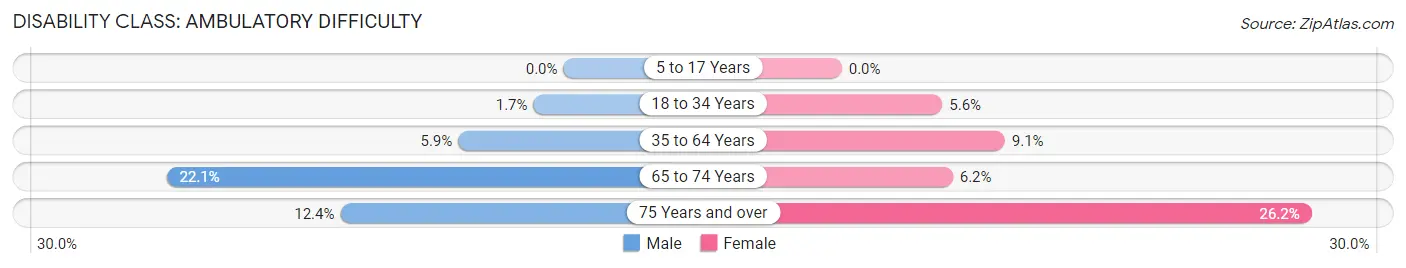
| Age Bracket | Male | Female |
| 5 to 17 Years | 0 (0.0%) | 0 (0.0%) |
| 18 to 34 Years | 39 (1.7%) | 166 (5.6%) |
| 35 to 64 Years | 243 (5.9%) | 401 (9.1%) |
| 65 to 74 Years | 206 (22.1%) | 60 (6.2%) |
| 75 Years and over | 95 (12.4%) | 334 (26.2%) |
Disability Class: Self-Care Difficulty
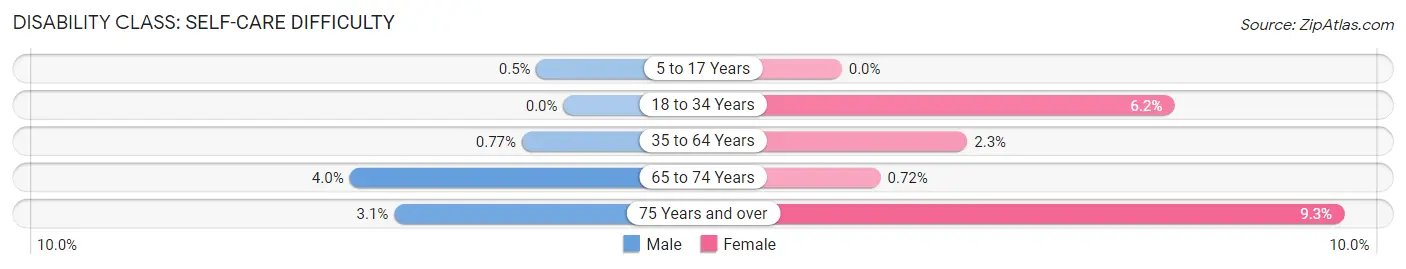
| Age Bracket | Male | Female |
| 5 to 17 Years | 9 (0.5%) | 0 (0.0%) |
| 18 to 34 Years | 0 (0.0%) | 183 (6.2%) |
| 35 to 64 Years | 32 (0.8%) | 103 (2.3%) |
| 65 to 74 Years | 37 (4.0%) | 7 (0.7%) |
| 75 Years and over | 24 (3.1%) | 119 (9.3%) |
Technology Access in Watertown
Computing Device Access in Watertown
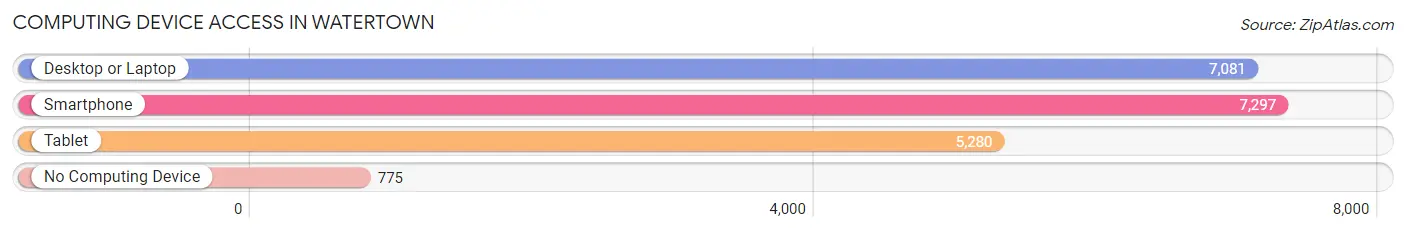
| Device Type | # Households | % Households |
| Desktop or Laptop | 7,081 | 80.9% |
| Smartphone | 7,297 | 83.3% |
| Tablet | 5,280 | 60.3% |
| No Computing Device | 775 | 8.8% |
| Total | 8,756 | 100.0% |
Internet Access in Watertown
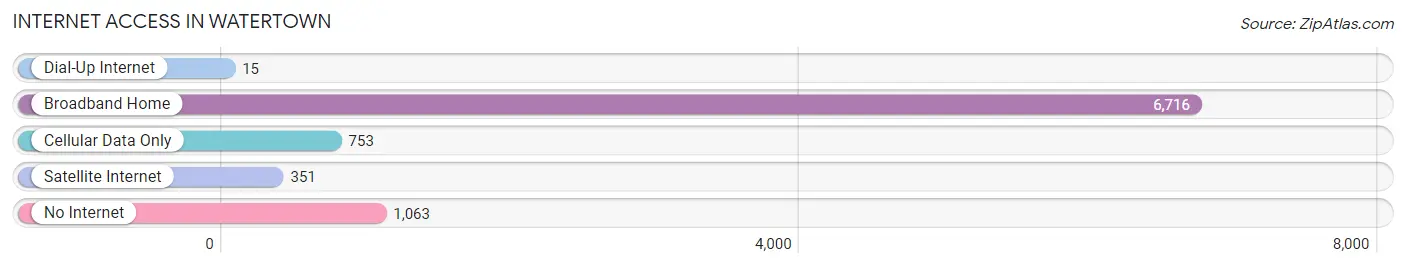
| Internet Type | # Households | % Households |
| Dial-Up Internet | 15 | 0.2% |
| Broadband Home | 6,716 | 76.7% |
| Cellular Data Only | 753 | 8.6% |
| Satellite Internet | 351 | 4.0% |
| No Internet | 1,063 | 12.1% |
| Total | 8,756 | 100.0% |
Watertown Summary
History
Watertown, Wisconsin is a city located in Jefferson County, Wisconsin. It is situated on the Rock River, approximately 45 miles east of Madison. The city was founded in 1836 by Thomas and William Johnson, two brothers who had recently moved to the area from New York. The brothers named the city after their hometown of Watertown, New York.
The city of Watertown was officially incorporated in 1854. During the 19th century, the city was a major hub for the lumber industry, as well as a center for manufacturing. The city was also home to a number of breweries, including the famous Blatz Brewery, which was founded in 1851.
In the early 20th century, Watertown experienced a period of rapid growth and development. The city was home to a number of large factories, including the Watertown Woolen Mills, which was the largest woolen mill in the United States at the time. The city also became a major center for the automotive industry, with the opening of the Watertown Automobile Company in 1909.
Geography
Watertown is located in the southeastern corner of Wisconsin, approximately 45 miles east of Madison. The city is situated on the Rock River, which flows through the city from north to south. The city is surrounded by rolling hills and is located in the heart of the Kettle Moraine State Forest.
The city has a total area of 11.2 square miles, of which 10.9 square miles is land and 0.3 square miles is water. The city has a humid continental climate, with cold winters and hot, humid summers.
Economy
Watertown’s economy is largely based on manufacturing and agriculture. The city is home to a number of large factories, including the Watertown Woolen Mills, which produces woolen fabrics, and the Watertown Automobile Company, which produces automobiles. The city is also home to a number of agricultural businesses, including dairy farms, vegetable farms, and fruit orchards.
The city is also home to a number of retail stores, restaurants, and other businesses. The city is home to a number of large employers, including the Watertown School District, the Watertown Regional Medical Center, and the Watertown Daily Times newspaper.
Demographics
As of the 2010 census, the city of Watertown had a population of 23,861. The population is largely white (90.2%), with small percentages of African Americans (2.7%), Asians (1.3%), and Hispanics (2.2%). The median household income is $45,945, and the median home value is $133,400.
The city is home to a number of educational institutions, including the University of Wisconsin-Watertown, which is a four-year public university. The city is also home to a number of private schools, including St. John’s Lutheran School and Watertown High School.
Conclusion
Watertown, Wisconsin is a city located in Jefferson County, Wisconsin. It is situated on the Rock River, approximately 45 miles east of Madison. The city was founded in 1836 by Thomas and William Johnson, two brothers who had recently moved to the area from New York. The city of Watertown was officially incorporated in 1854. The city has a total area of 11.2 square miles, of which 10.9 square miles is land and 0.3 square miles is water. The city has a humid continental climate, with cold winters and hot, humid summers. The city’s economy is largely based on manufacturing and agriculture. As of the 2010 census, the city of Watertown had a population of 23,861. The population is largely white (90.2%), with small percentages of African Americans (2.7%), Asians (1.3%), and Hispanics (2.2%). The city is home to a number of educational institutions, including the University of Wisconsin-Watertown, which is a four-year public university.
Common Questions
What is the Total Population of Watertown?
Total Population of Watertown is 22,978.
What is the Total Male Population of Watertown?
Total Male Population of Watertown is 10,675.
What is the Total Female Population of Watertown?
Total Female Population of Watertown is 12,303.
What is the Ratio of Males per 100 Females in Watertown?
There are 86.77 Males per 100 Females in Watertown.
What is the Ratio of Females per 100 Males in Watertown?
There are 115.25 Females per 100 Males in Watertown.
What is the Median Population Age in Watertown?
Median Population Age in Watertown is 39.3 Years.
What is the Average Family Size in Watertown
Average Family Size in Watertown is 3.1 People.
What is the Average Household Size in Watertown
Average Household Size in Watertown is 2.5 People.
What is Per Capita Income in Watertown?
Per Capita income in Watertown is $31,580.
What is the Median Family Income in Watertown?
Median Family Income in Watertown is $78,443.
What is the Median Household income in Watertown?
Median Household Income in Watertown is $67,189.
What is Income or Wage Gap in Watertown?
Income or Wage Gap in Watertown is 39.4%.
Women in Watertown earn 60.6 cents for every dollar earned by a man.
What is Family Income Deficit in Watertown?
Family Income Deficit in Watertown is $10,050.
Families that are below poverty line in Watertown earn $10,050 less on average than the poverty threshold level.
What is Inequality or Gini Index in Watertown?
Inequality or Gini Index in Watertown is 0.37.
How Large is the Labor Force in Watertown?
There are 12,789 People in the Labor Forcein in Watertown.
What is the Percentage of People in the Labor Force in Watertown?
68.2% of People are in the Labor Force in Watertown.
What is the Unemployment Rate in Watertown?
Unemployment Rate in Watertown is 4.4%.