Immigrants from Sweden vs Apache 4 or more Vehicles in Household

COMPARE

Immigrants from Sweden
Race
Ancestry
AfghanAfricanAlaska NativeAlaskan AthabascanAlbanianAleutAlsatianAmericanArabArapahoArgentineanArmenianAssyrian/Chaldean/SyriacAustralianAustrianBahamianBangladeshiBarbadianBasqueBelgianBelizeanBermudanBhutaneseBlackfeetBolivianBrazilianBritishBritish West IndianBulgarianBurmeseCajunCambodianCanadianCape VerdeanCarpatho RusynCelticCentral AmericanCentral American IndianCherokeeCheyenneChickasawChileanChineseChippewaChoctawColombianColvilleComancheCosta RicanCreeCreekCroatianCrowCubanCypriotCzechCzechoslovakianDanishDelawareDominicanDutchDutch West IndianEastern EuropeanEcuadorianEgyptianEnglishEstonianEthiopianEuropeanFijianFilipinoFinnishFrenchFrench American IndianFrench CanadianGermanGerman RussianGhanaianGreekGuamanian/ChamorroGuatemalanGuyaneseHaitianHmongHonduranHopiHoumaHungarianIcelanderIndian (Asian)IndonesianInupiatIranianIraqiIrishIroquoisIsraeliItalianJamaicanJapaneseJordanianKenyanKiowaKoreanLaotianLatvianLebaneseLiberianLithuanianLumbeeLuxembourgerMacedonianMalaysianMalteseMarshalleseMenomineeMexicanMexican American IndianMongolianMoroccanNative HawaiianNavajoNepaleseNew ZealanderNicaraguanNigerianNorthern EuropeanNorwegianOkinawanOsageOttawaPaiutePakistaniPalestinianPanamanianParaguayanPennsylvania GermanPeruvianPimaPolishPortuguesePotawatomiPuebloPuerto RicanPuget Sound SalishRomanianRussianSalvadoranSamoanScandinavianScotch-IrishScottishSeminoleSenegaleseSerbianShoshoneSierra LeoneanSiouxSlavicSlovakSloveneSomaliSouth AfricanSouth AmericanSouth American IndianSoviet UnionSpaniardSpanishSpanish AmericanSpanish American IndianSri LankanSubsaharan AfricanSudaneseSwedishSwissSyrianTaiwaneseThaiTlingit-HaidaTohono O'OdhamTonganTrinidadian and TobagonianTsimshianTurkishU.S. Virgin IslanderUgandanUkrainianUruguayanUteVenezuelanVietnameseWelshWest IndianYakamaYaquiYugoslavianYumanYup'ikZimbabwean
Immigration
NonimmigrantsImmigrantsAfghanistanAfricaAlbaniaArgentinaArmeniaAsiaAustraliaAustriaBahamasBangladeshBarbadosBelarusBelgiumBelizeBoliviaBosnia and HerzegovinaBrazilBulgariaBurma/MyanmarCabo VerdeCambodiaCameroonCanadaCaribbeanCentral AmericaChileChinaColombiaCongoCosta RicaCroatiaCubaCzechoslovakiaDenmarkDominicaDominican RepublicEastern AfricaEastern AsiaEastern EuropeEcuadorEgyptEl SalvadorEnglandEritreaEthiopiaEuropeFijiFranceGermanyGhanaGreeceGrenadaGuatemalaGuyanaHaitiHondurasHong KongHungaryIndiaIndonesiaIranIraqIrelandIsraelItalyJamaicaJapanJordanKazakhstanKenyaKoreaKuwaitLaosLatin AmericaLatviaLebanonLiberiaLithuaniaMalaysiaMexicoMicronesiaMiddle AfricaMoldovaMoroccoNepalNetherlandsNicaraguaNigeriaNorth AmericaNorth MacedoniaNorthern AfricaNorthern EuropeNorwayOceaniaPakistanPanamaPeruPhilippinesPolandPortugalRomaniaRussiaSaudi ArabiaScotlandSenegalSerbiaSierra LeoneSingaporeSomaliaSouth AfricaSouth AmericaSouth Central AsiaSouth Eastern AsiaSouthern EuropeSpainSri LankaSt. Vincent and the GrenadinesSudanSwedenSwitzerlandSyriaTaiwanThailandTrinidad and TobagoTurkeyUgandaUkraineUruguayUzbekistanVenezuelaVietnamWest IndiesWestern AfricaWestern AsiaWestern EuropeYemenZaireZimbabweAzores
Apache
Race
Ancestry
AfghanAfricanAlaska NativeAlaskan AthabascanAlbanianAleutAlsatianAmericanApacheArabArapahoArgentineanArmenianAssyrian/Chaldean/SyriacAustralianAustrianBahamianBangladeshiBarbadianBasqueBelgianBelizeanBermudanBhutaneseBlackfeetBolivianBrazilianBritishBritish West IndianBulgarianBurmeseCajunCambodianCanadianCape VerdeanCarpatho RusynCelticCentral AmericanCentral American IndianCherokeeCheyenneChickasawChileanChineseChippewaChoctawColombianColvilleComancheCosta RicanCreeCreekCroatianCrowCubanCypriotCzechCzechoslovakianDanishDelawareDominicanDutchDutch West IndianEastern EuropeanEcuadorianEgyptianEnglishEstonianEthiopianEuropeanFijianFilipinoFinnishFrenchFrench American IndianFrench CanadianGermanGerman RussianGhanaianGreekGuamanian/ChamorroGuatemalanGuyaneseHaitianHmongHonduranHopiHoumaHungarianIcelanderIndian (Asian)IndonesianInupiatIranianIraqiIrishIroquoisIsraeliItalianJamaicanJapaneseJordanianKenyanKiowaKoreanLaotianLatvianLebaneseLiberianLithuanianLumbeeLuxembourgerMacedonianMalaysianMalteseMarshalleseMenomineeMexicanMexican American IndianMongolianMoroccanNative HawaiianNavajoNepaleseNew ZealanderNicaraguanNigerianNorthern EuropeanNorwegianOkinawanOsageOttawaPaiutePakistaniPalestinianPanamanianParaguayanPennsylvania GermanPeruvianPimaPolishPortuguesePotawatomiPuebloPuerto RicanPuget Sound SalishRomanianRussianSalvadoranSamoanScandinavianScotch-IrishScottishSeminoleSenegaleseSerbianShoshoneSierra LeoneanSiouxSlavicSlovakSloveneSomaliSouth AfricanSouth AmericanSouth American IndianSoviet UnionSpaniardSpanishSpanish AmericanSpanish American IndianSri LankanSubsaharan AfricanSudaneseSwedishSwissSyrianTaiwaneseThaiTlingit-HaidaTohono O'OdhamTonganTrinidadian and TobagonianTsimshianTurkishU.S. Virgin IslanderUgandanUkrainianUruguayanUteVenezuelanVietnameseWelshWest IndianYakamaYaquiYugoslavianYumanYup'ikZimbabwean
Immigration
NonimmigrantsImmigrantsAfghanistanAfricaAlbaniaArgentinaArmeniaAsiaAustraliaAustriaBahamasBangladeshBarbadosBelarusBelgiumBelizeBoliviaBosnia and HerzegovinaBrazilBulgariaBurma/MyanmarCabo VerdeCambodiaCameroonCanadaCaribbeanCentral AmericaChileChinaColombiaCongoCosta RicaCroatiaCubaCzechoslovakiaDenmarkDominicaDominican RepublicEastern AfricaEastern AsiaEastern EuropeEcuadorEgyptEl SalvadorEnglandEritreaEthiopiaEuropeFijiFranceGermanyGhanaGreeceGrenadaGuatemalaGuyanaHaitiHondurasHong KongHungaryIndiaIndonesiaIranIraqIrelandIsraelItalyJamaicaJapanJordanKazakhstanKenyaKoreaKuwaitLaosLatin AmericaLatviaLebanonLiberiaLithuaniaMalaysiaMexicoMicronesiaMiddle AfricaMoldovaMoroccoNepalNetherlandsNicaraguaNigeriaNorth AmericaNorth MacedoniaNorthern AfricaNorthern EuropeNorwayOceaniaPakistanPanamaPeruPhilippinesPolandPortugalRomaniaRussiaSaudi ArabiaScotlandSenegalSerbiaSierra LeoneSingaporeSomaliaSouth AfricaSouth AmericaSouth Central AsiaSouth Eastern AsiaSouthern EuropeSpainSri LankaSt. Vincent and the GrenadinesSudanSwitzerlandSyriaTaiwanThailandTrinidad and TobagoTurkeyUgandaUkraineUruguayUzbekistanVenezuelaVietnamWest IndiesWestern AfricaWestern AsiaWestern EuropeYemenZaireZimbabweAzores
4 or more Vehicles in Household
Income
Poverty
Unemployment
Labor Participation
Family Structure
Vehicle Availability
Education Level
Disability

4 or more Vehicles in Household Comparison

Immigrants from Sweden

Apache

Fair
Exceptional
6.2%
4 OR MORE VEHICLES IN HOUSEHOLD
27.0/ 100
METRIC RATING
194th/ 347
METRIC RANK
7.4%
4 OR MORE VEHICLES IN HOUSEHOLD
99.9/ 100
METRIC RATING
77th/ 347
METRIC RANK

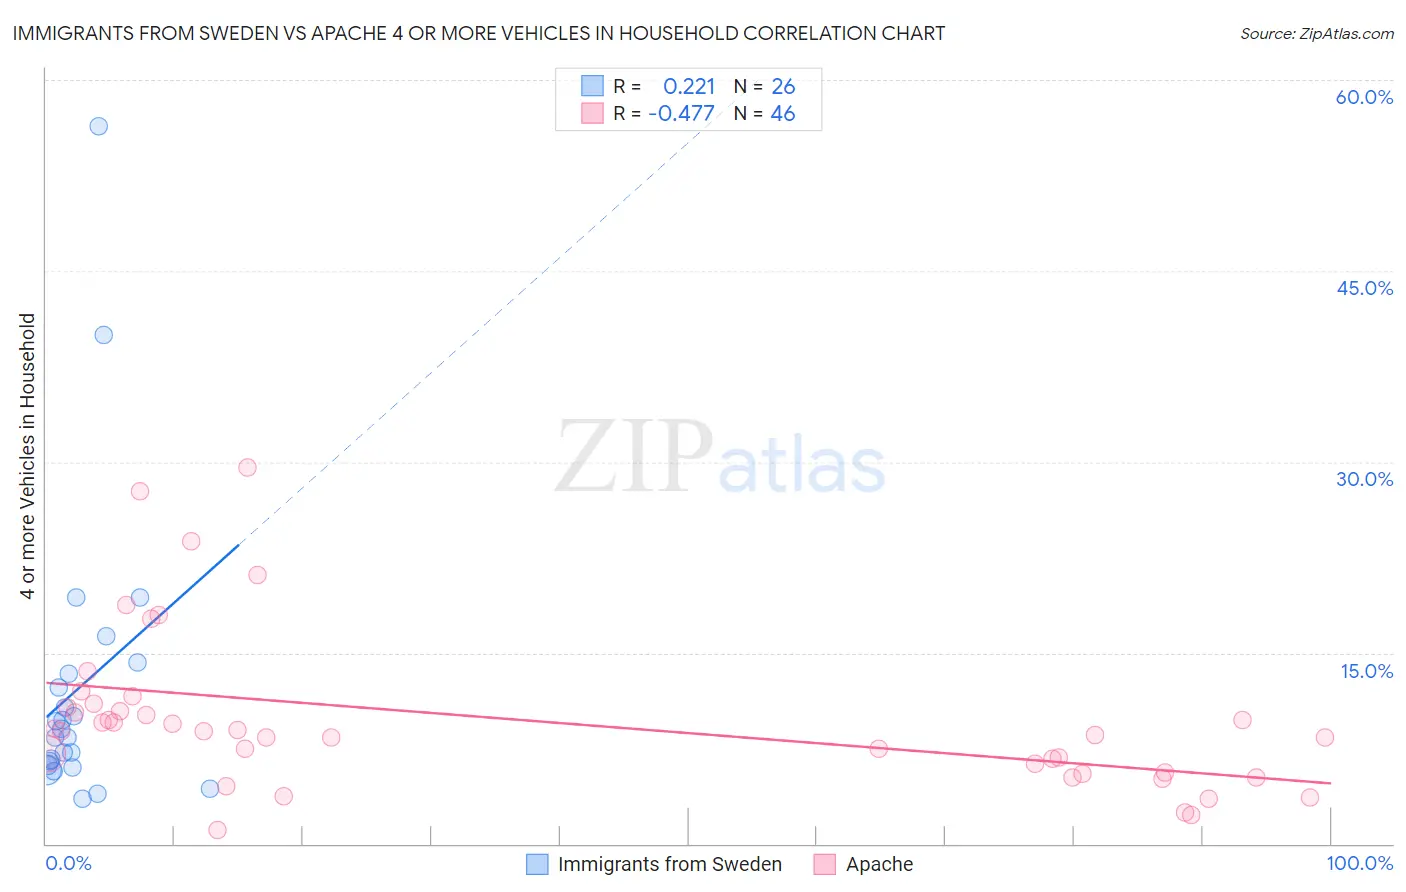
Immigrants from Sweden vs Apache 4 or more Vehicles in Household Correlation Chart

The statistical analysis conducted on geographies consisting of 163,976,202 people shows a weak positive correlation between the proportion of Immigrants from Sweden and percentage of households with 4 or more vehicles available in the United States with a correlation coefficient (R) of 0.221 and weighted average of 6.2%. Similarly, the statistical analysis conducted on geographies consisting of 230,812,683 people shows a moderate negative correlation between the proportion of Apache and percentage of households with 4 or more vehicles available in the United States with a correlation coefficient (R) of -0.477 and weighted average of 7.4%, a difference of 19.5%.
Immigrants from Sweden vs Apache 4 or more Vehicles in Household

4 or more Vehicles in Household Correlation Summary

MeasurementImmigrants from SwedenApache
Minimum3.6%1.1%
Maximum56.4%29.6%
Range52.8%28.5%
Mean12.3%9.8%
Median8.7%8.9%
Interquartile 25% (IQ1)6.2%5.6%
Interquartile 75% (IQ3)13.4%10.7%
Interquartile Range (IQR)7.2%5.1%
Standard Deviation (Sample)11.6%6.2%
Standard Deviation (Population)11.4%6.2%

Similar Demographics by 4 or more Vehicles in Household

Demographics Similar to Immigrants from Sweden by 4 or more Vehicles in Household

In terms of 4 or more vehicles in household, the demographic groups most similar to Immigrants from Sweden are Argentinean (6.2%, a difference of 0.0%), Tsimshian (6.2%, a difference of 0.070%), Immigrants from Kuwait (6.2%, a difference of 0.13%), Immigrants from Sri Lanka (6.1%, a difference of 0.45%), and Romanian (6.2%, a difference of 0.47%).
DemographicsRating | Rank4 or more Vehicles in Household
Immigrants | South Africa
35.4
/100
|
#187
Fair
6.2%
Kiowa
34.7
/100
|
#188
Fair
6.2%
Immigrants | Eastern Asia
33.3
/100
|
#189
Fair
6.2%
South Africans
32.2
/100
|
#190
Fair
6.2%
Inupiat
30.7
/100
|
#191
Fair
6.2%
Romanians
30.7
/100
|
#192
Fair
6.2%
Immigrants | Kuwait
28.0
/100
|
#193
Fair
6.2%
Immigrants | Sweden
27.0
/100
|
#194
Fair
6.2%
Argentineans
27.0
/100
|
#195
Fair
6.2%
Tsimshian
26.4
/100
|
#196
Fair
6.2%
Immigrants | Sri Lanka
23.7
/100
|
#197
Fair
6.1%
Immigrants | Portugal
22.3
/100
|
#198
Fair
6.1%
Immigrants | Norway
21.8
/100
|
#199
Fair
6.1%
Latvians
21.7
/100
|
#200
Fair
6.1%
Egyptians
21.4
/100
|
#201
Fair
6.1%

Demographics Similar to Apache by 4 or more Vehicles in Household

In terms of 4 or more vehicles in household, the demographic groups most similar to Apache are White/Caucasian (7.4%, a difference of 0.060%), Laotian (7.4%, a difference of 0.17%), Icelander (7.4%, a difference of 0.22%), Immigrants from Cambodia (7.4%, a difference of 0.22%), and Czech (7.4%, a difference of 0.24%).
DemographicsRating | Rank4 or more Vehicles in Household
Scottish
99.9
/100
|
#70
Exceptional
7.4%
Chickasaw
99.9
/100
|
#71
Exceptional
7.4%
Scotch-Irish
99.9
/100
|
#72
Exceptional
7.4%
Portuguese
99.9
/100
|
#73
Exceptional
7.4%
Icelanders
99.9
/100
|
#74
Exceptional
7.4%
Immigrants | Cambodia
99.9
/100
|
#75
Exceptional
7.4%
Laotians
99.9
/100
|
#76
Exceptional
7.4%
Apache
99.9
/100
|
#77
Exceptional
7.4%
Whites/Caucasians
99.8
/100
|
#78
Exceptional
7.4%
Czechs
99.8
/100
|
#79
Exceptional
7.4%
Alaska Natives
99.8
/100
|
#80
Exceptional
7.3%
Finns
99.8
/100
|
#81
Exceptional
7.3%
Northern Europeans
99.8
/100
|
#82
Exceptional
7.3%
Potawatomi
99.7
/100
|
#83
Exceptional
7.3%
Afghans
99.7
/100
|
#84
Exceptional
7.3%