Zip Codes with the Highest Percentage of Population Employed in Office & Administration in Hurst, TX
RELATED REPORTS & OPTIONS
Office & Administration
Hurst
Compare Zip Codes
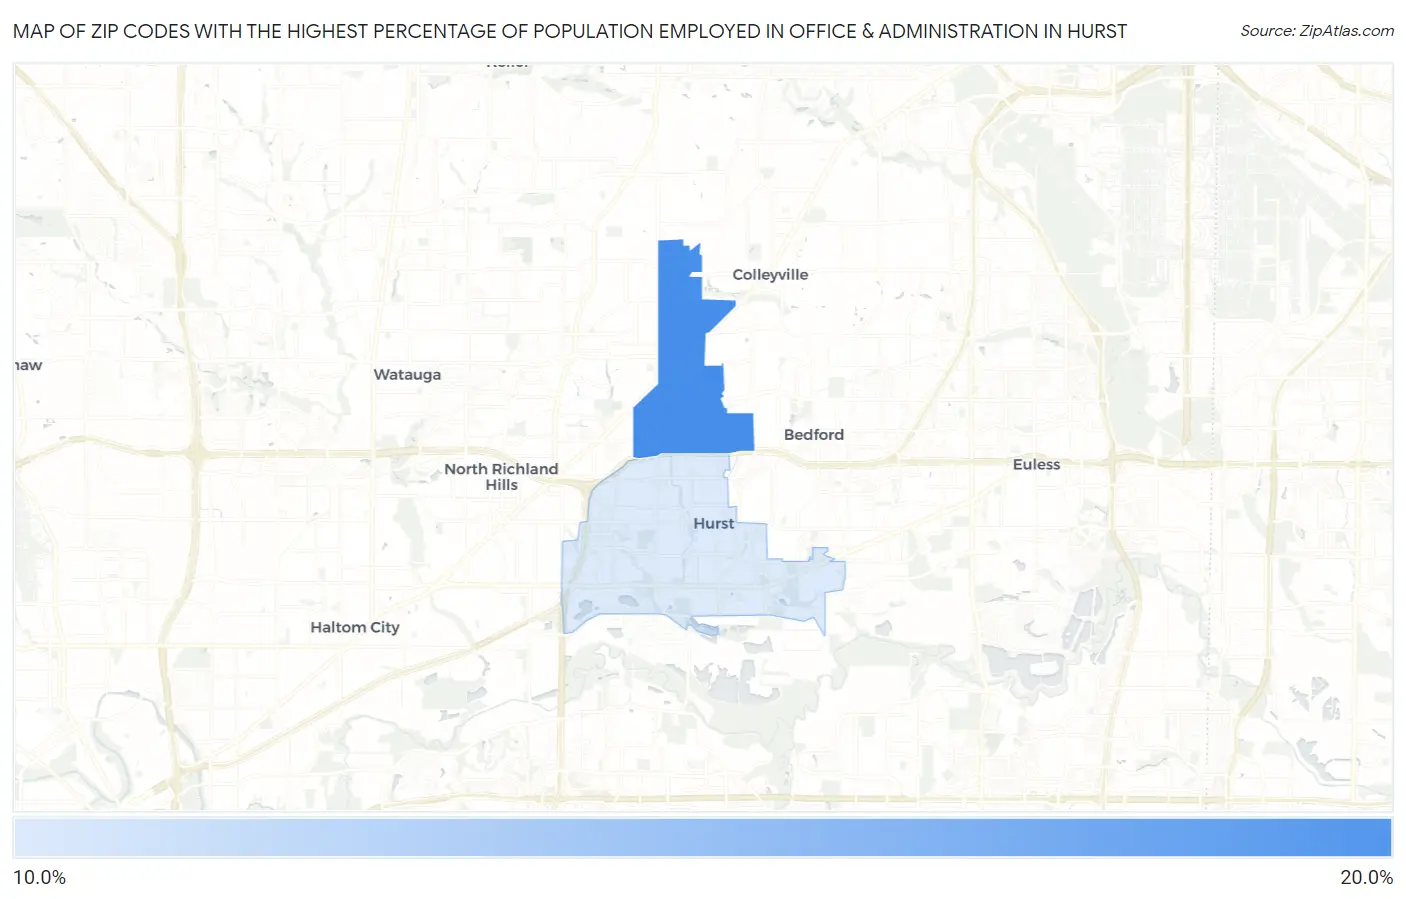
Map of Zip Codes with the Highest Percentage of Population Employed in Office & Administration in Hurst
0.0%
20.0%
Zip Codes with the Highest Percentage of Population Employed in Office & Administration in Hurst, TX
| Zip Code | % Employed | vs State | vs National | |
| 1. | 76054 | 15.3% | 11.0%(+4.32)#245 | 10.9%(+4.44)#4,208 |
| 2. | 76053 | 11.3% | 11.0%(+0.283)#771 | 10.9%(+0.399)#13,035 |
1
Common Questions
What are the Top Zip Codes with the Highest Percentage of Population Employed in Office & Administration in Hurst, TX?
Top Zip Codes with the Highest Percentage of Population Employed in Office & Administration in Hurst, TX are:
What zip code has the Highest Percentage of Population Employed in Office & Administration in Hurst, TX?
76054 has the Highest Percentage of Population Employed in Office & Administration in Hurst, TX with 15.3%.
What is the Percentage of Population Employed in Office & Administration in Hurst, TX?
Percentage of Population Employed in Office & Administration in Hurst is 12.9%.
What is the Percentage of Population Employed in Office & Administration in Texas?
Percentage of Population Employed in Office & Administration in Texas is 11.0%.
What is the Percentage of Population Employed in Office & Administration in the United States?
Percentage of Population Employed in Office & Administration in the United States is 10.9%.