Zip Codes with the Highest Percentage of Families with Income Above $100,000 in Pennsylvania
RELATED REPORTS & OPTIONS
Family Income | $100k+
Pennsylvania
Compare Zip Codes
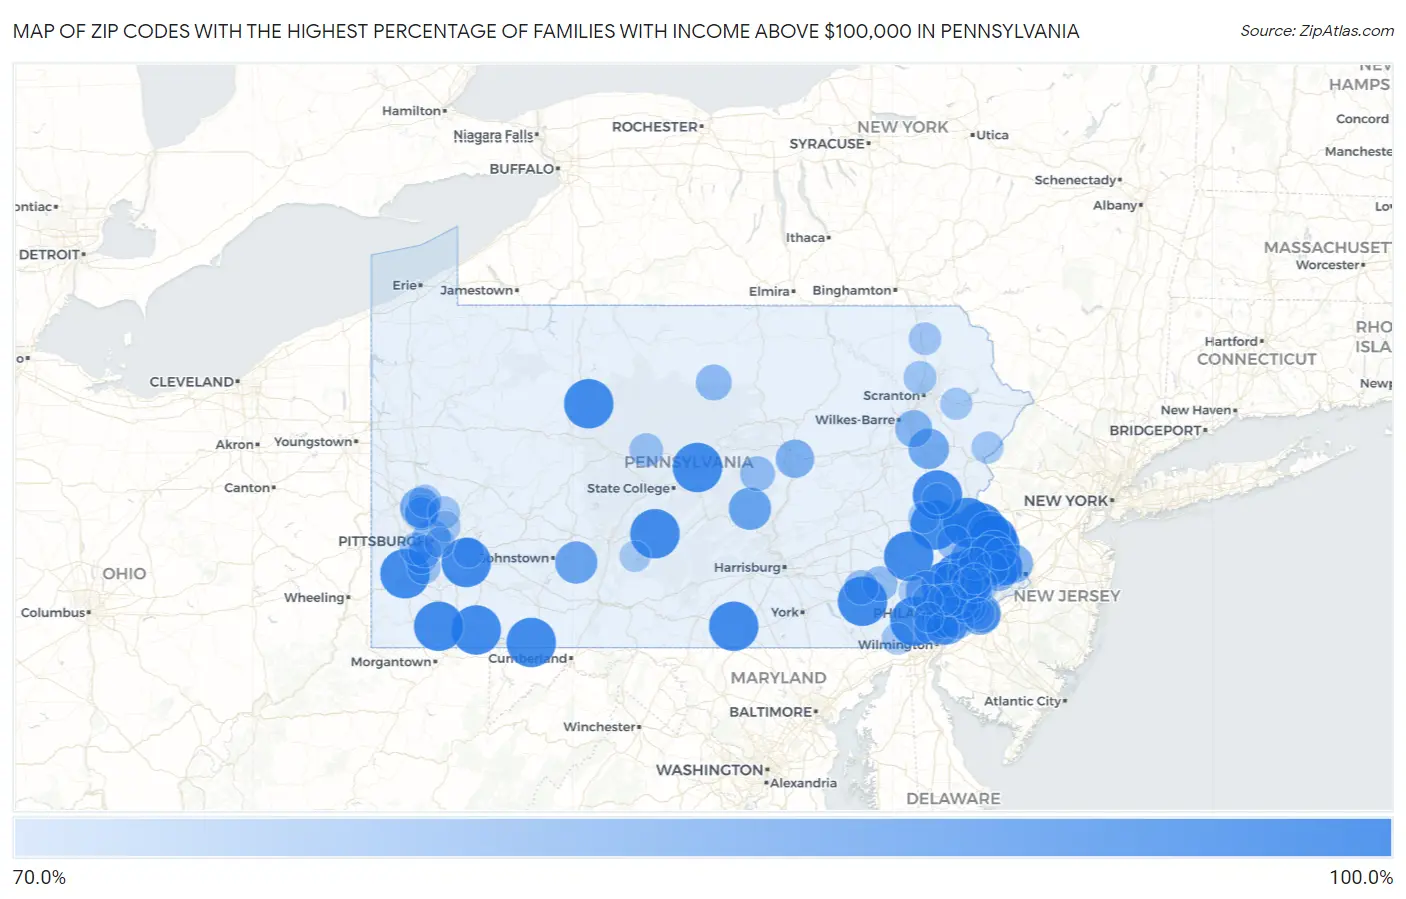
Map of Zip Codes with the Highest Percentage of Families with Income Above $100,000 in Pennsylvania
0.0%
100.0%
Zip Codes with the Highest Percentage of Families with Income Above $100,000 in Pennsylvania
| Zip Code | Families with Income > $100k | vs State | vs National | |
| 1. | 16654 | 100.0% | 46.6%(+53.4)#1 | 46.1%(+53.9)#12 |
| 2. | 15691 | 100.0% | 46.6%(+53.4)#2 | 46.1%(+53.9)#24 |
| 3. | 19490 | 100.0% | 46.6%(+53.4)#3 | 46.1%(+53.9)#39 |
| 4. | 19456 | 100.0% | 46.6%(+53.4)#4 | 46.1%(+53.9)#41 |
| 5. | 18936 | 100.0% | 46.6%(+53.4)#5 | 46.1%(+53.9)#45 |
| 6. | 19375 | 100.0% | 46.6%(+53.4)#6 | 46.1%(+53.9)#76 |
| 7. | 18046 | 100.0% | 46.6%(+53.4)#7 | 46.1%(+53.9)#91 |
| 8. | 18921 | 100.0% | 46.6%(+53.4)#8 | 46.1%(+53.9)#97 |
| 9. | 18933 | 100.0% | 46.6%(+53.4)#9 | 46.1%(+53.9)#104 |
| 10. | 17576 | 100.0% | 46.6%(+53.4)#10 | 46.1%(+53.9)#108 |
| 11. | 18081 | 100.0% | 46.6%(+53.4)#11 | 46.1%(+53.9)#113 |
| 12. | 18950 | 100.0% | 46.6%(+53.4)#12 | 46.1%(+53.9)#119 |
| 13. | 15347 | 100.0% | 46.6%(+53.4)#13 | 46.1%(+53.9)#133 |
| 14. | 15421 | 100.0% | 46.6%(+53.4)#14 | 46.1%(+53.9)#143 |
| 15. | 19535 | 100.0% | 46.6%(+53.4)#15 | 46.1%(+53.9)#171 |
| 16. | 15831 | 100.0% | 46.6%(+53.4)#16 | 46.1%(+53.9)#203 |
| 17. | 15476 | 100.0% | 46.6%(+53.4)#17 | 46.1%(+53.9)#211 |
| 18. | 16856 | 100.0% | 46.6%(+53.4)#18 | 46.1%(+53.9)#226 |
| 19. | 18035 | 100.0% | 46.6%(+53.4)#19 | 46.1%(+53.9)#236 |
| 20. | 17343 | 100.0% | 46.6%(+53.4)#20 | 46.1%(+53.9)#241 |
| 21. | 15565 | 100.0% | 46.6%(+53.4)#21 | 46.1%(+53.9)#265 |
| 22. | 19437 | 94.7% | 46.6%(+48.1)#22 | 46.1%(+48.6)#291 |
| 23. | 18946 | 94.5% | 46.6%(+47.9)#23 | 46.1%(+48.4)#295 |
| 24. | 19017 | 92.7% | 46.6%(+46.1)#24 | 46.1%(+46.6)#317 |
| 25. | 18920 | 90.8% | 46.6%(+44.2)#25 | 46.1%(+44.7)#348 |
| 26. | 17014 | 90.0% | 46.6%(+43.4)#26 | 46.1%(+43.9)#361 |
| 27. | 15930 | 89.9% | 46.6%(+43.3)#27 | 46.1%(+43.8)#364 |
| 28. | 19102 | 89.4% | 46.6%(+42.8)#28 | 46.1%(+43.3)#381 |
| 29. | 18927 | 88.6% | 46.6%(+42.0)#29 | 46.1%(+42.5)#403 |
| 30. | 19425 | 88.2% | 46.6%(+41.6)#30 | 46.1%(+42.1)#415 |
| 31. | 18624 | 87.7% | 46.6%(+41.1)#31 | 46.1%(+41.6)#446 |
| 32. | 15086 | 86.7% | 46.6%(+40.1)#32 | 46.1%(+40.6)#490 |
| 33. | 19035 | 86.1% | 46.6%(+39.5)#33 | 46.1%(+40.0)#525 |
| 34. | 18925 | 86.0% | 46.6%(+39.4)#34 | 46.1%(+39.9)#534 |
| 35. | 19066 | 85.9% | 46.6%(+39.3)#35 | 46.1%(+39.8)#542 |
| 36. | 18913 | 85.4% | 46.6%(+38.8)#36 | 46.1%(+39.3)#570 |
| 37. | 18977 | 85.2% | 46.6%(+38.6)#37 | 46.1%(+39.1)#578 |
| 38. | 19085 | 84.9% | 46.6%(+38.3)#38 | 46.1%(+38.8)#597 |
| 39. | 15222 | 84.7% | 46.6%(+38.1)#39 | 46.1%(+38.6)#612 |
| 40. | 17865 | 84.6% | 46.6%(+38.0)#40 | 46.1%(+38.5)#622 |
| 41. | 18954 | 83.4% | 46.6%(+36.8)#41 | 46.1%(+37.3)#709 |
| 42. | 18602 | 83.0% | 46.6%(+36.4)#42 | 46.1%(+36.9)#740 |
| 43. | 18902 | 82.8% | 46.6%(+36.2)#43 | 46.1%(+36.7)#747 |
| 44. | 19031 | 82.7% | 46.6%(+36.1)#44 | 46.1%(+36.6)#757 |
| 45. | 18940 | 81.8% | 46.6%(+35.2)#45 | 46.1%(+35.7)#820 |
| 46. | 19072 | 81.5% | 46.6%(+34.9)#46 | 46.1%(+35.4)#862 |
| 47. | 17769 | 81.3% | 46.6%(+34.7)#47 | 46.1%(+35.2)#895 |
| 48. | 19106 | 81.1% | 46.6%(+34.5)#48 | 46.1%(+35.0)#907 |
| 49. | 19373 | 81.0% | 46.6%(+34.4)#49 | 46.1%(+34.9)#917 |
| 50. | 19312 | 80.8% | 46.6%(+34.2)#50 | 46.1%(+34.7)#940 |
| 51. | 19087 | 80.6% | 46.6%(+34.0)#51 | 46.1%(+34.5)#962 |
| 52. | 19041 | 80.2% | 46.6%(+33.6)#52 | 46.1%(+34.1)#1,008 |
| 53. | 19317 | 80.0% | 46.6%(+33.4)#53 | 46.1%(+33.9)#1,028 |
| 54. | 17581 | 80.0% | 46.6%(+33.4)#54 | 46.1%(+33.9)#1,036 |
| 55. | 17880 | 80.0% | 46.6%(+33.4)#55 | 46.1%(+33.9)#1,038 |
| 56. | 17508 | 79.4% | 46.6%(+32.8)#56 | 46.1%(+33.3)#1,098 |
| 57. | 19096 | 79.3% | 46.6%(+32.7)#57 | 46.1%(+33.2)#1,106 |
| 58. | 19444 | 79.3% | 46.6%(+32.7)#58 | 46.1%(+33.2)#1,107 |
| 59. | 18929 | 79.3% | 46.6%(+32.7)#59 | 46.1%(+33.2)#1,108 |
| 60. | 18935 | 79.3% | 46.6%(+32.7)#60 | 46.1%(+33.2)#1,112 |
| 61. | 19342 | 78.8% | 46.6%(+32.2)#61 | 46.1%(+32.7)#1,160 |
| 62. | 15015 | 78.5% | 46.6%(+31.9)#62 | 46.1%(+32.4)#1,213 |
| 63. | 19355 | 78.3% | 46.6%(+31.7)#63 | 46.1%(+32.2)#1,230 |
| 64. | 16834 | 78.3% | 46.6%(+31.7)#64 | 46.1%(+32.2)#1,233 |
| 65. | 19052 | 78.0% | 46.6%(+31.4)#65 | 46.1%(+31.9)#1,264 |
| 66. | 15367 | 77.9% | 46.6%(+31.3)#66 | 46.1%(+31.8)#1,273 |
| 67. | 15090 | 77.8% | 46.6%(+31.2)#67 | 46.1%(+31.7)#1,284 |
| 68. | 16046 | 77.7% | 46.6%(+31.1)#68 | 46.1%(+31.6)#1,303 |
| 69. | 15241 | 77.6% | 46.6%(+31.0)#69 | 46.1%(+31.5)#1,321 |
| 70. | 19003 | 77.5% | 46.6%(+30.9)#70 | 46.1%(+31.4)#1,339 |
| 71. | 19086 | 77.5% | 46.6%(+30.9)#71 | 46.1%(+31.4)#1,340 |
| 72. | 19025 | 77.5% | 46.6%(+30.9)#72 | 46.1%(+31.4)#1,342 |
| 73. | 18471 | 77.5% | 46.6%(+30.9)#73 | 46.1%(+31.4)#1,346 |
| 74. | 19010 | 77.3% | 46.6%(+30.7)#74 | 46.1%(+31.2)#1,364 |
| 75. | 19060 | 77.3% | 46.6%(+30.7)#75 | 46.1%(+31.2)#1,366 |
| 76. | 15142 | 77.3% | 46.6%(+30.7)#76 | 46.1%(+31.2)#1,367 |
| 77. | 19034 | 77.2% | 46.6%(+30.6)#77 | 46.1%(+31.1)#1,382 |
| 78. | 15228 | 77.1% | 46.6%(+30.5)#78 | 46.1%(+31.0)#1,390 |
| 79. | 18820 | 76.9% | 46.6%(+30.3)#79 | 46.1%(+30.8)#1,424 |
| 80. | 19426 | 76.8% | 46.6%(+30.2)#80 | 46.1%(+30.7)#1,426 |
| 81. | 15006 | 76.8% | 46.6%(+30.2)#81 | 46.1%(+30.7)#1,446 |
| 82. | 18938 | 76.7% | 46.6%(+30.1)#82 | 46.1%(+30.6)#1,455 |
| 83. | 19333 | 76.6% | 46.6%(+30.0)#83 | 46.1%(+30.5)#1,470 |
| 84. | 18914 | 76.5% | 46.6%(+29.9)#84 | 46.1%(+30.4)#1,479 |
| 85. | 18335 | 76.3% | 46.6%(+29.7)#85 | 46.1%(+30.2)#1,516 |
| 86. | 19103 | 76.2% | 46.6%(+29.6)#86 | 46.1%(+30.1)#1,524 |
| 87. | 18463 | 76.0% | 46.6%(+29.4)#87 | 46.1%(+29.9)#1,569 |
| 88. | 19352 | 75.9% | 46.6%(+29.3)#88 | 46.1%(+29.8)#1,579 |
| 89. | 19301 | 75.5% | 46.6%(+28.9)#89 | 46.1%(+29.4)#1,627 |
| 90. | 18051 | 75.4% | 46.6%(+28.8)#90 | 46.1%(+29.3)#1,649 |
| 91. | 19422 | 75.3% | 46.6%(+28.7)#91 | 46.1%(+29.2)#1,656 |
| 92. | 15238 | 75.1% | 46.6%(+28.5)#92 | 46.1%(+29.0)#1,690 |
| 93. | 16638 | 75.0% | 46.6%(+28.4)#93 | 46.1%(+28.9)#1,713 |
| 94. | 18059 | 74.9% | 46.6%(+28.3)#94 | 46.1%(+28.8)#1,729 |
| 95. | 19002 | 74.7% | 46.6%(+28.1)#95 | 46.1%(+28.6)#1,748 |
| 96. | 15217 | 74.3% | 46.6%(+27.7)#96 | 46.1%(+28.2)#1,816 |
| 97. | 15636 | 74.1% | 46.6%(+27.5)#97 | 46.1%(+28.0)#1,864 |
| 98. | 19343 | 74.0% | 46.6%(+27.4)#98 | 46.1%(+27.9)#1,885 |
| 99. | 19341 | 73.9% | 46.6%(+27.3)#99 | 46.1%(+27.8)#1,894 |
| 100. | 19382 | 73.8% | 46.6%(+27.2)#100 | 46.1%(+27.7)#1,902 |
Common Questions
What are the Top 10 Zip Codes with the Highest Percentage of Families with Income Above $100,000 in Pennsylvania?
Top 10 Zip Codes with the Highest Percentage of Families with Income Above $100,000 in Pennsylvania are:
What zip code has the Highest Percentage of Families with Income Above $100,000 in Pennsylvania?
16654 has the Highest Percentage of Families with Income Above $100,000 in Pennsylvania with 100.0%.
What is the Percentage of Families with Income Above $100,000 in the State of Pennsylvania?
Percentage of Families with Income Above $100,000 in Pennsylvania is 46.6%.
What is the Percentage of Families with Income Above $100,000 in the United States?
Percentage of Families with Income Above $100,000 in the United States is 46.1%.