Zip Codes with the Most Immigrants from Uganda in Pennsylvania
RELATED REPORTS & OPTIONS
Uganda
Pennsylvania
Compare Zip Codes
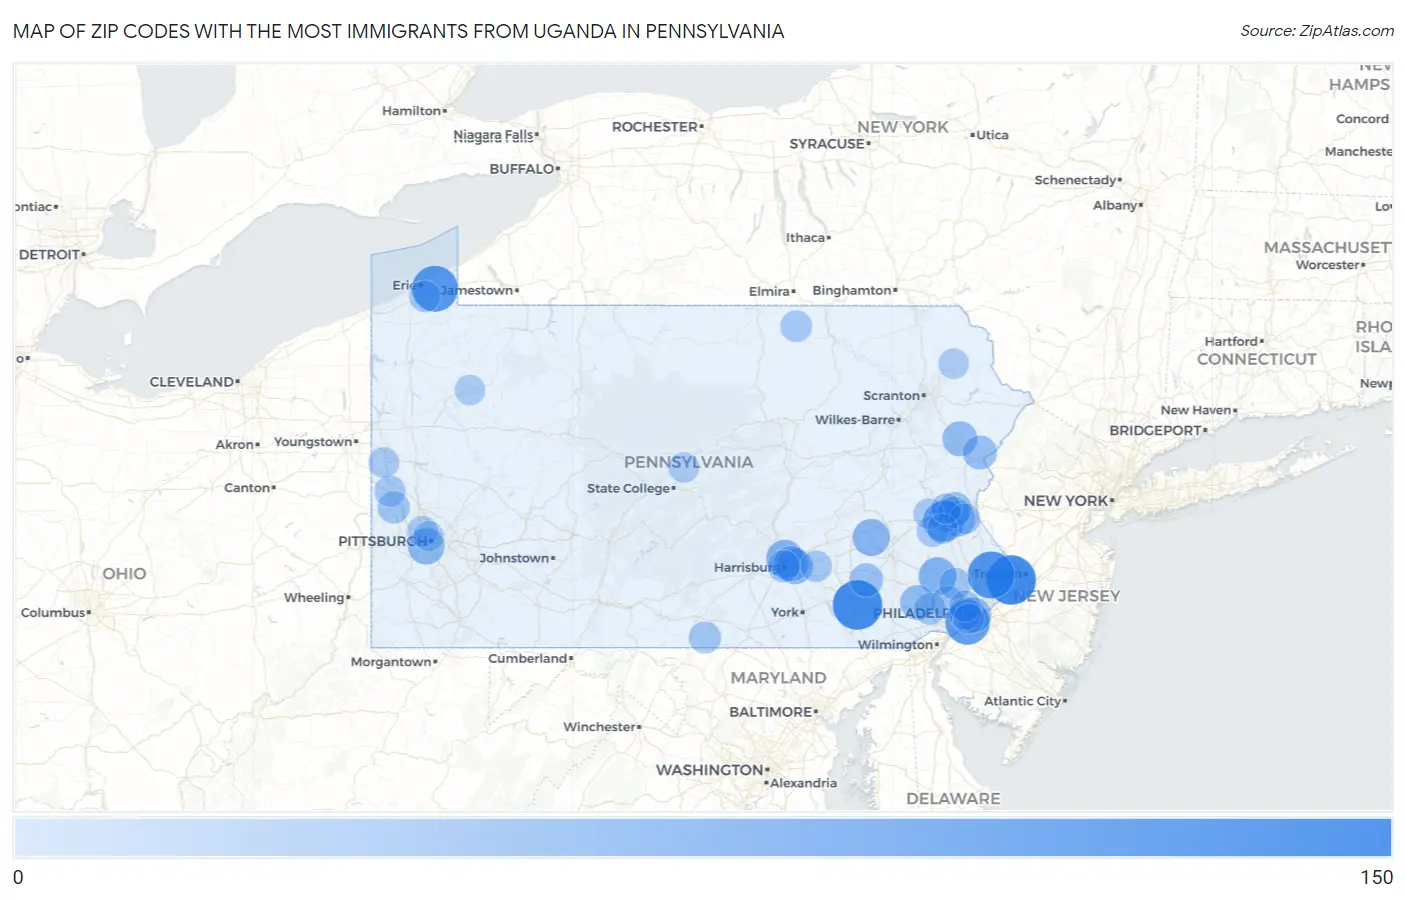
Map of Zip Codes with the Most Immigrants from Uganda in Pennsylvania
0
150
Zip Codes with the Most Immigrants from Uganda in Pennsylvania
| Zip Code | Uganda | vs State | vs National | |
| 1. | 17602 | 117 | 1,139(10.27%)#1 | 36,662(0.32%)#52 |
| 2. | 19047 | 116 | 1,139(10.18%)#2 | 36,662(0.32%)#54 |
| 3. | 18974 | 101 | 1,139(8.87%)#3 | 36,662(0.28%)#73 |
| 4. | 16510 | 94 | 1,139(8.25%)#4 | 36,662(0.26%)#82 |
| 5. | 19032 | 85 | 1,139(7.46%)#5 | 36,662(0.23%)#92 |
| 6. | 18103 | 65 | 1,139(5.71%)#6 | 36,662(0.18%)#125 |
| 7. | 19468 | 45 | 1,139(3.95%)#7 | 36,662(0.12%)#217 |
| 8. | 17110 | 44 | 1,139(3.86%)#8 | 36,662(0.12%)#223 |
| 9. | 19506 | 40 | 1,139(3.51%)#9 | 36,662(0.11%)#249 |
| 10. | 15216 | 37 | 1,139(3.25%)#10 | 36,662(0.10%)#267 |
| 11. | 18015 | 33 | 1,139(2.90%)#11 | 36,662(0.09%)#314 |
| 12. | 17111 | 32 | 1,139(2.81%)#12 | 36,662(0.09%)#327 |
| 13. | 17109 | 30 | 1,139(2.63%)#13 | 36,662(0.08%)#346 |
| 14. | 19143 | 28 | 1,139(2.46%)#14 | 36,662(0.08%)#364 |
| 15. | 18344 | 28 | 1,139(2.46%)#15 | 36,662(0.08%)#377 |
| 16. | 19335 | 27 | 1,139(2.37%)#16 | 36,662(0.07%)#378 |
| 17. | 18301 | 22 | 1,139(1.93%)#17 | 36,662(0.06%)#441 |
| 18. | 17522 | 19 | 1,139(1.67%)#18 | 36,662(0.05%)#495 |
| 19. | 18017 | 18 | 1,139(1.58%)#19 | 36,662(0.05%)#513 |
| 20. | 18102 | 15 | 1,139(1.32%)#20 | 36,662(0.04%)#585 |
| 21. | 19312 | 15 | 1,139(1.32%)#21 | 36,662(0.04%)#603 |
| 22. | 19026 | 11 | 1,139(0.97%)#22 | 36,662(0.03%)#707 |
| 23. | 15061 | 11 | 1,139(0.97%)#23 | 36,662(0.03%)#722 |
| 24. | 17102 | 11 | 1,139(0.97%)#24 | 36,662(0.03%)#723 |
| 25. | 17268 | 10 | 1,139(0.88%)#25 | 36,662(0.03%)#742 |
| 26. | 19380 | 9 | 1,139(0.79%)#26 | 36,662(0.02%)#769 |
| 27. | 19403 | 9 | 1,139(0.79%)#27 | 36,662(0.02%)#772 |
| 28. | 18018 | 9 | 1,139(0.79%)#28 | 36,662(0.02%)#783 |
| 29. | 16509 | 8 | 1,139(0.70%)#29 | 36,662(0.02%)#821 |
| 30. | 16914 | 8 | 1,139(0.70%)#30 | 36,662(0.02%)#839 |
| 31. | 19003 | 7 | 1,139(0.61%)#31 | 36,662(0.02%)#864 |
| 32. | 18062 | 6 | 1,139(0.53%)#32 | 36,662(0.02%)#899 |
| 33. | 17033 | 6 | 1,139(0.53%)#33 | 36,662(0.02%)#910 |
| 34. | 15010 | 5 | 1,139(0.44%)#34 | 36,662(0.01%)#940 |
| 35. | 15202 | 3 | 1,139(0.26%)#35 | 36,662(0.01%)#1,008 |
| 36. | 16102 | 3 | 1,139(0.26%)#36 | 36,662(0.01%)#1,013 |
| 37. | 19023 | 2 | 1,139(0.18%)#37 | 36,662(0.01%)#1,032 |
| 38. | 18055 | 2 | 1,139(0.18%)#38 | 36,662(0.01%)#1,039 |
| 39. | 18069 | 2 | 1,139(0.18%)#39 | 36,662(0.01%)#1,040 |
| 40. | 16823 | 1 | 1,139(0.09%)#40 | 36,662(0.00%)#1,069 |
| 41. | 15212 | 1 | 1,139(0.09%)#41 | 36,662(0.00%)#1,071 |
| 42. | 18049 | 1 | 1,139(0.09%)#42 | 36,662(0.00%)#1,079 |
| 43. | 16301 | 1 | 1,139(0.09%)#43 | 36,662(0.00%)#1,088 |
| 44. | 18032 | 1 | 1,139(0.09%)#44 | 36,662(0.00%)#1,090 |
| 45. | 18472 | 1 | 1,139(0.09%)#45 | 36,662(0.00%)#1,091 |
Common Questions
What are the Top 10 Zip Codes with the Most Immigrants from Uganda in Pennsylvania?
Top 10 Zip Codes with the Most Immigrants from Uganda in Pennsylvania are:
What zip code has the Most Immigrants from Uganda in Pennsylvania?
17602 has the Most Immigrants from Uganda in Pennsylvania with 117.
What is the Total Immigrants from Uganda in the State of Pennsylvania?
Total Immigrants from Uganda in Pennsylvania is 1,139.
What is the Total Immigrants from Uganda in the United States?
Total Immigrants from Uganda in the United States is 36,662.