Zip Codes with the Highest Percentage of Population with a Degree in Visual and Performing Arts in State College, PA
RELATED REPORTS & OPTIONS
Visual and Performing Arts
State College
Compare Zip Codes
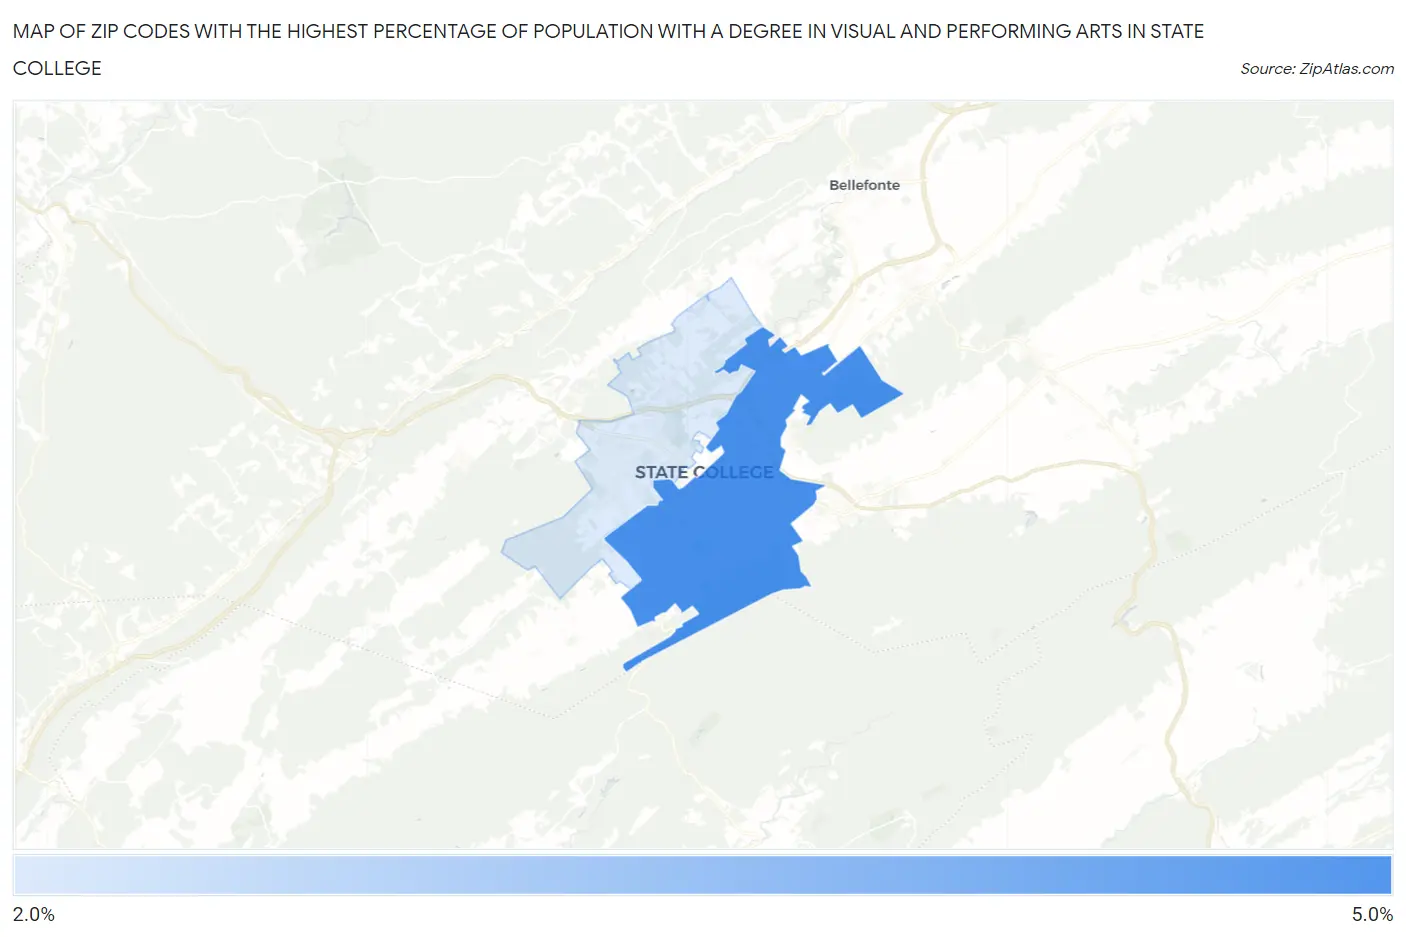
Map of Zip Codes with the Highest Percentage of Population with a Degree in Visual and Performing Arts in State College
0.0%
5.0%
Zip Codes with the Highest Percentage of Population with a Degree in Visual and Performing Arts in State College, PA
| Zip Code | % Graduates | vs State | vs National | |
| 1. | 16801 | 4.2% | 3.8%(+0.365)#405 | 4.3%(-0.064)#8,654 |
| 2. | 16803 | 2.9% | 3.8%(-0.947)#646 | 4.3%(-1.38)#13,188 |
1
Common Questions
What are the Top Zip Codes with the Highest Percentage of Population with a Degree in Visual and Performing Arts in State College, PA?
Top Zip Codes with the Highest Percentage of Population with a Degree in Visual and Performing Arts in State College, PA are:
What zip code has the Highest Percentage of Population with a Degree in Visual and Performing Arts in State College, PA?
16801 has the Highest Percentage of Population with a Degree in Visual and Performing Arts in State College, PA with 4.2%.
What is the Percentage of Population with a Degree in Visual and Performing Arts in Pennsylvania?
Percentage of Population with a Degree in Visual and Performing Arts in Pennsylvania is 3.8%.
What is the Percentage of Population with a Degree in Visual and Performing Arts in the United States?
Percentage of Population with a Degree in Visual and Performing Arts in the United States is 4.3%.