Zip Codes with the Highest Percentage of Population with a Degree in Visual and Performing Arts in Mckeesport, PA
RELATED REPORTS & OPTIONS
Visual and Performing Arts
Mckeesport
Compare Zip Codes
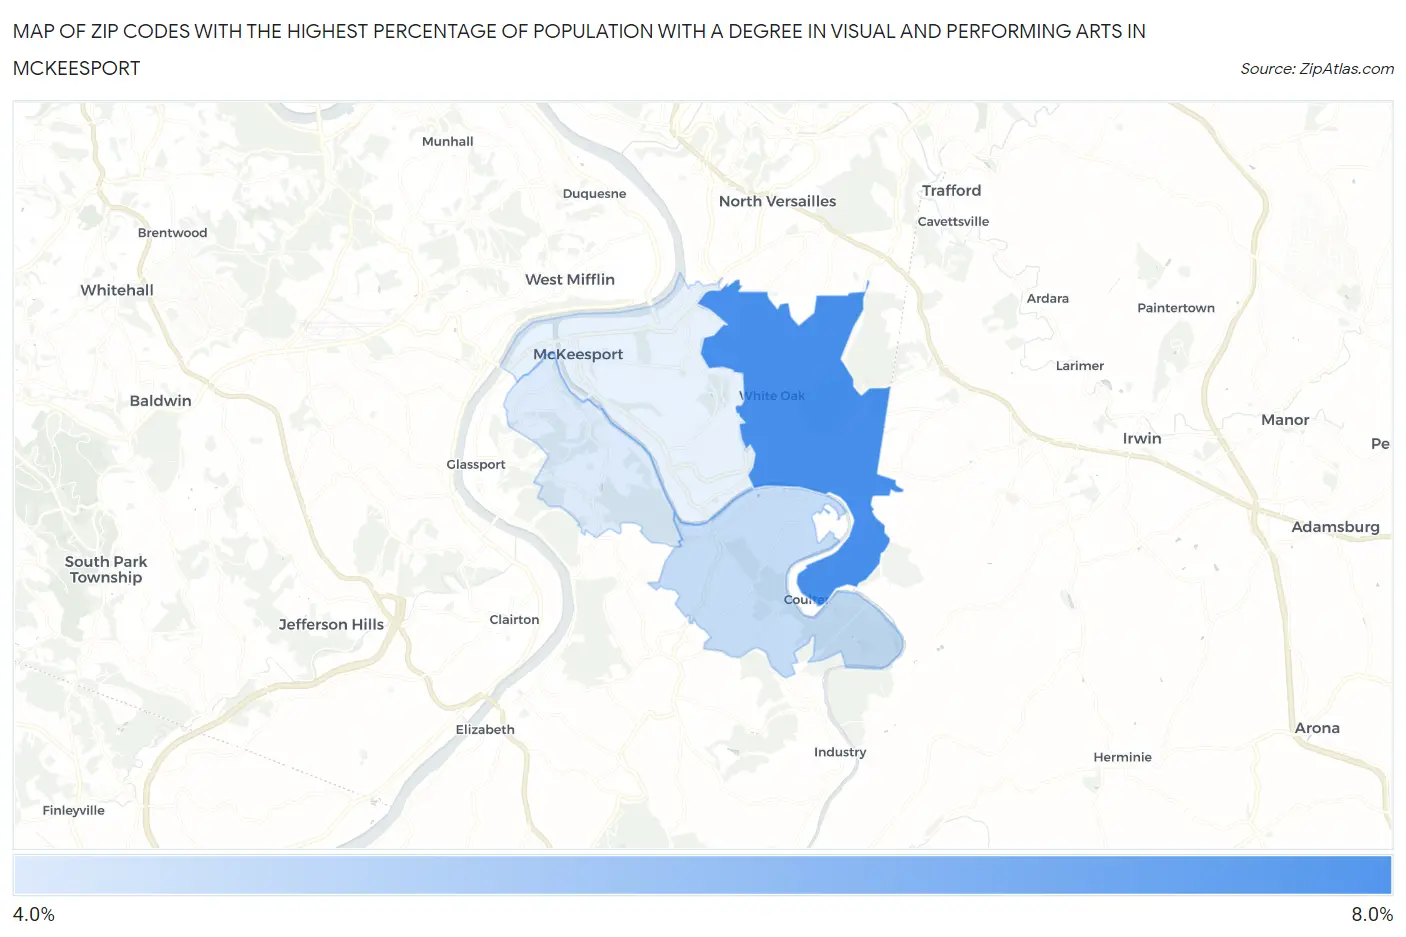
Map of Zip Codes with the Highest Percentage of Population with a Degree in Visual and Performing Arts in Mckeesport
0.0%
8.0%
Zip Codes with the Highest Percentage of Population with a Degree in Visual and Performing Arts in Mckeesport, PA
| Zip Code | % Graduates | vs State | vs National | |
| 1. | 15131 | 7.0% | 3.8%(+3.15)#159 | 4.3%(+2.72)#3,691 |
| 2. | 15135 | 4.6% | 3.8%(+0.774)#365 | 4.3%(+0.345)#7,564 |
| 3. | 15133 | 4.1% | 3.8%(+0.323)#410 | 4.3%(-0.106)#8,775 |
1
Common Questions
What are the Top 3 Zip Codes with the Highest Percentage of Population with a Degree in Visual and Performing Arts in Mckeesport, PA?
Top 3 Zip Codes with the Highest Percentage of Population with a Degree in Visual and Performing Arts in Mckeesport, PA are:
What zip code has the Highest Percentage of Population with a Degree in Visual and Performing Arts in Mckeesport, PA?
15131 has the Highest Percentage of Population with a Degree in Visual and Performing Arts in Mckeesport, PA with 7.0%.
What is the Percentage of Population with a Degree in Visual and Performing Arts in Pennsylvania?
Percentage of Population with a Degree in Visual and Performing Arts in Pennsylvania is 3.8%.
What is the Percentage of Population with a Degree in Visual and Performing Arts in the United States?
Percentage of Population with a Degree in Visual and Performing Arts in the United States is 4.3%.