Zip Codes with the Highest Percentage of Population with a Degree in Visual and Performing Arts in Williamsport, PA
RELATED REPORTS & OPTIONS
Visual and Performing Arts
Williamsport
Compare Zip Codes
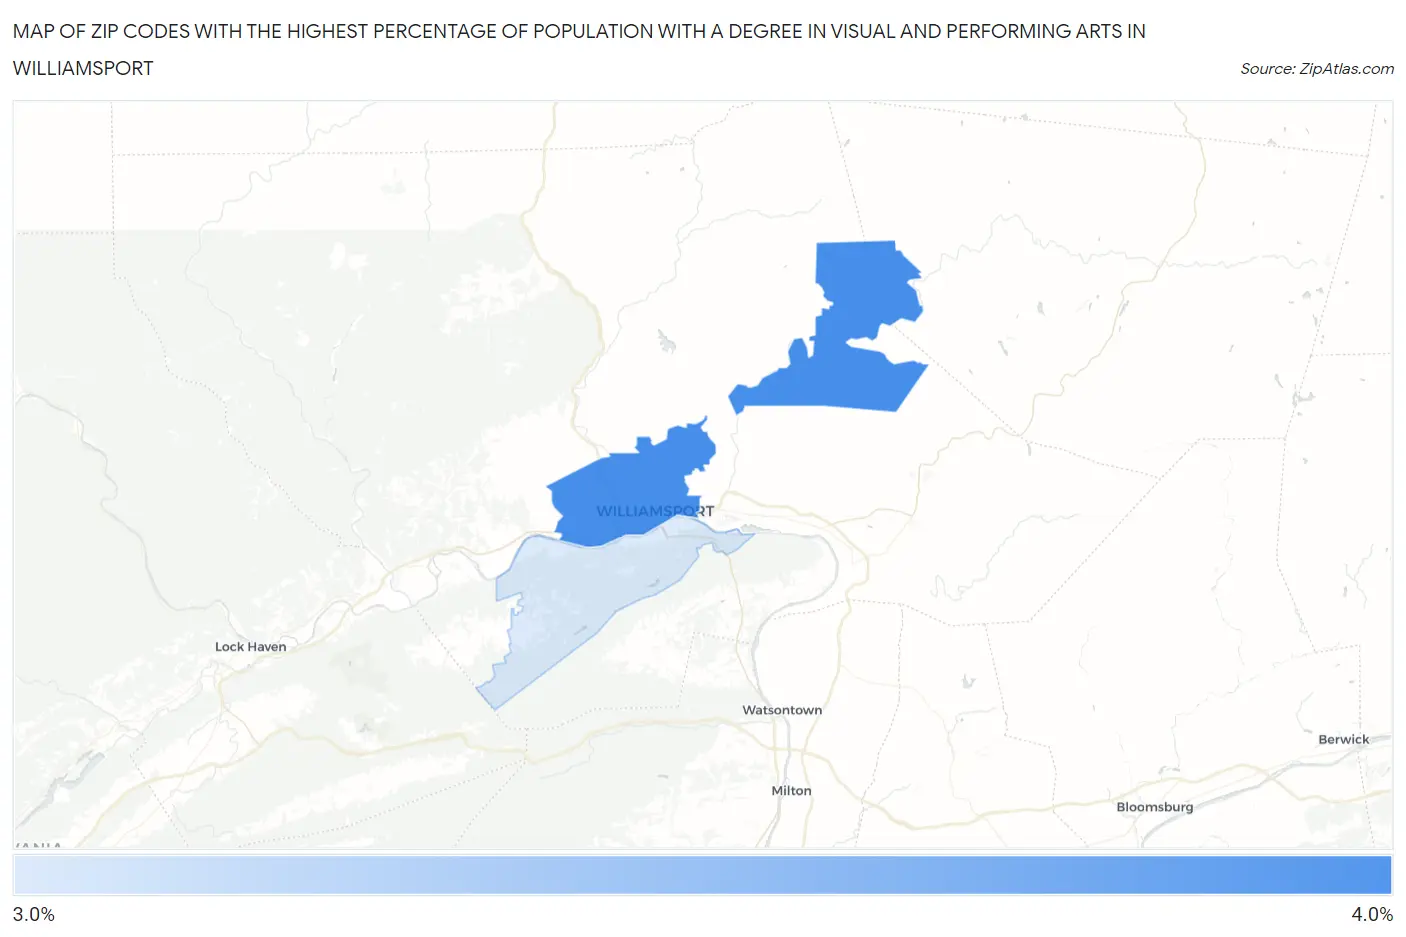
Map of Zip Codes with the Highest Percentage of Population with a Degree in Visual and Performing Arts in Williamsport
0.0%
4.0%
Zip Codes with the Highest Percentage of Population with a Degree in Visual and Performing Arts in Williamsport, PA
| Zip Code | % Graduates | vs State | vs National | |
| 1. | 17701 | 3.7% | 3.8%(-0.158)#485 | 4.3%(-0.587)#10,283 |
| 2. | 17702 | 3.5% | 3.8%(-0.367)#526 | 4.3%(-0.796)#11,050 |
1
Common Questions
What are the Top Zip Codes with the Highest Percentage of Population with a Degree in Visual and Performing Arts in Williamsport, PA?
Top Zip Codes with the Highest Percentage of Population with a Degree in Visual and Performing Arts in Williamsport, PA are:
What zip code has the Highest Percentage of Population with a Degree in Visual and Performing Arts in Williamsport, PA?
17701 has the Highest Percentage of Population with a Degree in Visual and Performing Arts in Williamsport, PA with 3.7%.
What is the Percentage of Population with a Degree in Visual and Performing Arts in Williamsport, PA?
Percentage of Population with a Degree in Visual and Performing Arts in Williamsport is 2.6%.
What is the Percentage of Population with a Degree in Visual and Performing Arts in Pennsylvania?
Percentage of Population with a Degree in Visual and Performing Arts in Pennsylvania is 3.8%.
What is the Percentage of Population with a Degree in Visual and Performing Arts in the United States?
Percentage of Population with a Degree in Visual and Performing Arts in the United States is 4.3%.