Zip Codes with the Highest Percentage of Population with a Degree in Visual and Performing Arts in Pottstown, PA
RELATED REPORTS & OPTIONS
Visual and Performing Arts
Pottstown
Compare Zip Codes
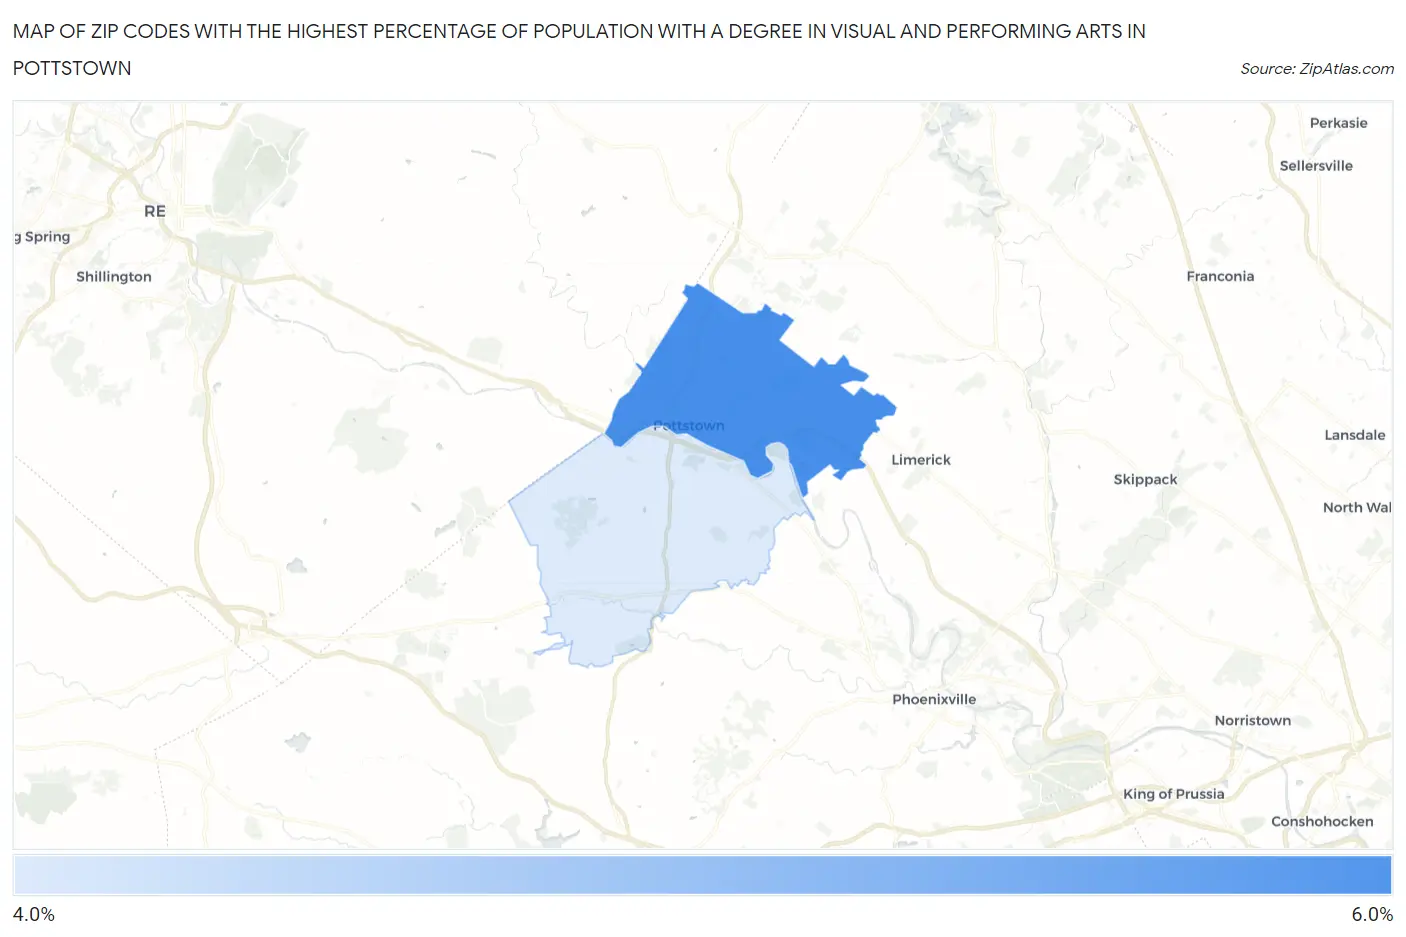
Map of Zip Codes with the Highest Percentage of Population with a Degree in Visual and Performing Arts in Pottstown
0.0%
6.0%
Zip Codes with the Highest Percentage of Population with a Degree in Visual and Performing Arts in Pottstown, PA
| Zip Code | % Graduates | vs State | vs National | |
| 1. | 19464 | 5.8% | 3.8%(+1.99)#234 | 4.3%(+1.56)#5,150 |
| 2. | 19465 | 4.6% | 3.8%(+0.820)#362 | 4.3%(+0.391)#7,437 |
1
Common Questions
What are the Top Zip Codes with the Highest Percentage of Population with a Degree in Visual and Performing Arts in Pottstown, PA?
Top Zip Codes with the Highest Percentage of Population with a Degree in Visual and Performing Arts in Pottstown, PA are:
What zip code has the Highest Percentage of Population with a Degree in Visual and Performing Arts in Pottstown, PA?
19464 has the Highest Percentage of Population with a Degree in Visual and Performing Arts in Pottstown, PA with 5.8%.
What is the Percentage of Population with a Degree in Visual and Performing Arts in Pennsylvania?
Percentage of Population with a Degree in Visual and Performing Arts in Pennsylvania is 3.8%.
What is the Percentage of Population with a Degree in Visual and Performing Arts in the United States?
Percentage of Population with a Degree in Visual and Performing Arts in the United States is 4.3%.