Zip Codes with the Highest Percentage of Population with a Degree in Visual and Performing Arts in Levittown, PA
RELATED REPORTS & OPTIONS
Visual and Performing Arts
Levittown
Compare Zip Codes
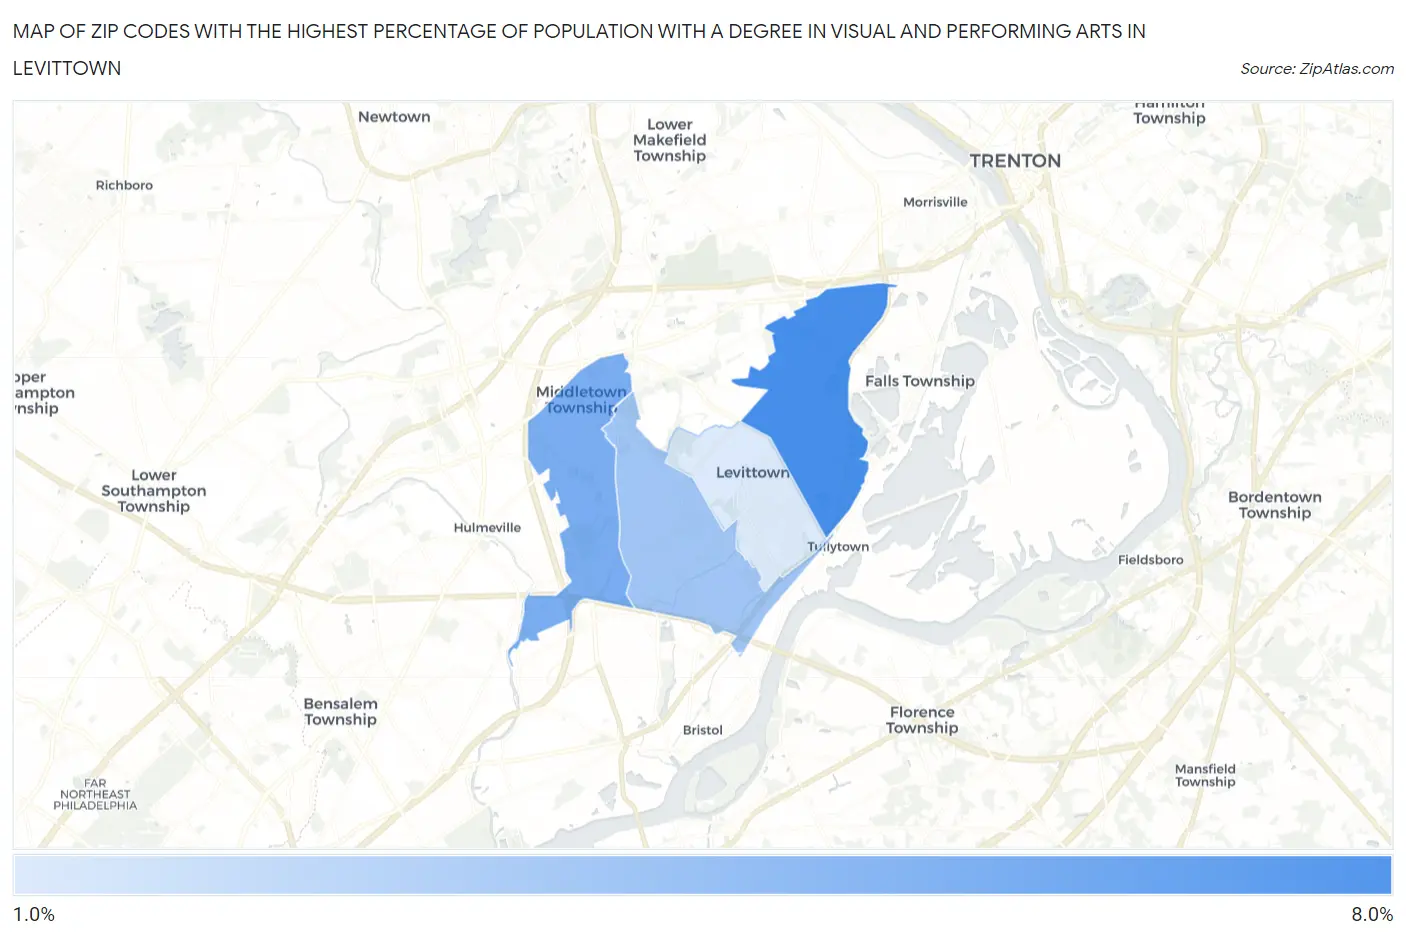
Map of Zip Codes with the Highest Percentage of Population with a Degree in Visual and Performing Arts in Levittown
0.0%
8.0%
Zip Codes with the Highest Percentage of Population with a Degree in Visual and Performing Arts in Levittown, PA
| Zip Code | % Graduates | vs State | vs National | |
| 1. | 19054 | 6.1% | 3.8%(+2.24)#213 | 4.3%(+1.81)#4,796 |
| 2. | 19056 | 4.6% | 3.8%(+0.794)#364 | 4.3%(+0.365)#7,506 |
| 3. | 19057 | 3.5% | 3.8%(-0.356)#525 | 4.3%(-0.785)#11,005 |
| 4. | 19055 | 1.8% | 3.8%(-2.00)#867 | 4.3%(-2.42)#17,045 |
1
Common Questions
What are the Top 3 Zip Codes with the Highest Percentage of Population with a Degree in Visual and Performing Arts in Levittown, PA?
Top 3 Zip Codes with the Highest Percentage of Population with a Degree in Visual and Performing Arts in Levittown, PA are:
What zip code has the Highest Percentage of Population with a Degree in Visual and Performing Arts in Levittown, PA?
19054 has the Highest Percentage of Population with a Degree in Visual and Performing Arts in Levittown, PA with 6.1%.
What is the Percentage of Population with a Degree in Visual and Performing Arts in Levittown, PA?
Percentage of Population with a Degree in Visual and Performing Arts in Levittown is 4.7%.
What is the Percentage of Population with a Degree in Visual and Performing Arts in Pennsylvania?
Percentage of Population with a Degree in Visual and Performing Arts in Pennsylvania is 3.8%.
What is the Percentage of Population with a Degree in Visual and Performing Arts in the United States?
Percentage of Population with a Degree in Visual and Performing Arts in the United States is 4.3%.