Zip Codes with the Highest Percentage of Population with a Degree in Visual and Performing Arts in Norristown, PA
RELATED REPORTS & OPTIONS
Visual and Performing Arts
Norristown
Compare Zip Codes
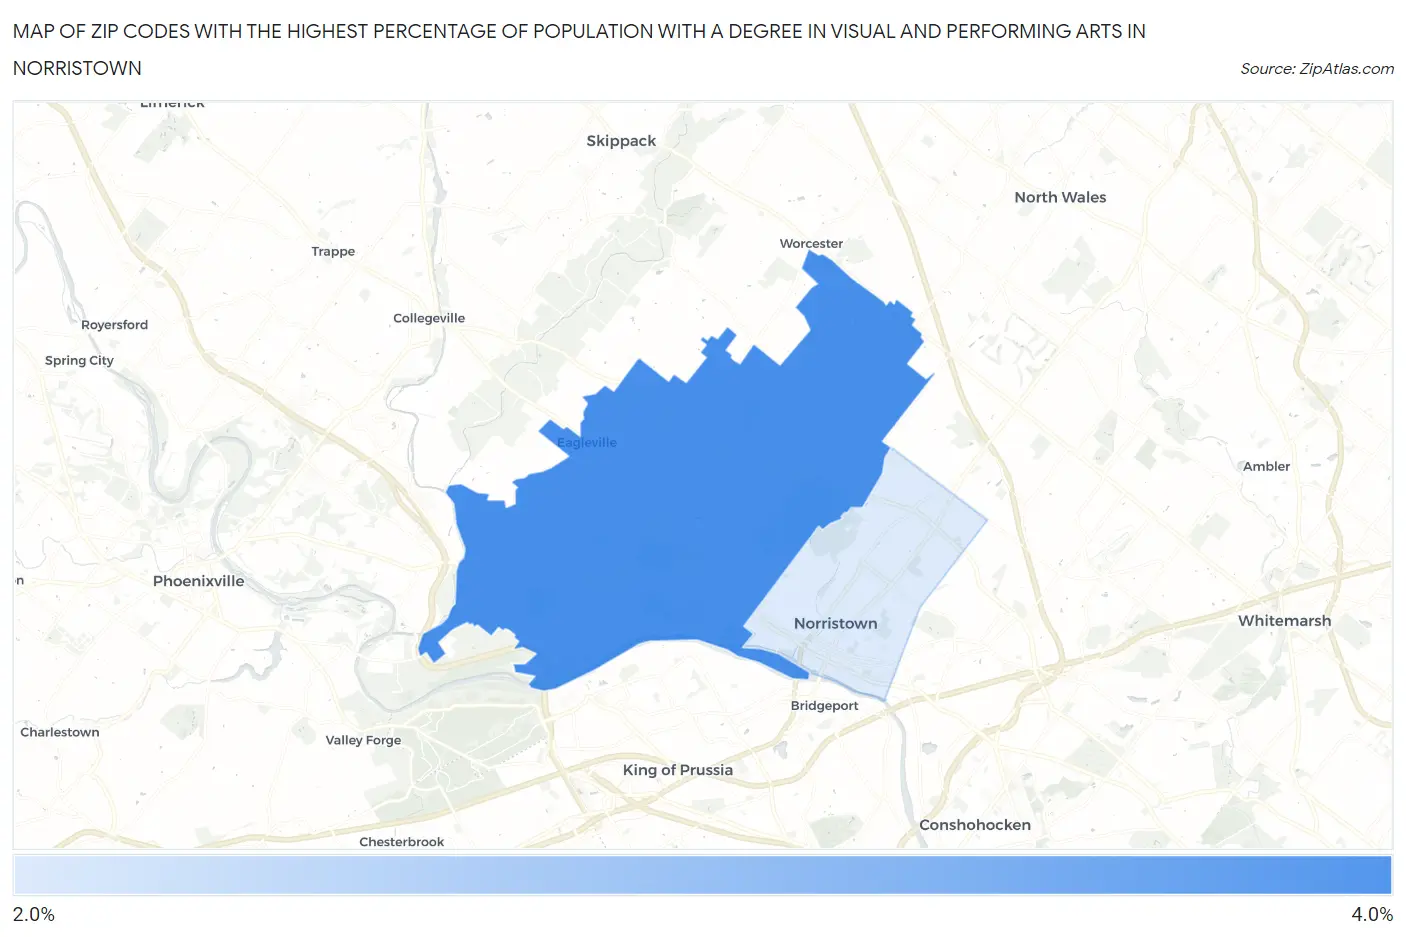
Map of Zip Codes with the Highest Percentage of Population with a Degree in Visual and Performing Arts in Norristown
0.0%
4.0%
Zip Codes with the Highest Percentage of Population with a Degree in Visual and Performing Arts in Norristown, PA
| Zip Code | % Graduates | vs State | vs National | |
| 1. | 19403 | 3.4% | 3.8%(-0.449)#544 | 4.3%(-0.878)#11,328 |
| 2. | 19401 | 2.6% | 3.8%(-1.18)#699 | 4.3%(-1.61)#14,117 |
1
Common Questions
What are the Top Zip Codes with the Highest Percentage of Population with a Degree in Visual and Performing Arts in Norristown, PA?
Top Zip Codes with the Highest Percentage of Population with a Degree in Visual and Performing Arts in Norristown, PA are:
What zip code has the Highest Percentage of Population with a Degree in Visual and Performing Arts in Norristown, PA?
19403 has the Highest Percentage of Population with a Degree in Visual and Performing Arts in Norristown, PA with 3.4%.
What is the Percentage of Population with a Degree in Visual and Performing Arts in Pennsylvania?
Percentage of Population with a Degree in Visual and Performing Arts in Pennsylvania is 3.8%.
What is the Percentage of Population with a Degree in Visual and Performing Arts in the United States?
Percentage of Population with a Degree in Visual and Performing Arts in the United States is 4.3%.