Zip Codes with the Most Immigrants from Singapore in Pennsylvania
RELATED REPORTS & OPTIONS
Singapore
Pennsylvania
Compare Zip Codes
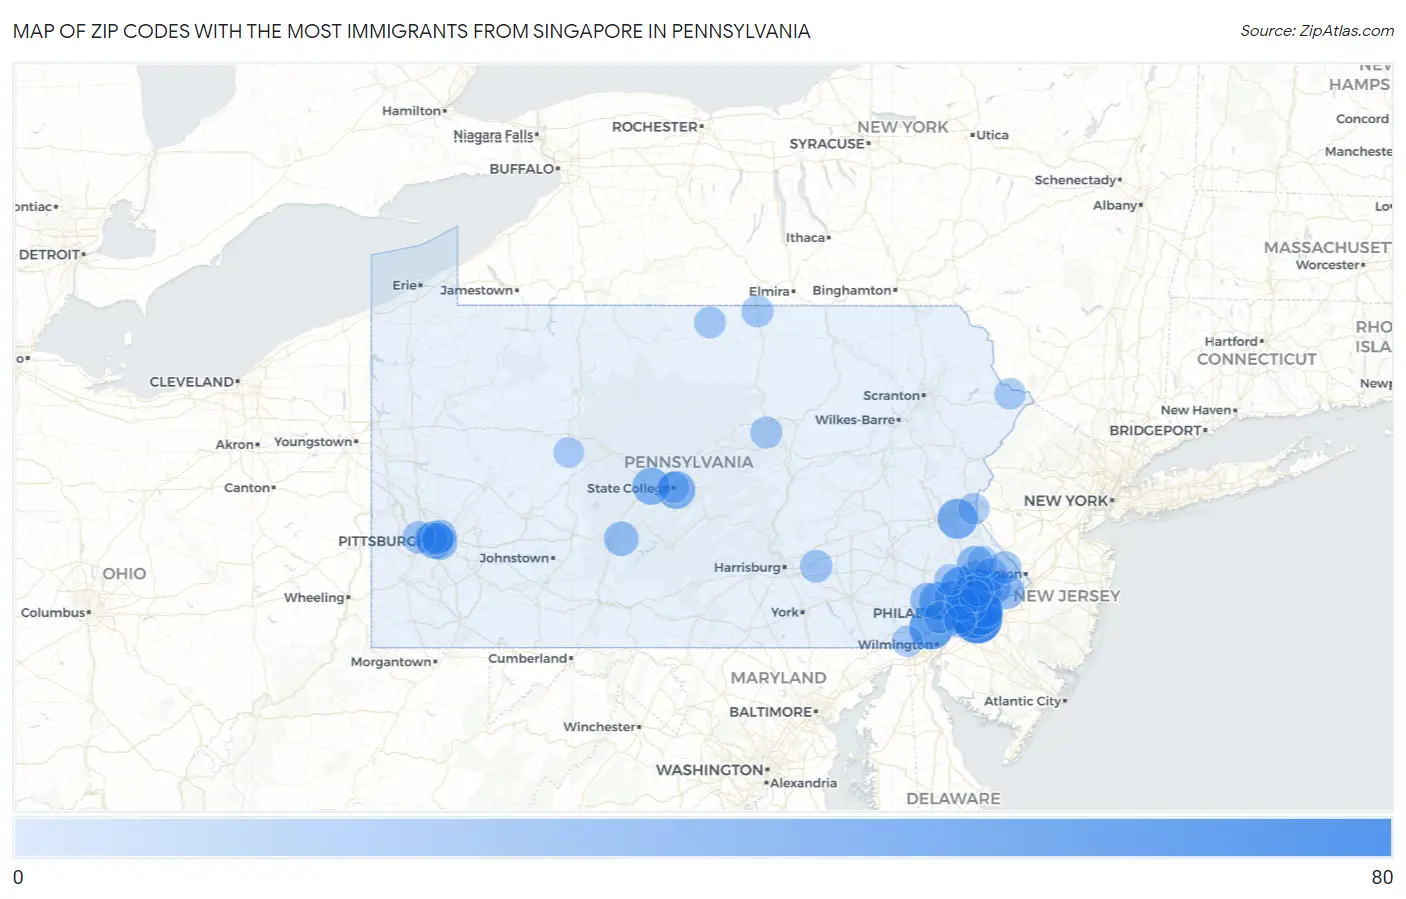
Map of Zip Codes with the Most Immigrants from Singapore in Pennsylvania
0
80
Zip Codes with the Most Immigrants from Singapore in Pennsylvania
| Zip Code | Singapore | vs State | vs National | |
| 1. | 19145 | 69 | 826(8.35%)#1 | 35,435(0.19%)#101 |
| 2. | 19143 | 61 | 826(7.38%)#2 | 35,435(0.17%)#114 |
| 3. | 19038 | 50 | 826(6.05%)#3 | 35,435(0.14%)#159 |
| 4. | 19317 | 48 | 826(5.81%)#4 | 35,435(0.14%)#174 |
| 5. | 19107 | 44 | 826(5.33%)#5 | 35,435(0.12%)#207 |
| 6. | 19401 | 40 | 826(4.84%)#6 | 35,435(0.11%)#231 |
| 7. | 18015 | 34 | 826(4.12%)#7 | 35,435(0.10%)#304 |
| 8. | 19355 | 31 | 826(3.75%)#8 | 35,435(0.09%)#347 |
| 9. | 16801 | 27 | 826(3.27%)#9 | 35,435(0.08%)#401 |
| 10. | 15213 | 26 | 826(3.15%)#10 | 35,435(0.07%)#427 |
| 11. | 16870 | 25 | 826(3.03%)#11 | 35,435(0.07%)#447 |
| 12. | 19087 | 22 | 826(2.66%)#12 | 35,435(0.06%)#496 |
| 13. | 19002 | 21 | 826(2.54%)#13 | 35,435(0.06%)#527 |
| 14. | 19006 | 21 | 826(2.54%)#14 | 35,435(0.06%)#531 |
| 15. | 19020 | 20 | 826(2.42%)#15 | 35,435(0.06%)#542 |
| 16. | 18914 | 20 | 826(2.42%)#16 | 35,435(0.06%)#559 |
| 17. | 19444 | 20 | 826(2.42%)#17 | 35,435(0.06%)#566 |
| 18. | 19125 | 19 | 826(2.30%)#18 | 35,435(0.05%)#584 |
| 19. | 19096 | 19 | 826(2.30%)#19 | 35,435(0.05%)#591 |
| 20. | 15217 | 15 | 826(1.82%)#20 | 35,435(0.04%)#725 |
| 21. | 19064 | 15 | 826(1.82%)#21 | 35,435(0.04%)#726 |
| 22. | 19341 | 15 | 826(1.82%)#22 | 35,435(0.04%)#729 |
| 23. | 16648 | 15 | 826(1.82%)#23 | 35,435(0.04%)#734 |
| 24. | 19010 | 12 | 826(1.45%)#24 | 35,435(0.03%)#854 |
| 25. | 18974 | 11 | 826(1.33%)#25 | 35,435(0.03%)#897 |
| 26. | 15206 | 10 | 826(1.21%)#26 | 35,435(0.03%)#971 |
| 27. | 15222 | 10 | 826(1.21%)#27 | 35,435(0.03%)#1,002 |
| 28. | 19041 | 9 | 826(1.09%)#28 | 35,435(0.03%)#1,052 |
| 29. | 18940 | 8 | 826(0.97%)#29 | 35,435(0.02%)#1,080 |
| 30. | 15136 | 8 | 826(0.97%)#30 | 35,435(0.02%)#1,097 |
| 31. | 17033 | 8 | 826(0.97%)#31 | 35,435(0.02%)#1,107 |
| 32. | 19075 | 8 | 826(0.97%)#32 | 35,435(0.02%)#1,113 |
| 33. | 15232 | 7 | 826(0.85%)#33 | 35,435(0.02%)#1,166 |
| 34. | 19319 | 7 | 826(0.85%)#34 | 35,435(0.02%)#1,174 |
| 35. | 17702 | 6 | 826(0.73%)#35 | 35,435(0.02%)#1,212 |
| 36. | 19118 | 6 | 826(0.73%)#36 | 35,435(0.02%)#1,213 |
| 37. | 16929 | 6 | 826(0.73%)#37 | 35,435(0.02%)#1,220 |
| 38. | 19426 | 5 | 826(0.61%)#38 | 35,435(0.01%)#1,243 |
| 39. | 19081 | 5 | 826(0.61%)#39 | 35,435(0.01%)#1,262 |
| 40. | 16950 | 5 | 826(0.61%)#40 | 35,435(0.01%)#1,267 |
| 41. | 18042 | 4 | 826(0.48%)#41 | 35,435(0.01%)#1,274 |
| 42. | 16802 | 4 | 826(0.48%)#42 | 35,435(0.01%)#1,297 |
| 43. | 19350 | 4 | 826(0.48%)#43 | 35,435(0.01%)#1,300 |
| 44. | 18458 | 4 | 826(0.48%)#44 | 35,435(0.01%)#1,304 |
| 45. | 18901 | 1 | 826(0.12%)#45 | 35,435(0.00%)#1,381 |
| 46. | 15866 | 1 | 826(0.12%)#46 | 35,435(0.00%)#1,392 |
Common Questions
What are the Top 10 Zip Codes with the Most Immigrants from Singapore in Pennsylvania?
Top 10 Zip Codes with the Most Immigrants from Singapore in Pennsylvania are:
What zip code has the Most Immigrants from Singapore in Pennsylvania?
19145 has the Most Immigrants from Singapore in Pennsylvania with 69.
What is the Total Immigrants from Singapore in the State of Pennsylvania?
Total Immigrants from Singapore in Pennsylvania is 826.
What is the Total Immigrants from Singapore in the United States?
Total Immigrants from Singapore in the United States is 35,435.