Zip Codes with the Highest Percentage of Population with a Degree in Visual and Performing Arts in Pittston, PA
RELATED REPORTS & OPTIONS
Visual and Performing Arts
Pittston
Compare Zip Codes
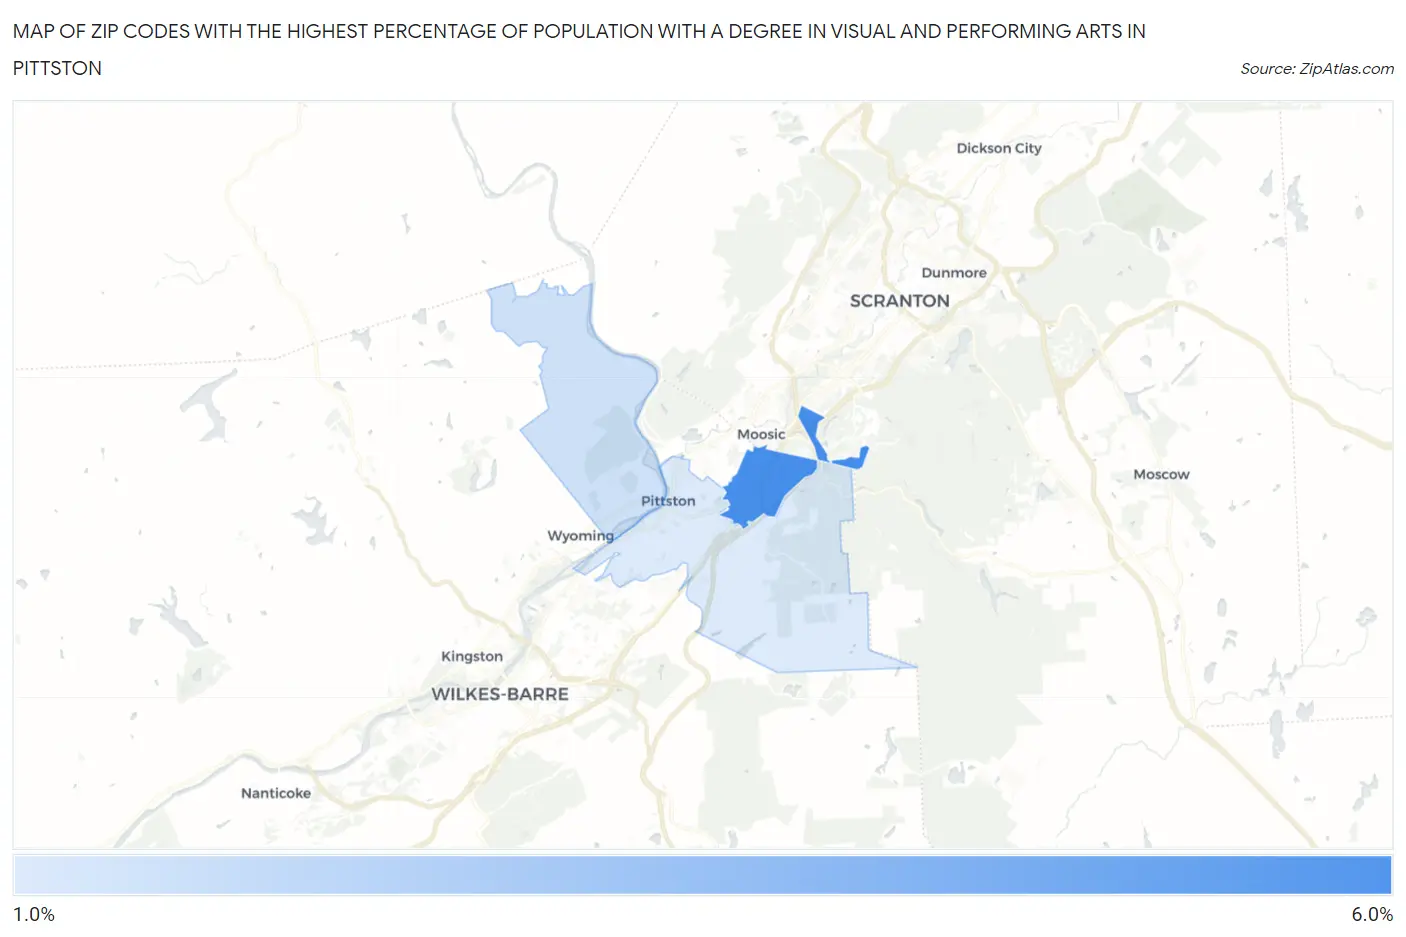
Map of Zip Codes with the Highest Percentage of Population with a Degree in Visual and Performing Arts in Pittston
0.0%
6.0%
Zip Codes with the Highest Percentage of Population with a Degree in Visual and Performing Arts in Pittston, PA
| Zip Code | % Graduates | vs State | vs National | |
| 1. | 18641 | 5.7% | 3.8%(+1.86)#250 | 4.3%(+1.43)#5,352 |
| 2. | 18643 | 1.8% | 3.8%(-1.99)#865 | 4.3%(-2.42)#17,028 |
| 3. | 18640 | 1.4% | 3.8%(-2.41)#953 | 4.3%(-2.84)#18,421 |
1
Common Questions
What are the Top Zip Codes with the Highest Percentage of Population with a Degree in Visual and Performing Arts in Pittston, PA?
Top Zip Codes with the Highest Percentage of Population with a Degree in Visual and Performing Arts in Pittston, PA are:
What zip code has the Highest Percentage of Population with a Degree in Visual and Performing Arts in Pittston, PA?
18641 has the Highest Percentage of Population with a Degree in Visual and Performing Arts in Pittston, PA with 5.7%.
What is the Percentage of Population with a Degree in Visual and Performing Arts in Pittston, PA?
Percentage of Population with a Degree in Visual and Performing Arts in Pittston is 1.7%.
What is the Percentage of Population with a Degree in Visual and Performing Arts in Pennsylvania?
Percentage of Population with a Degree in Visual and Performing Arts in Pennsylvania is 3.8%.
What is the Percentage of Population with a Degree in Visual and Performing Arts in the United States?
Percentage of Population with a Degree in Visual and Performing Arts in the United States is 4.3%.