Zip Codes with the Highest Percentage of Population with a Degree in Visual and Performing Arts in Hazleton, PA
RELATED REPORTS & OPTIONS
Visual and Performing Arts
Hazleton
Compare Zip Codes
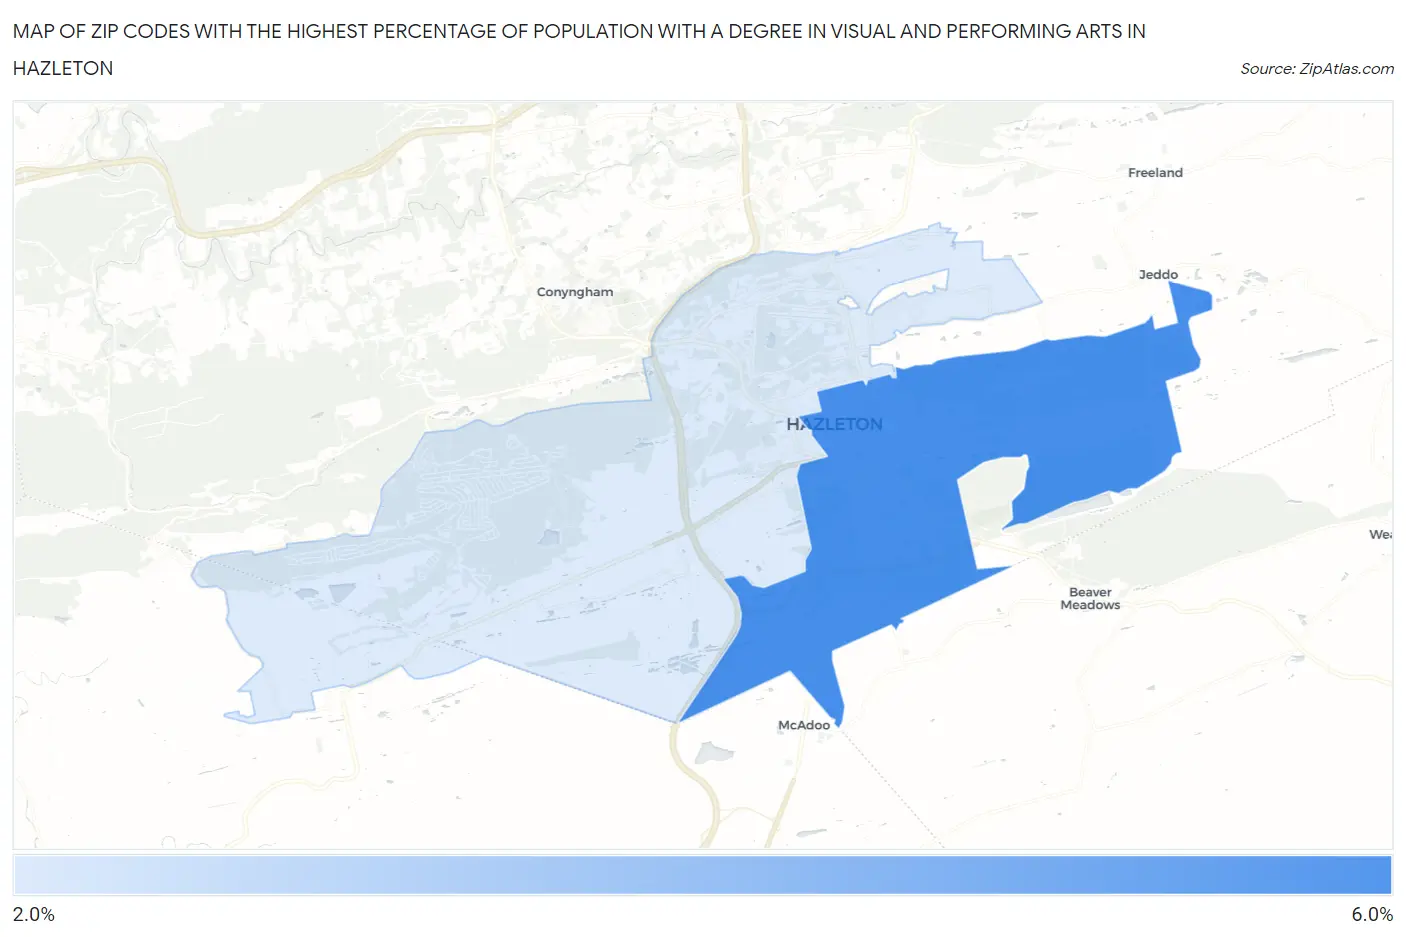
Map of Zip Codes with the Highest Percentage of Population with a Degree in Visual and Performing Arts in Hazleton
0.0%
6.0%
Zip Codes with the Highest Percentage of Population with a Degree in Visual and Performing Arts in Hazleton, PA
| Zip Code | % Graduates | vs State | vs National | |
| 1. | 18201 | 5.2% | 3.8%(+1.34)#299 | 4.3%(+0.906)#6,321 |
| 2. | 18202 | 2.3% | 3.8%(-1.52)#765 | 4.3%(-1.95)#15,360 |
1
Common Questions
What are the Top Zip Codes with the Highest Percentage of Population with a Degree in Visual and Performing Arts in Hazleton, PA?
Top Zip Codes with the Highest Percentage of Population with a Degree in Visual and Performing Arts in Hazleton, PA are:
What zip code has the Highest Percentage of Population with a Degree in Visual and Performing Arts in Hazleton, PA?
18201 has the Highest Percentage of Population with a Degree in Visual and Performing Arts in Hazleton, PA with 5.2%.
What is the Percentage of Population with a Degree in Visual and Performing Arts in Hazleton, PA?
Percentage of Population with a Degree in Visual and Performing Arts in Hazleton is 5.5%.
What is the Percentage of Population with a Degree in Visual and Performing Arts in Pennsylvania?
Percentage of Population with a Degree in Visual and Performing Arts in Pennsylvania is 3.8%.
What is the Percentage of Population with a Degree in Visual and Performing Arts in the United States?
Percentage of Population with a Degree in Visual and Performing Arts in the United States is 4.3%.