Zip Codes with the Highest Percentage of Population Taking Taxi / Cab to Work in Cincinnati, OH
RELATED REPORTS & OPTIONS
Taxi / Cab
Cincinnati
Compare Zip Codes
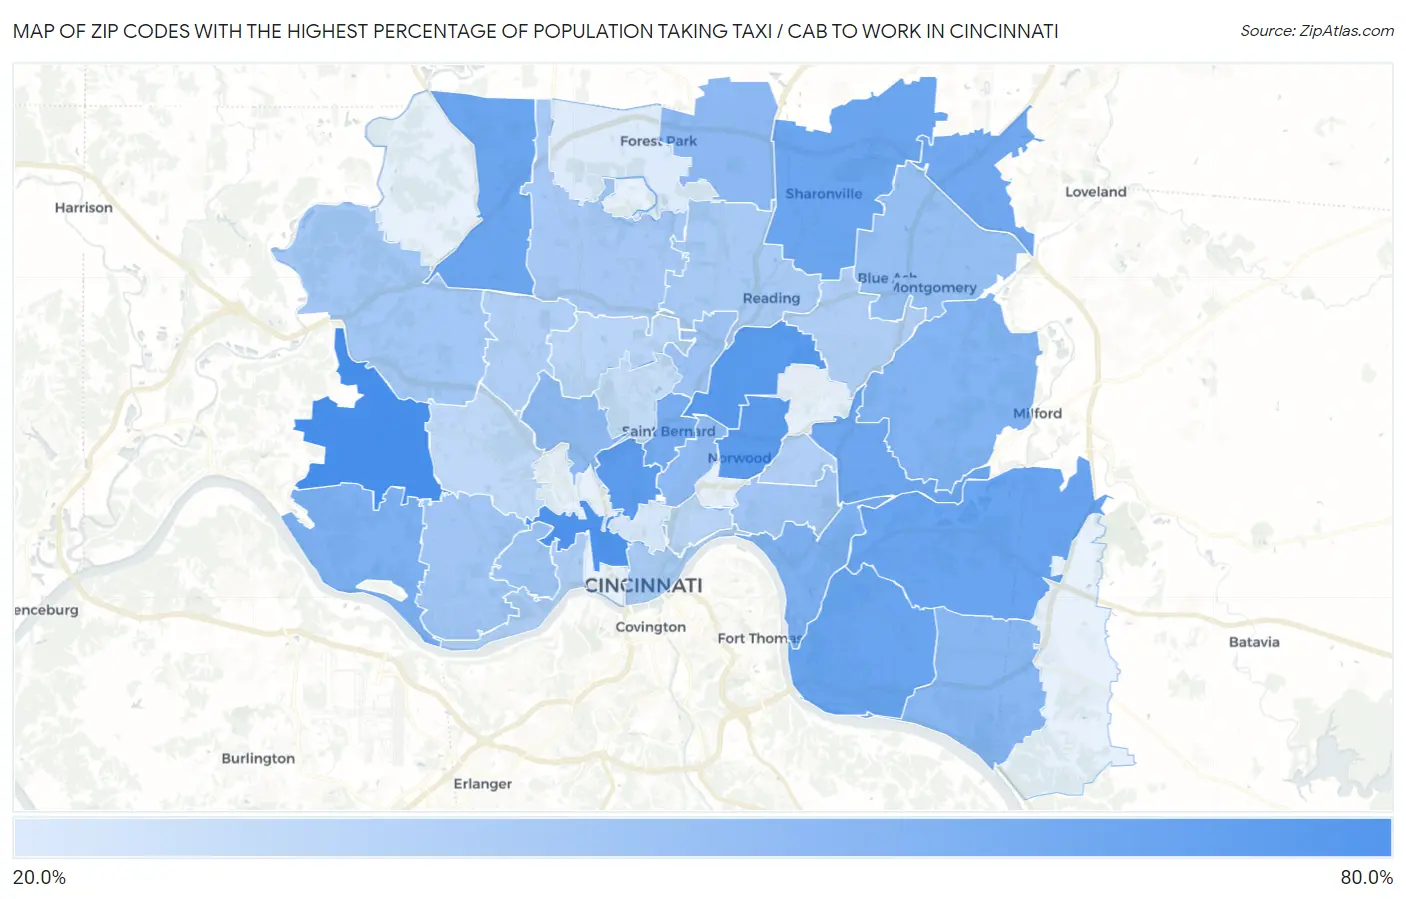
Map of Zip Codes with the Highest Percentage of Population Taking Taxi / Cab to Work in Cincinnati
0.0%
80.0%
Zip Codes with the Highest Percentage of Population Taking Taxi / Cab to Work in Cincinnati, OH
| Zip Code | % Take Taxi / Cab | vs State | vs National | |
| 1. | 45248 | 63.1% | 37.6%(+25.5)#14 | 38.2%(+24.9)#344 |
| 2. | 45214 | 61.1% | 37.6%(+23.5)#23 | 38.2%(+22.9)#532 |
| 3. | 45237 | 58.3% | 37.6%(+20.7)#39 | 38.2%(+20.1)#941 |
| 4. | 45212 | 56.6% | 37.6%(+19.0)#52 | 38.2%(+18.4)#1,223 |
| 5. | 45220 | 56.1% | 37.6%(+18.5)#61 | 38.2%(+17.9)#1,359 |
| 6. | 45244 | 52.7% | 37.6%(+15.1)#90 | 38.2%(+14.5)#2,178 |
| 7. | 45230 | 52.3% | 37.6%(+14.7)#97 | 38.2%(+14.1)#2,292 |
| 8. | 45241 | 52.1% | 37.6%(+14.5)#100 | 38.2%(+13.9)#2,347 |
| 9. | 45251 | 52.1% | 37.6%(+14.5)#101 | 38.2%(+13.9)#2,350 |
| 10. | 45227 | 51.5% | 37.6%(+13.9)#108 | 38.2%(+13.3)#2,506 |
| 11. | 45249 | 50.5% | 37.6%(+12.9)#124 | 38.2%(+12.3)#2,792 |
| 12. | 45217 | 48.4% | 37.6%(+10.8)#140 | 38.2%(+10.2)#3,480 |
| 13. | 45233 | 47.5% | 37.6%(+9.90)#146 | 38.2%(+9.30)#3,794 |
| 14. | 45226 | 46.6% | 37.6%(+9.00)#155 | 38.2%(+8.40)#4,092 |
| 15. | 45243 | 45.9% | 37.6%(+8.30)#164 | 38.2%(+7.70)#4,341 |
| 16. | 45255 | 44.1% | 37.6%(+6.50)#187 | 38.2%(+5.90)#4,961 |
| 17. | 45246 | 43.0% | 37.6%(+5.40)#200 | 38.2%(+4.80)#5,359 |
| 18. | 45229 | 42.1% | 37.6%(+4.50)#208 | 38.2%(+3.90)#5,701 |
| 19. | 45223 | 42.0% | 37.6%(+4.40)#209 | 38.2%(+3.80)#5,739 |
| 20. | 45242 | 40.5% | 37.6%(+2.90)#220 | 38.2%(+2.30)#6,378 |
| 21. | 45216 | 39.2% | 37.6%(+1.60)#235 | 38.2%(+1.00)#7,000 |
| 22. | 45205 | 37.5% | 37.6%(-0.100)#254 | 38.2%(-0.700)#7,732 |
| 23. | 45238 | 37.3% | 37.6%(-0.300)#259 | 38.2%(-0.900)#7,796 |
| 24. | 45208 | 36.9% | 37.6%(-0.700)#267 | 38.2%(-1.30)#7,996 |
| 25. | 45247 | 36.8% | 37.6%(-0.800)#270 | 38.2%(-1.40)#8,042 |
| 26. | 45231 | 35.8% | 37.6%(-1.80)#282 | 38.2%(-2.40)#8,508 |
| 27. | 45202 | 35.6% | 37.6%(-2.00)#290 | 38.2%(-2.60)#8,629 |
| 28. | 45215 | 35.4% | 37.6%(-2.20)#293 | 38.2%(-2.80)#8,728 |
| 29. | 45204 | 33.9% | 37.6%(-3.70)#313 | 38.2%(-4.30)#9,407 |
| 30. | 45236 | 33.5% | 37.6%(-4.10)#321 | 38.2%(-4.70)#9,583 |
| 31. | 45239 | 32.9% | 37.6%(-4.70)#330 | 38.2%(-5.30)#9,793 |
| 32. | 45209 | 32.8% | 37.6%(-4.80)#332 | 38.2%(-5.40)#9,868 |
| 33. | 45224 | 30.6% | 37.6%(-7.00)#355 | 38.2%(-7.60)#10,723 |
| 34. | 45206 | 30.4% | 37.6%(-7.20)#358 | 38.2%(-7.80)#10,805 |
| 35. | 45211 | 29.2% | 37.6%(-8.40)#373 | 38.2%(-9.00)#11,208 |
| 36. | 45232 | 27.7% | 37.6%(-9.90)#398 | 38.2%(-10.5)#11,654 |
| 37. | 45219 | 23.7% | 37.6%(-13.9)#441 | 38.2%(-14.5)#12,521 |
| 38. | 45240 | 22.2% | 37.6%(-15.4)#456 | 38.2%(-16.0)#12,742 |
1
Common Questions
What are the Top 10 Zip Codes with the Highest Percentage of Population Taking Taxi / Cab to Work in Cincinnati, OH?
Top 10 Zip Codes with the Highest Percentage of Population Taking Taxi / Cab to Work in Cincinnati, OH are:
What zip code has the Highest Percentage of Population Taking Taxi / Cab to Work in Cincinnati, OH?
45248 has the Highest Percentage of Population Taking Taxi / Cab to Work in Cincinnati, OH with 63.1%.
What is the Percentage of Population Taking Taxi / Cab to Work in Cincinnati, OH?
Percentage of Population Taking Taxi / Cab to Work in Cincinnati is 37.6%.
What is the Percentage of Population Taking Taxi / Cab to Work in Ohio?
Percentage of Population Taking Taxi / Cab to Work in Ohio is 37.6%.
What is the Percentage of Population Taking Taxi / Cab to Work in the United States?
Percentage of Population Taking Taxi / Cab to Work in the United States is 38.2%.