Zip Codes with the Most Immigrants from Mexico in Cincinnati, OH
RELATED REPORTS & OPTIONS
Mexico
Cincinnati
Compare Zip Codes
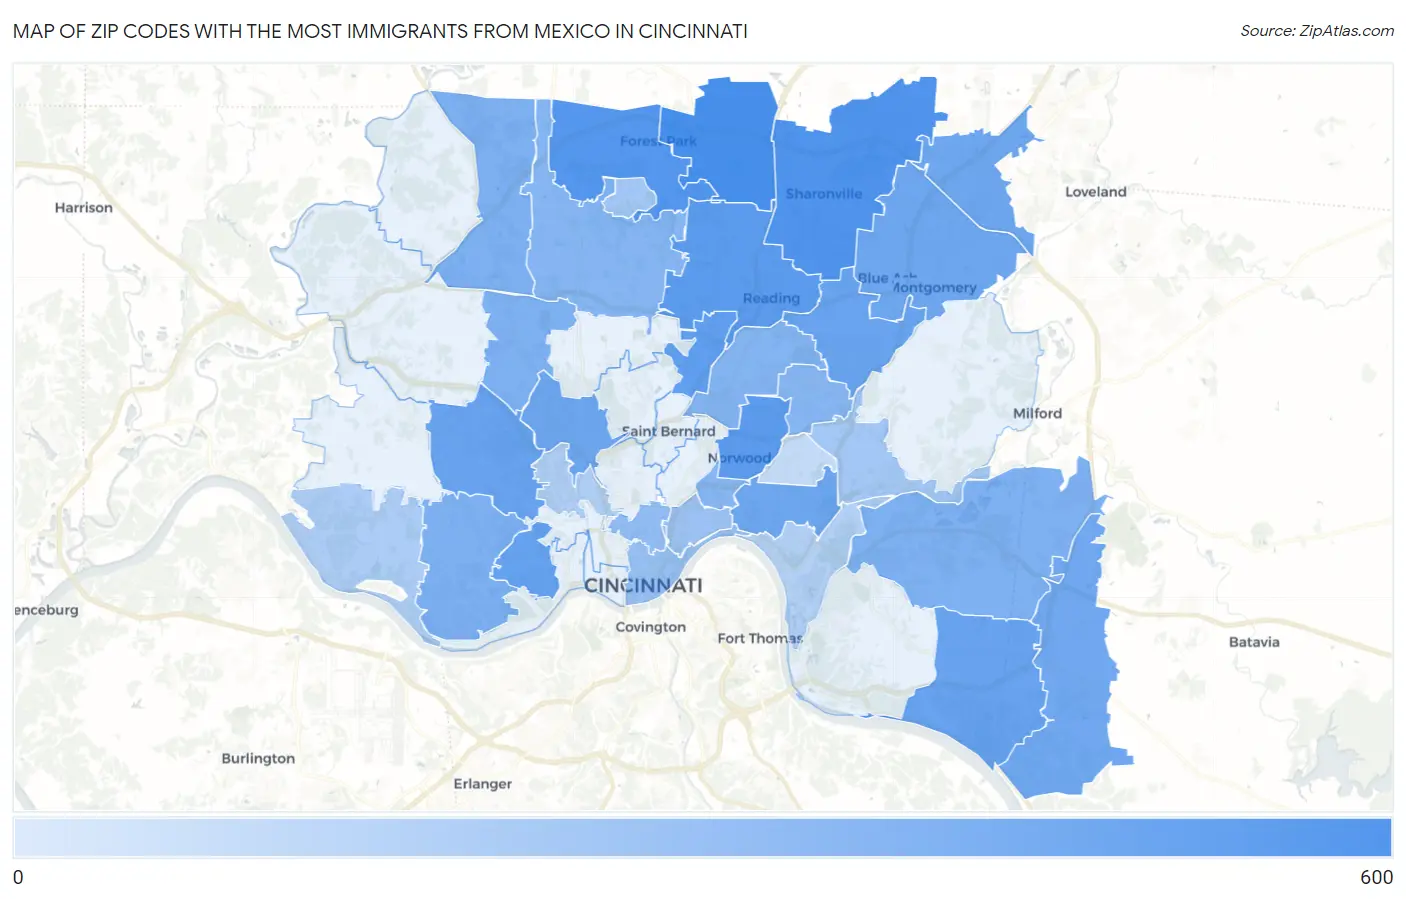
Map of Zip Codes with the Most Immigrants from Mexico in Cincinnati
0
600
Zip Codes with the Most Immigrants from Mexico in Cincinnati, OH
| Zip Code | Mexico | vs State | vs National | |
| 1. | 45246 | 573 | 44,796(1.28%)#14 | 10,767,104(0.01%)#3,247 |
| 2. | 45241 | 427 | 44,796(0.95%)#20 | 10,767,104(0.00%)#3,910 |
| 3. | 45240 | 313 | 44,796(0.70%)#30 | 10,767,104(0.00%)#4,653 |
| 4. | 45212 | 244 | 44,796(0.54%)#45 | 10,767,104(0.00%)#5,290 |
| 5. | 45215 | 237 | 44,796(0.53%)#47 | 10,767,104(0.00%)#5,357 |
| 6. | 45216 | 204 | 44,796(0.46%)#59 | 10,767,104(0.00%)#5,759 |
| 7. | 45205 | 168 | 44,796(0.38%)#72 | 10,767,104(0.00%)#6,322 |
| 8. | 45211 | 148 | 44,796(0.33%)#79 | 10,767,104(0.00%)#6,715 |
| 9. | 45255 | 146 | 44,796(0.33%)#81 | 10,767,104(0.00%)#6,774 |
| 10. | 45236 | 126 | 44,796(0.28%)#90 | 10,767,104(0.00%)#7,211 |
| 11. | 45249 | 112 | 44,796(0.25%)#100 | 10,767,104(0.00%)#7,571 |
| 12. | 45223 | 109 | 44,796(0.24%)#102 | 10,767,104(0.00%)#7,655 |
| 13. | 45242 | 106 | 44,796(0.24%)#109 | 10,767,104(0.00%)#7,731 |
| 14. | 45208 | 104 | 44,796(0.23%)#114 | 10,767,104(0.00%)#7,786 |
| 15. | 45245 | 94 | 44,796(0.21%)#124 | 10,767,104(0.00%)#8,079 |
| 16. | 45238 | 61 | 44,796(0.14%)#163 | 10,767,104(0.00%)#9,343 |
| 17. | 45251 | 61 | 44,796(0.14%)#165 | 10,767,104(0.00%)#9,359 |
| 18. | 45239 | 56 | 44,796(0.13%)#176 | 10,767,104(0.00%)#9,581 |
| 19. | 45244 | 53 | 44,796(0.12%)#181 | 10,767,104(0.00%)#9,757 |
| 20. | 45237 | 44 | 44,796(0.10%)#202 | 10,767,104(0.00%)#10,333 |
| 21. | 45231 | 39 | 44,796(0.09%)#214 | 10,767,104(0.00%)#10,660 |
| 22. | 45213 | 35 | 44,796(0.08%)#229 | 10,767,104(0.00%)#10,987 |
| 23. | 45207 | 35 | 44,796(0.08%)#230 | 10,767,104(0.00%)#10,995 |
| 24. | 45219 | 24 | 44,796(0.05%)#270 | 10,767,104(0.00%)#11,963 |
| 25. | 45202 | 17 | 44,796(0.04%)#306 | 10,767,104(0.00%)#12,847 |
| 26. | 45206 | 14 | 44,796(0.03%)#327 | 10,767,104(0.00%)#13,301 |
| 27. | 45227 | 11 | 44,796(0.02%)#347 | 10,767,104(0.00%)#13,824 |
| 28. | 45218 | 10 | 44,796(0.02%)#354 | 10,767,104(0.00%)#14,078 |
| 29. | 45233 | 7 | 44,796(0.02%)#380 | 10,767,104(0.00%)#14,693 |
| 30. | 45225 | 6 | 44,796(0.01%)#392 | 10,767,104(0.00%)#14,982 |
| 31. | 45226 | 5 | 44,796(0.01%)#401 | 10,767,104(0.00%)#15,287 |
| 32. | 45209 | 2 | 44,796(0.00%)#429 | 10,767,104(0.00%)#16,207 |
1
Common Questions
What are the Top 10 Zip Codes with the Most Immigrants from Mexico in Cincinnati, OH?
Top 10 Zip Codes with the Most Immigrants from Mexico in Cincinnati, OH are:
What zip code has the Most Immigrants from Mexico in Cincinnati, OH?
45246 has the Most Immigrants from Mexico in Cincinnati, OH with 573.
What is the Total Immigrants from Mexico in Cincinnati, OH?
Total Immigrants from Mexico in Cincinnati is 912.
What is the Total Immigrants from Mexico in Ohio?
Total Immigrants from Mexico in Ohio is 44,796.
What is the Total Immigrants from Mexico in the United States?
Total Immigrants from Mexico in the United States is 10,767,104.