Zip Codes with the Largest Hispanic or Latino Community in Cincinnati, OH
RELATED REPORTS & OPTIONS
Hispanic or Latino
Cincinnati
Compare Zip Codes
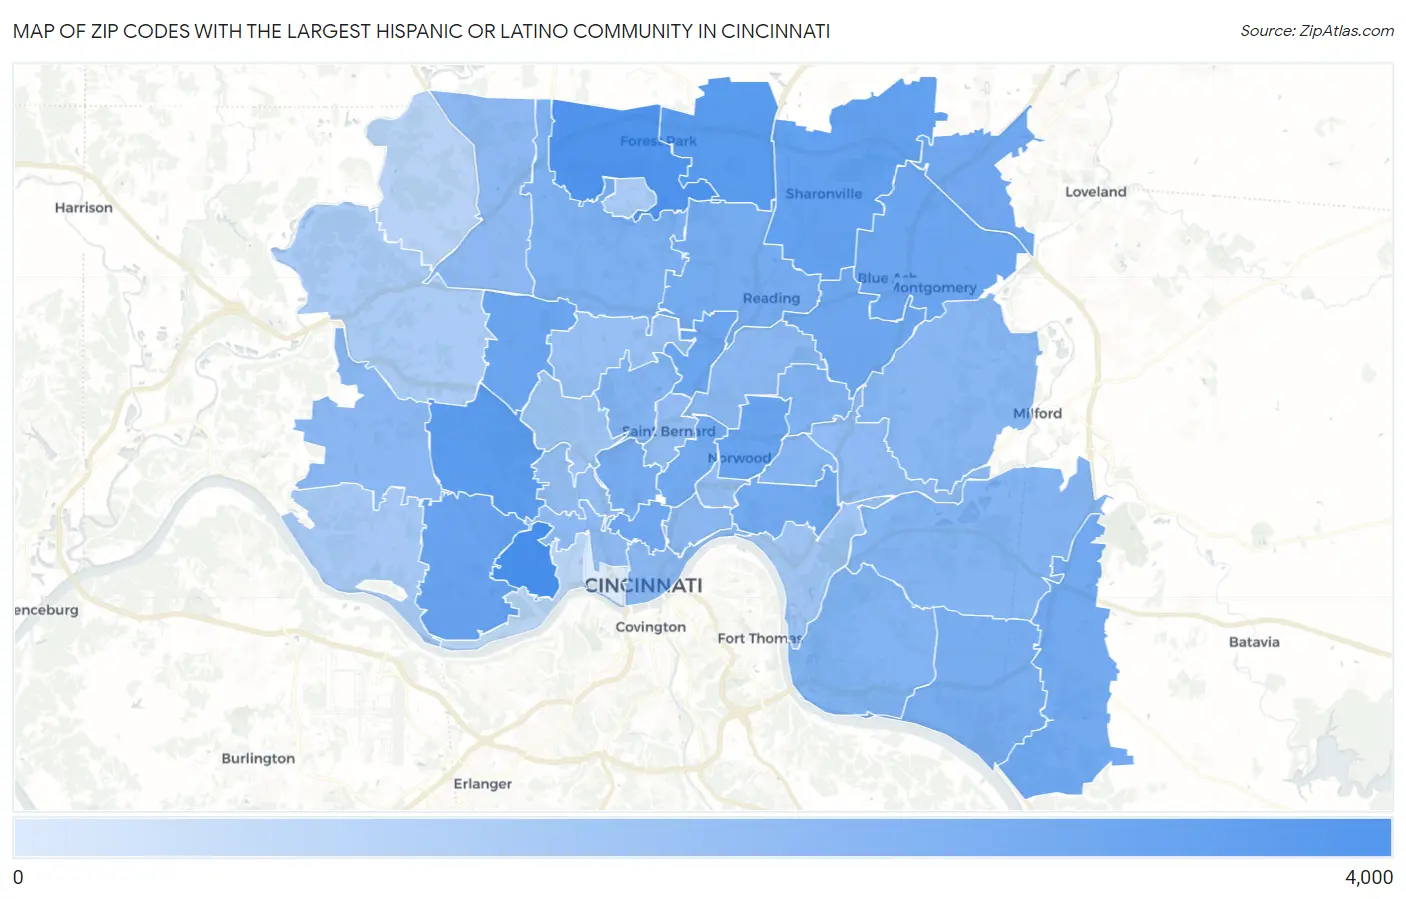
Map of Zip Codes with the Largest Hispanic or Latino Community in Cincinnati
0
4,000
Zip Codes with the Largest Hispanic or Latino Community in Cincinnati, OH
| Zip Code | Hispanic or Latino | vs State | vs National | |
| 1. | 45205 | 3,124 | 494,625(0.63%)#26 | 61,755,866(0.01%)#4,448 |
| 2. | 45240 | 2,573 | 494,625(0.52%)#35 | 61,755,866(0.00%)#4,999 |
| 3. | 45246 | 1,898 | 494,625(0.38%)#60 | 61,755,866(0.00%)#5,983 |
| 4. | 45211 | 1,686 | 494,625(0.34%)#69 | 61,755,866(0.00%)#6,349 |
| 5. | 45241 | 1,350 | 494,625(0.27%)#100 | 61,755,866(0.00%)#7,128 |
| 6. | 45238 | 1,187 | 494,625(0.24%)#111 | 61,755,866(0.00%)#7,564 |
| 7. | 45212 | 1,078 | 494,625(0.22%)#127 | 61,755,866(0.00%)#7,914 |
| 8. | 45242 | 1,038 | 494,625(0.21%)#134 | 61,755,866(0.00%)#8,065 |
| 9. | 45216 | 1,027 | 494,625(0.21%)#139 | 61,755,866(0.00%)#8,099 |
| 10. | 45239 | 1,002 | 494,625(0.20%)#142 | 61,755,866(0.00%)#8,183 |
| 11. | 45236 | 941 | 494,625(0.19%)#150 | 61,755,866(0.00%)#8,426 |
| 12. | 45219 | 900 | 494,625(0.18%)#157 | 61,755,866(0.00%)#8,599 |
| 13. | 45249 | 862 | 494,625(0.17%)#163 | 61,755,866(0.00%)#8,745 |
| 14. | 45245 | 826 | 494,625(0.17%)#169 | 61,755,866(0.00%)#8,890 |
| 15. | 45229 | 802 | 494,625(0.16%)#175 | 61,755,866(0.00%)#8,994 |
| 16. | 45208 | 792 | 494,625(0.16%)#179 | 61,755,866(0.00%)#9,042 |
| 17. | 45215 | 742 | 494,625(0.15%)#195 | 61,755,866(0.00%)#9,307 |
| 18. | 45255 | 711 | 494,625(0.14%)#205 | 61,755,866(0.00%)#9,467 |
| 19. | 45220 | 693 | 494,625(0.14%)#211 | 61,755,866(0.00%)#9,559 |
| 20. | 45231 | 600 | 494,625(0.12%)#232 | 61,755,866(0.00%)#10,072 |
| 21. | 45213 | 537 | 494,625(0.11%)#245 | 61,755,866(0.00%)#10,478 |
| 22. | 45230 | 529 | 494,625(0.11%)#252 | 61,755,866(0.00%)#10,525 |
| 23. | 45244 | 505 | 494,625(0.10%)#258 | 61,755,866(0.00%)#10,678 |
| 24. | 45232 | 505 | 494,625(0.10%)#259 | 61,755,866(0.00%)#10,681 |
| 25. | 45209 | 461 | 494,625(0.09%)#274 | 61,755,866(0.00%)#11,005 |
| 26. | 45243 | 439 | 494,625(0.09%)#288 | 61,755,866(0.00%)#11,178 |
| 27. | 45248 | 409 | 494,625(0.08%)#300 | 61,755,866(0.00%)#11,411 |
| 28. | 45202 | 409 | 494,625(0.08%)#301 | 61,755,866(0.00%)#11,413 |
| 29. | 45237 | 405 | 494,625(0.08%)#303 | 61,755,866(0.00%)#11,444 |
| 30. | 45206 | 396 | 494,625(0.08%)#305 | 61,755,866(0.00%)#11,535 |
| 31. | 45251 | 388 | 494,625(0.08%)#308 | 61,755,866(0.00%)#11,615 |
| 32. | 45214 | 345 | 494,625(0.07%)#325 | 61,755,866(0.00%)#12,048 |
| 33. | 45227 | 339 | 494,625(0.07%)#329 | 61,755,866(0.00%)#12,120 |
| 34. | 45217 | 317 | 494,625(0.06%)#341 | 61,755,866(0.00%)#12,386 |
| 35. | 45225 | 314 | 494,625(0.06%)#343 | 61,755,866(0.00%)#12,419 |
| 36. | 45207 | 306 | 494,625(0.06%)#348 | 61,755,866(0.00%)#12,530 |
| 37. | 45224 | 272 | 494,625(0.05%)#368 | 61,755,866(0.00%)#12,976 |
| 38. | 45223 | 213 | 494,625(0.04%)#404 | 61,755,866(0.00%)#13,905 |
| 39. | 45226 | 198 | 494,625(0.04%)#413 | 61,755,866(0.00%)#14,198 |
| 40. | 45233 | 168 | 494,625(0.03%)#437 | 61,755,866(0.00%)#14,842 |
| 41. | 45247 | 152 | 494,625(0.03%)#460 | 61,755,866(0.00%)#15,210 |
| 42. | 45218 | 145 | 494,625(0.03%)#468 | 61,755,866(0.00%)#15,395 |
| 43. | 45252 | 98 | 494,625(0.02%)#534 | 61,755,866(0.00%)#16,923 |
| 44. | 45204 | 88 | 494,625(0.02%)#556 | 61,755,866(0.00%)#17,335 |
| 45. | 45203 | 31 | 494,625(0.01%)#713 | 61,755,866(0.00%)#21,316 |
1
Common Questions
What are the Top 10 Zip Codes with the Largest Hispanic or Latino Community in Cincinnati, OH?
Top 10 Zip Codes with the Largest Hispanic or Latino Community in Cincinnati, OH are:
What zip code has the Largest Hispanic or Latino Community in Cincinnati, OH?
45205 has the Largest Hispanic or Latino Community in Cincinnati, OH with 3,124.
What is the Total Hispanic or Latino Population in Cincinnati, OH?
Total Hispanic or Latino Population in Cincinnati is 14,114.
What is the Total Hispanic or Latino Population in Ohio?
Total Hispanic or Latino Population in Ohio is 494,625.
What is the Total Hispanic or Latino Population in the United States?
Total Hispanic or Latino Population in the United States is 61,755,866.