Zip Codes with the Highest Percentage of Owner-Occupied Units in Cincinnati, OH
RELATED REPORTS & OPTIONS
Highest Owner-Occupied
Cincinnati
Compare Zip Codes
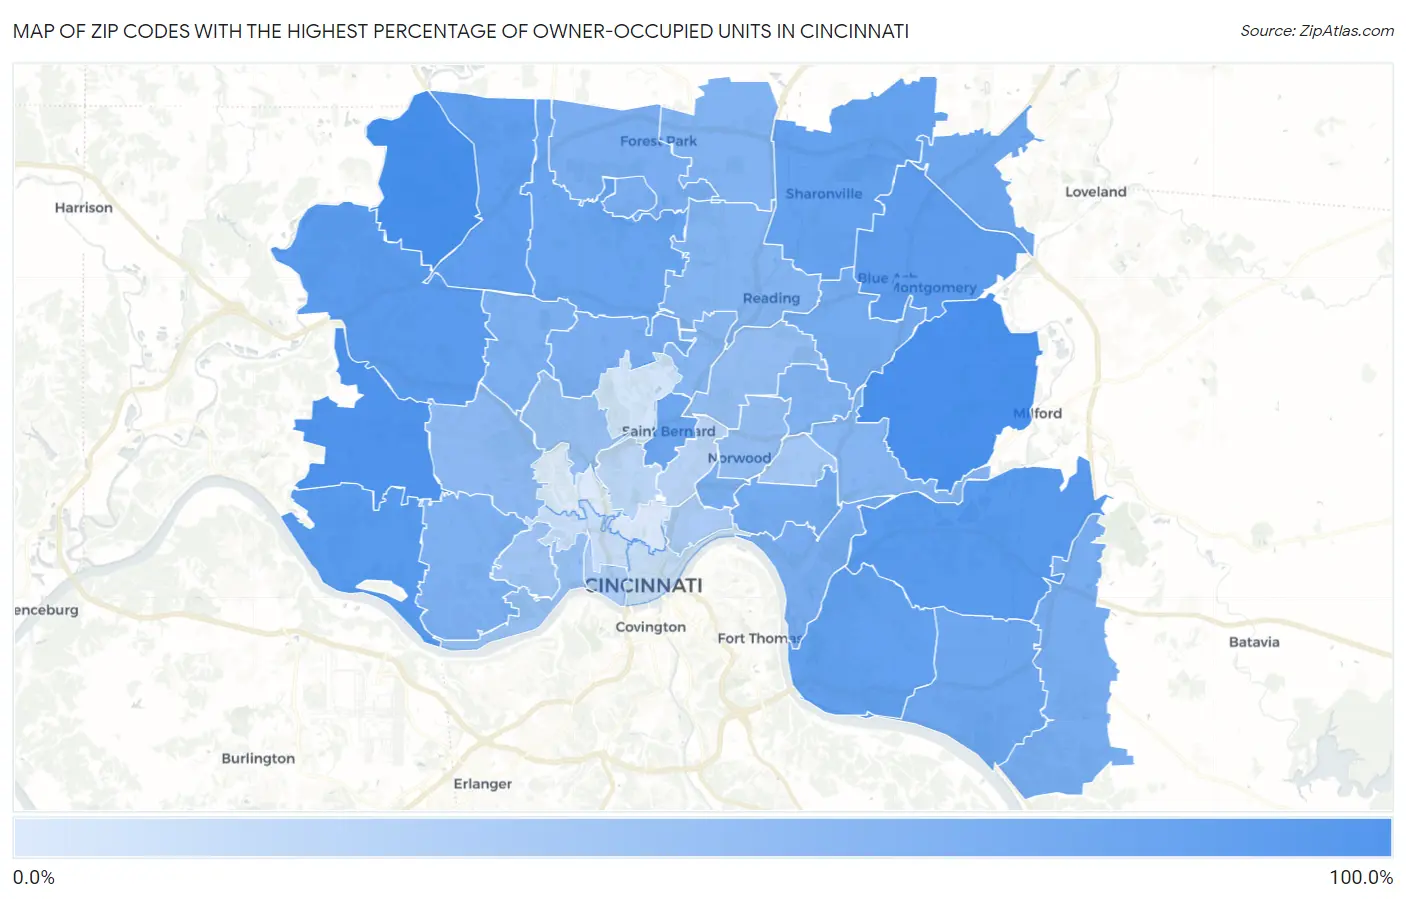
Map of Zip Codes with the Highest Percentage of Owner-Occupied Units in Cincinnati
0.0%
100.0%
Zip Codes with the Highest Percentage of Owner-Occupied Units in Cincinnati, OH
| Zip Code | % Owner-Occupied | vs State | vs National | |
| 1. | 45252 | 92.4% | 66.8%(+25.5)#122 | 64.8%(+27.5)#4,003 |
| 2. | 45243 | 90.6% | 66.8%(+23.7)#159 | 64.8%(+25.8)#5,096 |
| 3. | 45248 | 87.4% | 66.8%(+20.5)#240 | 64.8%(+22.5)#7,573 |
| 4. | 45233 | 82.4% | 66.8%(+15.6)#420 | 64.8%(+17.6)#12,226 |
| 5. | 45244 | 81.6% | 66.8%(+14.8)#449 | 64.8%(+16.8)#13,039 |
| 6. | 45247 | 79.9% | 66.8%(+13.1)#521 | 64.8%(+15.1)#14,733 |
| 7. | 45242 | 77.4% | 66.8%(+10.5)#616 | 64.8%(+12.5)#17,058 |
| 8. | 45251 | 76.1% | 66.8%(+9.30)#665 | 64.8%(+11.3)#18,204 |
| 9. | 45230 | 74.9% | 66.8%(+8.07)#713 | 64.8%(+10.1)#19,290 |
| 10. | 45241 | 73.5% | 66.8%(+6.70)#750 | 64.8%(+8.71)#20,338 |
| 11. | 45231 | 70.6% | 66.8%(+3.81)#831 | 64.8%(+5.82)#22,349 |
| 12. | 45217 | 68.1% | 66.8%(+1.23)#901 | 64.8%(+3.24)#23,932 |
| 13. | 45249 | 67.1% | 66.8%(+0.322)#915 | 64.8%(+2.33)#24,418 |
| 14. | 45255 | 67.1% | 66.8%(+0.291)#916 | 64.8%(+2.30)#24,437 |
| 15. | 45236 | 64.3% | 66.8%(-2.48)#952 | 64.8%(-0.474)#25,775 |
| 16. | 45208 | 63.6% | 66.8%(-3.22)#959 | 64.8%(-1.22)#26,063 |
| 17. | 45245 | 62.7% | 66.8%(-4.08)#976 | 64.8%(-2.08)#26,457 |
| 18. | 45218 | 61.7% | 66.8%(-5.11)#992 | 64.8%(-3.10)#26,828 |
| 19. | 45240 | 60.9% | 66.8%(-5.94)#1,007 | 64.8%(-3.94)#27,138 |
| 20. | 45226 | 60.8% | 66.8%(-5.98)#1,008 | 64.8%(-3.98)#27,152 |
| 21. | 45224 | 60.7% | 66.8%(-6.16)#1,010 | 64.8%(-4.15)#27,212 |
| 22. | 45207 | 60.1% | 66.8%(-6.70)#1,014 | 64.8%(-4.70)#27,377 |
| 23. | 45239 | 59.2% | 66.8%(-7.61)#1,021 | 64.8%(-5.60)#27,644 |
| 24. | 45238 | 58.5% | 66.8%(-8.29)#1,031 | 64.8%(-6.29)#27,850 |
| 25. | 45213 | 57.1% | 66.8%(-9.75)#1,038 | 64.8%(-7.75)#28,228 |
| 26. | 45246 | 56.9% | 66.8%(-9.90)#1,039 | 64.8%(-7.90)#28,263 |
| 27. | 45215 | 56.3% | 66.8%(-10.5)#1,045 | 64.8%(-8.47)#28,412 |
| 28. | 45227 | 54.2% | 66.8%(-12.6)#1,066 | 64.8%(-10.6)#28,935 |
| 29. | 45216 | 53.2% | 66.8%(-13.6)#1,075 | 64.8%(-11.6)#29,150 |
| 30. | 45211 | 50.7% | 66.8%(-16.1)#1,097 | 64.8%(-14.1)#29,608 |
| 31. | 45237 | 47.4% | 66.8%(-19.4)#1,119 | 64.8%(-17.4)#30,136 |
| 32. | 45212 | 47.3% | 66.8%(-19.5)#1,122 | 64.8%(-17.5)#30,155 |
| 33. | 45204 | 45.5% | 66.8%(-21.3)#1,126 | 64.8%(-19.3)#30,416 |
| 34. | 45223 | 44.8% | 66.8%(-22.0)#1,131 | 64.8%(-20.0)#30,505 |
| 35. | 45205 | 40.4% | 66.8%(-26.4)#1,146 | 64.8%(-24.4)#30,974 |
| 36. | 45209 | 39.4% | 66.8%(-27.4)#1,151 | 64.8%(-25.4)#31,070 |
| 37. | 45206 | 35.7% | 66.8%(-31.1)#1,158 | 64.8%(-29.1)#31,390 |
| 38. | 45203 | 35.5% | 66.8%(-31.4)#1,159 | 64.8%(-29.3)#31,411 |
| 39. | 45229 | 29.3% | 66.8%(-37.6)#1,174 | 64.8%(-35.6)#31,793 |
| 40. | 45220 | 27.6% | 66.8%(-39.2)#1,177 | 64.8%(-37.2)#31,877 |
| 41. | 45202 | 23.9% | 66.8%(-43.0)#1,182 | 64.8%(-41.0)#32,020 |
| 42. | 45214 | 22.7% | 66.8%(-44.1)#1,184 | 64.8%(-42.1)#32,054 |
| 43. | 45232 | 18.1% | 66.8%(-48.7)#1,187 | 64.8%(-46.7)#32,195 |
| 44. | 45219 | 14.7% | 66.8%(-52.1)#1,190 | 64.8%(-50.1)#32,272 |
| 45. | 45225 | 14.0% | 66.8%(-52.9)#1,191 | 64.8%(-50.9)#32,286 |
1
Common Questions
What are the Top 10 Zip Codes with the Highest Percentage of Owner-Occupied Units in Cincinnati, OH?
Top 10 Zip Codes with the Highest Percentage of Owner-Occupied Units in Cincinnati, OH are:
What zip code has the Highest Percentage of Owner-Occupied Units in Cincinnati, OH?
45252 has the Highest Percentage of Owner-Occupied Units in Cincinnati, OH with 92.4%.
What is the Percentage of Owner-Occupied Units in Cincinnati, OH?
Percentage of Owner-Occupied Units in Cincinnati is 39.3%.
What is the Percentage of Owner-Occupied Units in Ohio?
Percentage of Owner-Occupied Units in Ohio is 66.8%.
What is the Percentage of Owner-Occupied Units in the United States?
Percentage of Owner-Occupied Units in the United States is 64.8%.