Zip Codes with the Lowest Percentage of Renter-Occupied Units in Cincinnati, OH
RELATED REPORTS & OPTIONS
Lowest Renter-Occupied
Cincinnati
Compare Zip Codes
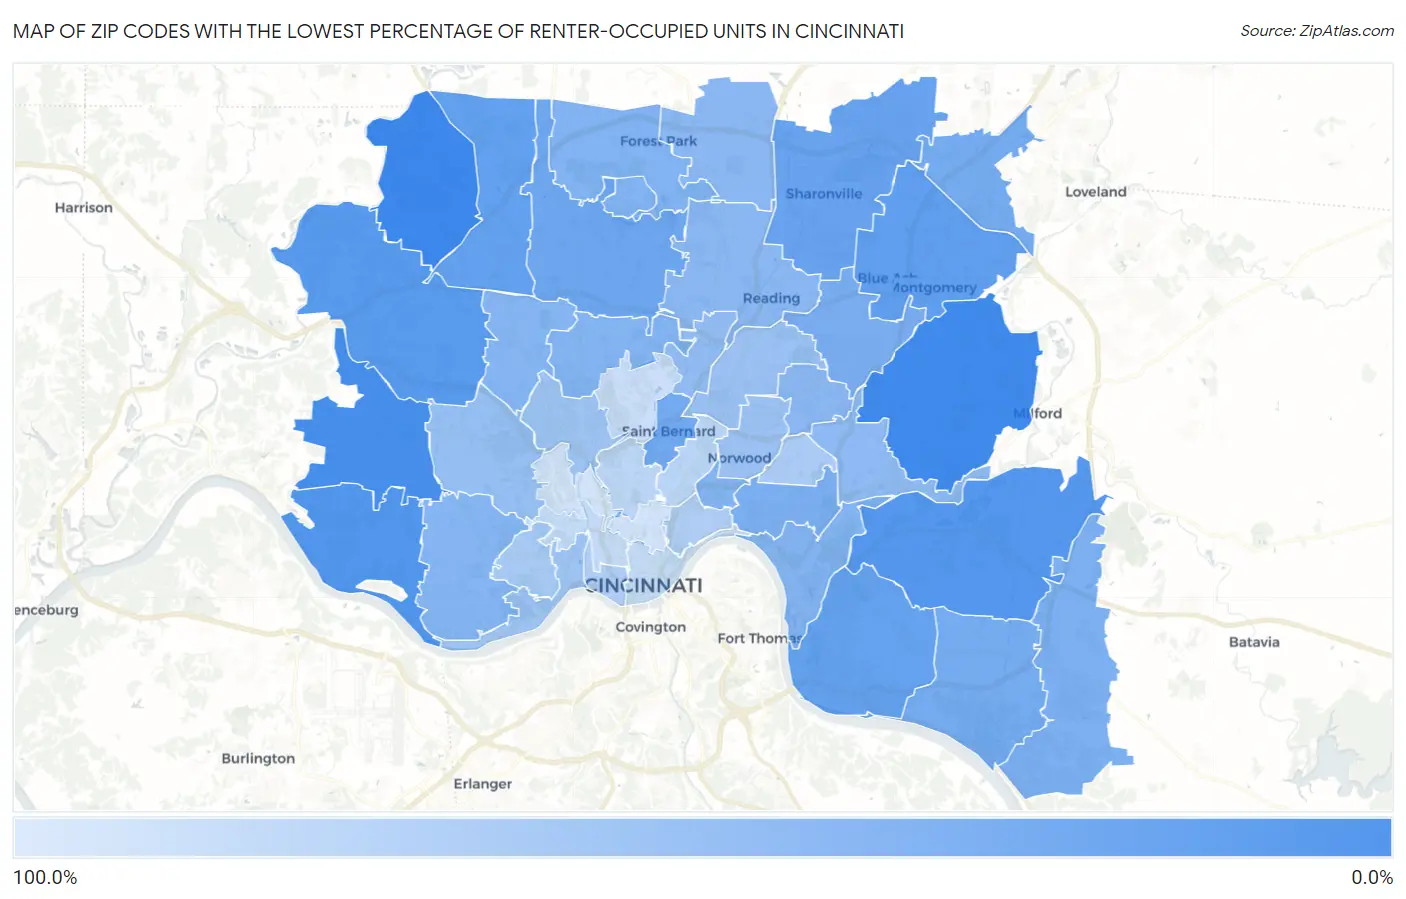
Map of Zip Codes with the Lowest Percentage of Renter-Occupied Units in Cincinnati
100.0%
0.0%
Zip Codes with the Lowest Percentage of Renter-Occupied Units in Cincinnati, OH
| Zip Code | % Renter-Occupied | vs State | vs National | |
| 1. | 45252 | 7.6% | 33.2%(-25.5)#76 | 35.2%(-27.5)#2,286 |
| 2. | 45243 | 9.4% | 33.2%(-23.7)#113 | 35.2%(-25.8)#3,379 |
| 3. | 45248 | 12.6% | 33.2%(-20.5)#194 | 35.2%(-22.5)#5,856 |
| 4. | 45233 | 17.6% | 33.2%(-15.6)#374 | 35.2%(-17.6)#10,509 |
| 5. | 45244 | 18.4% | 33.2%(-14.8)#403 | 35.2%(-16.8)#11,322 |
| 6. | 45247 | 20.1% | 33.2%(-13.1)#475 | 35.2%(-15.1)#13,016 |
| 7. | 45242 | 22.6% | 33.2%(-10.5)#570 | 35.2%(-12.5)#15,341 |
| 8. | 45251 | 23.9% | 33.2%(-9.30)#619 | 35.2%(-11.3)#16,487 |
| 9. | 45230 | 25.1% | 33.2%(-8.07)#667 | 35.2%(-10.1)#17,573 |
| 10. | 45241 | 26.5% | 33.2%(-6.70)#704 | 35.2%(-8.71)#18,621 |
| 11. | 45231 | 29.4% | 33.2%(-3.81)#785 | 35.2%(-5.82)#20,632 |
| 12. | 45217 | 31.9% | 33.2%(-1.23)#855 | 35.2%(-3.24)#22,215 |
| 13. | 45249 | 32.9% | 33.2%(-0.322)#869 | 35.2%(-2.33)#22,701 |
| 14. | 45255 | 32.9% | 33.2%(-0.291)#870 | 35.2%(-2.30)#22,720 |
| 15. | 45236 | 35.7% | 33.2%(+2.48)#906 | 35.2%(+0.474)#24,058 |
| 16. | 45208 | 36.4% | 33.2%(+3.22)#913 | 35.2%(+1.22)#24,346 |
| 17. | 45245 | 37.3% | 33.2%(+4.08)#930 | 35.2%(+2.08)#24,740 |
| 18. | 45218 | 38.3% | 33.2%(+5.11)#946 | 35.2%(+3.10)#25,111 |
| 19. | 45240 | 39.1% | 33.2%(+5.94)#961 | 35.2%(+3.94)#25,421 |
| 20. | 45226 | 39.2% | 33.2%(+5.98)#962 | 35.2%(+3.98)#25,435 |
| 21. | 45224 | 39.3% | 33.2%(+6.16)#964 | 35.2%(+4.15)#25,495 |
| 22. | 45207 | 39.9% | 33.2%(+6.70)#968 | 35.2%(+4.70)#25,660 |
| 23. | 45239 | 40.8% | 33.2%(+7.61)#975 | 35.2%(+5.60)#25,927 |
| 24. | 45238 | 41.5% | 33.2%(+8.29)#985 | 35.2%(+6.29)#26,133 |
| 25. | 45213 | 42.9% | 33.2%(+9.75)#992 | 35.2%(+7.75)#26,511 |
| 26. | 45246 | 43.1% | 33.2%(+9.90)#993 | 35.2%(+7.90)#26,546 |
| 27. | 45215 | 43.7% | 33.2%(+10.5)#999 | 35.2%(+8.47)#26,695 |
| 28. | 45227 | 45.8% | 33.2%(+12.6)#1,020 | 35.2%(+10.6)#27,218 |
| 29. | 45216 | 46.8% | 33.2%(+13.6)#1,029 | 35.2%(+11.6)#27,433 |
| 30. | 45211 | 49.3% | 33.2%(+16.1)#1,051 | 35.2%(+14.1)#27,891 |
| 31. | 45237 | 52.6% | 33.2%(+19.4)#1,073 | 35.2%(+17.4)#28,419 |
| 32. | 45212 | 52.7% | 33.2%(+19.5)#1,076 | 35.2%(+17.5)#28,438 |
| 33. | 45204 | 54.5% | 33.2%(+21.3)#1,080 | 35.2%(+19.3)#28,699 |
| 34. | 45223 | 55.2% | 33.2%(+22.0)#1,085 | 35.2%(+20.0)#28,788 |
| 35. | 45205 | 59.6% | 33.2%(+26.4)#1,100 | 35.2%(+24.4)#29,257 |
| 36. | 45209 | 60.6% | 33.2%(+27.4)#1,105 | 35.2%(+25.4)#29,353 |
| 37. | 45206 | 64.3% | 33.2%(+31.1)#1,112 | 35.2%(+29.1)#29,673 |
| 38. | 45203 | 64.5% | 33.2%(+31.4)#1,113 | 35.2%(+29.3)#29,694 |
| 39. | 45229 | 70.7% | 33.2%(+37.6)#1,128 | 35.2%(+35.6)#30,076 |
| 40. | 45220 | 72.4% | 33.2%(+39.2)#1,131 | 35.2%(+37.2)#30,160 |
| 41. | 45202 | 76.1% | 33.2%(+43.0)#1,136 | 35.2%(+41.0)#30,303 |
| 42. | 45214 | 77.3% | 33.2%(+44.1)#1,138 | 35.2%(+42.1)#30,337 |
| 43. | 45232 | 81.9% | 33.2%(+48.7)#1,141 | 35.2%(+46.7)#30,478 |
| 44. | 45219 | 85.3% | 33.2%(+52.1)#1,144 | 35.2%(+50.1)#30,555 |
| 45. | 45225 | 86.0% | 33.2%(+52.9)#1,145 | 35.2%(+50.9)#30,569 |
1
Common Questions
What are the Top 10 Zip Codes with the Lowest Percentage of Renter-Occupied Units in Cincinnati, OH?
Top 10 Zip Codes with the Lowest Percentage of Renter-Occupied Units in Cincinnati, OH are:
What zip code has the Lowest Percentage of Renter-Occupied Units in Cincinnati, OH?
45252 has the Lowest Percentage of Renter-Occupied Units in Cincinnati, OH with 7.6%.
What is the Percentage of Renter-Occupied Units in Cincinnati, OH?
Percentage of Renter-Occupied Units in Cincinnati is 60.7%.
What is the Percentage of Renter-Occupied Units in Ohio?
Percentage of Renter-Occupied Units in Ohio is 33.2%.
What is the Percentage of Renter-Occupied Units in the United States?
Percentage of Renter-Occupied Units in the United States is 35.2%.