Zip Codes with the Highest Percentage of Population Employed in Life, Physical & Social Science in Cincinnati, OH
RELATED REPORTS & OPTIONS
Life, Physical & Social Science
Cincinnati
Compare Zip Codes
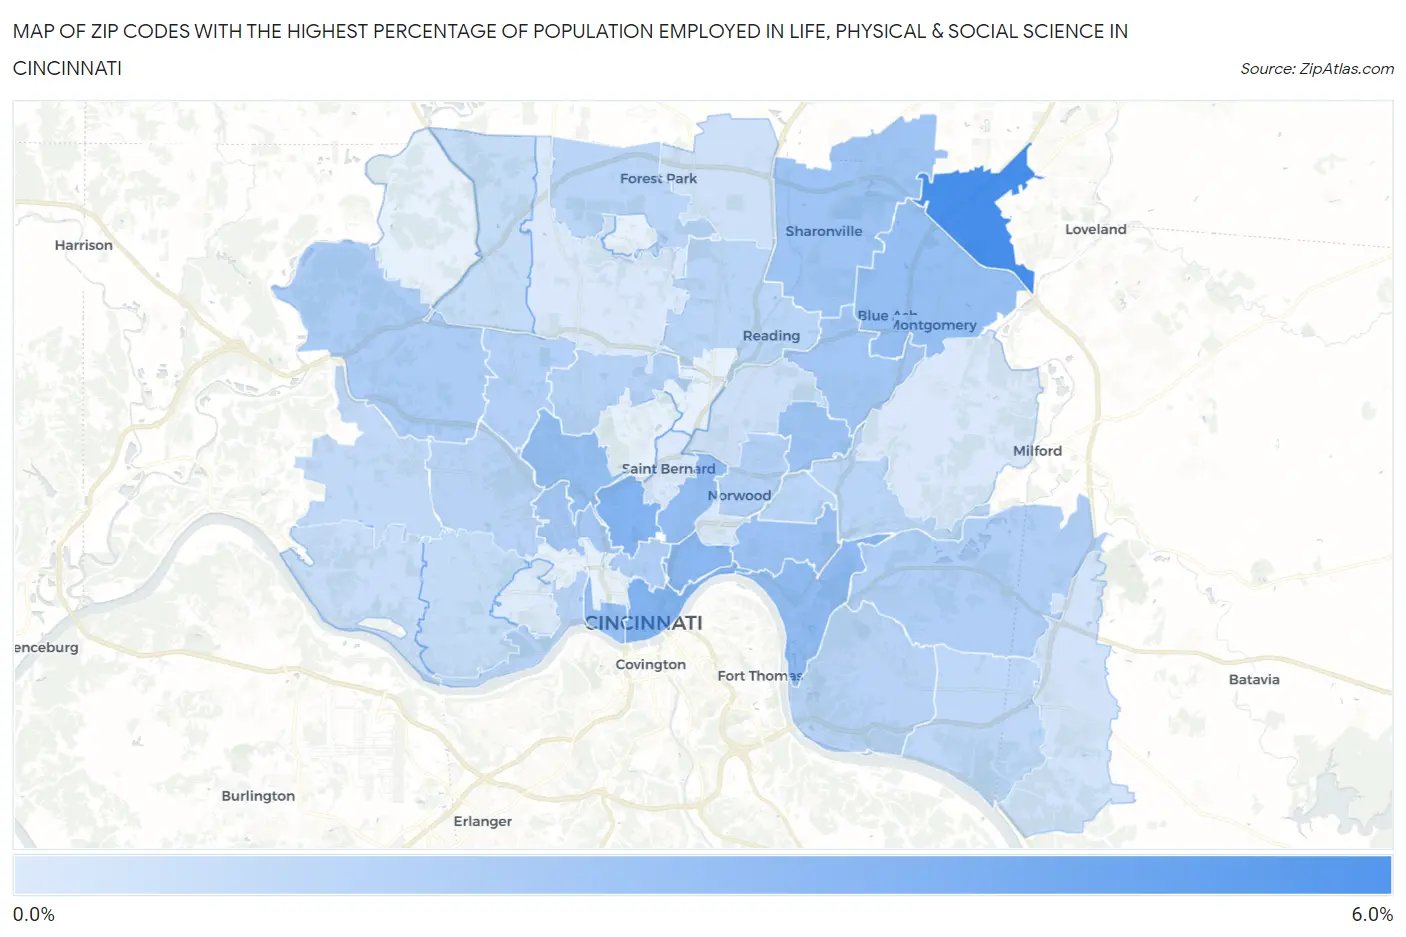
Map of Zip Codes with the Highest Percentage of Population Employed in Life, Physical & Social Science in Cincinnati
0.0%
6.0%
Zip Codes with the Highest Percentage of Population Employed in Life, Physical & Social Science in Cincinnati, OH
| Zip Code | % Employed | vs State | vs National | |
| 1. | 45249 | 5.1% | 0.90%(+4.24)#18 | 1.1%(+4.05)#722 |
| 2. | 45202 | 3.1% | 0.90%(+2.18)#44 | 1.1%(+1.99)#1,783 |
| 3. | 45220 | 3.0% | 0.90%(+2.11)#46 | 1.1%(+1.92)#1,867 |
| 4. | 45206 | 2.9% | 0.90%(+1.98)#48 | 1.1%(+1.79)#2,014 |
| 5. | 45226 | 2.6% | 0.90%(+1.71)#62 | 1.1%(+1.52)#2,371 |
| 6. | 45229 | 2.5% | 0.90%(+1.60)#66 | 1.1%(+1.41)#2,569 |
| 7. | 45223 | 2.5% | 0.90%(+1.58)#68 | 1.1%(+1.39)#2,608 |
| 8. | 45242 | 2.5% | 0.90%(+1.58)#69 | 1.1%(+1.38)#2,612 |
| 9. | 45203 | 2.5% | 0.90%(+1.56)#70 | 1.1%(+1.37)#2,644 |
| 10. | 45208 | 2.2% | 0.90%(+1.33)#85 | 1.1%(+1.14)#3,116 |
| 11. | 45213 | 2.1% | 0.90%(+1.25)#94 | 1.1%(+1.05)#3,316 |
| 12. | 45241 | 2.1% | 0.90%(+1.23)#95 | 1.1%(+1.04)#3,345 |
| 13. | 45236 | 2.0% | 0.90%(+1.08)#102 | 1.1%(+0.883)#3,762 |
| 14. | 45225 | 1.9% | 0.90%(+1.04)#106 | 1.1%(+0.849)#3,856 |
| 15. | 45247 | 1.7% | 0.90%(+0.802)#133 | 1.1%(+0.608)#4,731 |
| 16. | 45219 | 1.6% | 0.90%(+0.713)#140 | 1.1%(+0.519)#5,109 |
| 17. | 45244 | 1.5% | 0.90%(+0.637)#150 | 1.1%(+0.444)#5,474 |
| 18. | 45239 | 1.4% | 0.90%(+0.538)#159 | 1.1%(+0.345)#5,989 |
| 19. | 45212 | 1.4% | 0.90%(+0.529)#163 | 1.1%(+0.336)#6,045 |
| 20. | 45224 | 1.4% | 0.90%(+0.519)#166 | 1.1%(+0.326)#6,101 |
| 21. | 45211 | 1.3% | 0.90%(+0.436)#178 | 1.1%(+0.242)#6,572 |
| 22. | 45204 | 1.3% | 0.90%(+0.392)#187 | 1.1%(+0.199)#6,867 |
| 23. | 45230 | 1.3% | 0.90%(+0.386)#190 | 1.1%(+0.193)#6,908 |
| 24. | 45227 | 1.3% | 0.90%(+0.361)#193 | 1.1%(+0.168)#7,075 |
| 25. | 45240 | 1.2% | 0.90%(+0.345)#196 | 1.1%(+0.151)#7,191 |
| 26. | 45215 | 1.2% | 0.90%(+0.332)#200 | 1.1%(+0.139)#7,265 |
| 27. | 45209 | 1.2% | 0.90%(+0.330)#202 | 1.1%(+0.137)#7,282 |
| 28. | 45255 | 1.0% | 0.90%(+0.142)#245 | 1.1%(-0.052)#8,711 |
| 29. | 45248 | 0.99% | 0.90%(+0.088)#270 | 1.1%(-0.105)#9,170 |
| 30. | 45251 | 0.87% | 0.90%(-0.031)#309 | 1.1%(-0.224)#10,297 |
| 31. | 45238 | 0.83% | 0.90%(-0.070)#325 | 1.1%(-0.263)#10,710 |
| 32. | 45233 | 0.76% | 0.90%(-0.137)#350 | 1.1%(-0.331)#11,393 |
| 33. | 45237 | 0.65% | 0.90%(-0.251)#386 | 1.1%(-0.445)#12,696 |
| 34. | 45246 | 0.55% | 0.90%(-0.343)#434 | 1.1%(-0.536)#13,835 |
| 35. | 45245 | 0.46% | 0.90%(-0.441)#479 | 1.1%(-0.634)#15,061 |
| 36. | 45207 | 0.20% | 0.90%(-0.696)#620 | 1.1%(-0.889)#18,177 |
| 37. | 45243 | 0.19% | 0.90%(-0.708)#630 | 1.1%(-0.902)#18,315 |
| 38. | 45231 | 0.18% | 0.90%(-0.713)#633 | 1.1%(-0.907)#18,364 |
| 39. | 45217 | 0.18% | 0.90%(-0.718)#637 | 1.1%(-0.911)#18,409 |
| 40. | 45205 | 0.083% | 0.90%(-0.815)#671 | 1.1%(-1.01)#19,183 |
1
Common Questions
What are the Top 10 Zip Codes with the Highest Percentage of Population Employed in Life, Physical & Social Science in Cincinnati, OH?
Top 10 Zip Codes with the Highest Percentage of Population Employed in Life, Physical & Social Science in Cincinnati, OH are:
What zip code has the Highest Percentage of Population Employed in Life, Physical & Social Science in Cincinnati, OH?
45249 has the Highest Percentage of Population Employed in Life, Physical & Social Science in Cincinnati, OH with 5.1%.
What is the Percentage of Population Employed in Life, Physical & Social Science in Cincinnati, OH?
Percentage of Population Employed in Life, Physical & Social Science in Cincinnati is 1.7%.
What is the Percentage of Population Employed in Life, Physical & Social Science in Ohio?
Percentage of Population Employed in Life, Physical & Social Science in Ohio is 0.90%.
What is the Percentage of Population Employed in Life, Physical & Social Science in the United States?
Percentage of Population Employed in Life, Physical & Social Science in the United States is 1.1%.