Basin, MT
Basin Map
Basin Overview
364
TOTAL POPULATION
230
MALE POPULATION
134
FEMALE POPULATION
171.64
MALES / 100 FEMALES
58.26
FEMALES / 100 MALES
54.8
MEDIAN AGE
2.9
AVG FAMILY SIZE
2.2
AVG HOUSEHOLD SIZE
$42,073
PER CAPITA INCOME
$49,250
AVG HOUSEHOLD INCOME
0.47
INEQUALITY / GINI INDEX
190
LABOR FORCE [ PEOPLE ]
57.6%
PERCENT IN LABOR FORCE
Basin Zip Codes
Basin Area Codes
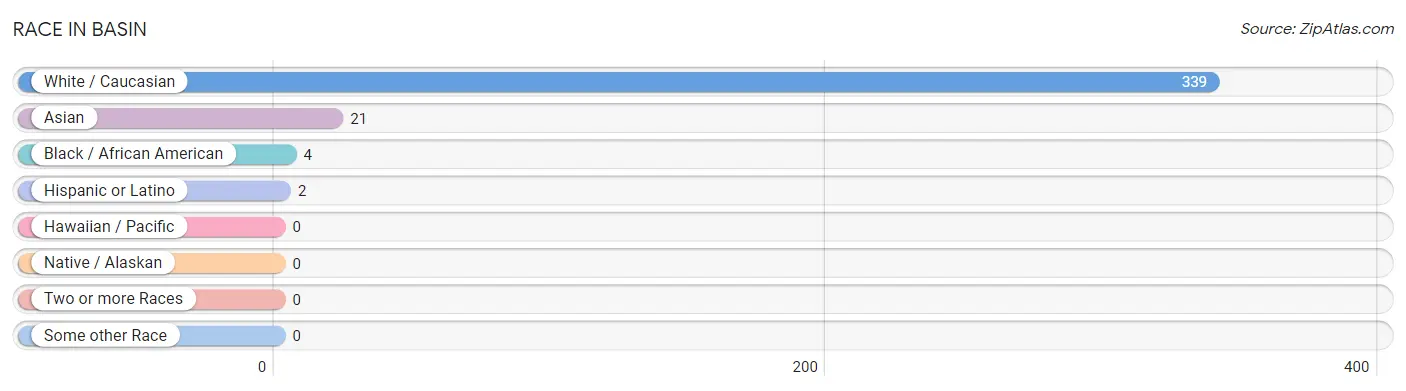
Race in Basin
The most populous races in Basin are White / Caucasian (339 | 93.1%), Asian (21 | 5.8%), and Black / African American (4 | 1.1%).
| Race | # Population | % Population |
| Asian | 21 | 5.8% |
| Black / African American | 4 | 1.1% |
| Hawaiian / Pacific | 0 | 0.0% |
| Hispanic or Latino | 2 | 0.5% |
| Native / Alaskan | 0 | 0.0% |
| White / Caucasian | 339 | 93.1% |
| Two or more Races | 0 | 0.0% |
| Some other Race | 0 | 0.0% |
| Total | 364 | 100.0% |
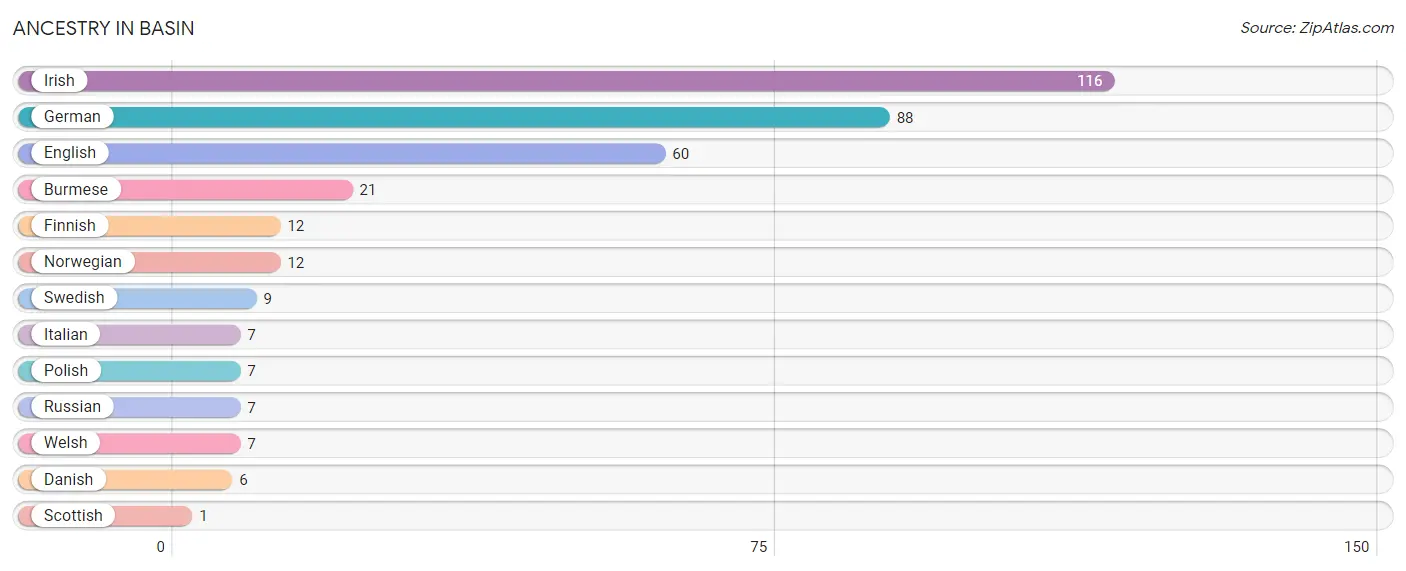
Ancestry in Basin
The most populous ancestries reported in Basin are Irish (116 | 31.9%), German (88 | 24.2%), English (60 | 16.5%), Burmese (21 | 5.8%), and Finnish (12 | 3.3%), together accounting for 81.6% of all Basin residents.
| Ancestry | # Population | % Population |
| Burmese | 21 | 5.8% |
| Danish | 6 | 1.7% |
| English | 60 | 16.5% |
| Finnish | 12 | 3.3% |
| German | 88 | 24.2% |
| Irish | 116 | 31.9% |
| Italian | 7 | 1.9% |
| Norwegian | 12 | 3.3% |
| Polish | 7 | 1.9% |
| Russian | 7 | 1.9% |
| Scottish | 1 | 0.3% |
| Swedish | 9 | 2.5% |
| Welsh | 7 | 1.9% | View All 13 Rows |
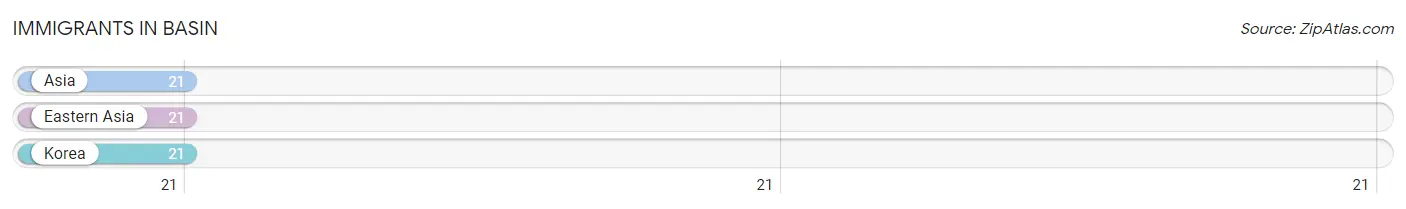
Immigrants in Basin
The most numerous immigrant groups reported in Basin came from Asia (21 | 5.8%), Eastern Asia (21 | 5.8%), and Korea (21 | 5.8%), together accounting for 17.3% of all Basin residents.
| Immigration Origin | # Population | % Population |
| Asia | 21 | 5.8% |
| Eastern Asia | 21 | 5.8% |
| Korea | 21 | 5.8% | View All 3 Rows |
Sex and Age in Basin
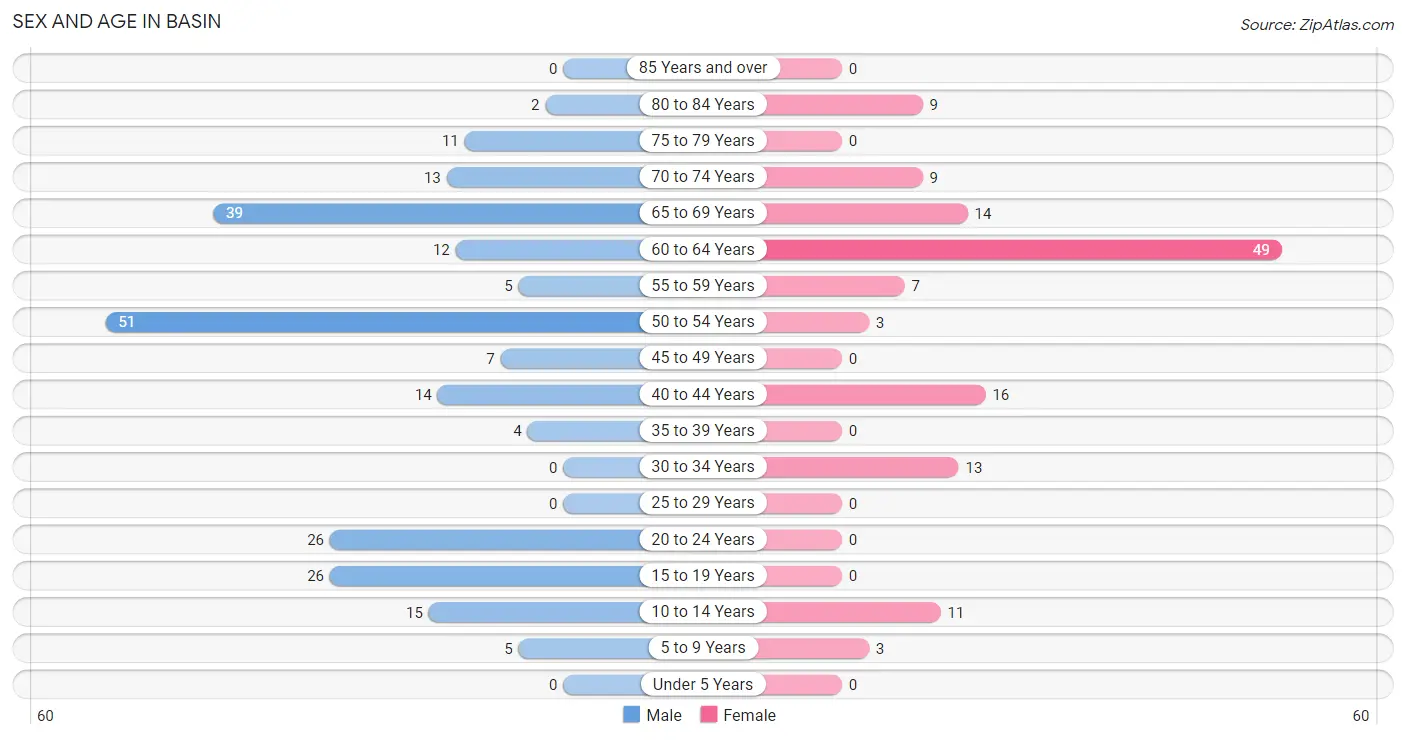
Sex and Age in Basin
The most populous age groups in Basin are 50 to 54 Years (51 | 22.2%) for men and 60 to 64 Years (49 | 36.6%) for women.
| Age Bracket | Male | Female |
| Under 5 Years | 0 (0.0%) | 0 (0.0%) |
| 5 to 9 Years | 5 (2.2%) | 3 (2.2%) |
| 10 to 14 Years | 15 (6.5%) | 11 (8.2%) |
| 15 to 19 Years | 26 (11.3%) | 0 (0.0%) |
| 20 to 24 Years | 26 (11.3%) | 0 (0.0%) |
| 25 to 29 Years | 0 (0.0%) | 0 (0.0%) |
| 30 to 34 Years | 0 (0.0%) | 13 (9.7%) |
| 35 to 39 Years | 4 (1.7%) | 0 (0.0%) |
| 40 to 44 Years | 14 (6.1%) | 16 (11.9%) |
| 45 to 49 Years | 7 (3.0%) | 0 (0.0%) |
| 50 to 54 Years | 51 (22.2%) | 3 (2.2%) |
| 55 to 59 Years | 5 (2.2%) | 7 (5.2%) |
| 60 to 64 Years | 12 (5.2%) | 49 (36.6%) |
| 65 to 69 Years | 39 (17.0%) | 14 (10.4%) |
| 70 to 74 Years | 13 (5.7%) | 9 (6.7%) |
| 75 to 79 Years | 11 (4.8%) | 0 (0.0%) |
| 80 to 84 Years | 2 (0.9%) | 9 (6.7%) |
| 85 Years and over | 0 (0.0%) | 0 (0.0%) |
| Total | 230 (100.0%) | 134 (100.0%) |
Families and Households in Basin
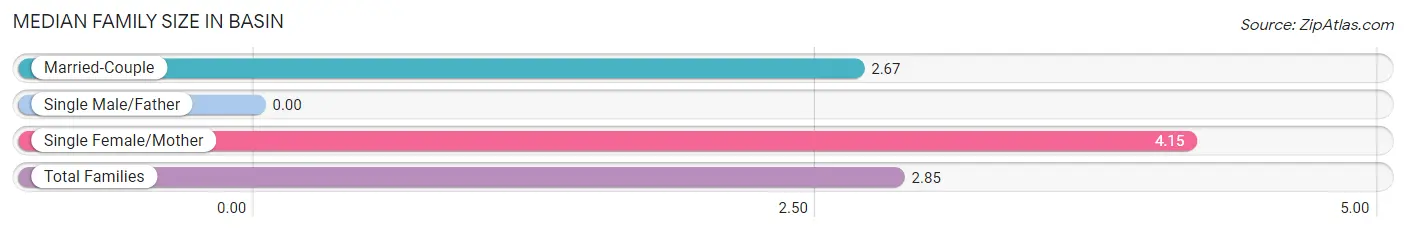
Median Family Size in Basin
| Family Type | # Families | Family Size |
| Married-Couple | 95 (88.0%) | 2.67 |
| Single Male/Father | 0 (0.0%) | - |
| Single Female/Mother | 13 (12.0%) | 4.15 |
| Total Families | 108 (100.0%) | 2.85 |
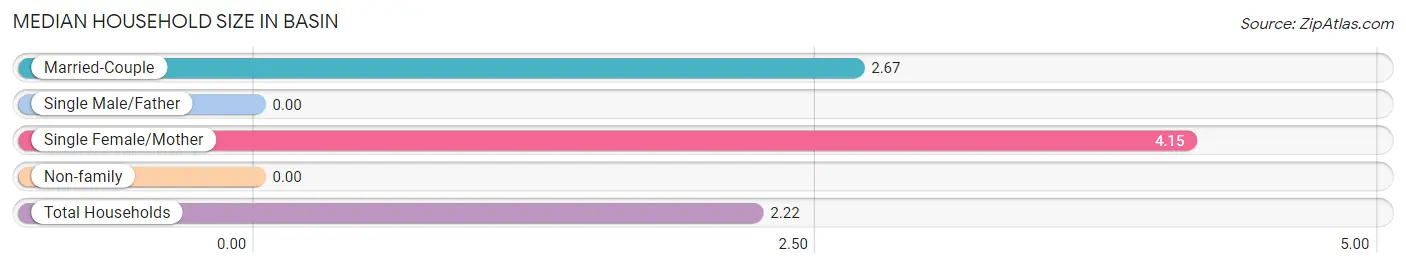
Median Household Size in Basin
| Household Type | # Households | Household Size |
| Married-Couple | 95 (57.9%) | 2.67 |
| Single Male/Father | 0 (0.0%) | - |
| Single Female/Mother | 13 (7.9%) | 4.15 |
| Non-family | 56 (34.2%) | - |
| Total Households | 164 (100.0%) | 2.22 |
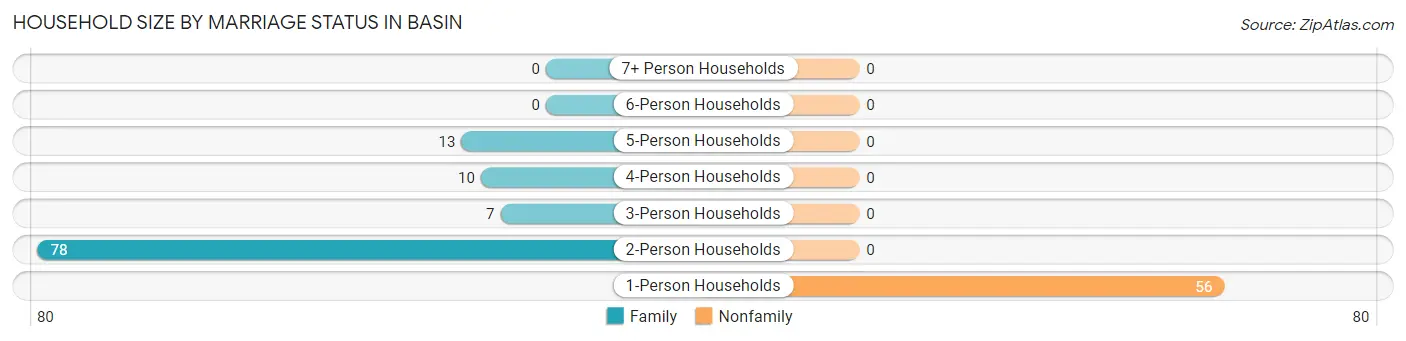
Household Size by Marriage Status in Basin
Out of a total of 164 households in Basin, 108 (65.8%) are family households, while 56 (34.2%) are nonfamily households. The most numerous type of family households are 2-person households, comprising 78, and the most common type of nonfamily households are 1-person households, comprising 56.
| Household Size | Family Households | Nonfamily Households |
| 1-Person Households | - | 56 (34.2%) |
| 2-Person Households | 78 (47.6%) | 0 (0.0%) |
| 3-Person Households | 7 (4.3%) | 0 (0.0%) |
| 4-Person Households | 10 (6.1%) | 0 (0.0%) |
| 5-Person Households | 13 (7.9%) | 0 (0.0%) |
| 6-Person Households | 0 (0.0%) | 0 (0.0%) |
| 7+ Person Households | 0 (0.0%) | 0 (0.0%) |
| Total | 108 (65.8%) | 56 (34.2%) |
Female Fertility in Basin
Fertility by Age in Basin
| Age Bracket | Women with Births | Births / 1,000 Women |
| 15 to 19 years | 0 (0.0%) | 0.0 |
| 20 to 34 years | 0 (0.0%) | 0.0 |
| 35 to 50 years | 0 (0.0%) | 0.0 |
| Total | 0 (0.0%) | 0.0 |
Fertility by Age by Marriage Status in Basin
| Age Bracket | Married | Unmarried |
| 15 to 19 years | 0 (0.0%) | 0 (0.0%) |
| 20 to 34 years | 0 (0.0%) | 0 (0.0%) |
| 35 to 50 years | 0 (0.0%) | 0 (0.0%) |
| Total | 0 (0.0%) | 0 (0.0%) |
Fertility by Education in Basin
| Educational Attainment | Women with Births | Births / 1,000 Women |
| Less than High School | 0 (0.0%) | 0.0 |
| High School Diploma | 0 (0.0%) | 0.0 |
| College or Associate's Degree | 0 (0.0%) | 0.0 |
| Bachelor's Degree | 0 (0.0%) | 0.0 |
| Graduate Degree | 0 (0.0%) | 0.0 |
| Total | 0 (0.0%) | 0.0 |
Fertility by Education by Marriage Status in Basin
| Educational Attainment | Married | Unmarried |
| Less than High School | 0 (0.0%) | 0 (0.0%) |
| High School Diploma | 0 (0.0%) | 0 (0.0%) |
| College or Associate's Degree | 0 (0.0%) | 0 (0.0%) |
| Bachelor's Degree | 0 (0.0%) | 0 (0.0%) |
| Graduate Degree | 0 (0.0%) | 0 (0.0%) |
| Total | 0 (0.0%) | 0 (0.0%) |
Income in Basin
Income Overview in Basin
| Characteristic | Number | Measure |
| Per Capita Income | 364 | $42,073 |
| Median Family Income | 108 | $0 |
| Mean Family Income | 108 | $87,474 |
| Median Household Income | 164 | $49,250 |
| Mean Household Income | 164 | $84,271 |
| Income Deficit | 108 | $0 |
| Wage / Income Gap (%) | 364 | 0.00% |
| Wage / Income Gap ($) | 364 | 100.00¢ per $1 |
| Gini / Inequality Index | 364 | 0.47 |
Earnings by Sex in Basin
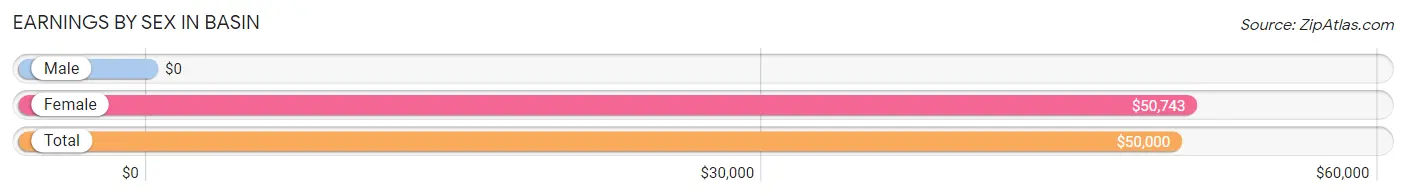
| Sex | Number | Average Earnings |
| Male | 138 (63.9%) | $0 |
| Female | 78 (36.1%) | $50,743 |
| Total | 216 (100.0%) | $50,000 |
Earnings by Sex by Income Bracket in Basin
The most common earnings brackets in Basin are $100,000+ for men (49 | 35.5%) and $50,000 to $54,999 for women (37 | 47.4%).
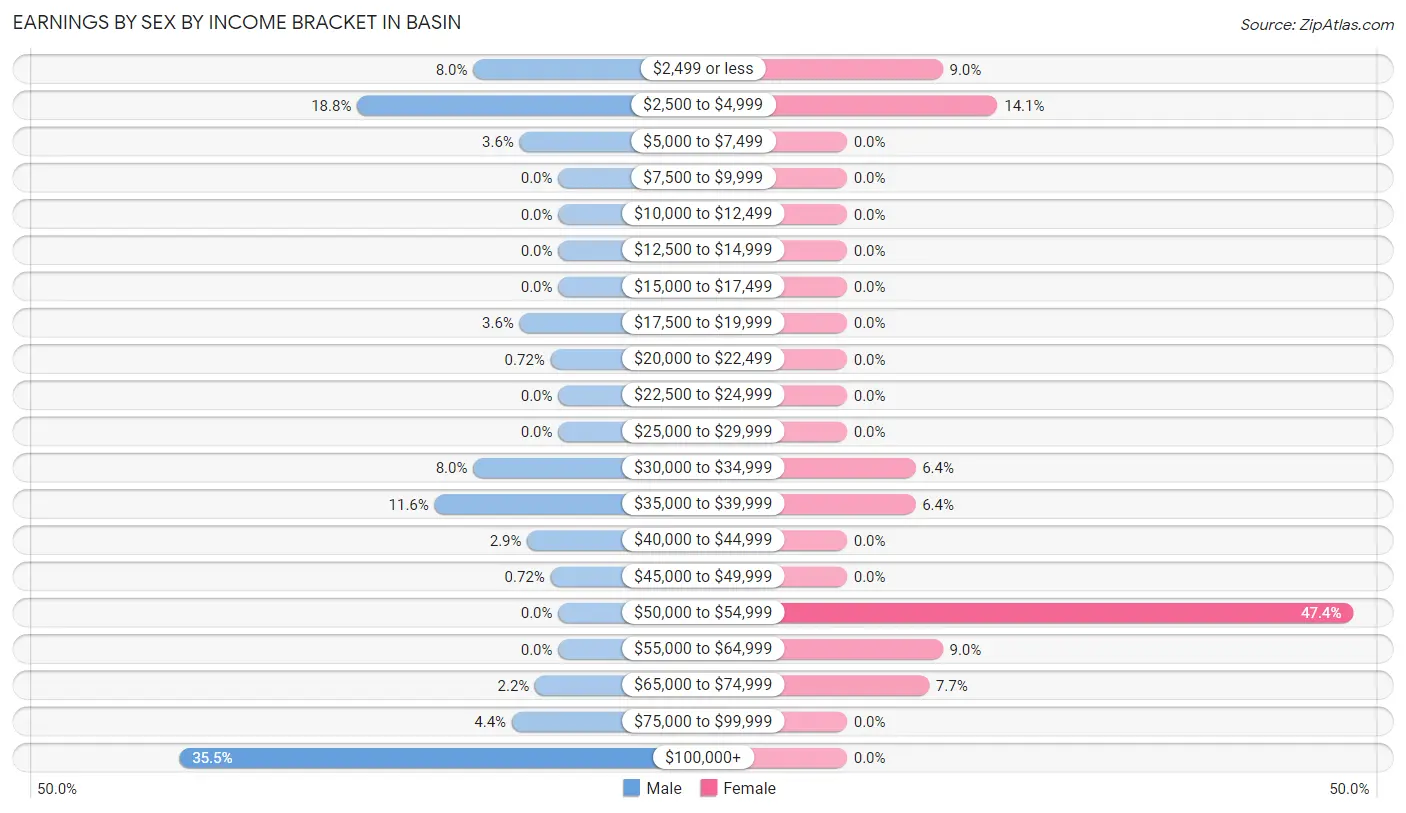
| Income | Male | Female |
| $2,499 or less | 11 (8.0%) | 7 (9.0%) |
| $2,500 to $4,999 | 26 (18.8%) | 11 (14.1%) |
| $5,000 to $7,499 | 5 (3.6%) | 0 (0.0%) |
| $7,500 to $9,999 | 0 (0.0%) | 0 (0.0%) |
| $10,000 to $12,499 | 0 (0.0%) | 0 (0.0%) |
| $12,500 to $14,999 | 0 (0.0%) | 0 (0.0%) |
| $15,000 to $17,499 | 0 (0.0%) | 0 (0.0%) |
| $17,500 to $19,999 | 5 (3.6%) | 0 (0.0%) |
| $20,000 to $22,499 | 1 (0.7%) | 0 (0.0%) |
| $22,500 to $24,999 | 0 (0.0%) | 0 (0.0%) |
| $25,000 to $29,999 | 0 (0.0%) | 0 (0.0%) |
| $30,000 to $34,999 | 11 (8.0%) | 5 (6.4%) |
| $35,000 to $39,999 | 16 (11.6%) | 5 (6.4%) |
| $40,000 to $44,999 | 4 (2.9%) | 0 (0.0%) |
| $45,000 to $49,999 | 1 (0.7%) | 0 (0.0%) |
| $50,000 to $54,999 | 0 (0.0%) | 37 (47.4%) |
| $55,000 to $64,999 | 0 (0.0%) | 7 (9.0%) |
| $65,000 to $74,999 | 3 (2.2%) | 6 (7.7%) |
| $75,000 to $99,999 | 6 (4.3%) | 0 (0.0%) |
| $100,000+ | 49 (35.5%) | 0 (0.0%) |
| Total | 138 (100.0%) | 78 (100.0%) |
Earnings by Sex by Educational Attainment in Basin
Average earnings in Basin are $89,375 for men and $50,743 for women, a difference of 43.2%. Men with an educational attainment of high school diploma enjoy the highest average annual earnings of $103,278, while those with college or associate's degree education earn the least with $39,107. Women with an educational attainment of bachelor's degree earn the most with the average annual earnings of $51,694, while those with college or associate's degree education have the smallest earnings of $36,500.
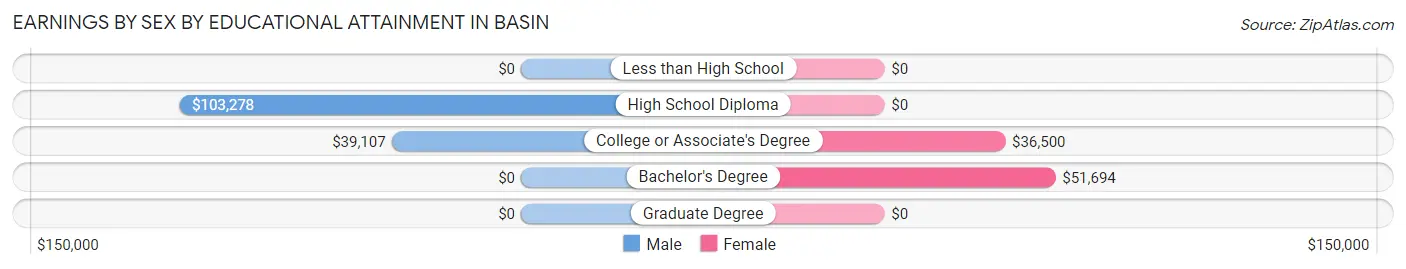
| Educational Attainment | Male Income | Female Income |
| Less than High School | - | - |
| High School Diploma | $103,278 | $0 |
| College or Associate's Degree | $39,107 | $36,500 |
| Bachelor's Degree | - | - |
| Graduate Degree | - | - |
| Total | $89,375 | $50,743 |
Family Income in Basin
Family Income Brackets in Basin
According to the Basin family income data, there are 31 families falling into the $150,000 to $199,999 income range, which is the most common income bracket and makes up 28.7% of all families.
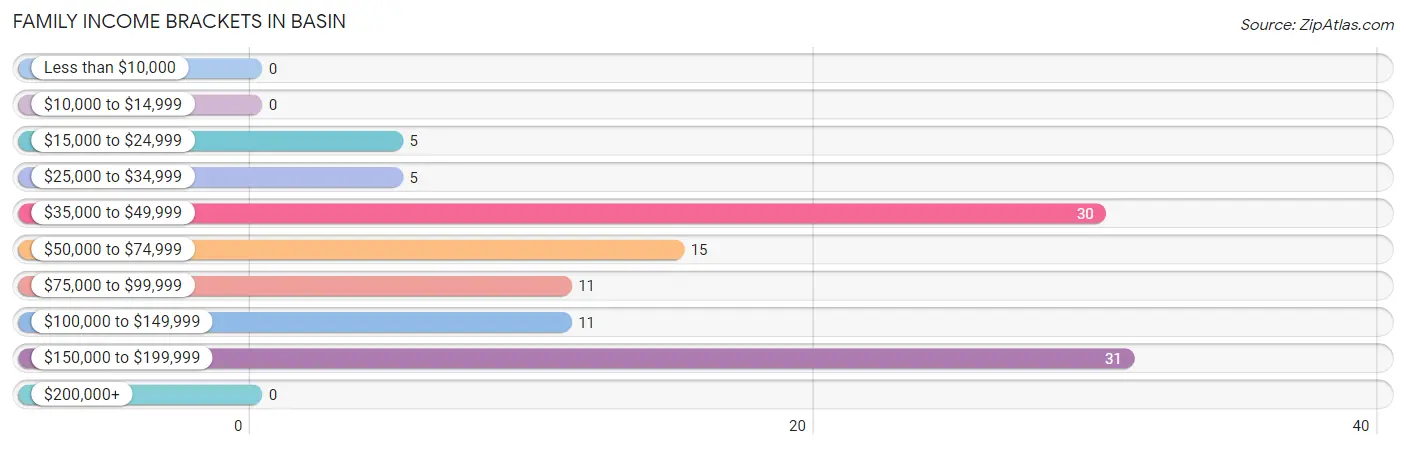
| Income Bracket | # Families | % Families |
| Less than $10,000 | 0 | 0.0% |
| $10,000 to $14,999 | 0 | 0.0% |
| $15,000 to $24,999 | 5 | 4.6% |
| $25,000 to $34,999 | 5 | 4.6% |
| $35,000 to $49,999 | 30 | 27.8% |
| $50,000 to $74,999 | 15 | 13.9% |
| $75,000 to $99,999 | 11 | 10.2% |
| $100,000 to $149,999 | 11 | 10.2% |
| $150,000 to $199,999 | 31 | 28.7% |
| $200,000+ | 0 | 0.0% |
Family Income by Famaliy Size in Basin
2-person families (78 | 72.2%) account for the highest median family income in Basin with $98,333 per family, while 2-person families (78 | 72.2%) have the highest median income of $49,166 per family member.
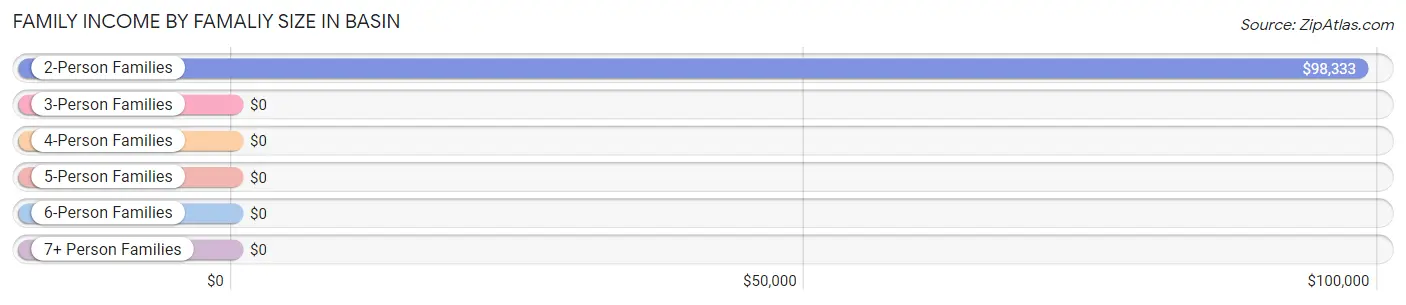
| Income Bracket | # Families | Median Income |
| 2-Person Families | 78 (72.2%) | $98,333 |
| 3-Person Families | 7 (6.5%) | $0 |
| 4-Person Families | 10 (9.3%) | $0 |
| 5-Person Families | 13 (12.0%) | $0 |
| 6-Person Families | 0 (0.0%) | $0 |
| 7+ Person Families | 0 (0.0%) | $0 |
| Total | 108 (100.0%) | $0 |
Family Income by Number of Earners in Basin
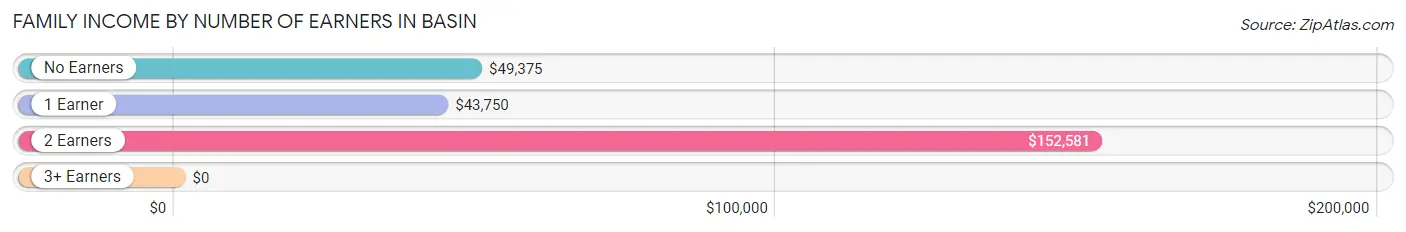
| Number of Earners | # Families | Median Income |
| No Earners | 15 (13.9%) | $49,375 |
| 1 Earner | 28 (25.9%) | $43,750 |
| 2 Earners | 60 (55.6%) | $152,581 |
| 3+ Earners | 5 (4.6%) | $0 |
| Total | 108 (100.0%) | $0 |
Household Income in Basin
Household Income Brackets in Basin
With 42 households falling in the category, the $25,000 to $34,999 income range is the most frequent in Basin, accounting for 25.6% of all households.
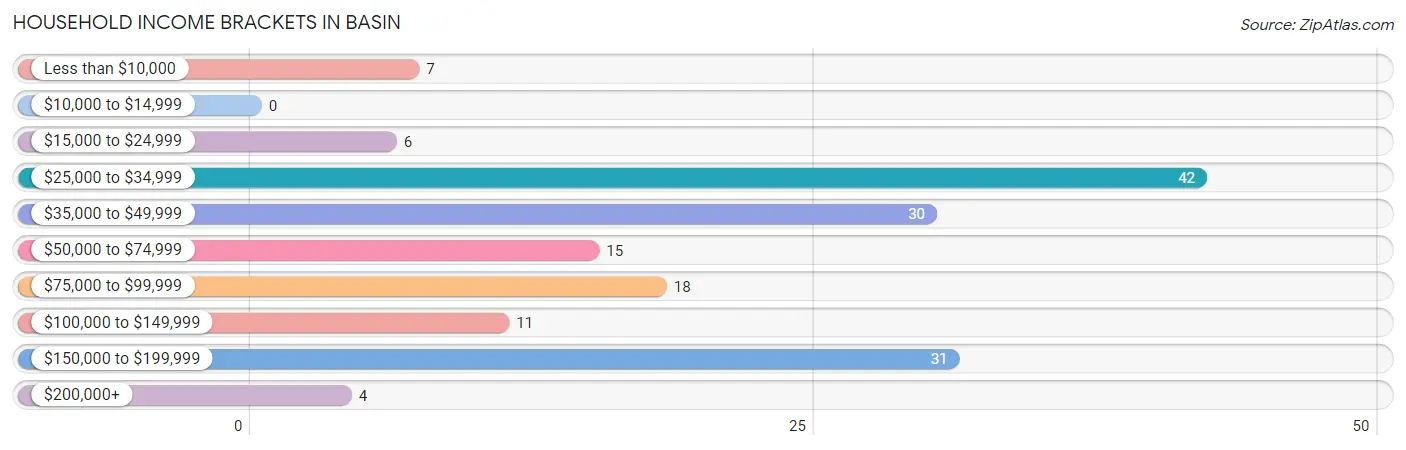
| Income Bracket | # Households | % Households |
| Less than $10,000 | 7 | 4.3% |
| $10,000 to $14,999 | 0 | 0.0% |
| $15,000 to $24,999 | 6 | 3.7% |
| $25,000 to $34,999 | 42 | 25.6% |
| $35,000 to $49,999 | 30 | 18.3% |
| $50,000 to $74,999 | 15 | 9.1% |
| $75,000 to $99,999 | 18 | 11.0% |
| $100,000 to $149,999 | 11 | 6.7% |
| $150,000 to $199,999 | 31 | 18.9% |
| $200,000+ | 4 | 2.4% |
Household Income by Householder Age in Basin
The median household income in Basin is $49,250, with the highest median household income of $152,742 found in the 45 to 64 years age bracket for the primary householder. A total of 64 households (39.0%) fall into this category.
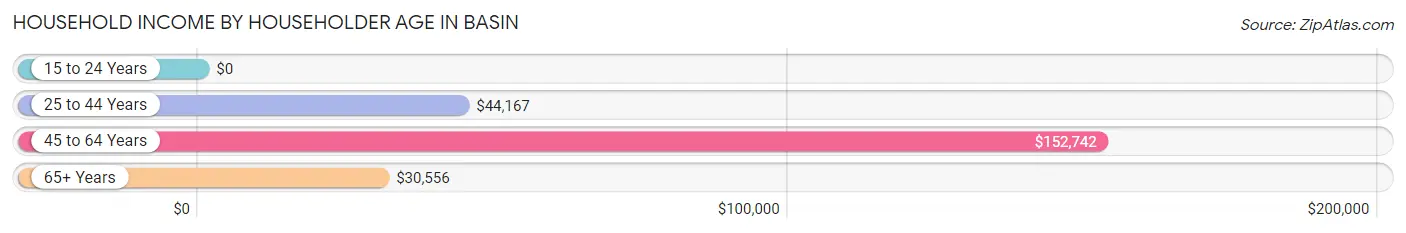
| Income Bracket | # Households | Median Income |
| 15 to 24 Years | 0 (0.0%) | $0 |
| 25 to 44 Years | 30 (18.3%) | $44,167 |
| 45 to 64 Years | 64 (39.0%) | $152,742 |
| 65+ Years | 70 (42.7%) | $30,556 |
| Total | 164 (100.0%) | $49,250 |
Poverty in Basin
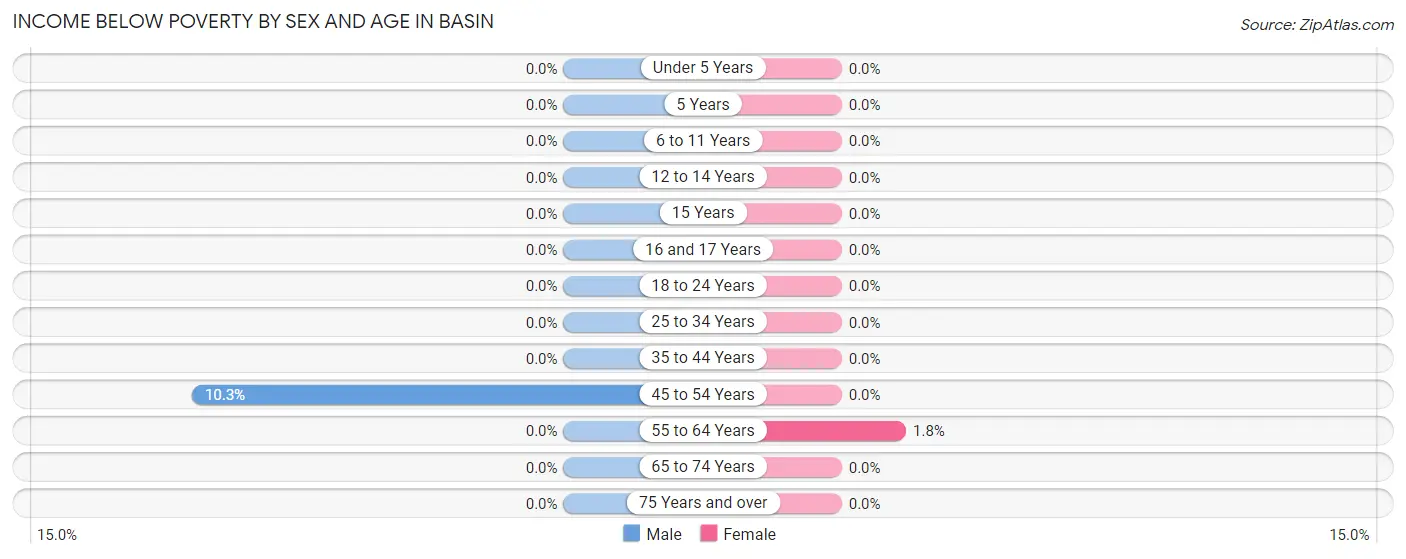
Income Below Poverty by Sex and Age in Basin
With 2.6% poverty level for males and 0.7% for females among the residents of Basin, 45 to 54 year old males and 55 to 64 year old females are the most vulnerable to poverty, with 6 males (10.3%) and 1 females (1.8%) in their respective age groups living below the poverty level.
| Age Bracket | Male | Female |
| Under 5 Years | 0 (0.0%) | 0 (0.0%) |
| 5 Years | 0 (0.0%) | 0 (0.0%) |
| 6 to 11 Years | 0 (0.0%) | 0 (0.0%) |
| 12 to 14 Years | 0 (0.0%) | 0 (0.0%) |
| 15 Years | 0 (0.0%) | 0 (0.0%) |
| 16 and 17 Years | 0 (0.0%) | 0 (0.0%) |
| 18 to 24 Years | 0 (0.0%) | 0 (0.0%) |
| 25 to 34 Years | 0 (0.0%) | 0 (0.0%) |
| 35 to 44 Years | 0 (0.0%) | 0 (0.0%) |
| 45 to 54 Years | 6 (10.3%) | 0 (0.0%) |
| 55 to 64 Years | 0 (0.0%) | 1 (1.8%) |
| 65 to 74 Years | 0 (0.0%) | 0 (0.0%) |
| 75 Years and over | 0 (0.0%) | 0 (0.0%) |
| Total | 6 (2.6%) | 1 (0.7%) |
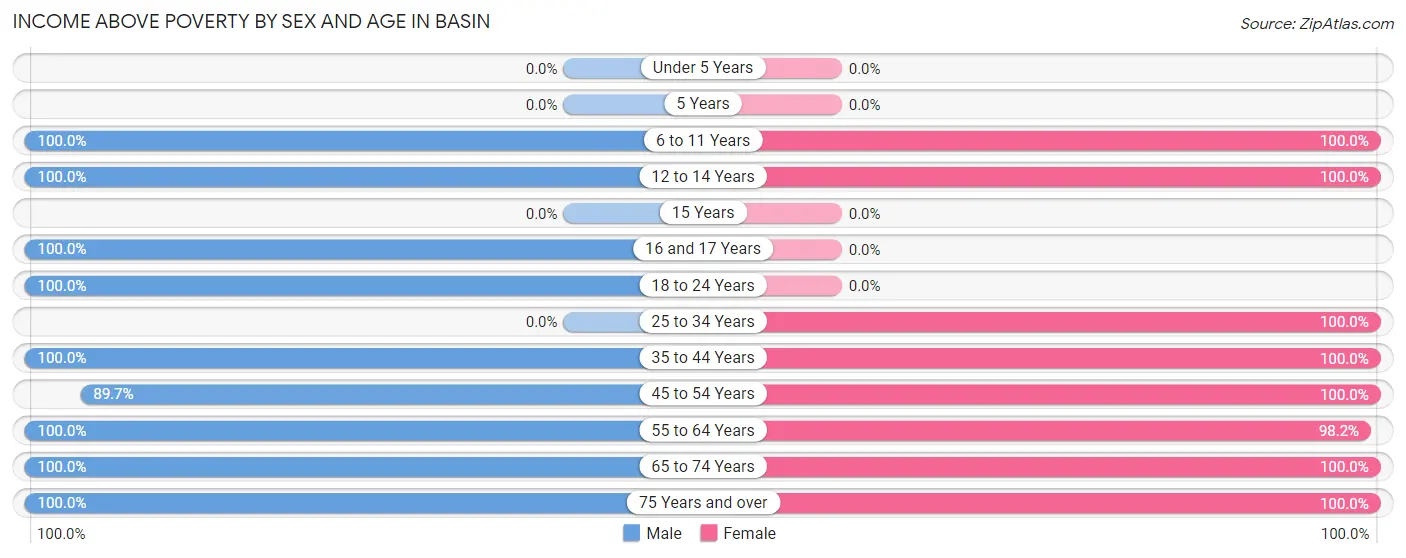
Income Above Poverty by Sex and Age in Basin
According to the poverty statistics in Basin, males aged 6 to 11 years and females aged 6 to 11 years are the age groups that are most secure financially, with 100.0% of males and 100.0% of females in these age groups living above the poverty line.
| Age Bracket | Male | Female |
| Under 5 Years | 0 (0.0%) | 0 (0.0%) |
| 5 Years | 0 (0.0%) | 0 (0.0%) |
| 6 to 11 Years | 15 (100.0%) | 3 (100.0%) |
| 12 to 14 Years | 5 (100.0%) | 11 (100.0%) |
| 15 Years | 0 (0.0%) | 0 (0.0%) |
| 16 and 17 Years | 11 (100.0%) | 0 (0.0%) |
| 18 to 24 Years | 41 (100.0%) | 0 (0.0%) |
| 25 to 34 Years | 0 (0.0%) | 13 (100.0%) |
| 35 to 44 Years | 18 (100.0%) | 16 (100.0%) |
| 45 to 54 Years | 52 (89.7%) | 3 (100.0%) |
| 55 to 64 Years | 17 (100.0%) | 55 (98.2%) |
| 65 to 74 Years | 52 (100.0%) | 23 (100.0%) |
| 75 Years and over | 13 (100.0%) | 9 (100.0%) |
| Total | 224 (97.4%) | 133 (99.3%) |
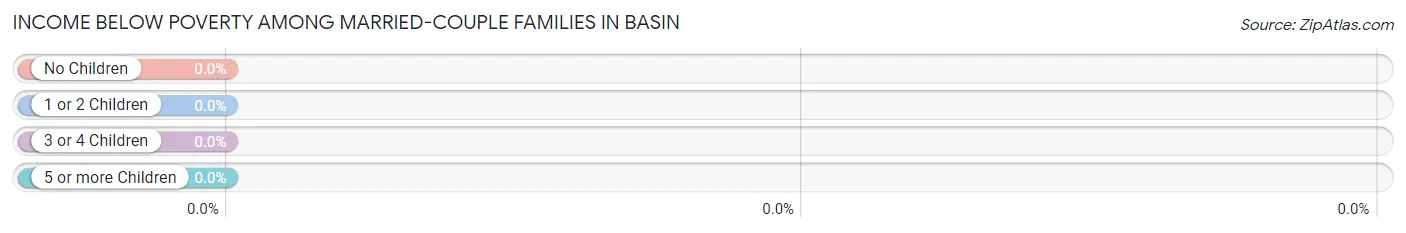
Income Below Poverty Among Married-Couple Families in Basin
| Children | Above Poverty | Below Poverty |
| No Children | 85 (100.0%) | 0 (0.0%) |
| 1 or 2 Children | 10 (100.0%) | 0 (0.0%) |
| 3 or 4 Children | 0 (0.0%) | 0 (0.0%) |
| 5 or more Children | 0 (0.0%) | 0 (0.0%) |
| Total | 95 (100.0%) | 0 (0.0%) |
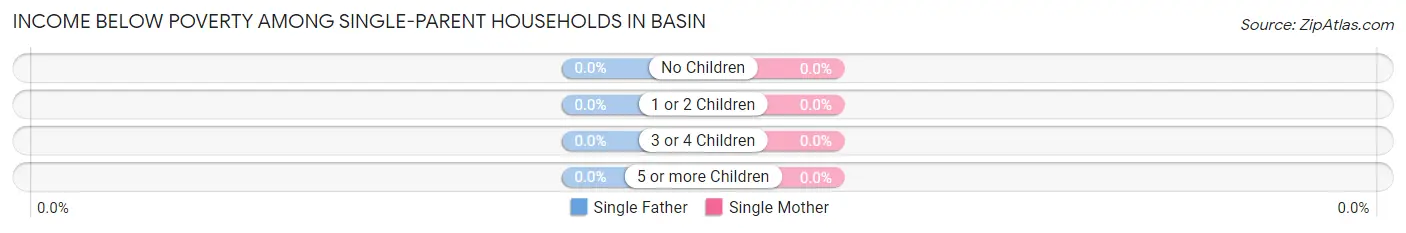
Income Below Poverty Among Single-Parent Households in Basin
| Children | Single Father | Single Mother |
| No Children | 0 (0.0%) | 0 (0.0%) |
| 1 or 2 Children | 0 (0.0%) | 0 (0.0%) |
| 3 or 4 Children | 0 (0.0%) | 0 (0.0%) |
| 5 or more Children | 0 (0.0%) | 0 (0.0%) |
| Total | 0 (0.0%) | 0 (0.0%) |
Income Below Poverty Among Married-Couple vs Single-Parent Households in Basin
| Children | Married-Couple Families | Single-Parent Households |
| No Children | 0 (0.0%) | 0 (0.0%) |
| 1 or 2 Children | 0 (0.0%) | 0 (0.0%) |
| 3 or 4 Children | 0 (0.0%) | 0 (0.0%) |
| 5 or more Children | 0 (0.0%) | 0 (0.0%) |
| Total | 0 (0.0%) | 0 (0.0%) |
Employment Characteristics in Basin
Employment by Class of Employer in Basin
Among the 182 employed individuals in Basin, private company employees (111 | 61.0%), not-for-profit organizations (36 | 19.8%), and local government employees (18 | 9.9%) make up the most common classes of employment.
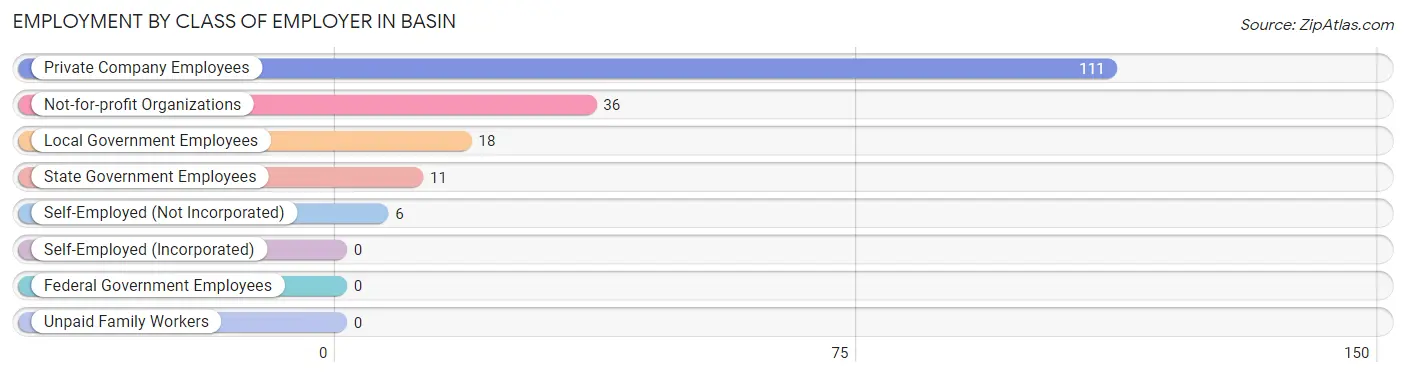
| Employer Class | # Employees | % Employees |
| Private Company Employees | 111 | 61.0% |
| Self-Employed (Incorporated) | 0 | 0.0% |
| Self-Employed (Not Incorporated) | 6 | 3.3% |
| Not-for-profit Organizations | 36 | 19.8% |
| Local Government Employees | 18 | 9.9% |
| State Government Employees | 11 | 6.0% |
| Federal Government Employees | 0 | 0.0% |
| Unpaid Family Workers | 0 | 0.0% |
| Total | 182 | 100.0% |
Employment Status by Age in Basin
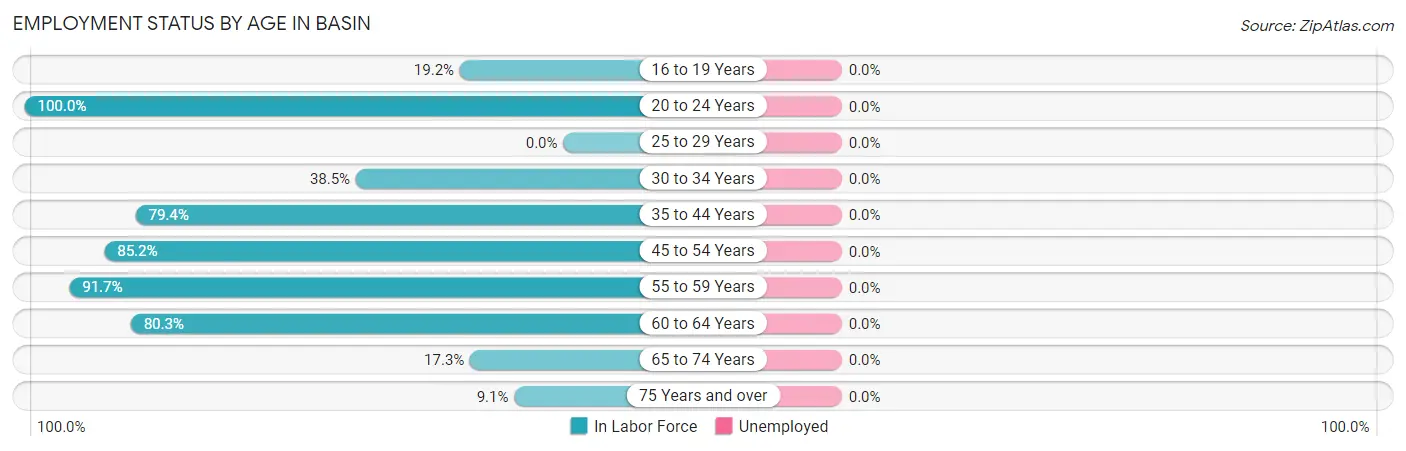
| Age Bracket | In Labor Force | Unemployed |
| 16 to 19 Years | 5 (19.2%) | 0 (0.0%) |
| 20 to 24 Years | 26 (100.0%) | 0 (0.0%) |
| 25 to 29 Years | 0 (0.0%) | 0 (0.0%) |
| 30 to 34 Years | 5 (38.5%) | 0 (0.0%) |
| 35 to 44 Years | 27 (79.4%) | 0 (0.0%) |
| 45 to 54 Years | 52 (85.2%) | 0 (0.0%) |
| 55 to 59 Years | 11 (91.7%) | 0 (0.0%) |
| 60 to 64 Years | 49 (80.3%) | 0 (0.0%) |
| 65 to 74 Years | 13 (17.3%) | 0 (0.0%) |
| 75 Years and over | 2 (9.1%) | 0 (0.0%) |
| Total | 190 (57.6%) | 0 (0.0%) |
Employment Status by Educational Attainment in Basin
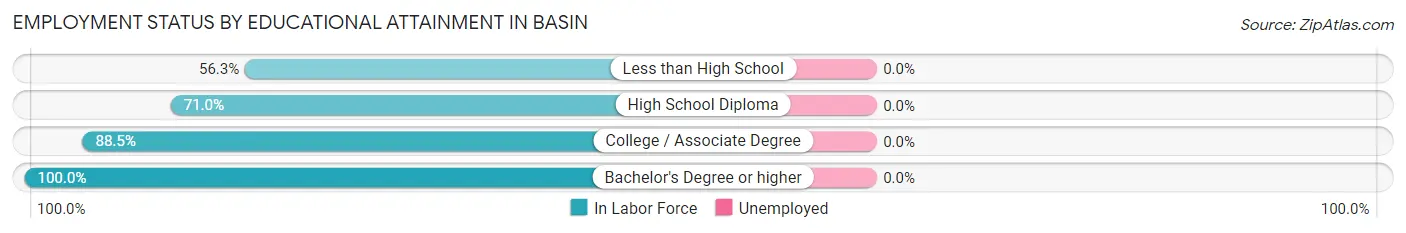
| Educational Attainment | In Labor Force | Unemployed |
| Less than High School | 9 (56.3%) | 0 (0.0%) |
| High School Diploma | 66 (71.0%) | 0 (0.0%) |
| College / Associate Degree | 23 (88.5%) | 0 (0.0%) |
| Bachelor's Degree or higher | 46 (100.0%) | 0 (0.0%) |
| Total | 144 (79.6%) | 0 (0.0%) |
Employment Occupations by Sex in Basin
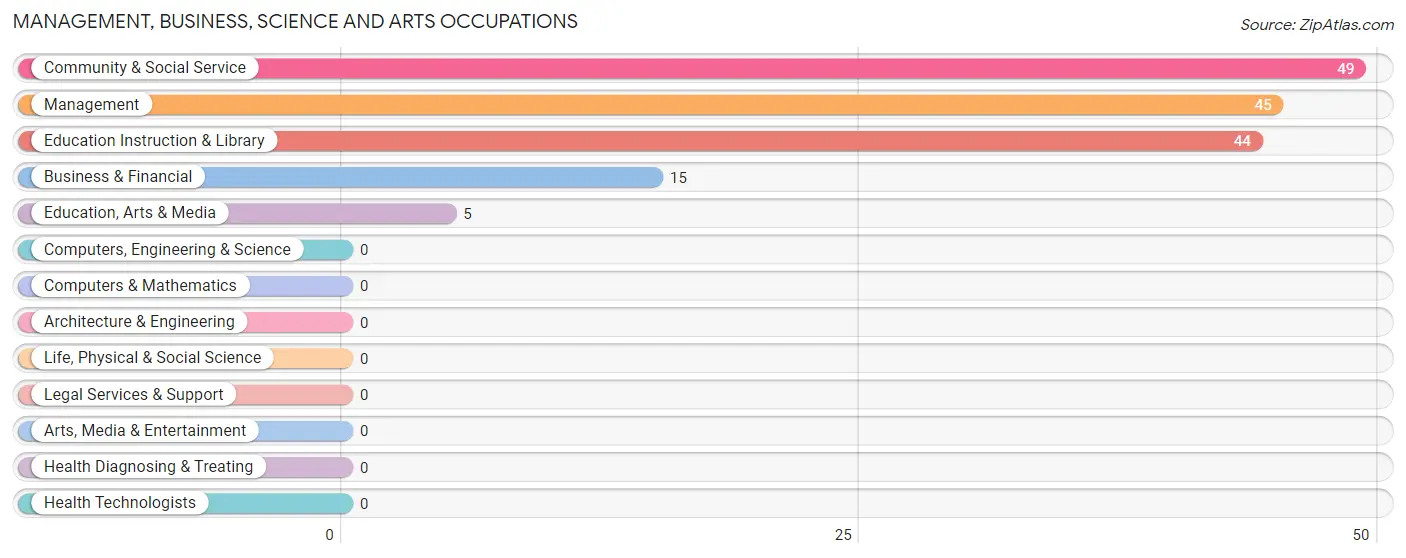
Management, Business, Science and Arts Occupations
The most common Management, Business, Science and Arts occupations in Basin are Community & Social Service (49 | 25.8%), Management (45 | 23.7%), Education Instruction & Library (44 | 23.2%), Business & Financial (15 | 7.9%), and Education, Arts & Media (5 | 2.6%).
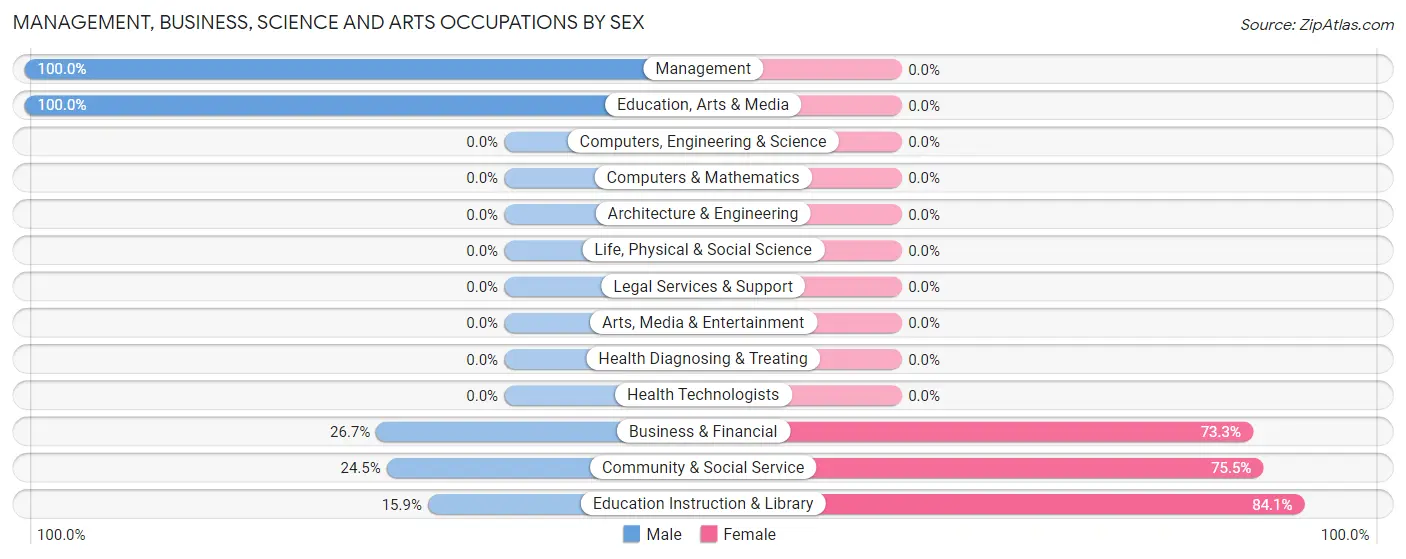
Management, Business, Science and Arts Occupations by Sex
Within the Management, Business, Science and Arts occupations in Basin, the most male-oriented occupations are Management (100.0%), Education, Arts & Media (100.0%), and Business & Financial (26.7%), while the most female-oriented occupations are Education Instruction & Library (84.1%), Community & Social Service (75.5%), and Business & Financial (73.3%).
| Occupation | Male | Female |
| Management | 45 (100.0%) | 0 (0.0%) |
| Business & Financial | 4 (26.7%) | 11 (73.3%) |
| Computers, Engineering & Science | 0 (0.0%) | 0 (0.0%) |
| Computers & Mathematics | 0 (0.0%) | 0 (0.0%) |
| Architecture & Engineering | 0 (0.0%) | 0 (0.0%) |
| Life, Physical & Social Science | 0 (0.0%) | 0 (0.0%) |
| Community & Social Service | 12 (24.5%) | 37 (75.5%) |
| Education, Arts & Media | 5 (100.0%) | 0 (0.0%) |
| Legal Services & Support | 0 (0.0%) | 0 (0.0%) |
| Education Instruction & Library | 7 (15.9%) | 37 (84.1%) |
| Arts, Media & Entertainment | 0 (0.0%) | 0 (0.0%) |
| Health Diagnosing & Treating | 0 (0.0%) | 0 (0.0%) |
| Health Technologists | 0 (0.0%) | 0 (0.0%) |
| Total (Category) | 61 (56.0%) | 48 (44.0%) |
| Total (Overall) | 126 (66.3%) | 64 (33.7%) |
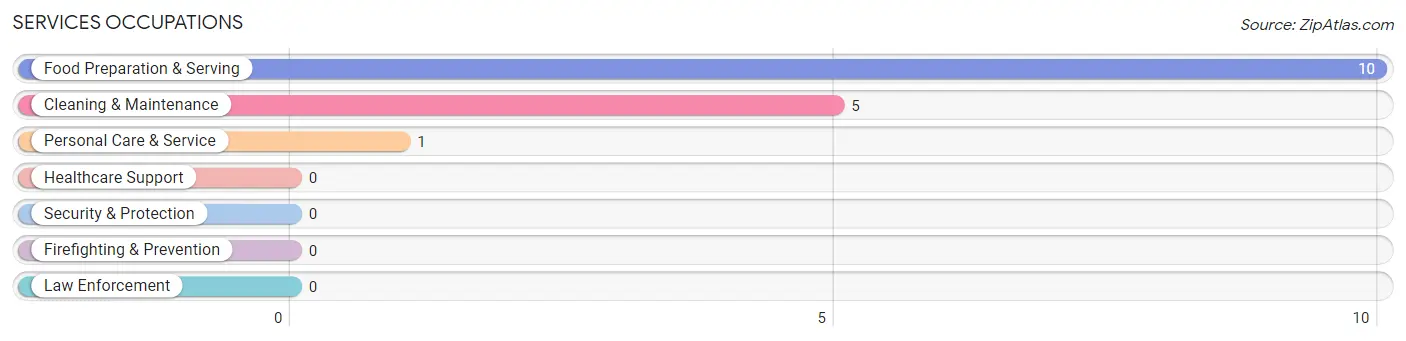
Services Occupations
The most common Services occupations in Basin are Food Preparation & Serving (10 | 5.3%), Cleaning & Maintenance (5 | 2.6%), and Personal Care & Service (1 | 0.5%).
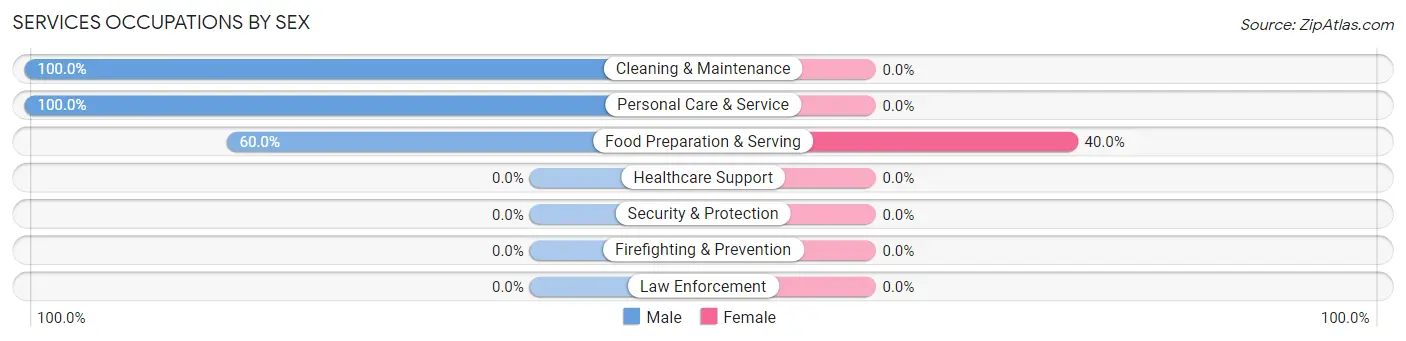
Services Occupations by Sex
| Occupation | Male | Female |
| Healthcare Support | 0 (0.0%) | 0 (0.0%) |
| Security & Protection | 0 (0.0%) | 0 (0.0%) |
| Firefighting & Prevention | 0 (0.0%) | 0 (0.0%) |
| Law Enforcement | 0 (0.0%) | 0 (0.0%) |
| Food Preparation & Serving | 6 (60.0%) | 4 (40.0%) |
| Cleaning & Maintenance | 5 (100.0%) | 0 (0.0%) |
| Personal Care & Service | 1 (100.0%) | 0 (0.0%) |
| Total (Category) | 12 (75.0%) | 4 (25.0%) |
| Total (Overall) | 126 (66.3%) | 64 (33.7%) |
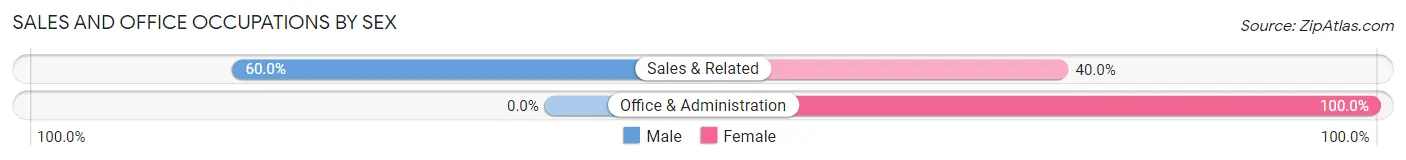
Sales and Office Occupations
The most common Sales and Office occupations in Basin are Office & Administration (10 | 5.3%), and Sales & Related (5 | 2.6%).
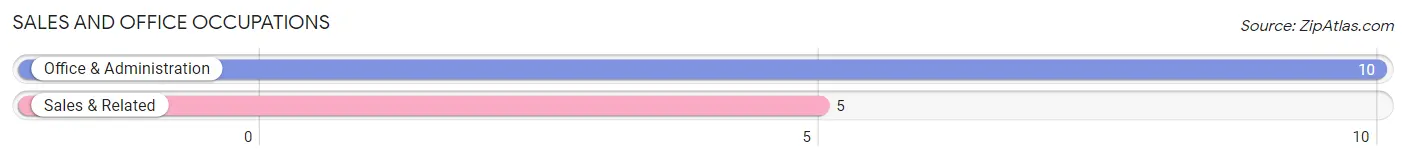
Sales and Office Occupations by Sex
| Occupation | Male | Female |
| Sales & Related | 3 (60.0%) | 2 (40.0%) |
| Office & Administration | 0 (0.0%) | 10 (100.0%) |
| Total (Category) | 3 (20.0%) | 12 (80.0%) |
| Total (Overall) | 126 (66.3%) | 64 (33.7%) |
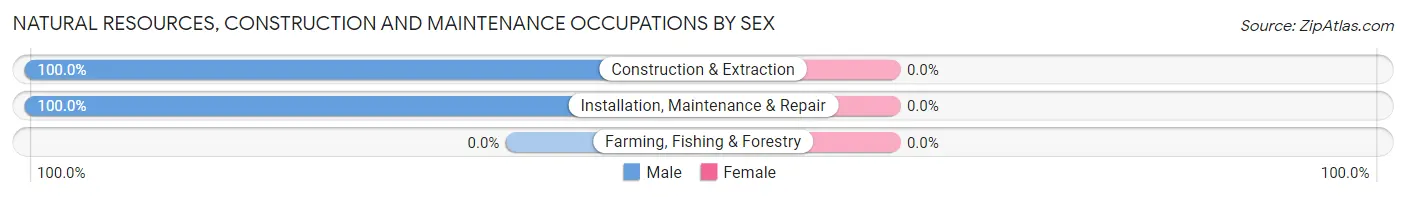
Natural Resources, Construction and Maintenance Occupations
The most common Natural Resources, Construction and Maintenance occupations in Basin are Construction & Extraction (10 | 5.3%), and Installation, Maintenance & Repair (5 | 2.6%).
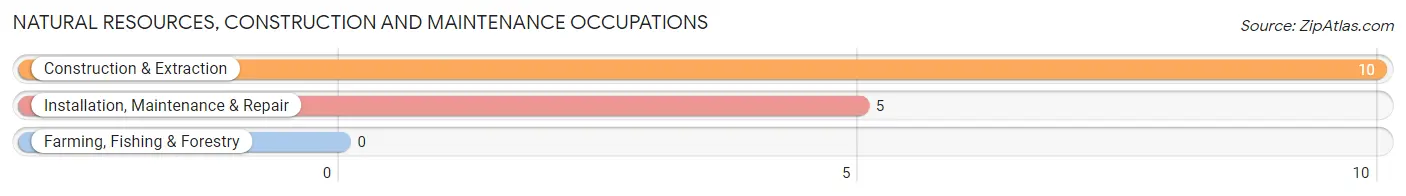
Natural Resources, Construction and Maintenance Occupations by Sex
| Occupation | Male | Female |
| Farming, Fishing & Forestry | 0 (0.0%) | 0 (0.0%) |
| Construction & Extraction | 10 (100.0%) | 0 (0.0%) |
| Installation, Maintenance & Repair | 5 (100.0%) | 0 (0.0%) |
| Total (Category) | 15 (100.0%) | 0 (0.0%) |
| Total (Overall) | 126 (66.3%) | 64 (33.7%) |
Production, Transportation and Moving Occupations
The most common Production, Transportation and Moving occupations in Basin are Material Moving (26 | 13.7%), and Production (9 | 4.7%).
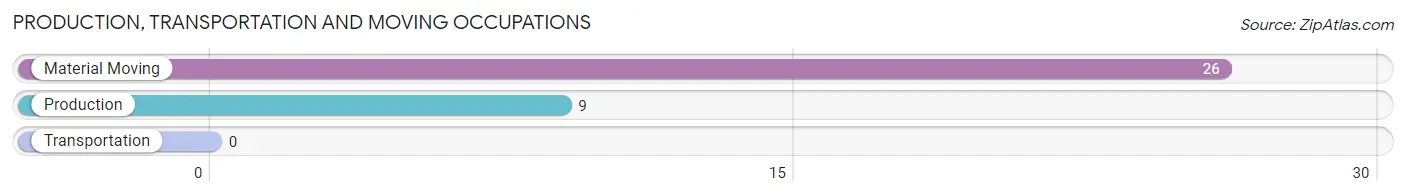
Production, Transportation and Moving Occupations by Sex
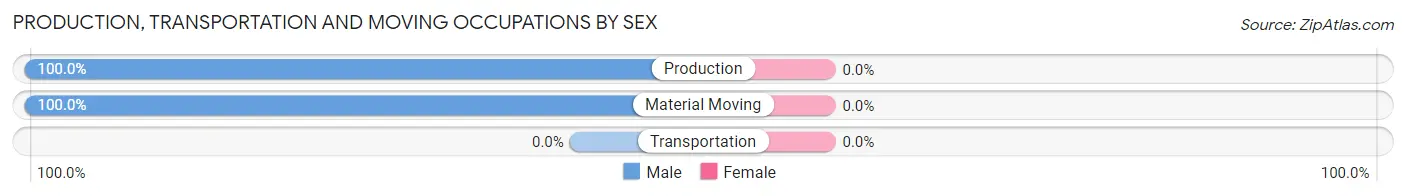
| Occupation | Male | Female |
| Production | 9 (100.0%) | 0 (0.0%) |
| Transportation | 0 (0.0%) | 0 (0.0%) |
| Material Moving | 26 (100.0%) | 0 (0.0%) |
| Total (Category) | 35 (100.0%) | 0 (0.0%) |
| Total (Overall) | 126 (66.3%) | 64 (33.7%) |
Employment Industries by Sex in Basin
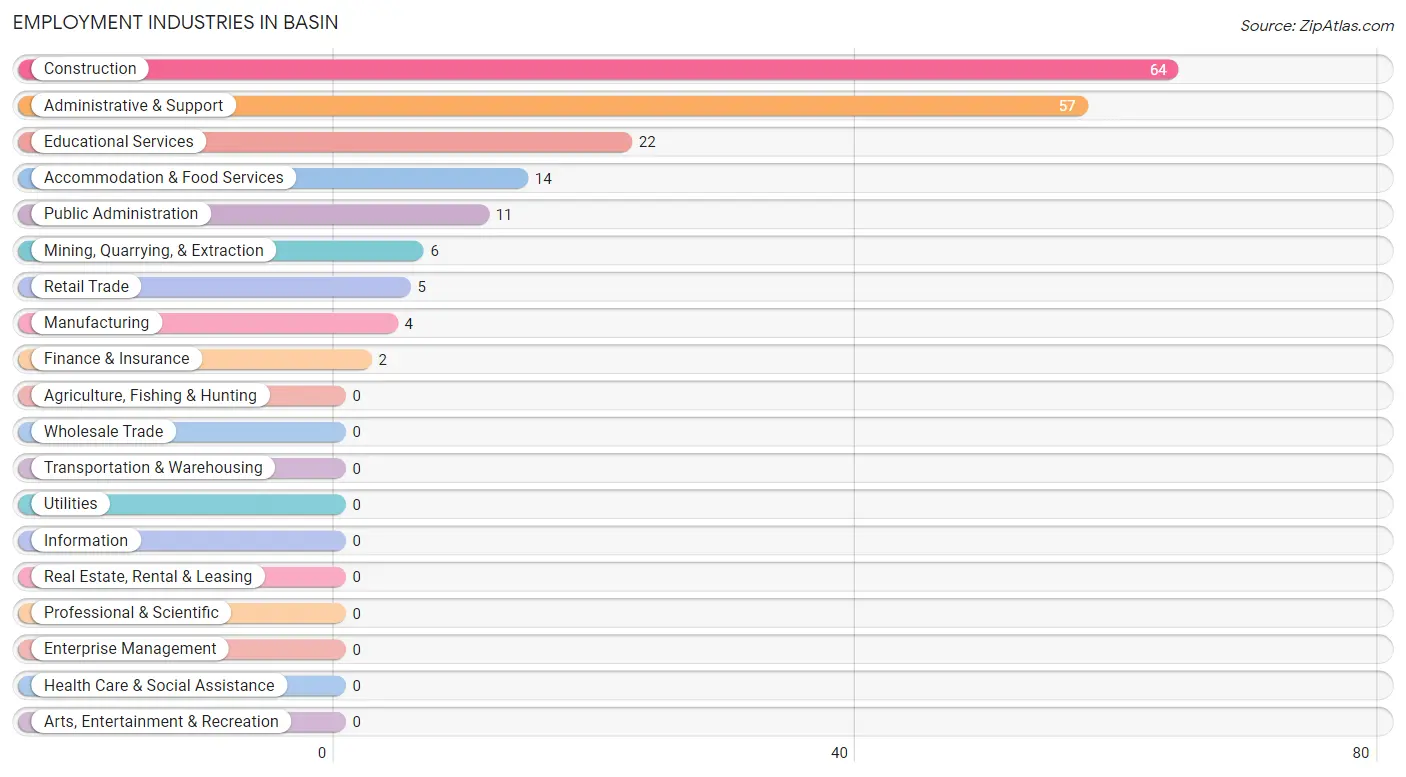
Employment Industries in Basin
The major employment industries in Basin include Construction (64 | 33.7%), Administrative & Support (57 | 30.0%), Educational Services (22 | 11.6%), Accommodation & Food Services (14 | 7.4%), and Public Administration (11 | 5.8%).
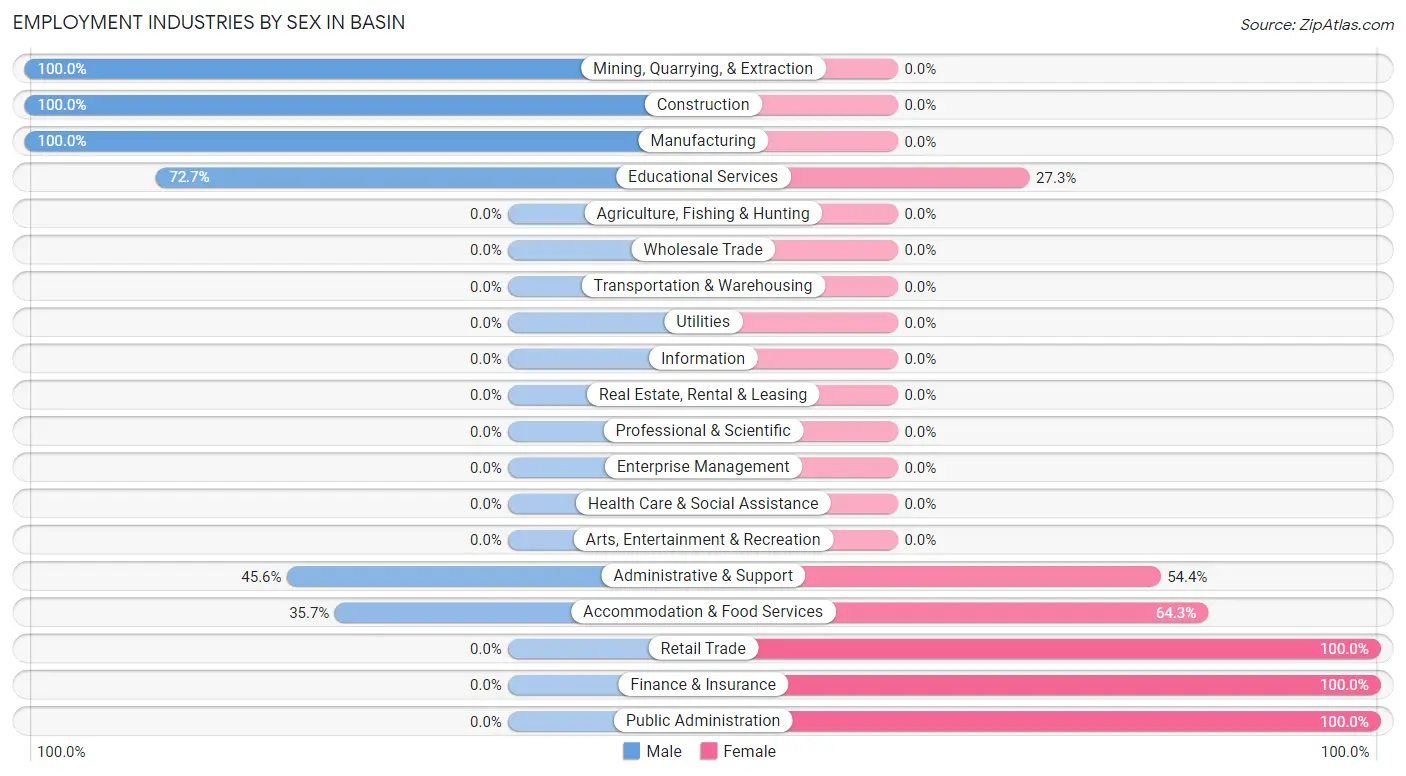
Employment Industries by Sex in Basin
The Basin industries that see more men than women are Mining, Quarrying, & Extraction (100.0%), Construction (100.0%), and Manufacturing (100.0%), whereas the industries that tend to have a higher number of women are Retail Trade (100.0%), Finance & Insurance (100.0%), and Public Administration (100.0%).
| Industry | Male | Female |
| Agriculture, Fishing & Hunting | 0 (0.0%) | 0 (0.0%) |
| Mining, Quarrying, & Extraction | 6 (100.0%) | 0 (0.0%) |
| Construction | 64 (100.0%) | 0 (0.0%) |
| Manufacturing | 4 (100.0%) | 0 (0.0%) |
| Wholesale Trade | 0 (0.0%) | 0 (0.0%) |
| Retail Trade | 0 (0.0%) | 5 (100.0%) |
| Transportation & Warehousing | 0 (0.0%) | 0 (0.0%) |
| Utilities | 0 (0.0%) | 0 (0.0%) |
| Information | 0 (0.0%) | 0 (0.0%) |
| Finance & Insurance | 0 (0.0%) | 2 (100.0%) |
| Real Estate, Rental & Leasing | 0 (0.0%) | 0 (0.0%) |
| Professional & Scientific | 0 (0.0%) | 0 (0.0%) |
| Enterprise Management | 0 (0.0%) | 0 (0.0%) |
| Administrative & Support | 26 (45.6%) | 31 (54.4%) |
| Educational Services | 16 (72.7%) | 6 (27.3%) |
| Health Care & Social Assistance | 0 (0.0%) | 0 (0.0%) |
| Arts, Entertainment & Recreation | 0 (0.0%) | 0 (0.0%) |
| Accommodation & Food Services | 5 (35.7%) | 9 (64.3%) |
| Public Administration | 0 (0.0%) | 11 (100.0%) |
| Total | 126 (66.3%) | 64 (33.7%) |
Education in Basin
School Enrollment in Basin
The most common levels of schooling among the 65 students in Basin are college / undergraduate (26 | 40.0%), middle school (21 | 32.3%), and elementary school (13 | 20.0%).
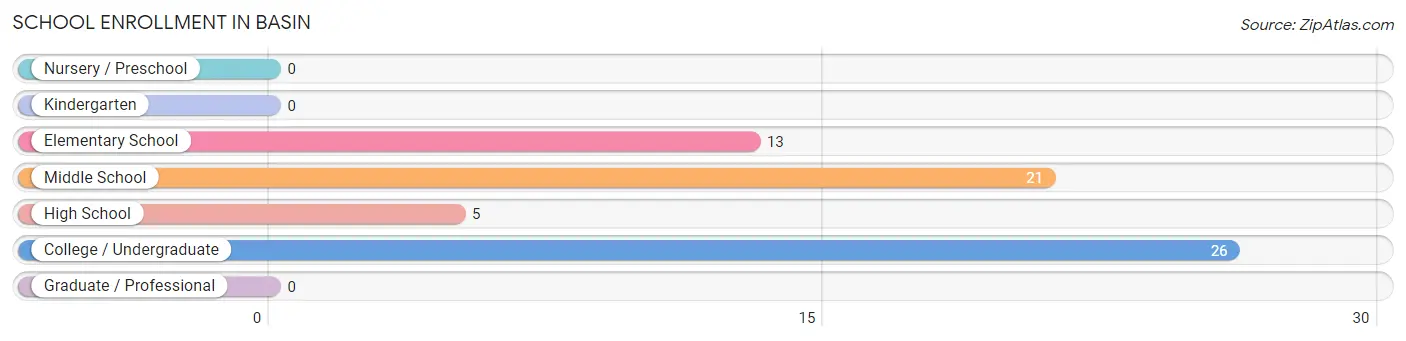
| School Level | # Students | % Students |
| Nursery / Preschool | 0 | 0.0% |
| Kindergarten | 0 | 0.0% |
| Elementary School | 13 | 20.0% |
| Middle School | 21 | 32.3% |
| High School | 5 | 7.7% |
| College / Undergraduate | 26 | 40.0% |
| Graduate / Professional | 0 | 0.0% |
| Total | 65 | 100.0% |
School Enrollment by Age by Funding Source in Basin
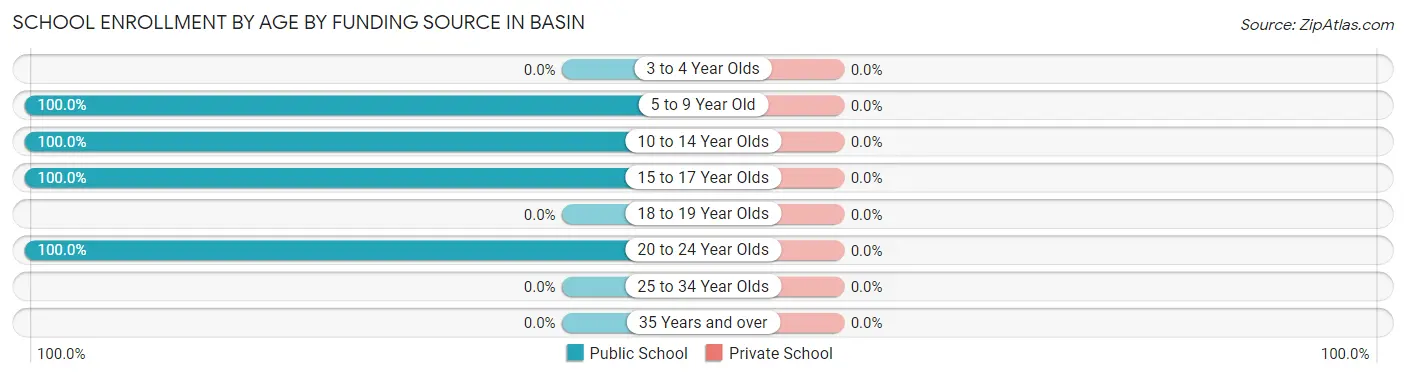
| Age Bracket | Public School | Private School |
| 3 to 4 Year Olds | 0 (0.0%) | 0 (0.0%) |
| 5 to 9 Year Old | 8 (100.0%) | 0 (0.0%) |
| 10 to 14 Year Olds | 26 (100.0%) | 0 (0.0%) |
| 15 to 17 Year Olds | 5 (100.0%) | 0 (0.0%) |
| 18 to 19 Year Olds | 0 (0.0%) | 0 (0.0%) |
| 20 to 24 Year Olds | 26 (100.0%) | 0 (0.0%) |
| 25 to 34 Year Olds | 0 (0.0%) | 0 (0.0%) |
| 35 Years and over | 0 (0.0%) | 0 (0.0%) |
| Total | 65 (100.0%) | 0 (0.0%) |
Educational Attainment by Field of Study in Basin
Business (36 | 31.0%), communications (35 | 30.2%), science & technology (14 | 12.1%), social sciences (9 | 7.8%), and education (9 | 7.8%) are the most common fields of study among 116 individuals in Basin who have obtained a bachelor's degree or higher.
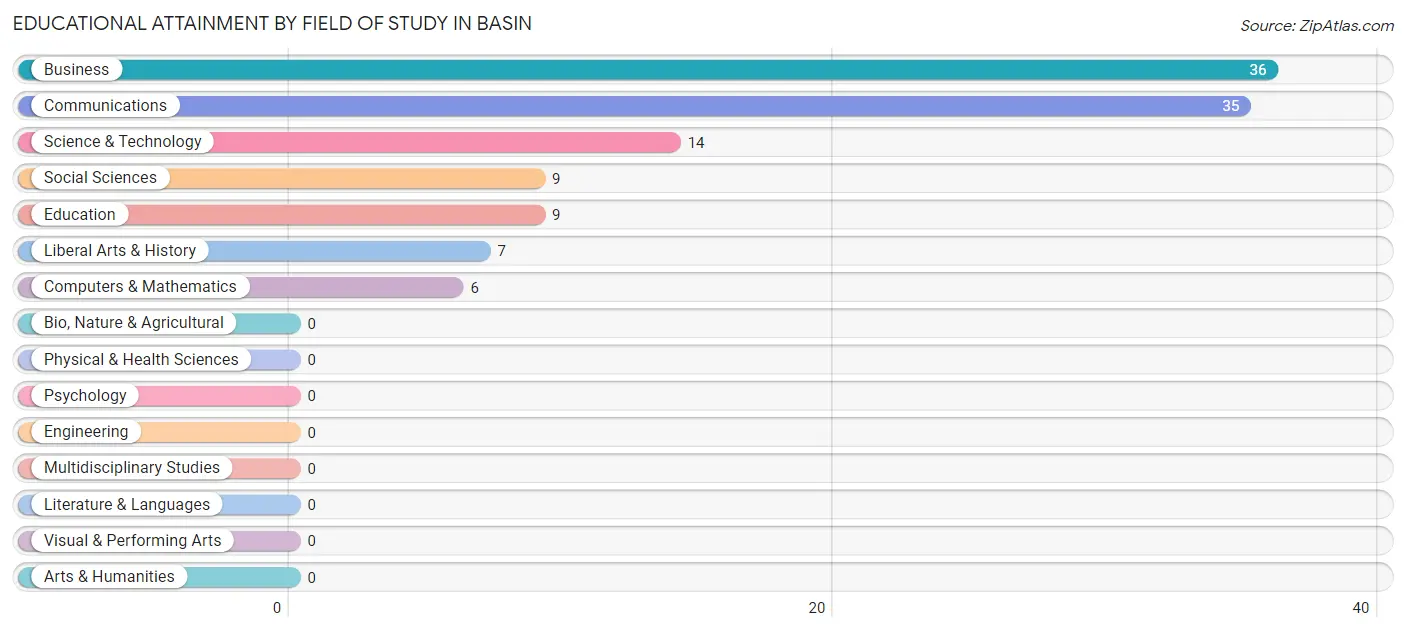
| Field of Study | # Graduates | % Graduates |
| Computers & Mathematics | 6 | 5.2% |
| Bio, Nature & Agricultural | 0 | 0.0% |
| Physical & Health Sciences | 0 | 0.0% |
| Psychology | 0 | 0.0% |
| Social Sciences | 9 | 7.8% |
| Engineering | 0 | 0.0% |
| Multidisciplinary Studies | 0 | 0.0% |
| Science & Technology | 14 | 12.1% |
| Business | 36 | 31.0% |
| Education | 9 | 7.8% |
| Literature & Languages | 0 | 0.0% |
| Liberal Arts & History | 7 | 6.0% |
| Visual & Performing Arts | 0 | 0.0% |
| Communications | 35 | 30.2% |
| Arts & Humanities | 0 | 0.0% |
| Total | 116 | 100.0% |
Transportation & Commute in Basin
Vehicle Availability by Sex in Basin
The most prevalent vehicle ownership categories in Basin are males with 5 or more vehicles (50, accounting for 41.0%) and females with 5 or more vehicles (31, making up 83.3%).
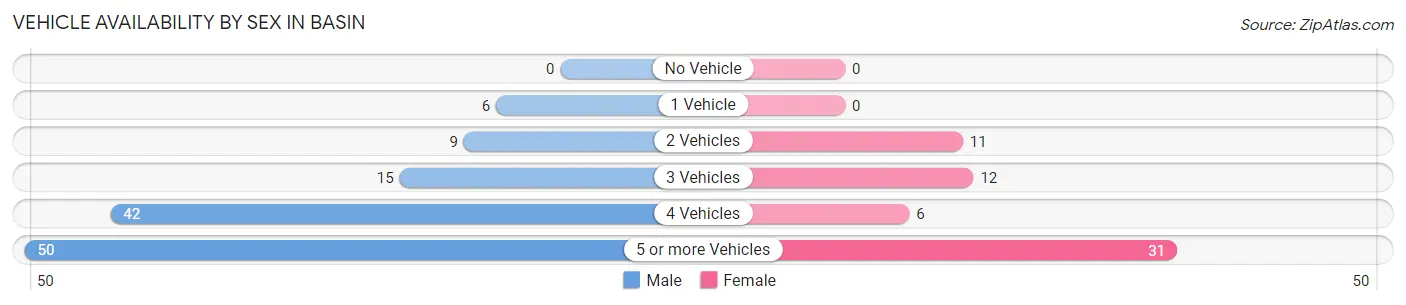
| Vehicles Available | Male | Female |
| No Vehicle | 0 (0.0%) | 0 (0.0%) |
| 1 Vehicle | 6 (4.9%) | 0 (0.0%) |
| 2 Vehicles | 9 (7.4%) | 11 (18.3%) |
| 3 Vehicles | 15 (12.3%) | 12 (20.0%) |
| 4 Vehicles | 42 (34.4%) | 6 (10.0%) |
| 5 or more Vehicles | 50 (41.0%) | 31 (51.7%) |
| Total | 122 (100.0%) | 60 (100.0%) |
Commute Time in Basin
The most frequently occuring commute durations in Basin are 90 or more minutes (45 commuters, 26.2%), 15 to 19 minutes (38 commuters, 22.1%), and 35 to 39 minutes (35 commuters, 20.3%).
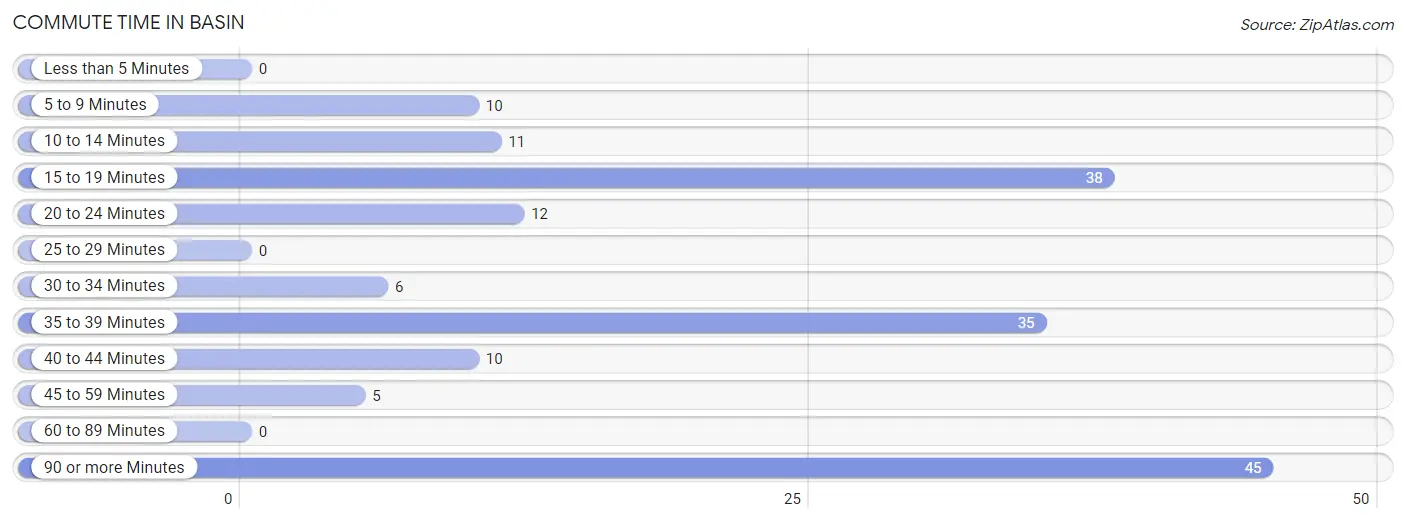
| Commute Time | # Commuters | % Commuters |
| Less than 5 Minutes | 0 | 0.0% |
| 5 to 9 Minutes | 10 | 5.8% |
| 10 to 14 Minutes | 11 | 6.4% |
| 15 to 19 Minutes | 38 | 22.1% |
| 20 to 24 Minutes | 12 | 7.0% |
| 25 to 29 Minutes | 0 | 0.0% |
| 30 to 34 Minutes | 6 | 3.5% |
| 35 to 39 Minutes | 35 | 20.3% |
| 40 to 44 Minutes | 10 | 5.8% |
| 45 to 59 Minutes | 5 | 2.9% |
| 60 to 89 Minutes | 0 | 0.0% |
| 90 or more Minutes | 45 | 26.2% |
Commute Time by Sex in Basin
The most common commute times in Basin are 90 or more minutes (45 commuters, 39.5%) for males and 15 to 19 minutes (31 commuters, 53.4%) for females.
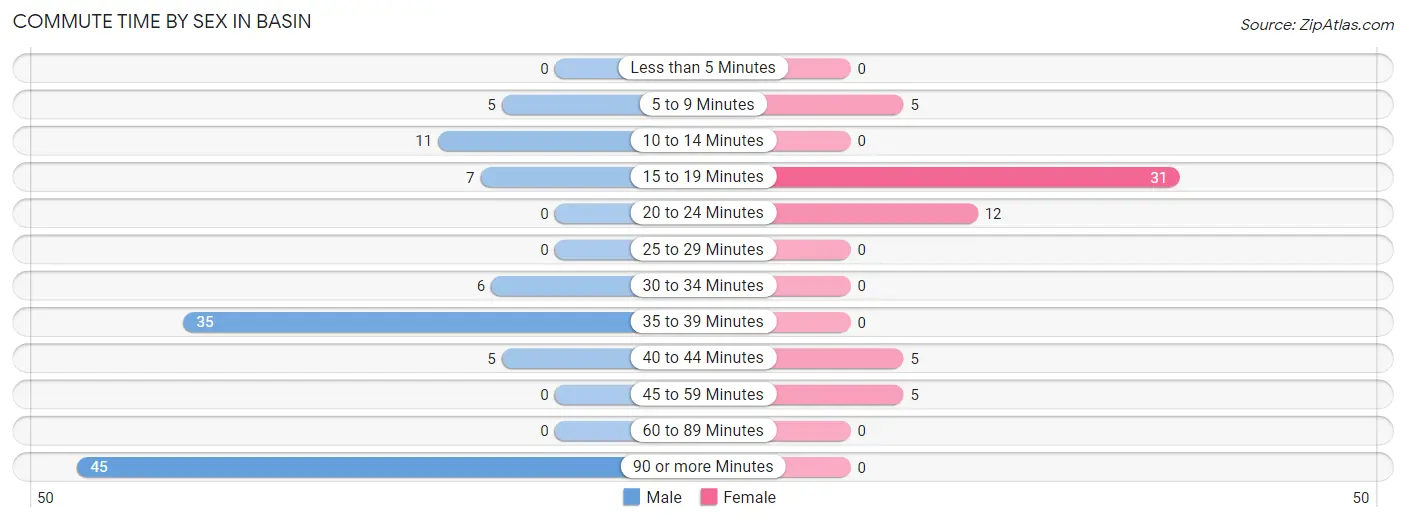
| Commute Time | Male | Female |
| Less than 5 Minutes | 0 (0.0%) | 0 (0.0%) |
| 5 to 9 Minutes | 5 (4.4%) | 5 (8.6%) |
| 10 to 14 Minutes | 11 (9.7%) | 0 (0.0%) |
| 15 to 19 Minutes | 7 (6.1%) | 31 (53.4%) |
| 20 to 24 Minutes | 0 (0.0%) | 12 (20.7%) |
| 25 to 29 Minutes | 0 (0.0%) | 0 (0.0%) |
| 30 to 34 Minutes | 6 (5.3%) | 0 (0.0%) |
| 35 to 39 Minutes | 35 (30.7%) | 0 (0.0%) |
| 40 to 44 Minutes | 5 (4.4%) | 5 (8.6%) |
| 45 to 59 Minutes | 0 (0.0%) | 5 (8.6%) |
| 60 to 89 Minutes | 0 (0.0%) | 0 (0.0%) |
| 90 or more Minutes | 45 (39.5%) | 0 (0.0%) |
Time of Departure to Work by Sex in Basin
The most frequent times of departure to work in Basin are 7:00 AM to 7:29 AM (80, 70.2%) for males and 5:30 AM to 5:59 AM (31, 53.4%) for females.
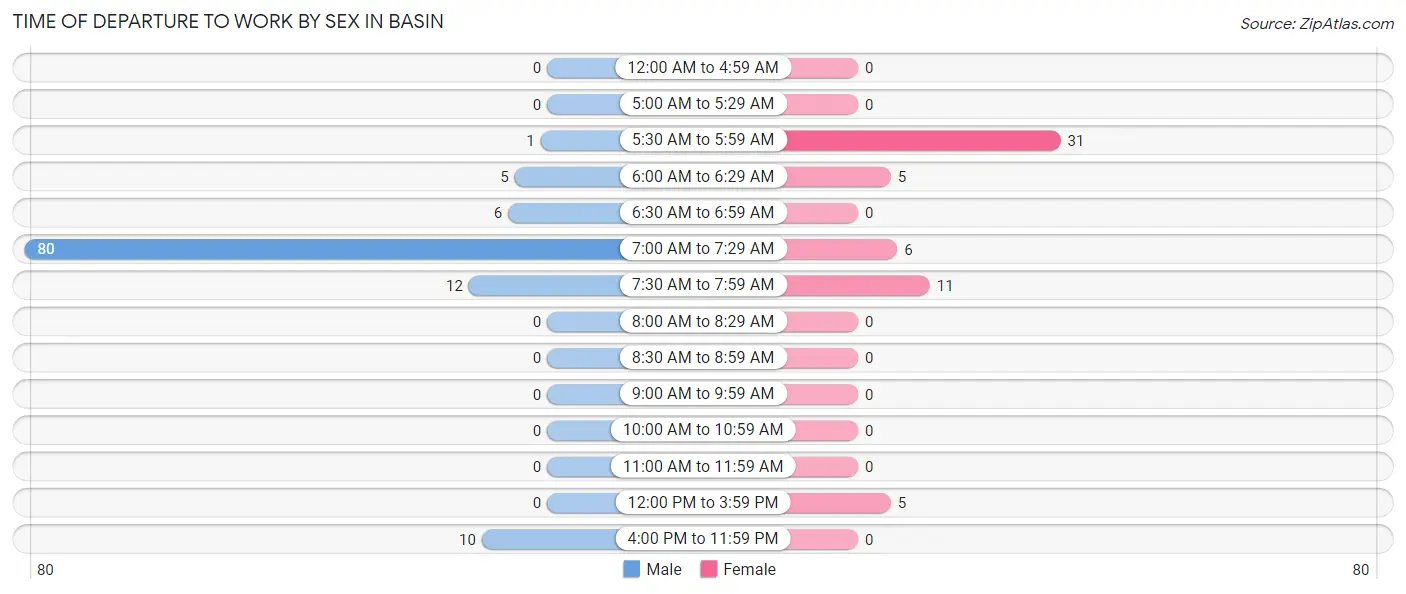
| Time of Departure | Male | Female |
| 12:00 AM to 4:59 AM | 0 (0.0%) | 0 (0.0%) |
| 5:00 AM to 5:29 AM | 0 (0.0%) | 0 (0.0%) |
| 5:30 AM to 5:59 AM | 1 (0.9%) | 31 (53.4%) |
| 6:00 AM to 6:29 AM | 5 (4.4%) | 5 (8.6%) |
| 6:30 AM to 6:59 AM | 6 (5.3%) | 0 (0.0%) |
| 7:00 AM to 7:29 AM | 80 (70.2%) | 6 (10.3%) |
| 7:30 AM to 7:59 AM | 12 (10.5%) | 11 (19.0%) |
| 8:00 AM to 8:29 AM | 0 (0.0%) | 0 (0.0%) |
| 8:30 AM to 8:59 AM | 0 (0.0%) | 0 (0.0%) |
| 9:00 AM to 9:59 AM | 0 (0.0%) | 0 (0.0%) |
| 10:00 AM to 10:59 AM | 0 (0.0%) | 0 (0.0%) |
| 11:00 AM to 11:59 AM | 0 (0.0%) | 0 (0.0%) |
| 12:00 PM to 3:59 PM | 0 (0.0%) | 5 (8.6%) |
| 4:00 PM to 11:59 PM | 10 (8.8%) | 0 (0.0%) |
| Total | 114 (100.0%) | 58 (100.0%) |
Housing Occupancy in Basin
Occupancy by Ownership in Basin
Of the total 164 dwellings in Basin, owner-occupied units account for 146 (89.0%), while renter-occupied units make up 18 (11.0%).
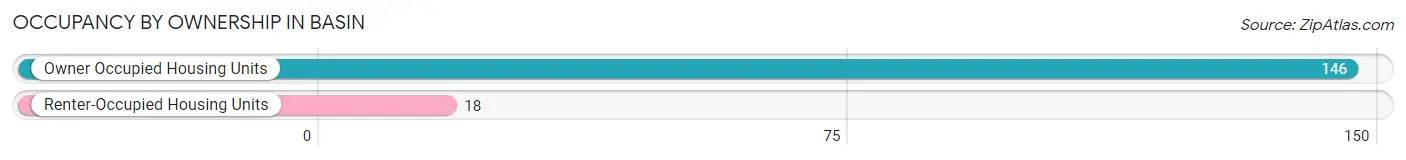
| Occupancy | # Housing Units | % Housing Units |
| Owner Occupied Housing Units | 146 | 89.0% |
| Renter-Occupied Housing Units | 18 | 11.0% |
| Total Occupied Housing Units | 164 | 100.0% |
Occupancy by Household Size in Basin
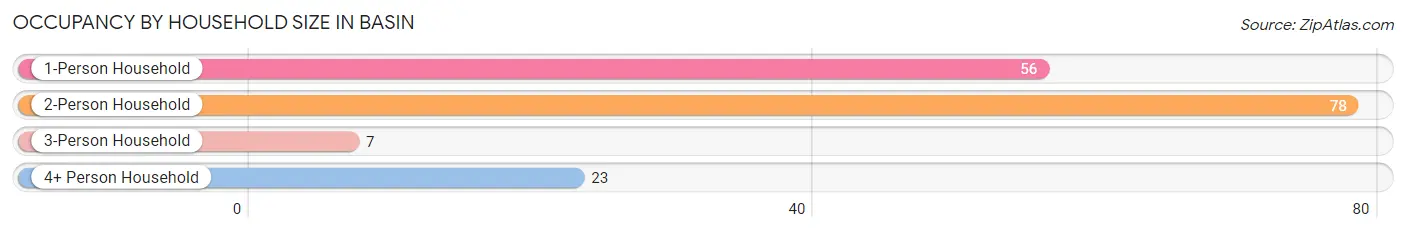
| Household Size | # Housing Units | % Housing Units |
| 1-Person Household | 56 | 34.2% |
| 2-Person Household | 78 | 47.6% |
| 3-Person Household | 7 | 4.3% |
| 4+ Person Household | 23 | 14.0% |
| Total Housing Units | 164 | 100.0% |
Occupancy by Ownership by Household Size in Basin
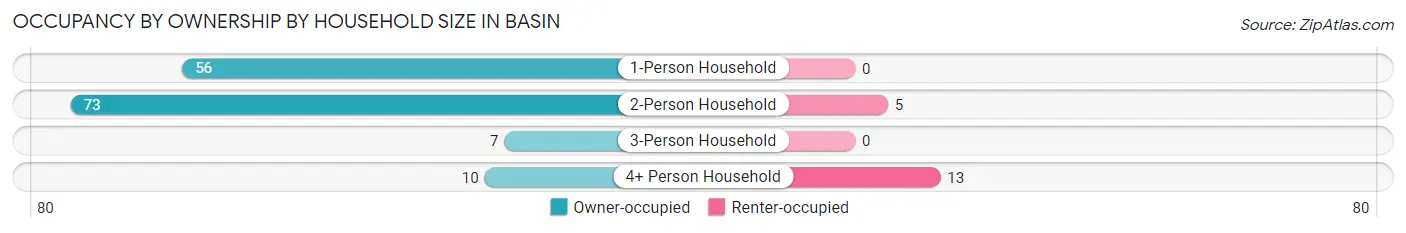
| Household Size | Owner-occupied | Renter-occupied |
| 1-Person Household | 56 (100.0%) | 0 (0.0%) |
| 2-Person Household | 73 (93.6%) | 5 (6.4%) |
| 3-Person Household | 7 (100.0%) | 0 (0.0%) |
| 4+ Person Household | 10 (43.5%) | 13 (56.5%) |
| Total Housing Units | 146 (89.0%) | 18 (11.0%) |
Occupancy by Educational Attainment in Basin
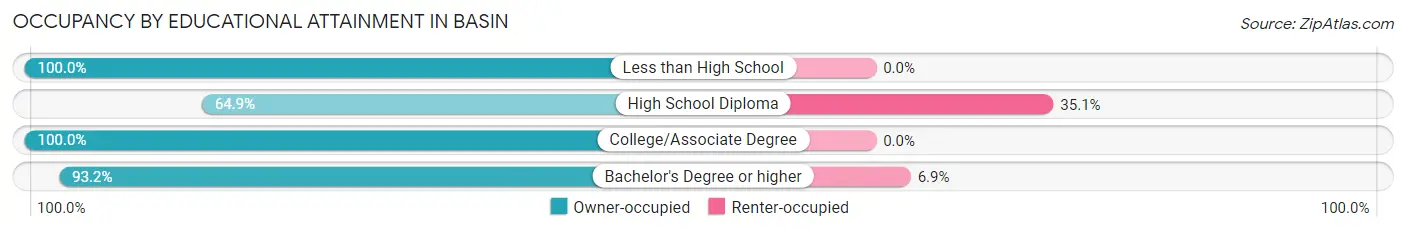
| Household Size | Owner-occupied | Renter-occupied |
| Less than High School | 7 (100.0%) | 0 (0.0%) |
| High School Diploma | 24 (64.9%) | 13 (35.1%) |
| College/Associate Degree | 47 (100.0%) | 0 (0.0%) |
| Bachelor's Degree or higher | 68 (93.1%) | 5 (6.9%) |
Occupancy by Age of Householder in Basin
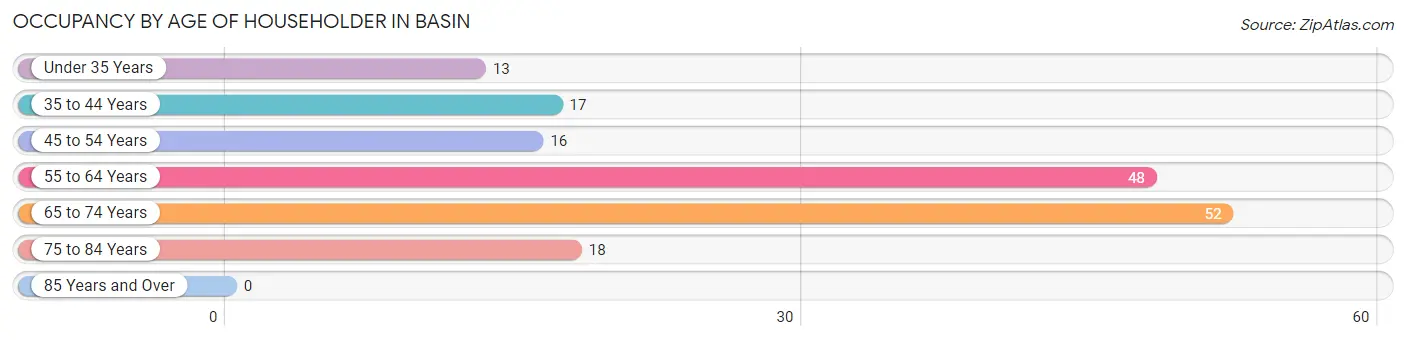
| Age Bracket | # Households | % Households |
| Under 35 Years | 13 | 7.9% |
| 35 to 44 Years | 17 | 10.4% |
| 45 to 54 Years | 16 | 9.8% |
| 55 to 64 Years | 48 | 29.3% |
| 65 to 74 Years | 52 | 31.7% |
| 75 to 84 Years | 18 | 11.0% |
| 85 Years and Over | 0 | 0.0% |
| Total | 164 | 100.0% |
Housing Finances in Basin
Median Income by Occupancy in Basin
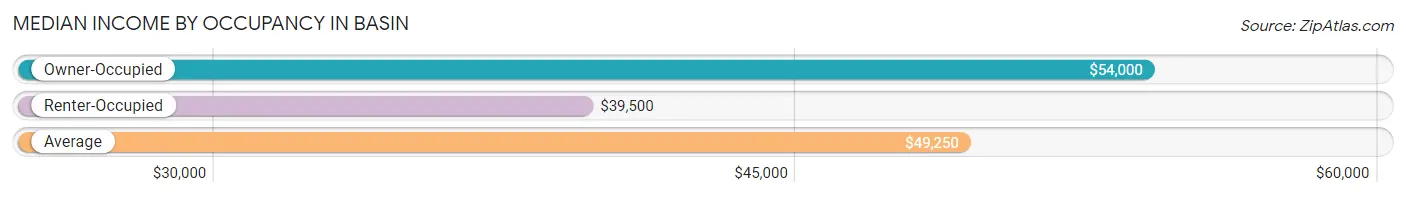
| Occupancy Type | # Households | Median Income |
| Owner-Occupied | 146 (89.0%) | $54,000 |
| Renter-Occupied | 18 (11.0%) | $39,500 |
| Average | 164 (100.0%) | $49,250 |
Occupancy by Householder Income Bracket in Basin
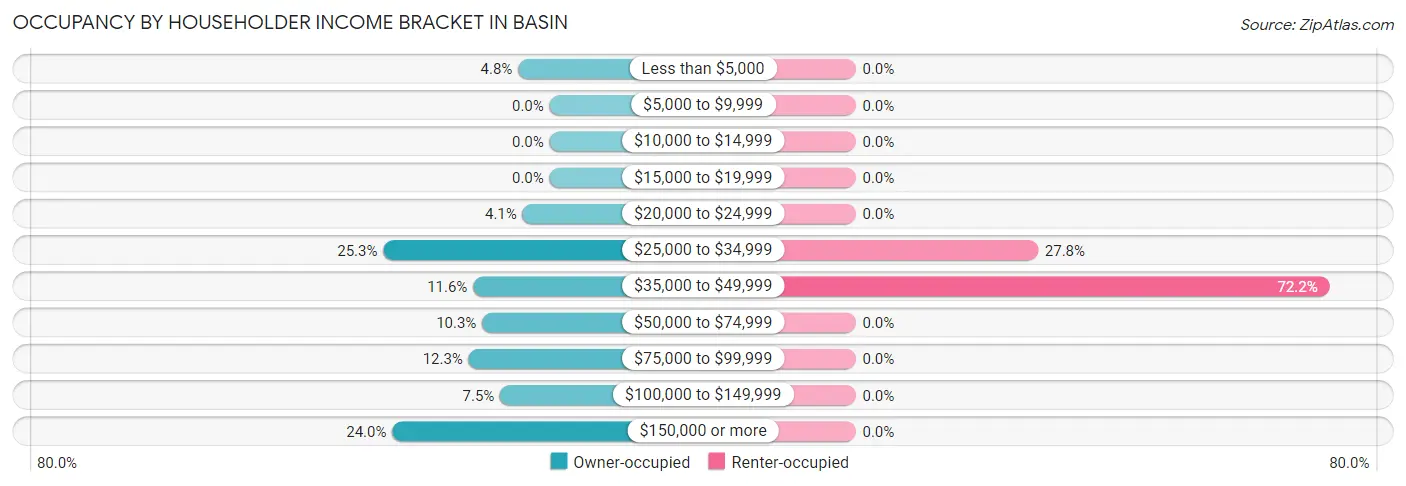
| Income Bracket | Owner-occupied | Renter-occupied |
| Less than $5,000 | 7 (4.8%) | 0 (0.0%) |
| $5,000 to $9,999 | 0 (0.0%) | 0 (0.0%) |
| $10,000 to $14,999 | 0 (0.0%) | 0 (0.0%) |
| $15,000 to $19,999 | 0 (0.0%) | 0 (0.0%) |
| $20,000 to $24,999 | 6 (4.1%) | 0 (0.0%) |
| $25,000 to $34,999 | 37 (25.3%) | 5 (27.8%) |
| $35,000 to $49,999 | 17 (11.6%) | 13 (72.2%) |
| $50,000 to $74,999 | 15 (10.3%) | 0 (0.0%) |
| $75,000 to $99,999 | 18 (12.3%) | 0 (0.0%) |
| $100,000 to $149,999 | 11 (7.5%) | 0 (0.0%) |
| $150,000 or more | 35 (24.0%) | 0 (0.0%) |
| Total | 146 (100.0%) | 18 (100.0%) |
Monthly Housing Cost Tiers in Basin
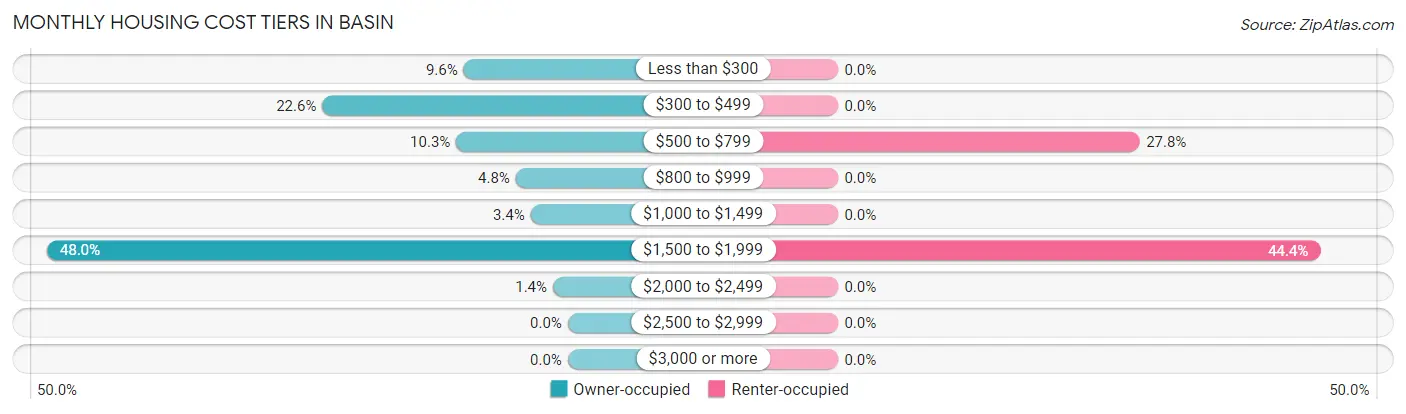
| Monthly Cost | Owner-occupied | Renter-occupied |
| Less than $300 | 14 (9.6%) | 0 (0.0%) |
| $300 to $499 | 33 (22.6%) | 0 (0.0%) |
| $500 to $799 | 15 (10.3%) | 5 (27.8%) |
| $800 to $999 | 7 (4.8%) | 0 (0.0%) |
| $1,000 to $1,499 | 5 (3.4%) | 0 (0.0%) |
| $1,500 to $1,999 | 70 (47.9%) | 8 (44.4%) |
| $2,000 to $2,499 | 2 (1.4%) | 0 (0.0%) |
| $2,500 to $2,999 | 0 (0.0%) | 0 (0.0%) |
| $3,000 or more | 0 (0.0%) | 0 (0.0%) |
| Total | 146 (100.0%) | 18 (100.0%) |
Physical Housing Characteristics in Basin
Housing Structures in Basin
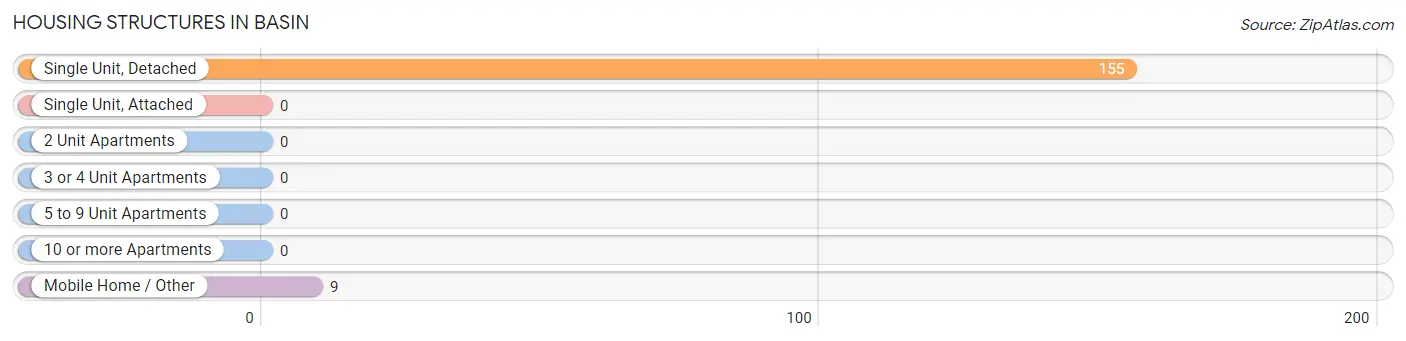
| Structure Type | # Housing Units | % Housing Units |
| Single Unit, Detached | 155 | 94.5% |
| Single Unit, Attached | 0 | 0.0% |
| 2 Unit Apartments | 0 | 0.0% |
| 3 or 4 Unit Apartments | 0 | 0.0% |
| 5 to 9 Unit Apartments | 0 | 0.0% |
| 10 or more Apartments | 0 | 0.0% |
| Mobile Home / Other | 9 | 5.5% |
| Total | 164 | 100.0% |
Housing Structures by Occupancy in Basin
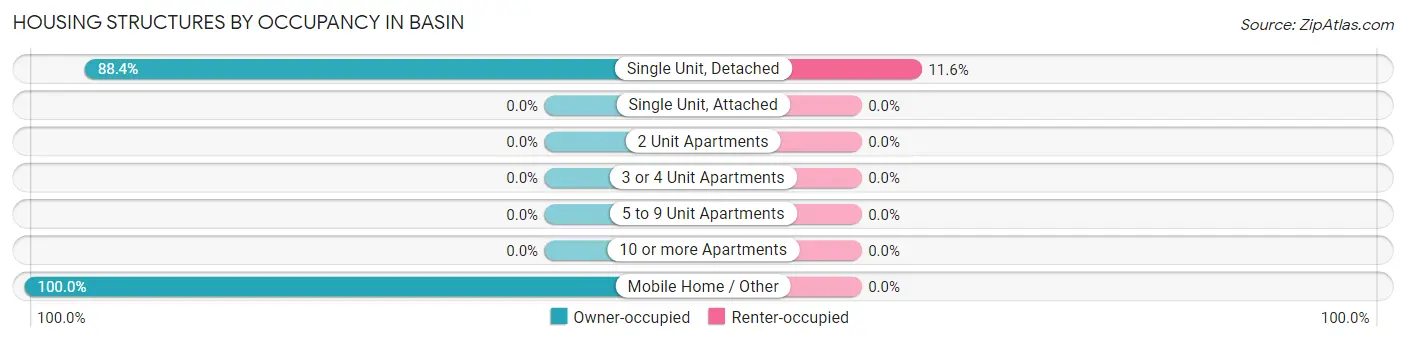
| Structure Type | Owner-occupied | Renter-occupied |
| Single Unit, Detached | 137 (88.4%) | 18 (11.6%) |
| Single Unit, Attached | 0 (0.0%) | 0 (0.0%) |
| 2 Unit Apartments | 0 (0.0%) | 0 (0.0%) |
| 3 or 4 Unit Apartments | 0 (0.0%) | 0 (0.0%) |
| 5 to 9 Unit Apartments | 0 (0.0%) | 0 (0.0%) |
| 10 or more Apartments | 0 (0.0%) | 0 (0.0%) |
| Mobile Home / Other | 9 (100.0%) | 0 (0.0%) |
| Total | 146 (89.0%) | 18 (11.0%) |
Housing Structures by Number of Rooms in Basin
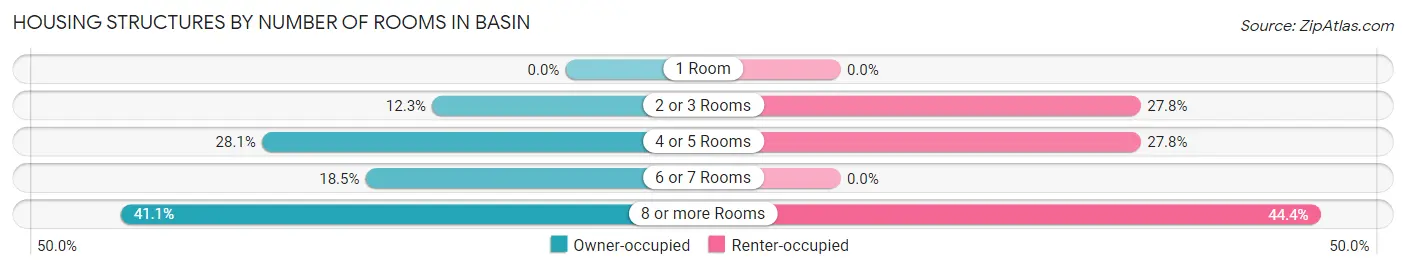
| Number of Rooms | Owner-occupied | Renter-occupied |
| 1 Room | 0 (0.0%) | 0 (0.0%) |
| 2 or 3 Rooms | 18 (12.3%) | 5 (27.8%) |
| 4 or 5 Rooms | 41 (28.1%) | 5 (27.8%) |
| 6 or 7 Rooms | 27 (18.5%) | 0 (0.0%) |
| 8 or more Rooms | 60 (41.1%) | 8 (44.4%) |
| Total | 146 (100.0%) | 18 (100.0%) |
Housing Structure by Heating Type in Basin
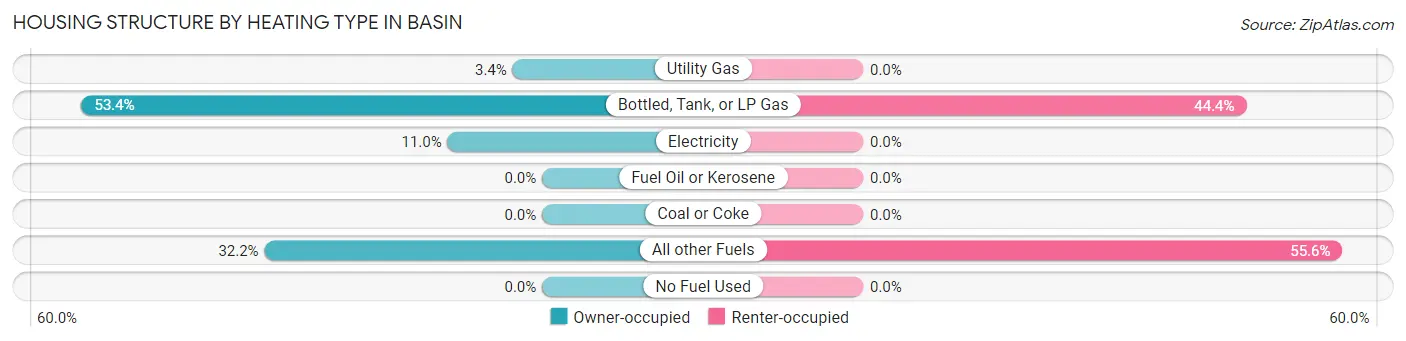
| Heating Type | Owner-occupied | Renter-occupied |
| Utility Gas | 5 (3.4%) | 0 (0.0%) |
| Bottled, Tank, or LP Gas | 78 (53.4%) | 8 (44.4%) |
| Electricity | 16 (11.0%) | 0 (0.0%) |
| Fuel Oil or Kerosene | 0 (0.0%) | 0 (0.0%) |
| Coal or Coke | 0 (0.0%) | 0 (0.0%) |
| All other Fuels | 47 (32.2%) | 10 (55.6%) |
| No Fuel Used | 0 (0.0%) | 0 (0.0%) |
| Total | 146 (100.0%) | 18 (100.0%) |
Household Vehicle Usage in Basin
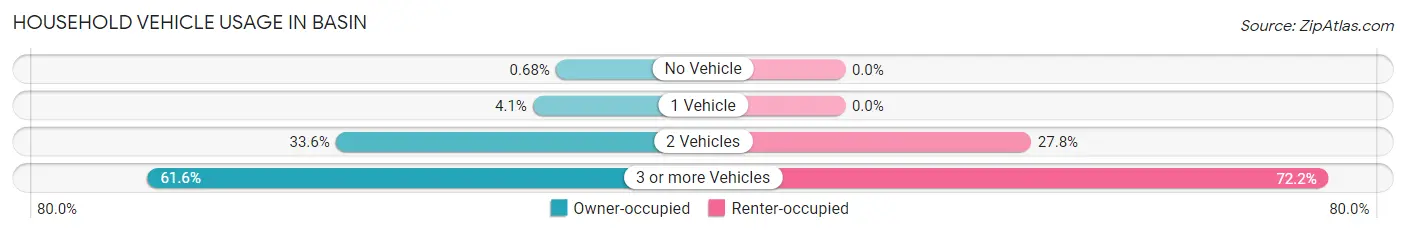
| Vehicles per Household | Owner-occupied | Renter-occupied |
| No Vehicle | 1 (0.7%) | 0 (0.0%) |
| 1 Vehicle | 6 (4.1%) | 0 (0.0%) |
| 2 Vehicles | 49 (33.6%) | 5 (27.8%) |
| 3 or more Vehicles | 90 (61.6%) | 13 (72.2%) |
| Total | 146 (100.0%) | 18 (100.0%) |
Real Estate & Mortgages in Basin
Real Estate and Mortgage Overview in Basin
| Characteristic | Without Mortgage | With Mortgage |
| Housing Units | 51 | 95 |
| Median Property Value | - | - |
| Median Household Income | $31,528 | $31 |
| Monthly Housing Costs | $348 | $0 |
| Real Estate Taxes | $652 | $7 |
Property Value by Mortgage Status in Basin
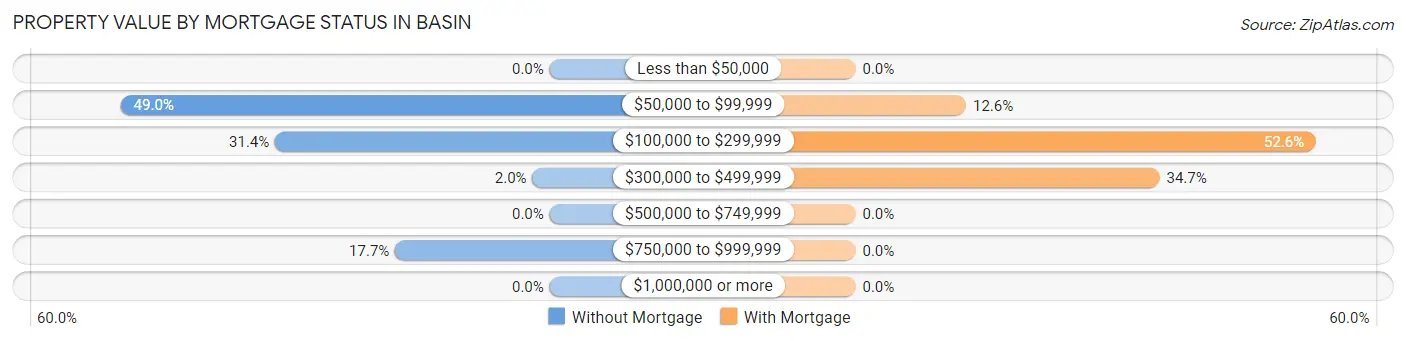
| Property Value | Without Mortgage | With Mortgage |
| Less than $50,000 | 0 (0.0%) | 0 (0.0%) |
| $50,000 to $99,999 | 25 (49.0%) | 12 (12.6%) |
| $100,000 to $299,999 | 16 (31.4%) | 50 (52.6%) |
| $300,000 to $499,999 | 1 (2.0%) | 33 (34.7%) |
| $500,000 to $749,999 | 0 (0.0%) | 0 (0.0%) |
| $750,000 to $999,999 | 9 (17.6%) | 0 (0.0%) |
| $1,000,000 or more | 0 (0.0%) | 0 (0.0%) |
| Total | 51 (100.0%) | 95 (100.0%) |
Household Income by Mortgage Status in Basin
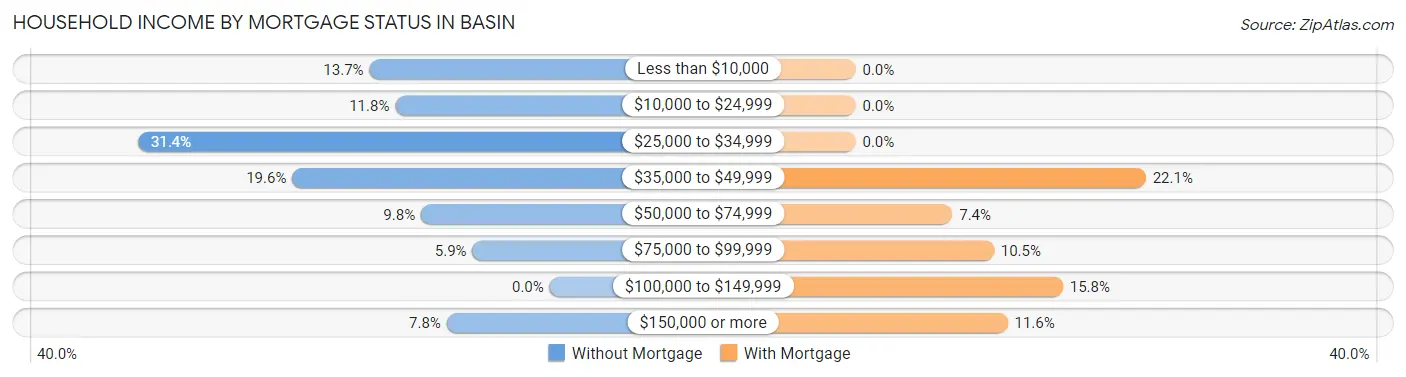
| Household Income | Without Mortgage | With Mortgage |
| Less than $10,000 | 7 (13.7%) | 0 (0.0%) |
| $10,000 to $24,999 | 6 (11.8%) | 0 (0.0%) |
| $25,000 to $34,999 | 16 (31.4%) | 0 (0.0%) |
| $35,000 to $49,999 | 10 (19.6%) | 21 (22.1%) |
| $50,000 to $74,999 | 5 (9.8%) | 7 (7.4%) |
| $75,000 to $99,999 | 3 (5.9%) | 10 (10.5%) |
| $100,000 to $149,999 | 0 (0.0%) | 15 (15.8%) |
| $150,000 or more | 4 (7.8%) | 11 (11.6%) |
| Total | 51 (100.0%) | 95 (100.0%) |
Property Value to Household Income Ratio in Basin
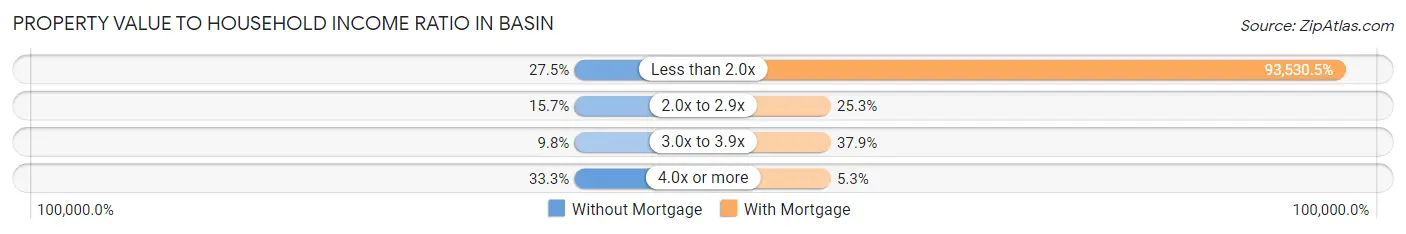
| Value-to-Income Ratio | Without Mortgage | With Mortgage |
| Less than 2.0x | 14 (27.5%) | 88,854 (93,530.5%) |
| 2.0x to 2.9x | 8 (15.7%) | 24 (25.3%) |
| 3.0x to 3.9x | 5 (9.8%) | 36 (37.9%) |
| 4.0x or more | 17 (33.3%) | 5 (5.3%) |
| Total | 51 (100.0%) | 95 (100.0%) |
Real Estate Taxes by Mortgage Status in Basin
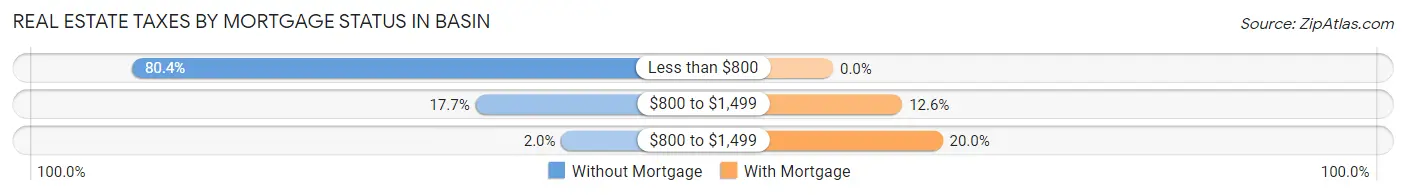
| Property Taxes | Without Mortgage | With Mortgage |
| Less than $800 | 41 (80.4%) | 0 (0.0%) |
| $800 to $1,499 | 9 (17.6%) | 12 (12.6%) |
| $800 to $1,499 | 1 (2.0%) | 19 (20.0%) |
| Total | 51 (100.0%) | 95 (100.0%) |
Health & Disability in Basin
Health Insurance Coverage by Age in Basin
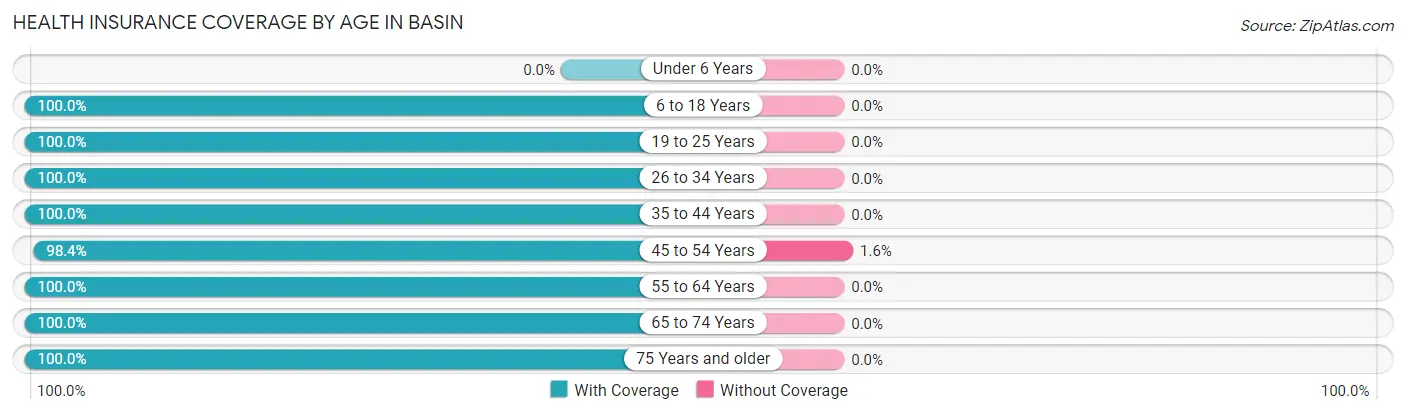
| Age Bracket | With Coverage | Without Coverage |
| Under 6 Years | 0 (0.0%) | 0 (0.0%) |
| 6 to 18 Years | 45 (100.0%) | 0 (0.0%) |
| 19 to 25 Years | 41 (100.0%) | 0 (0.0%) |
| 26 to 34 Years | 13 (100.0%) | 0 (0.0%) |
| 35 to 44 Years | 34 (100.0%) | 0 (0.0%) |
| 45 to 54 Years | 60 (98.4%) | 1 (1.6%) |
| 55 to 64 Years | 73 (100.0%) | 0 (0.0%) |
| 65 to 74 Years | 75 (100.0%) | 0 (0.0%) |
| 75 Years and older | 22 (100.0%) | 0 (0.0%) |
| Total | 363 (99.7%) | 1 (0.3%) |
Health Insurance Coverage by Citizenship Status in Basin
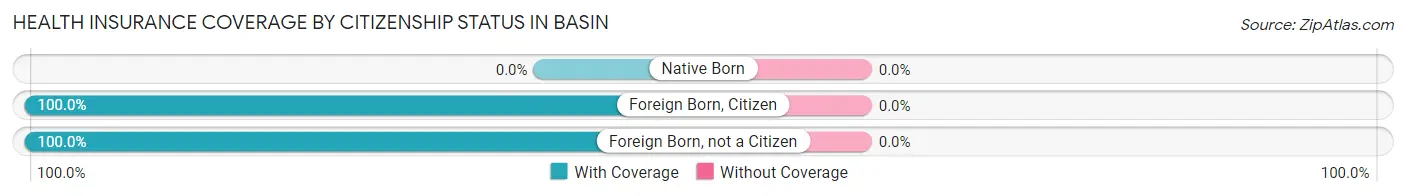
| Citizenship Status | With Coverage | Without Coverage |
| Native Born | 0 (0.0%) | 0 (0.0%) |
| Foreign Born, Citizen | 45 (100.0%) | 0 (0.0%) |
| Foreign Born, not a Citizen | 41 (100.0%) | 0 (0.0%) |
Health Insurance Coverage by Household Income in Basin
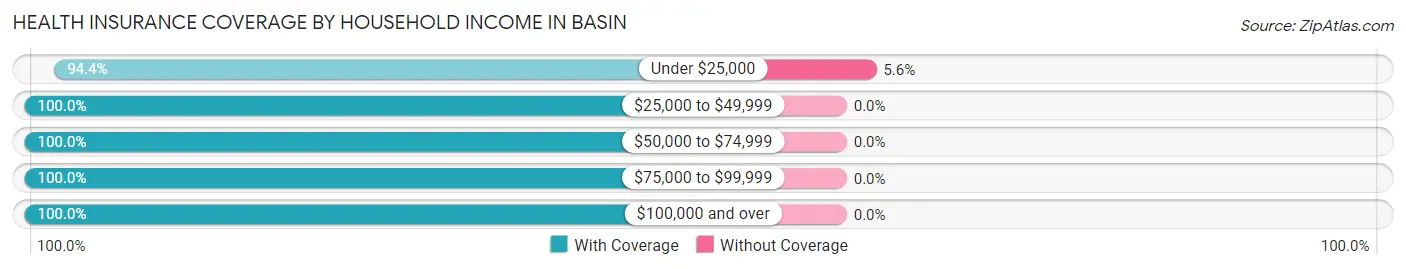
| Household Income | With Coverage | Without Coverage |
| Under $25,000 | 17 (94.4%) | 1 (5.6%) |
| $25,000 to $49,999 | 162 (100.0%) | 0 (0.0%) |
| $50,000 to $74,999 | 47 (100.0%) | 0 (0.0%) |
| $75,000 to $99,999 | 30 (100.0%) | 0 (0.0%) |
| $100,000 and over | 107 (100.0%) | 0 (0.0%) |
Public vs Private Health Insurance Coverage by Age in Basin
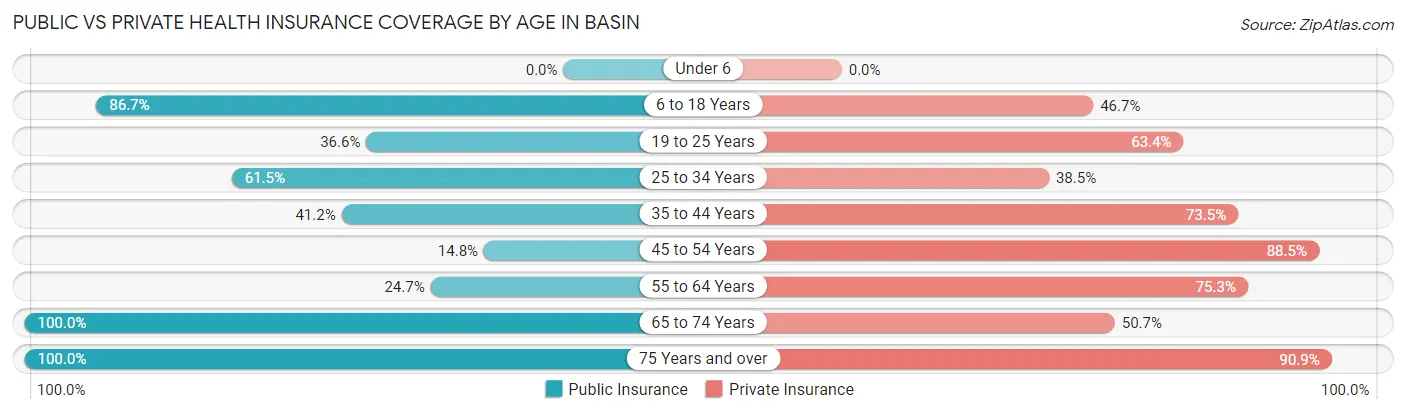
| Age Bracket | Public Insurance | Private Insurance |
| Under 6 | 0 (0.0%) | 0 (0.0%) |
| 6 to 18 Years | 39 (86.7%) | 21 (46.7%) |
| 19 to 25 Years | 15 (36.6%) | 26 (63.4%) |
| 25 to 34 Years | 8 (61.5%) | 5 (38.5%) |
| 35 to 44 Years | 14 (41.2%) | 25 (73.5%) |
| 45 to 54 Years | 9 (14.7%) | 54 (88.5%) |
| 55 to 64 Years | 18 (24.7%) | 55 (75.3%) |
| 65 to 74 Years | 75 (100.0%) | 38 (50.7%) |
| 75 Years and over | 22 (100.0%) | 20 (90.9%) |
| Total | 200 (54.9%) | 244 (67.0%) |
Disability Status by Sex by Age in Basin
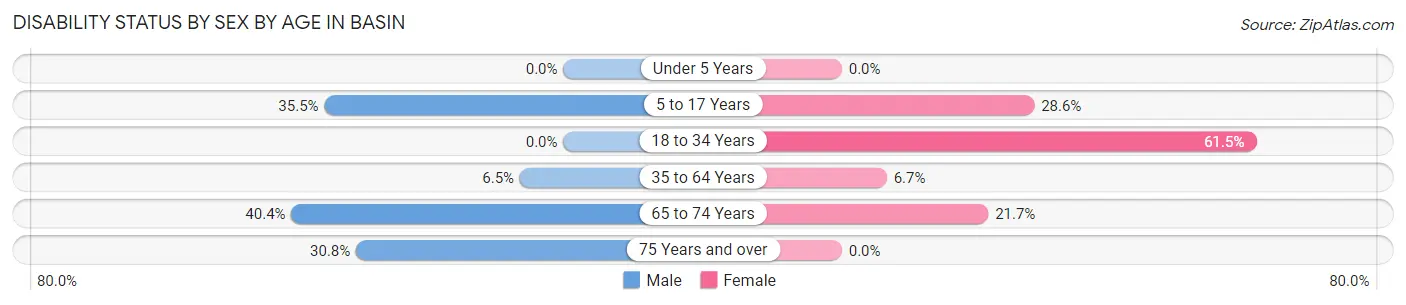
| Age Bracket | Male | Female |
| Under 5 Years | 0 (0.0%) | 0 (0.0%) |
| 5 to 17 Years | 11 (35.5%) | 4 (28.6%) |
| 18 to 34 Years | 0 (0.0%) | 8 (61.5%) |
| 35 to 64 Years | 6 (6.5%) | 5 (6.7%) |
| 65 to 74 Years | 21 (40.4%) | 5 (21.7%) |
| 75 Years and over | 4 (30.8%) | 0 (0.0%) |
Disability Class by Sex by Age in Basin
Disability Class: Hearing Difficulty
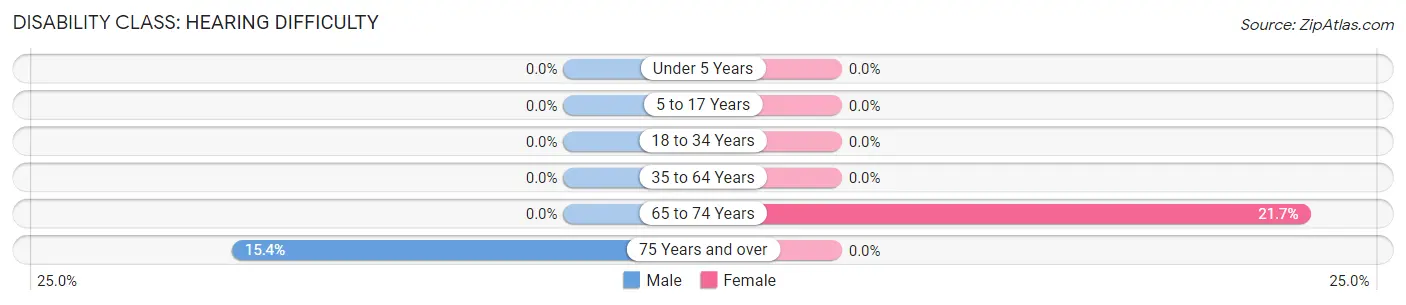
| Age Bracket | Male | Female |
| Under 5 Years | 0 (0.0%) | 0 (0.0%) |
| 5 to 17 Years | 0 (0.0%) | 0 (0.0%) |
| 18 to 34 Years | 0 (0.0%) | 0 (0.0%) |
| 35 to 64 Years | 0 (0.0%) | 0 (0.0%) |
| 65 to 74 Years | 0 (0.0%) | 5 (21.7%) |
| 75 Years and over | 2 (15.4%) | 0 (0.0%) |
Disability Class: Vision Difficulty
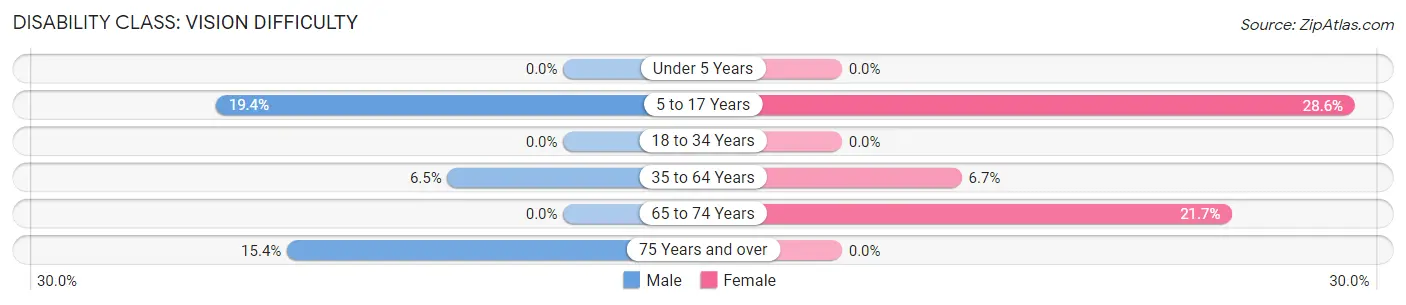
| Age Bracket | Male | Female |
| Under 5 Years | 0 (0.0%) | 0 (0.0%) |
| 5 to 17 Years | 6 (19.4%) | 4 (28.6%) |
| 18 to 34 Years | 0 (0.0%) | 0 (0.0%) |
| 35 to 64 Years | 6 (6.5%) | 5 (6.7%) |
| 65 to 74 Years | 0 (0.0%) | 5 (21.7%) |
| 75 Years and over | 2 (15.4%) | 0 (0.0%) |
Disability Class: Cognitive Difficulty
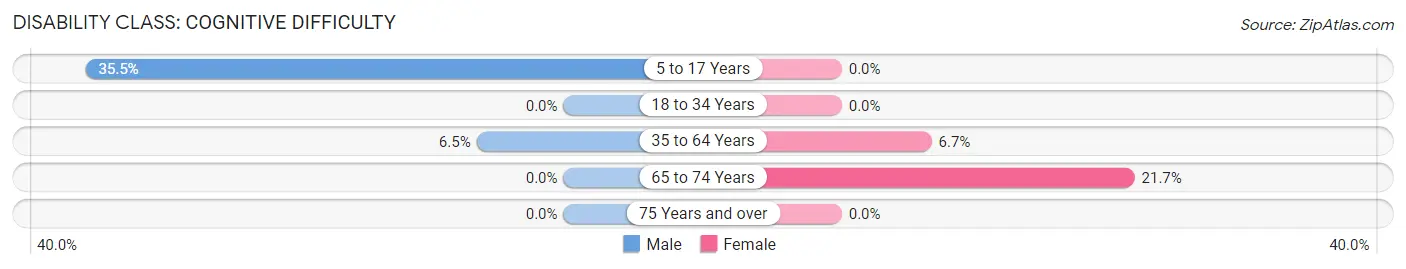
| Age Bracket | Male | Female |
| 5 to 17 Years | 11 (35.5%) | 0 (0.0%) |
| 18 to 34 Years | 0 (0.0%) | 0 (0.0%) |
| 35 to 64 Years | 6 (6.5%) | 5 (6.7%) |
| 65 to 74 Years | 0 (0.0%) | 5 (21.7%) |
| 75 Years and over | 0 (0.0%) | 0 (0.0%) |
Disability Class: Ambulatory Difficulty
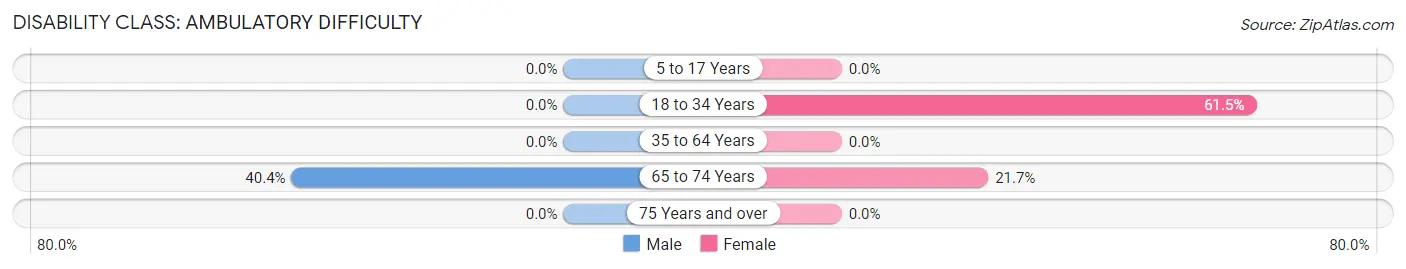
| Age Bracket | Male | Female |
| 5 to 17 Years | 0 (0.0%) | 0 (0.0%) |
| 18 to 34 Years | 0 (0.0%) | 8 (61.5%) |
| 35 to 64 Years | 0 (0.0%) | 0 (0.0%) |
| 65 to 74 Years | 21 (40.4%) | 5 (21.7%) |
| 75 Years and over | 0 (0.0%) | 0 (0.0%) |
Disability Class: Self-Care Difficulty
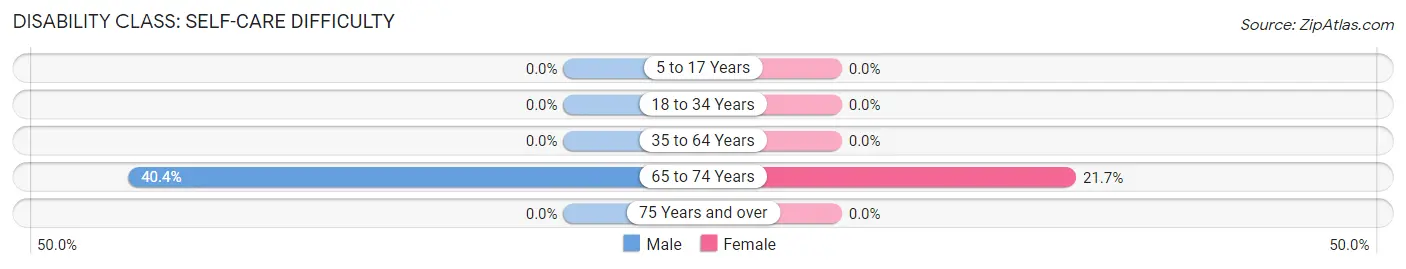
| Age Bracket | Male | Female |
| 5 to 17 Years | 0 (0.0%) | 0 (0.0%) |
| 18 to 34 Years | 0 (0.0%) | 0 (0.0%) |
| 35 to 64 Years | 0 (0.0%) | 0 (0.0%) |
| 65 to 74 Years | 21 (40.4%) | 5 (21.7%) |
| 75 Years and over | 0 (0.0%) | 0 (0.0%) |
Technology Access in Basin
Computing Device Access in Basin
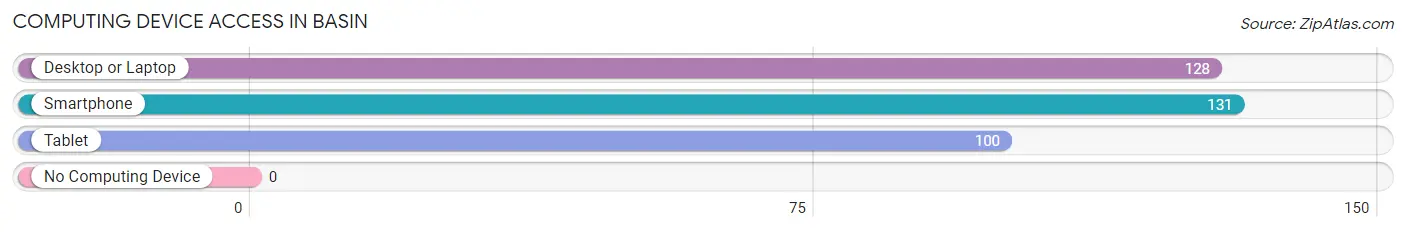
| Device Type | # Households | % Households |
| Desktop or Laptop | 128 | 78.0% |
| Smartphone | 131 | 79.9% |
| Tablet | 100 | 61.0% |
| No Computing Device | 0 | 0.0% |
| Total | 164 | 100.0% |
Internet Access in Basin
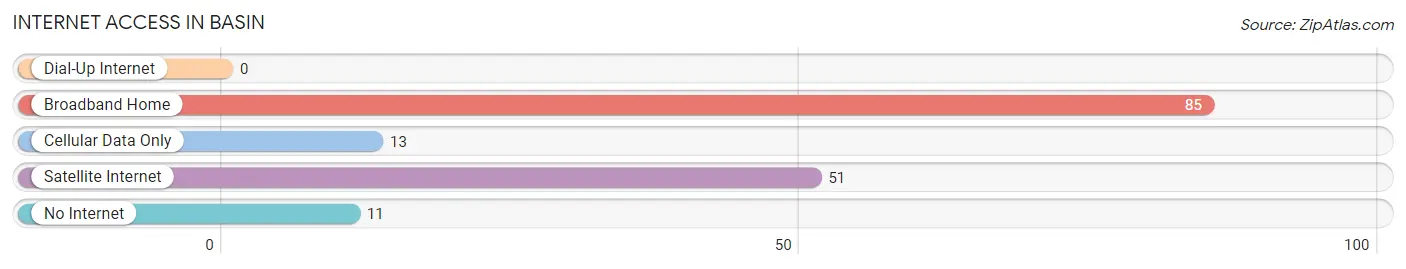
| Internet Type | # Households | % Households |
| Dial-Up Internet | 0 | 0.0% |
| Broadband Home | 85 | 51.8% |
| Cellular Data Only | 13 | 7.9% |
| Satellite Internet | 51 | 31.1% |
| No Internet | 11 | 6.7% |
| Total | 164 | 100.0% |
Basin Summary
Basin, Montana is a small town located in the south-central part of the state, in the foothills of the Rocky Mountains. It is situated in the Big Horn County, and is the county seat. The town was founded in 1883, and has a population of 1,845 as of the 2010 census.
Geography
Basin is located in the Big Horn Basin, a large intermontane basin in the Rocky Mountains. The town is situated at an elevation of 4,845 feet, and is surrounded by the Big Horn Mountains to the east, the Pryor Mountains to the south, and the Beartooth Mountains to the west. The town is located on the banks of the Big Horn River, which flows through the town and provides a source of irrigation for the surrounding area.
The climate in Basin is semi-arid, with hot summers and cold winters. The average annual temperature is 48°F, and the average annual precipitation is 11.5 inches.
Economy
Basin’s economy is largely based on agriculture and ranching. The town is home to several large cattle ranches, and the surrounding area is used for growing hay, wheat, and other crops. The town is also home to several small businesses, including a grocery store, a hardware store, and a few restaurants.
The town is also home to several tourist attractions, including the Big Horn County Museum, the Big Horn County Historical Society, and the Big Horn County Fairgrounds.
Demographics
As of the 2010 census, the population of Basin was 1,845. The racial makeup of the town was 95.3% White, 0.3% African American, 0.7% Native American, 0.2% Asian, 0.1% Pacific Islander, 1.2% from other races, and 2.3% from two or more races. Hispanic or Latino of any race were 3.2% of the population.
The median income for a household in Basin was $35,938, and the median income for a family was $41,250. The per capita income for the town was $17,845. About 11.2% of families and 14.2% of the population were below the poverty line, including 17.2% of those under age 18 and 8.3% of those age 65 or over.
Basin is served by the Big Horn County School District, which includes two elementary schools, one middle school, and one high school. The town is also home to a branch of the Big Horn County Library.
Basin is a small town with a rich history and a strong sense of community. The town is home to a diverse population, and is a great place to live and work. The town’s economy is largely based on agriculture and ranching, and the town is home to several tourist attractions. Basin is a great place to visit, and is a great place to call home.
Common Questions
What is the Total Population of Basin?
Total Population of Basin is 364.
What is the Total Male Population of Basin?
Total Male Population of Basin is 230.
What is the Total Female Population of Basin?
Total Female Population of Basin is 134.
What is the Ratio of Males per 100 Females in Basin?
There are 171.64 Males per 100 Females in Basin.
What is the Ratio of Females per 100 Males in Basin?
There are 58.26 Females per 100 Males in Basin.
What is the Median Population Age in Basin?
Median Population Age in Basin is 54.8 Years.
What is the Average Family Size in Basin
Average Family Size in Basin is 2.9 People.
What is the Average Household Size in Basin
Average Household Size in Basin is 2.2 People.
What is Per Capita Income in Basin?
Per Capita income in Basin is $42,073.
What is the Median Household income in Basin?
Median Household Income in Basin is $49,250.
What is Inequality or Gini Index in Basin?
Inequality or Gini Index in Basin is 0.47.
How Large is the Labor Force in Basin?
There are 190 People in the Labor Forcein in Basin.
What is the Percentage of People in the Labor Force in Basin?
57.6% of People are in the Labor Force in Basin.