Horn Lake, MS
Horn Lake Map
Horn Lake Overview
26,652
TOTAL POPULATION
12,353
MALE POPULATION
14,299
FEMALE POPULATION
86.39
MALES / 100 FEMALES
115.75
FEMALES / 100 MALES
35.5
MEDIAN AGE
3.3
AVG FAMILY SIZE
2.7
AVG HOUSEHOLD SIZE
$26,341
PER CAPITA INCOME
$65,706
AVG FAMILY INCOME
$57,111
AVG HOUSEHOLD INCOME
14.2%
WAGE / INCOME GAP [ % ]
85.8¢/ $1
WAGE / INCOME GAP [ $ ]
$14,243
FAMILY INCOME DEFICIT
0.40
INEQUALITY / GINI INDEX
14,160
LABOR FORCE [ PEOPLE ]
66.7%
PERCENT IN LABOR FORCE
7.9%
UNEMPLOYMENT RATE
Horn Lake Zip Codes
Horn Lake Area Codes
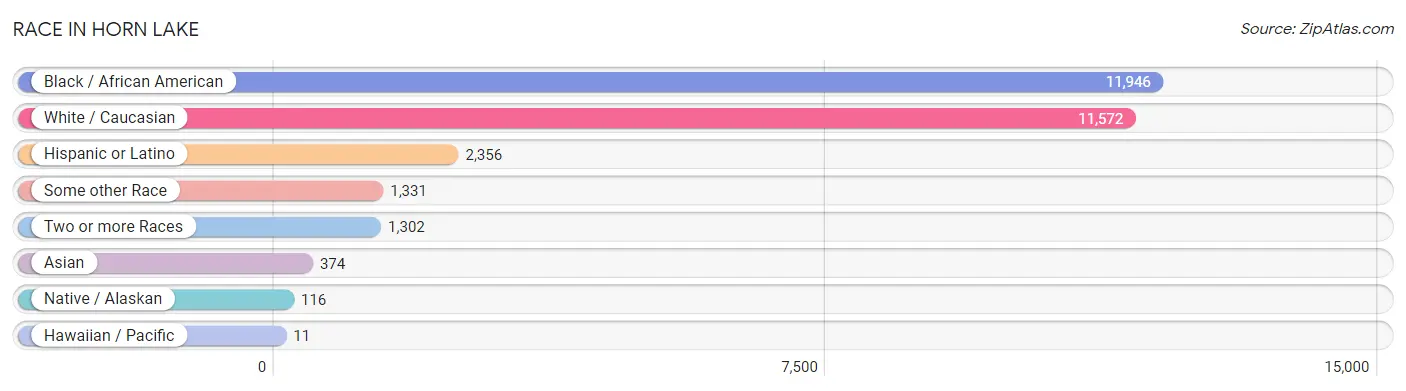
Race in Horn Lake
The most populous races in Horn Lake are Black / African American (11,946 | 44.8%), White / Caucasian (11,572 | 43.4%), and Hispanic or Latino (2,356 | 8.8%).
| Race | # Population | % Population |
| Asian | 374 | 1.4% |
| Black / African American | 11,946 | 44.8% |
| Hawaiian / Pacific | 11 | 0.0% |
| Hispanic or Latino | 2,356 | 8.8% |
| Native / Alaskan | 116 | 0.4% |
| White / Caucasian | 11,572 | 43.4% |
| Two or more Races | 1,302 | 4.9% |
| Some other Race | 1,331 | 5.0% |
| Total | 26,652 | 100.0% |
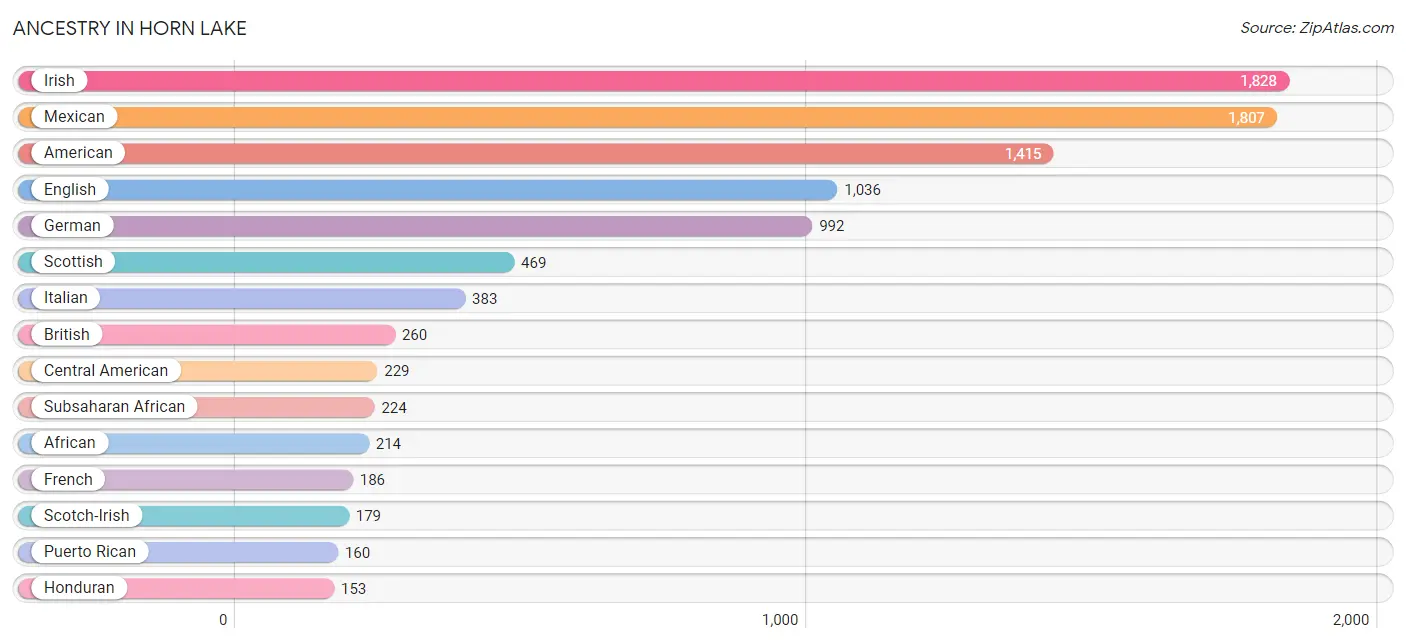
Ancestry in Horn Lake
The most populous ancestries reported in Horn Lake are Irish (1,828 | 6.9%), Mexican (1,807 | 6.8%), American (1,415 | 5.3%), English (1,036 | 3.9%), and German (992 | 3.7%), together accounting for 26.6% of all Horn Lake residents.
| Ancestry | # Population | % Population |
| African | 214 | 0.8% |
| American | 1,415 | 5.3% |
| Arab | 127 | 0.5% |
| Bhutanese | 6 | 0.0% |
| Blackfeet | 2 | 0.0% |
| British | 260 | 1.0% |
| Burmese | 47 | 0.2% |
| Cajun | 11 | 0.0% |
| Canadian | 29 | 0.1% |
| Central American | 229 | 0.9% |
| Chickasaw | 12 | 0.1% |
| Costa Rican | 7 | 0.0% |
| Creek | 2 | 0.0% |
| Cuban | 19 | 0.1% |
| Dutch | 63 | 0.2% |
| English | 1,036 | 3.9% |
| European | 122 | 0.5% |
| French | 186 | 0.7% |
| French Canadian | 70 | 0.3% |
| German | 992 | 3.7% |
| Greek | 11 | 0.0% |
| Guamanian / Chamorro | 13 | 0.1% |
| Guatemalan | 11 | 0.0% |
| Honduran | 153 | 0.6% |
| Hungarian | 3 | 0.0% |
| Indian (Asian) | 59 | 0.2% |
| Iranian | 18 | 0.1% |
| Irish | 1,828 | 6.9% |
| Italian | 383 | 1.4% |
| Jamaican | 8 | 0.0% |
| Japanese | 64 | 0.2% |
| Korean | 97 | 0.4% |
| Laotian | 75 | 0.3% |
| Lebanese | 105 | 0.4% |
| Mexican | 1,807 | 6.8% |
| Moroccan | 17 | 0.1% |
| Native Hawaiian | 80 | 0.3% |
| New Zealander | 16 | 0.1% |
| Norwegian | 25 | 0.1% |
| Peruvian | 75 | 0.3% |
| Polish | 45 | 0.2% |
| Portuguese | 46 | 0.2% |
| Puerto Rican | 160 | 0.6% |
| Puget Sound Salish | 62 | 0.2% |
| Russian | 25 | 0.1% |
| Salvadoran | 58 | 0.2% |
| Scandinavian | 39 | 0.2% |
| Scotch-Irish | 179 | 0.7% |
| Scottish | 469 | 1.8% |
| South American | 80 | 0.3% |
| Spaniard | 35 | 0.1% |
| Sri Lankan | 65 | 0.2% |
| Subsaharan African | 224 | 0.8% |
| Swedish | 45 | 0.2% |
| Swiss | 9 | 0.0% |
| Thai | 81 | 0.3% |
| Uruguayan | 5 | 0.0% | View All 57 Rows |
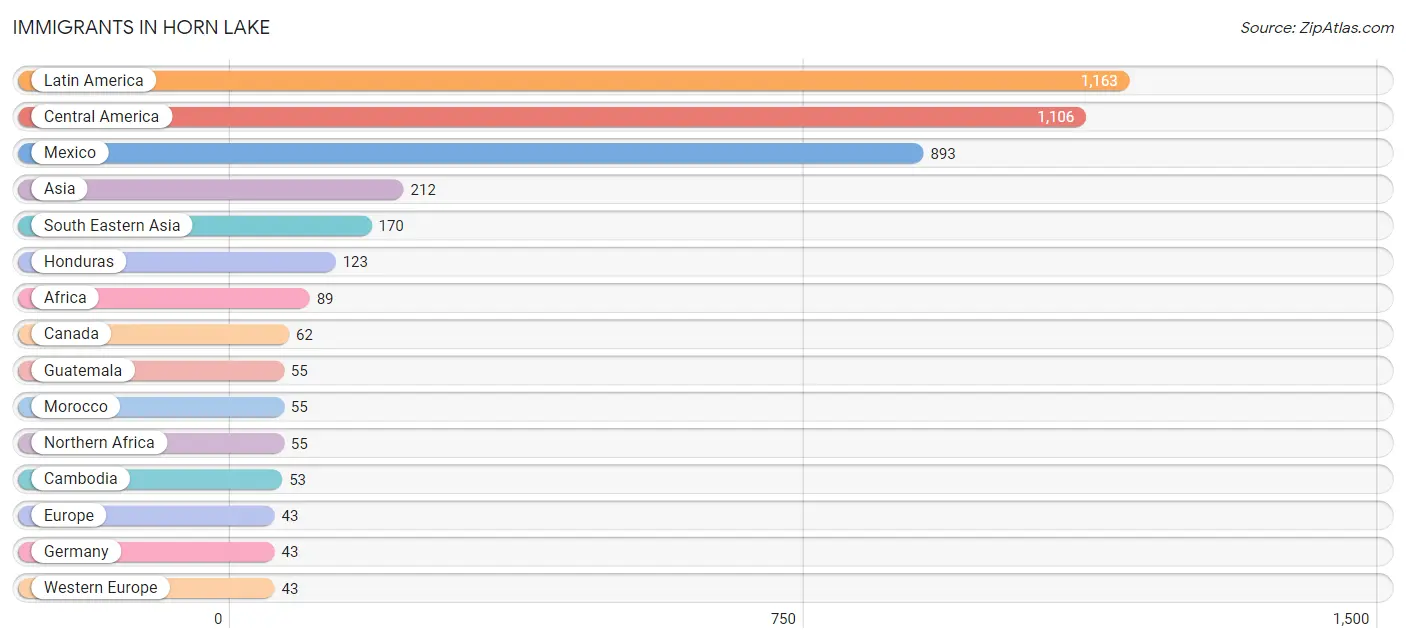
Immigrants in Horn Lake
The most numerous immigrant groups reported in Horn Lake came from Latin America (1,163 | 4.4%), Central America (1,106 | 4.2%), Mexico (893 | 3.4%), Asia (212 | 0.8%), and South Eastern Asia (170 | 0.6%), together accounting for 13.3% of all Horn Lake residents.
| Immigration Origin | # Population | % Population |
| Africa | 89 | 0.3% |
| Asia | 212 | 0.8% |
| Cambodia | 53 | 0.2% |
| Canada | 62 | 0.2% |
| Caribbean | 19 | 0.1% |
| Central America | 1,106 | 4.2% |
| Costa Rica | 7 | 0.0% |
| Cuba | 19 | 0.1% |
| Eastern Africa | 16 | 0.1% |
| El Salvador | 28 | 0.1% |
| Europe | 43 | 0.2% |
| Germany | 43 | 0.2% |
| Guatemala | 55 | 0.2% |
| Honduras | 123 | 0.5% |
| India | 24 | 0.1% |
| Indonesia | 41 | 0.2% |
| Iran | 18 | 0.1% |
| Laos | 1 | 0.0% |
| Latin America | 1,163 | 4.4% |
| Mexico | 893 | 3.4% |
| Morocco | 55 | 0.2% |
| Northern Africa | 55 | 0.2% |
| Oceania | 16 | 0.1% |
| Peru | 33 | 0.1% |
| Philippines | 15 | 0.1% |
| Singapore | 30 | 0.1% |
| South America | 38 | 0.1% |
| South Central Asia | 42 | 0.2% |
| South Eastern Asia | 170 | 0.6% |
| Uruguay | 5 | 0.0% |
| Vietnam | 30 | 0.1% |
| Western Africa | 14 | 0.1% |
| Western Europe | 43 | 0.2% | View All 33 Rows |
Sex and Age in Horn Lake
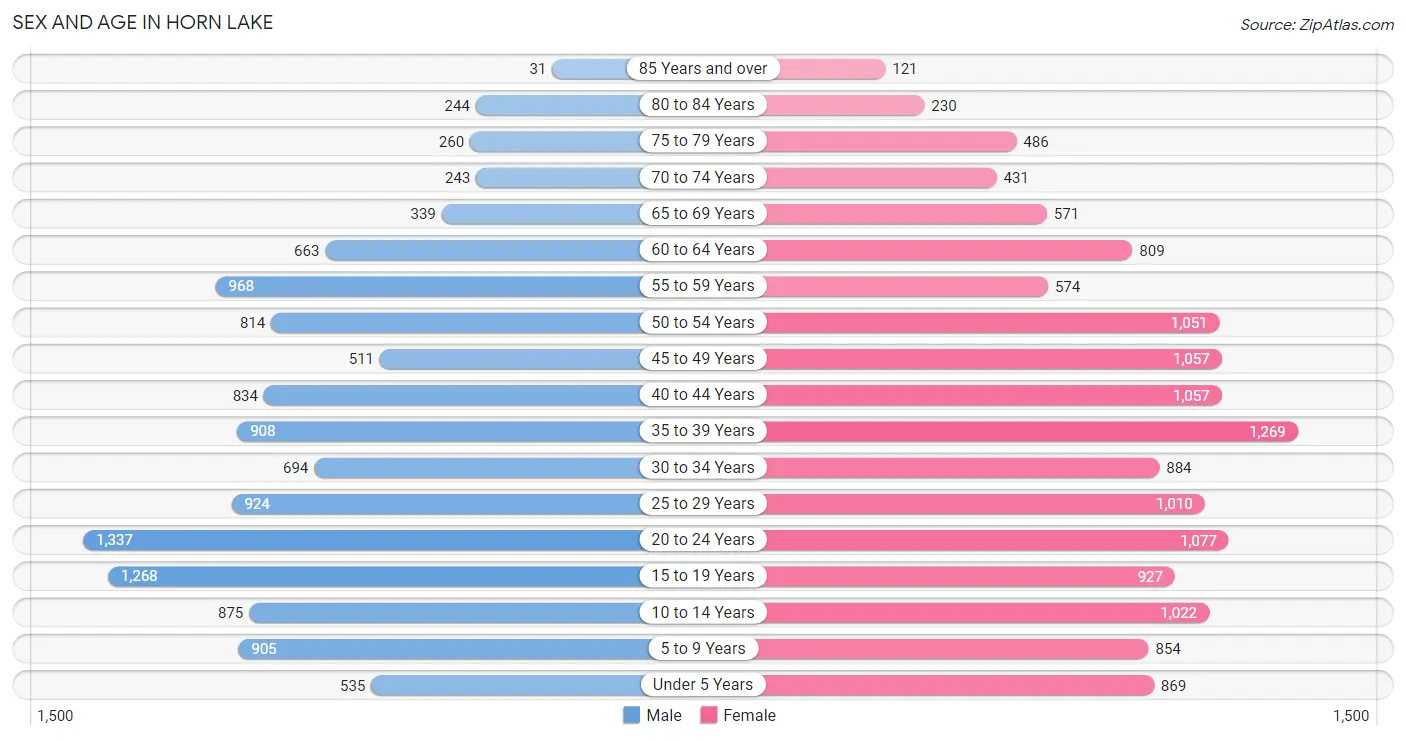
Sex and Age in Horn Lake
The most populous age groups in Horn Lake are 20 to 24 Years (1,337 | 10.8%) for men and 35 to 39 Years (1,269 | 8.9%) for women.
| Age Bracket | Male | Female |
| Under 5 Years | 535 (4.3%) | 869 (6.1%) |
| 5 to 9 Years | 905 (7.3%) | 854 (6.0%) |
| 10 to 14 Years | 875 (7.1%) | 1,022 (7.1%) |
| 15 to 19 Years | 1,268 (10.3%) | 927 (6.5%) |
| 20 to 24 Years | 1,337 (10.8%) | 1,077 (7.5%) |
| 25 to 29 Years | 924 (7.5%) | 1,010 (7.1%) |
| 30 to 34 Years | 694 (5.6%) | 884 (6.2%) |
| 35 to 39 Years | 908 (7.3%) | 1,269 (8.9%) |
| 40 to 44 Years | 834 (6.8%) | 1,057 (7.4%) |
| 45 to 49 Years | 511 (4.1%) | 1,057 (7.4%) |
| 50 to 54 Years | 814 (6.6%) | 1,051 (7.3%) |
| 55 to 59 Years | 968 (7.8%) | 574 (4.0%) |
| 60 to 64 Years | 663 (5.4%) | 809 (5.7%) |
| 65 to 69 Years | 339 (2.7%) | 571 (4.0%) |
| 70 to 74 Years | 243 (2.0%) | 431 (3.0%) |
| 75 to 79 Years | 260 (2.1%) | 486 (3.4%) |
| 80 to 84 Years | 244 (2.0%) | 230 (1.6%) |
| 85 Years and over | 31 (0.3%) | 121 (0.9%) |
| Total | 12,353 (100.0%) | 14,299 (100.0%) |
Families and Households in Horn Lake
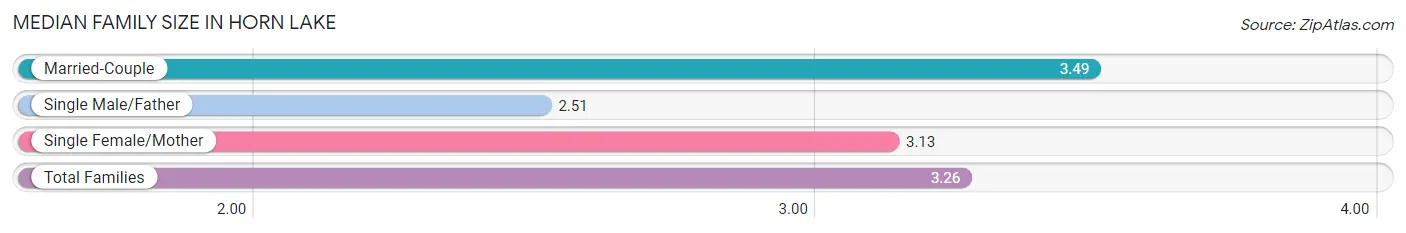
Median Family Size in Horn Lake
The median family size in Horn Lake is 3.26 persons per family, with married-couple families (3,869 | 57.5%) accounting for the largest median family size of 3.49 persons per family. On the other hand, single male/father families (760 | 11.3%) represent the smallest median family size with 2.51 persons per family.
| Family Type | # Families | Family Size |
| Married-Couple | 3,869 (57.5%) | 3.49 |
| Single Male/Father | 760 (11.3%) | 2.51 |
| Single Female/Mother | 2,100 (31.2%) | 3.13 |
| Total Families | 6,729 (100.0%) | 3.26 |
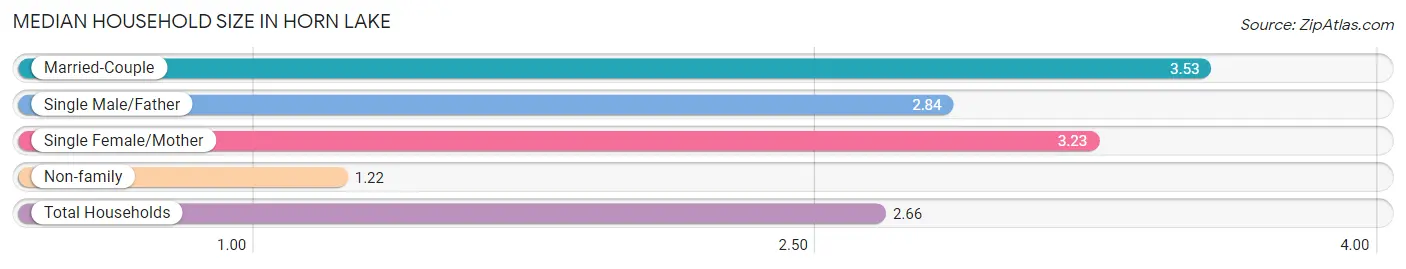
Median Household Size in Horn Lake
The median household size in Horn Lake is 2.66 persons per household, with married-couple households (3,869 | 38.7%) accounting for the largest median household size of 3.53 persons per household. non-family households (3,269 | 32.7%) represent the smallest median household size with 1.22 persons per household.
| Household Type | # Households | Household Size |
| Married-Couple | 3,869 (38.7%) | 3.53 |
| Single Male/Father | 760 (7.6%) | 2.84 |
| Single Female/Mother | 2,100 (21.0%) | 3.23 |
| Non-family | 3,269 (32.7%) | 1.22 |
| Total Households | 9,998 (100.0%) | 2.66 |
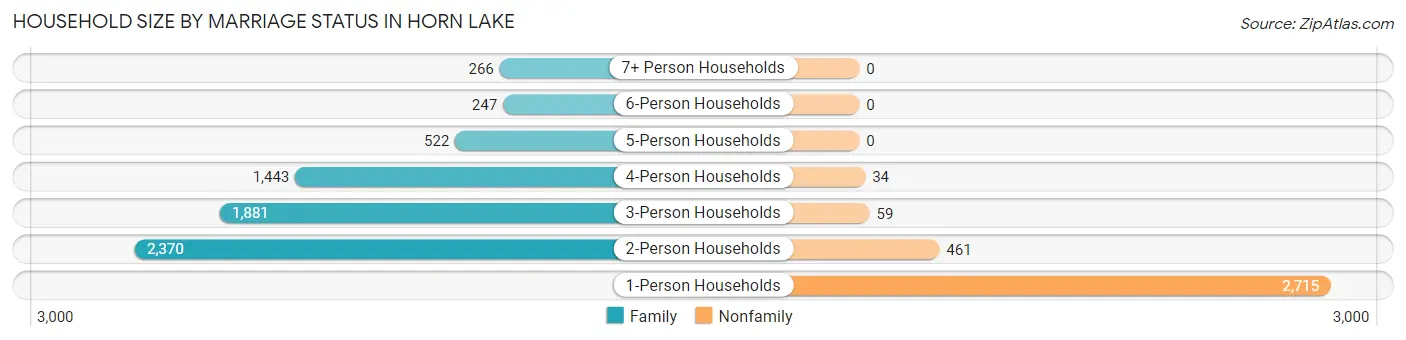
Household Size by Marriage Status in Horn Lake
Out of a total of 9,998 households in Horn Lake, 6,729 (67.3%) are family households, while 3,269 (32.7%) are nonfamily households. The most numerous type of family households are 2-person households, comprising 2,370, and the most common type of nonfamily households are 1-person households, comprising 2,715.
| Household Size | Family Households | Nonfamily Households |
| 1-Person Households | - | 2,715 (27.2%) |
| 2-Person Households | 2,370 (23.7%) | 461 (4.6%) |
| 3-Person Households | 1,881 (18.8%) | 59 (0.6%) |
| 4-Person Households | 1,443 (14.4%) | 34 (0.3%) |
| 5-Person Households | 522 (5.2%) | 0 (0.0%) |
| 6-Person Households | 247 (2.5%) | 0 (0.0%) |
| 7+ Person Households | 266 (2.7%) | 0 (0.0%) |
| Total | 6,729 (67.3%) | 3,269 (32.7%) |
Female Fertility in Horn Lake
Fertility by Age in Horn Lake
Average fertility rate in Horn Lake is 39.0 births per 1,000 women. Women in the age bracket of 20 to 34 years have the highest fertility rate with 61.0 births per 1,000 women. Women in the age bracket of 20 to 34 years acount for 61.6% of all women with births.
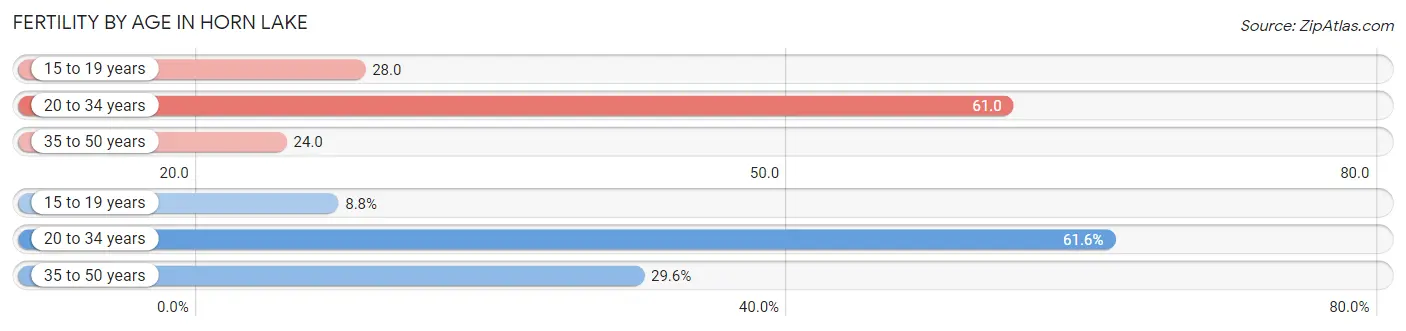
| Age Bracket | Women with Births | Births / 1,000 Women |
| 15 to 19 years | 26 (8.8%) | 28.0 |
| 20 to 34 years | 181 (61.6%) | 61.0 |
| 35 to 50 years | 87 (29.6%) | 24.0 |
| Total | 294 (100.0%) | 39.0 |
Fertility by Age by Marriage Status in Horn Lake
41.8% of women with births (294) in Horn Lake are married. The highest percentage of unmarried women with births falls into 15 to 19 years age bracket with 100.0% of them unmarried at the time of birth, while the lowest percentage of unmarried women with births belong to 35 to 50 years age bracket with 23.0% of them unmarried.
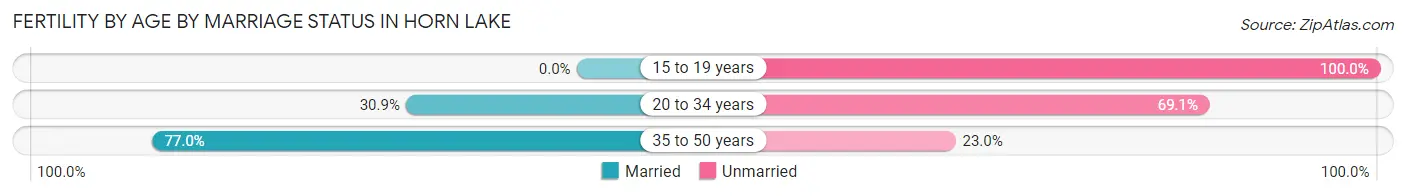
| Age Bracket | Married | Unmarried |
| 15 to 19 years | 0 (0.0%) | 26 (100.0%) |
| 20 to 34 years | 56 (30.9%) | 125 (69.1%) |
| 35 to 50 years | 67 (77.0%) | 20 (23.0%) |
| Total | 123 (41.8%) | 171 (58.2%) |
Fertility by Education in Horn Lake
Average fertility rate in Horn Lake is 39.0 births per 1,000 women. Women with the education attainment of less than high school have the highest fertility rate of 65.0 births per 1,000 women, while women with the education attainment of bachelor's degree have the lowest fertility at 26.0 births per 1,000 women. Women with the education attainment of less than high school represent 32.0% of all women with births.
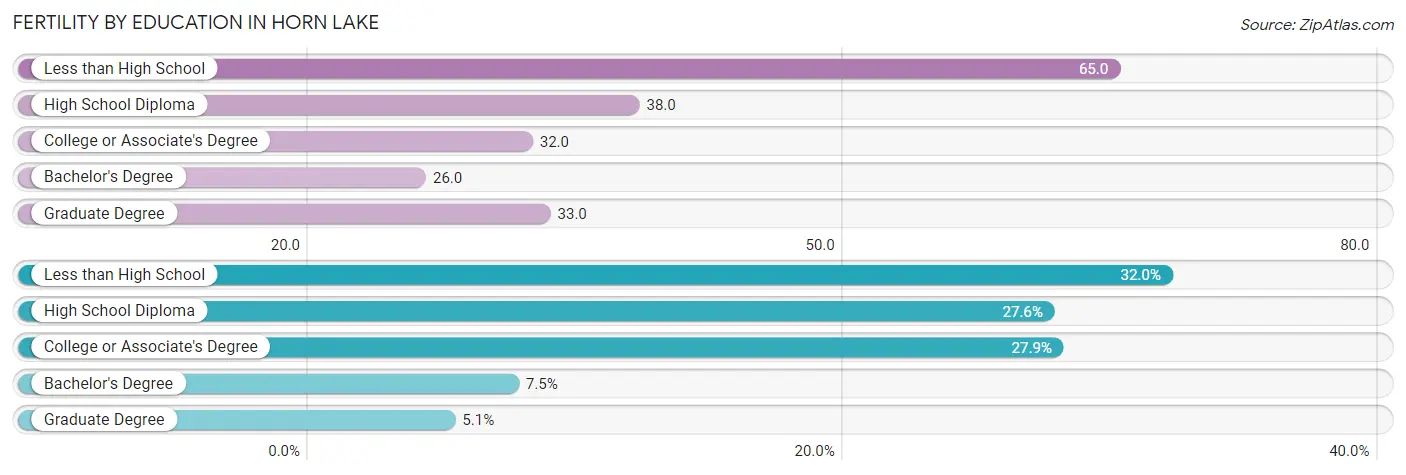
| Educational Attainment | Women with Births | Births / 1,000 Women |
| Less than High School | 94 (32.0%) | 65.0 |
| High School Diploma | 81 (27.6%) | 38.0 |
| College or Associate's Degree | 82 (27.9%) | 32.0 |
| Bachelor's Degree | 22 (7.5%) | 26.0 |
| Graduate Degree | 15 (5.1%) | 33.0 |
| Total | 294 (100.0%) | 39.0 |
Fertility by Education by Marriage Status in Horn Lake
58.2% of women with births in Horn Lake are unmarried. Women with the educational attainment of graduate degree are most likely to be married with 100.0% of them married at childbirth, while women with the educational attainment of bachelor's degree are least likely to be married with 100.0% of them unmarried at childbirth.
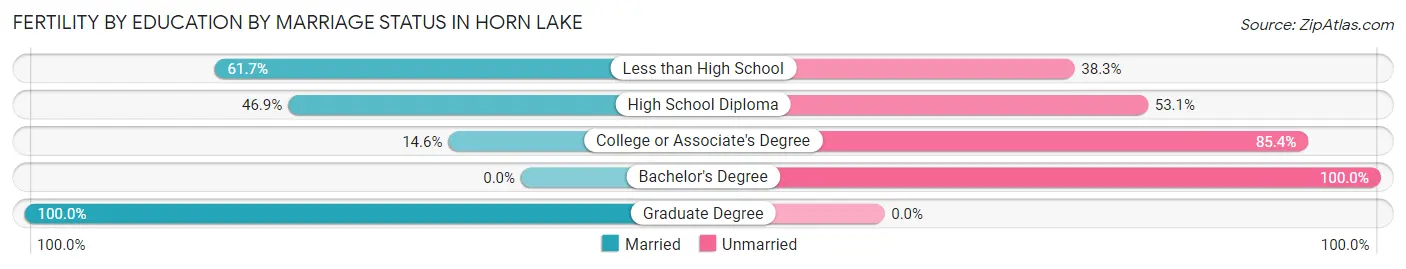
| Educational Attainment | Married | Unmarried |
| Less than High School | 58 (61.7%) | 36 (38.3%) |
| High School Diploma | 38 (46.9%) | 43 (53.1%) |
| College or Associate's Degree | 12 (14.6%) | 70 (85.4%) |
| Bachelor's Degree | 0 (0.0%) | 22 (100.0%) |
| Graduate Degree | 15 (100.0%) | 0 (0.0%) |
| Total | 123 (41.8%) | 171 (58.2%) |
Income in Horn Lake
Income Overview in Horn Lake
Per Capita Income in Horn Lake is $26,341, while median incomes of families and households are $65,706 and $57,111 respectively.
| Characteristic | Number | Measure |
| Per Capita Income | 26,652 | $26,341 |
| Median Family Income | 6,729 | $65,706 |
| Mean Family Income | 6,729 | $78,633 |
| Median Household Income | 9,998 | $57,111 |
| Mean Household Income | 9,998 | $68,820 |
| Income Deficit | 6,729 | $14,243 |
| Wage / Income Gap (%) | 26,652 | 14.21% |
| Wage / Income Gap ($) | 26,652 | 85.79¢ per $1 |
| Gini / Inequality Index | 26,652 | 0.40 |
Earnings by Sex in Horn Lake
Average Earnings in Horn Lake are $34,380, $36,641 for men and $31,434 for women, a difference of 14.2%.
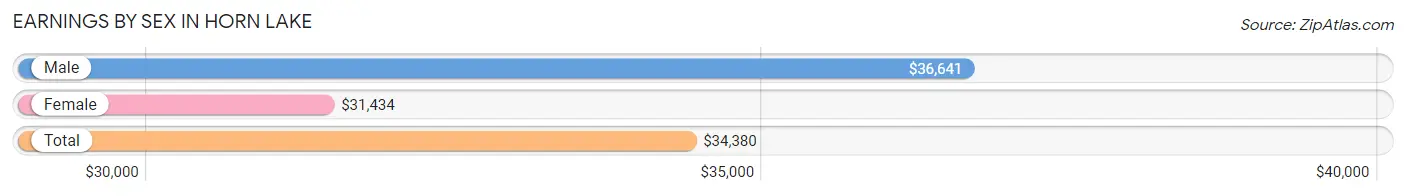
| Sex | Number | Average Earnings |
| Male | 7,172 (49.5%) | $36,641 |
| Female | 7,316 (50.5%) | $31,434 |
| Total | 14,488 (100.0%) | $34,380 |
Earnings by Sex by Income Bracket in Horn Lake
The most common earnings brackets in Horn Lake are $30,000 to $34,999 for men (1,008 | 14.1%) and $30,000 to $34,999 for women (675 | 9.2%).
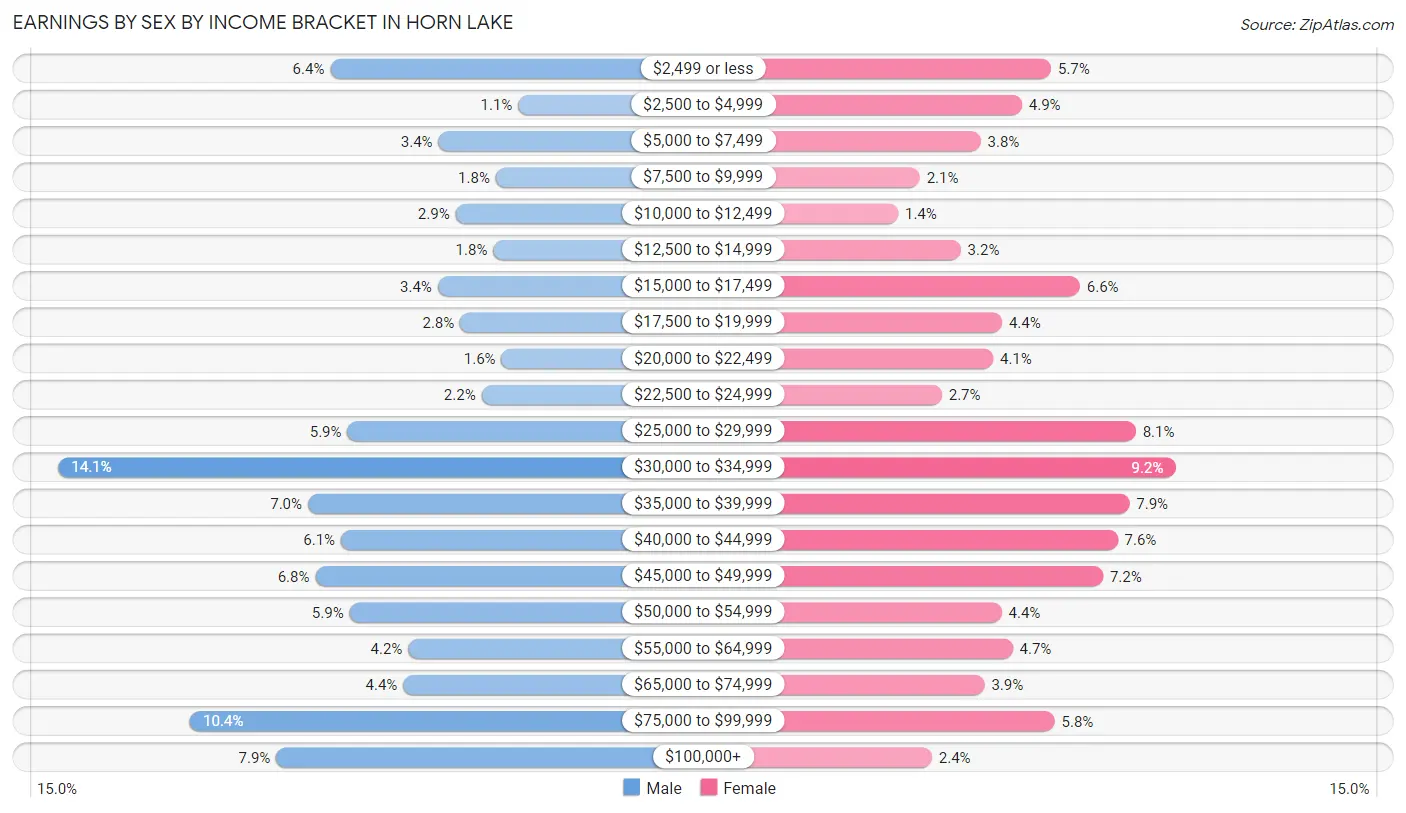
| Income | Male | Female |
| $2,499 or less | 460 (6.4%) | 420 (5.7%) |
| $2,500 to $4,999 | 81 (1.1%) | 360 (4.9%) |
| $5,000 to $7,499 | 242 (3.4%) | 275 (3.8%) |
| $7,500 to $9,999 | 126 (1.8%) | 150 (2.1%) |
| $10,000 to $12,499 | 207 (2.9%) | 105 (1.4%) |
| $12,500 to $14,999 | 131 (1.8%) | 234 (3.2%) |
| $15,000 to $17,499 | 243 (3.4%) | 479 (6.6%) |
| $17,500 to $19,999 | 198 (2.8%) | 319 (4.4%) |
| $20,000 to $22,499 | 115 (1.6%) | 301 (4.1%) |
| $22,500 to $24,999 | 155 (2.2%) | 195 (2.7%) |
| $25,000 to $29,999 | 425 (5.9%) | 594 (8.1%) |
| $30,000 to $34,999 | 1,008 (14.1%) | 675 (9.2%) |
| $35,000 to $39,999 | 505 (7.0%) | 581 (7.9%) |
| $40,000 to $44,999 | 438 (6.1%) | 557 (7.6%) |
| $45,000 to $49,999 | 490 (6.8%) | 527 (7.2%) |
| $50,000 to $54,999 | 421 (5.9%) | 318 (4.3%) |
| $55,000 to $64,999 | 303 (4.2%) | 341 (4.7%) |
| $65,000 to $74,999 | 313 (4.4%) | 283 (3.9%) |
| $75,000 to $99,999 | 742 (10.3%) | 427 (5.8%) |
| $100,000+ | 569 (7.9%) | 175 (2.4%) |
| Total | 7,172 (100.0%) | 7,316 (100.0%) |
Earnings by Sex by Educational Attainment in Horn Lake
Average earnings in Horn Lake are $45,231 for men and $35,200 for women, a difference of 22.2%. Men with an educational attainment of graduate degree enjoy the highest average annual earnings of $83,190, while those with less than high school education earn the least with $34,621. Women with an educational attainment of graduate degree earn the most with the average annual earnings of $46,993, while those with less than high school education have the smallest earnings of $25,531.
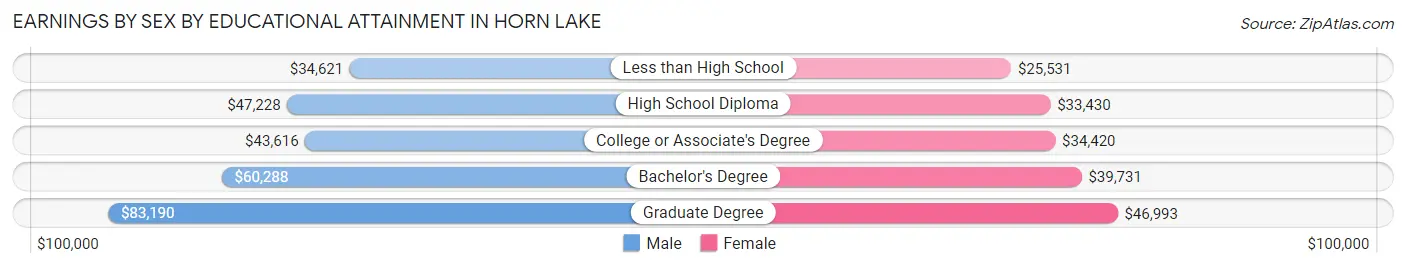
| Educational Attainment | Male Income | Female Income |
| Less than High School | $34,621 | $25,531 |
| High School Diploma | $47,228 | $33,430 |
| College or Associate's Degree | $43,616 | $34,420 |
| Bachelor's Degree | $60,288 | $39,731 |
| Graduate Degree | $83,190 | $46,993 |
| Total | $45,231 | $35,200 |
Family Income in Horn Lake
Family Income Brackets in Horn Lake
According to the Horn Lake family income data, there are 1,326 families falling into the $50,000 to $74,999 income range, which is the most common income bracket and makes up 19.7% of all families. Conversely, the $10,000 to $14,999 income bracket is the least frequent group with only 141 families (2.1%) belonging to this category.
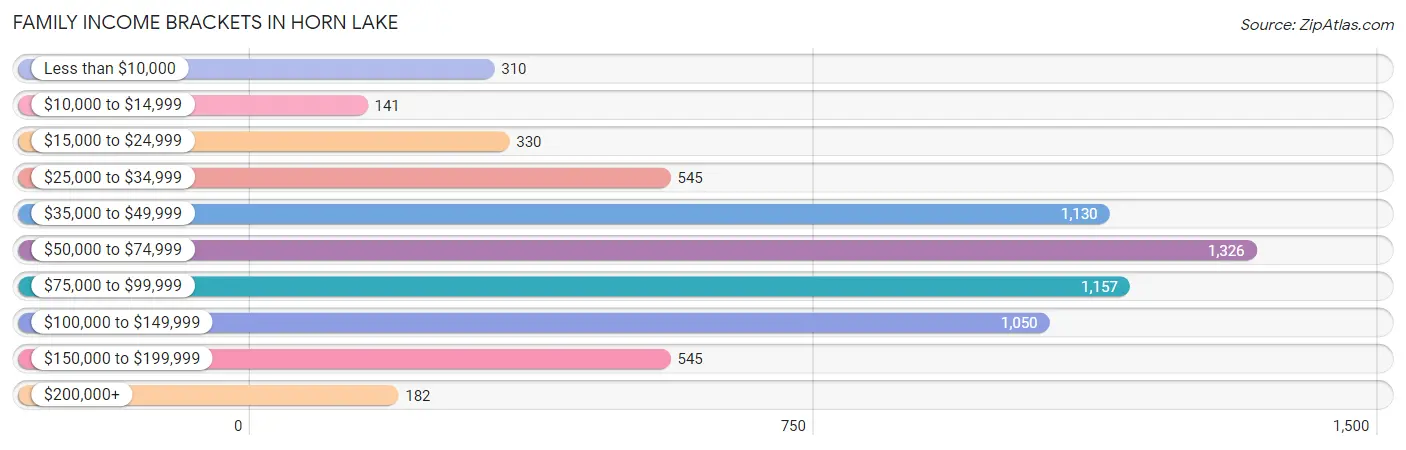
| Income Bracket | # Families | % Families |
| Less than $10,000 | 310 | 4.6% |
| $10,000 to $14,999 | 141 | 2.1% |
| $15,000 to $24,999 | 330 | 4.9% |
| $25,000 to $34,999 | 545 | 8.1% |
| $35,000 to $49,999 | 1,130 | 16.8% |
| $50,000 to $74,999 | 1,326 | 19.7% |
| $75,000 to $99,999 | 1,157 | 17.2% |
| $100,000 to $149,999 | 1,050 | 15.6% |
| $150,000 to $199,999 | 545 | 8.1% |
| $200,000+ | 182 | 2.7% |
Family Income by Famaliy Size in Horn Lake
3-person families (1,608 | 23.9%) account for the highest median family income in Horn Lake with $74,352 per family, while 2-person families (2,746 | 40.8%) have the highest median income of $30,839 per family member.
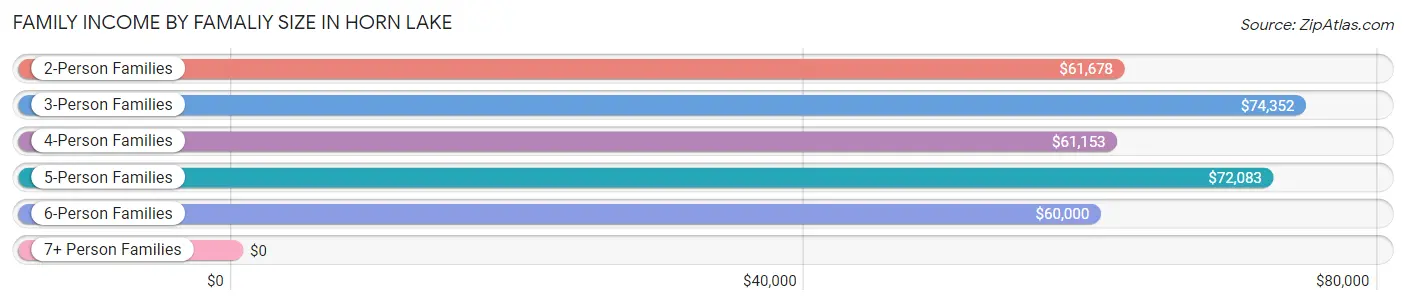
| Income Bracket | # Families | Median Income |
| 2-Person Families | 2,746 (40.8%) | $61,678 |
| 3-Person Families | 1,608 (23.9%) | $74,352 |
| 4-Person Families | 1,411 (21.0%) | $61,153 |
| 5-Person Families | 526 (7.8%) | $72,083 |
| 6-Person Families | 188 (2.8%) | $60,000 |
| 7+ Person Families | 250 (3.7%) | $0 |
| Total | 6,729 (100.0%) | $65,706 |
Family Income by Number of Earners in Horn Lake
The median family income in Horn Lake is $65,706, with families comprising 3+ earners (935) having the highest median family income of $106,008, while families with no earners (578) have the lowest median family income of $33,462, accounting for 13.9% and 8.6% of families, respectively.
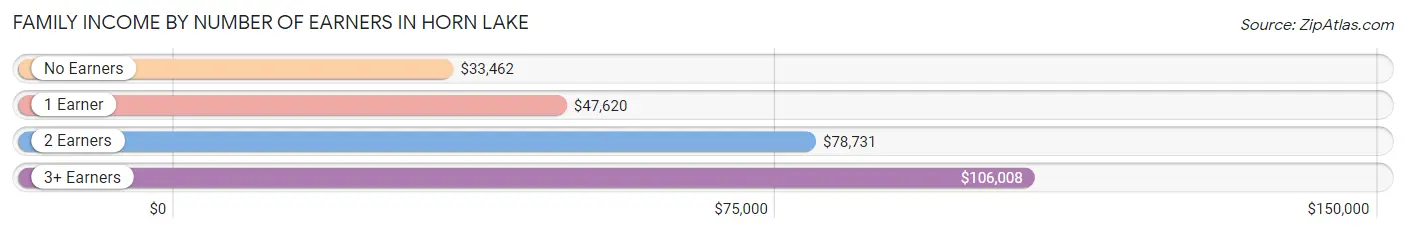
| Number of Earners | # Families | Median Income |
| No Earners | 578 (8.6%) | $33,462 |
| 1 Earner | 2,352 (34.9%) | $47,620 |
| 2 Earners | 2,864 (42.6%) | $78,731 |
| 3+ Earners | 935 (13.9%) | $106,008 |
| Total | 6,729 (100.0%) | $65,706 |
Household Income in Horn Lake
Household Income Brackets in Horn Lake
With 1,890 households falling in the category, the $50,000 to $74,999 income range is the most frequent in Horn Lake, accounting for 18.9% of all households. In contrast, only 200 households (2.0%) fall into the $200,000+ income bracket, making it the least populous group.
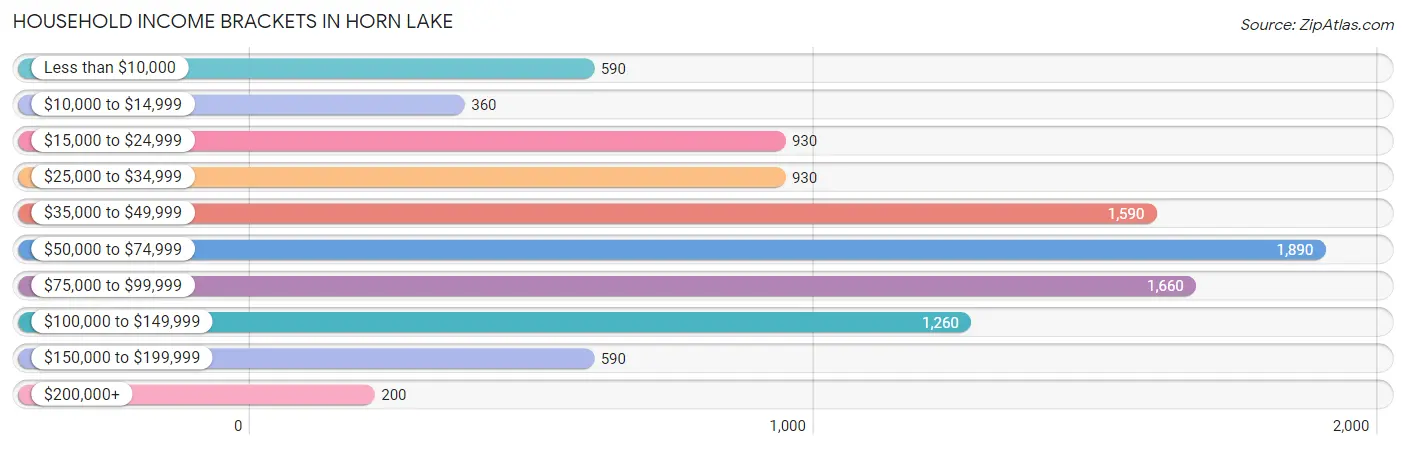
| Income Bracket | # Households | % Households |
| Less than $10,000 | 590 | 5.9% |
| $10,000 to $14,999 | 360 | 3.6% |
| $15,000 to $24,999 | 930 | 9.3% |
| $25,000 to $34,999 | 930 | 9.3% |
| $35,000 to $49,999 | 1,590 | 15.9% |
| $50,000 to $74,999 | 1,890 | 18.9% |
| $75,000 to $99,999 | 1,660 | 16.6% |
| $100,000 to $149,999 | 1,260 | 12.6% |
| $150,000 to $199,999 | 590 | 5.9% |
| $200,000+ | 200 | 2.0% |
Household Income by Householder Age in Horn Lake
The median household income in Horn Lake is $57,111, with the highest median household income of $61,054 found in the 45 to 64 years age bracket for the primary householder. A total of 3,702 households (37.0%) fall into this category. Meanwhile, the 65+ years age bracket for the primary householder has the lowest median household income of $35,197, with 1,764 households (17.6%) in this group.
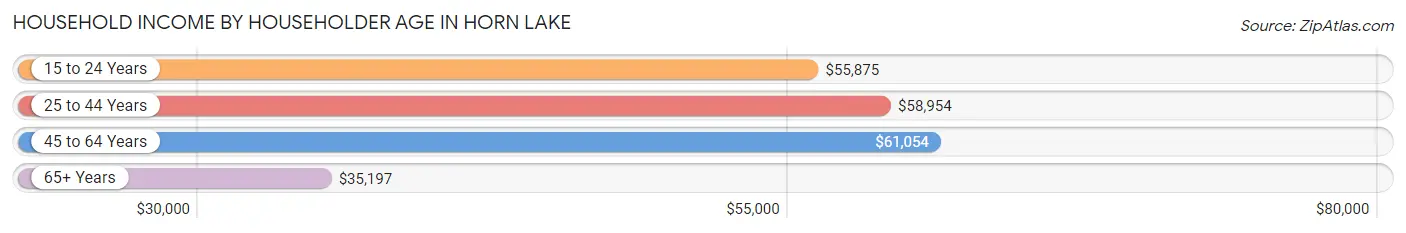
| Income Bracket | # Households | Median Income |
| 15 to 24 Years | 330 (3.3%) | $55,875 |
| 25 to 44 Years | 4,202 (42.0%) | $58,954 |
| 45 to 64 Years | 3,702 (37.0%) | $61,054 |
| 65+ Years | 1,764 (17.6%) | $35,197 |
| Total | 9,998 (100.0%) | $57,111 |
Poverty in Horn Lake
Income Below Poverty by Sex and Age in Horn Lake
With 13.0% poverty level for males and 19.2% for females among the residents of Horn Lake, 16 and 17 year old males and 12 to 14 year old females are the most vulnerable to poverty, with 192 males (30.6%) and 270 females (39.5%) in their respective age groups living below the poverty level.
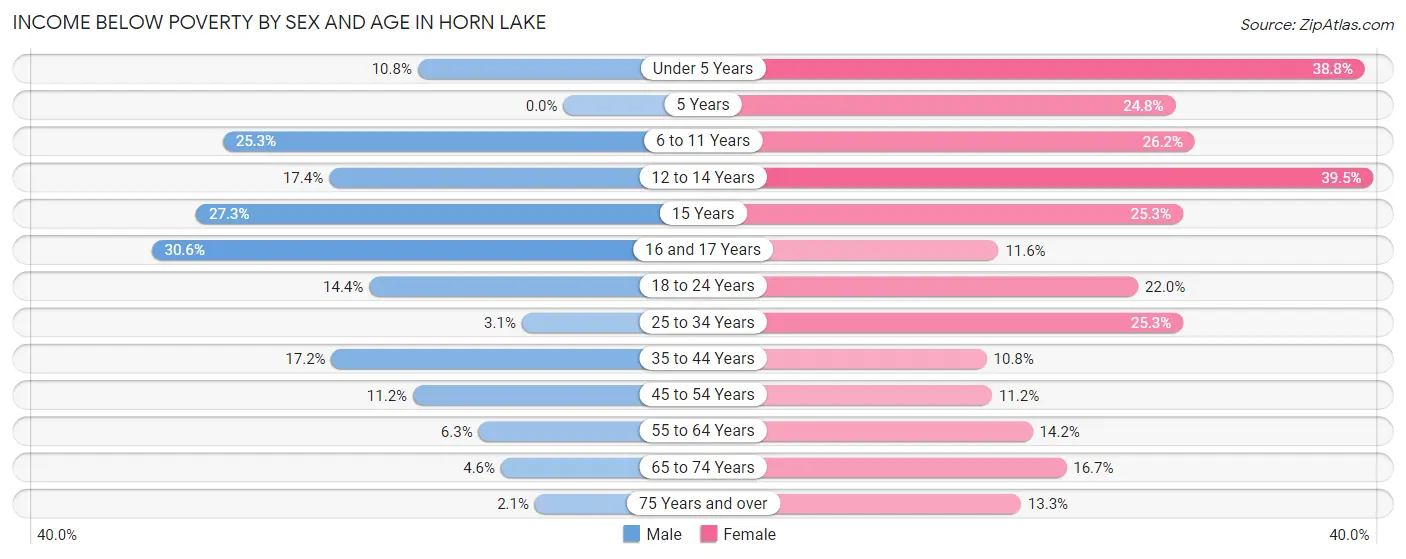
| Age Bracket | Male | Female |
| Under 5 Years | 56 (10.8%) | 332 (38.8%) |
| 5 Years | 0 (0.0%) | 51 (24.8%) |
| 6 to 11 Years | 315 (25.3%) | 254 (26.2%) |
| 12 to 14 Years | 83 (17.4%) | 270 (39.5%) |
| 15 Years | 57 (27.3%) | 39 (25.3%) |
| 16 and 17 Years | 192 (30.6%) | 55 (11.6%) |
| 18 to 24 Years | 255 (14.4%) | 303 (22.0%) |
| 25 to 34 Years | 50 (3.1%) | 480 (25.3%) |
| 35 to 44 Years | 300 (17.2%) | 250 (10.7%) |
| 45 to 54 Years | 148 (11.2%) | 235 (11.2%) |
| 55 to 64 Years | 101 (6.3%) | 196 (14.2%) |
| 65 to 74 Years | 27 (4.6%) | 167 (16.7%) |
| 75 Years and over | 11 (2.1%) | 108 (13.3%) |
| Total | 1,595 (13.0%) | 2,740 (19.2%) |
Income Above Poverty by Sex and Age in Horn Lake
According to the poverty statistics in Horn Lake, males aged 5 years and females aged 35 to 44 years are the age groups that are most secure financially, with 100.0% of males and 89.2% of females in these age groups living above the poverty line.
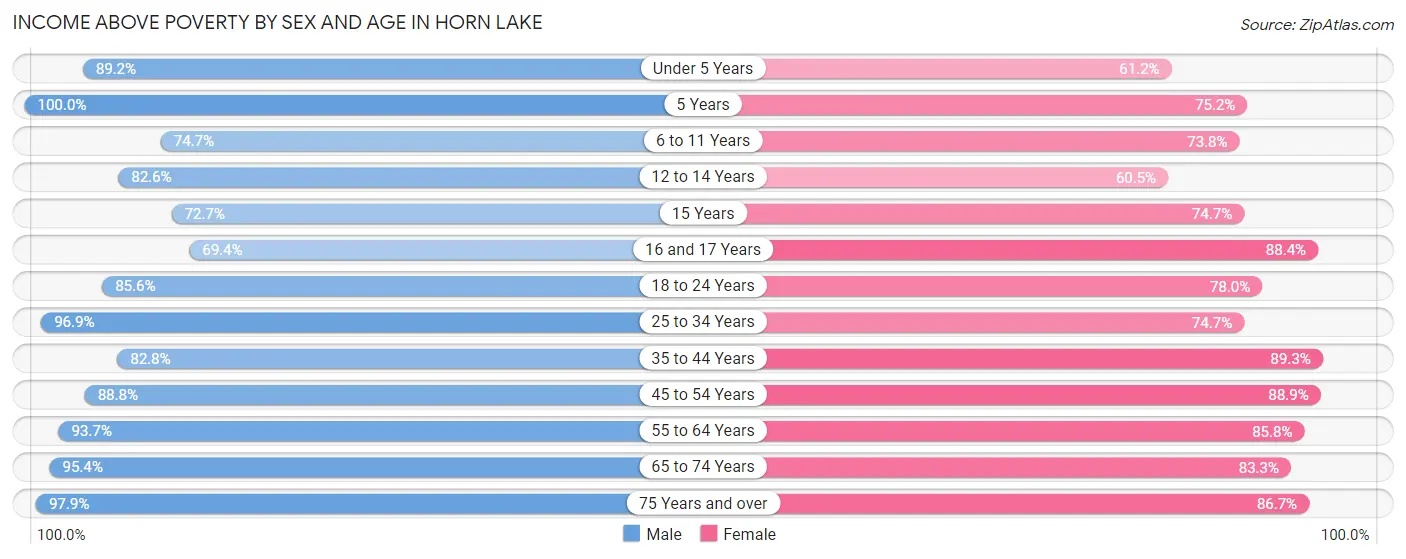
| Age Bracket | Male | Female |
| Under 5 Years | 462 (89.2%) | 523 (61.2%) |
| 5 Years | 52 (100.0%) | 155 (75.2%) |
| 6 to 11 Years | 931 (74.7%) | 715 (73.8%) |
| 12 to 14 Years | 394 (82.6%) | 414 (60.5%) |
| 15 Years | 152 (72.7%) | 115 (74.7%) |
| 16 and 17 Years | 436 (69.4%) | 418 (88.4%) |
| 18 to 24 Years | 1,513 (85.6%) | 1,074 (78.0%) |
| 25 to 34 Years | 1,568 (96.9%) | 1,414 (74.7%) |
| 35 to 44 Years | 1,442 (82.8%) | 2,076 (89.2%) |
| 45 to 54 Years | 1,177 (88.8%) | 1,873 (88.8%) |
| 55 to 64 Years | 1,503 (93.7%) | 1,187 (85.8%) |
| 65 to 74 Years | 555 (95.4%) | 835 (83.3%) |
| 75 Years and over | 509 (97.9%) | 704 (86.7%) |
| Total | 10,694 (87.0%) | 11,503 (80.8%) |
Income Below Poverty Among Married-Couple Families in Horn Lake
The poverty statistics for married-couple families in Horn Lake show that 5.2% or 201 of the total 3,869 families live below the poverty line. Families with 5 or more children have the highest poverty rate of 55.3%, comprising of 42 families. On the other hand, families with no children have the lowest poverty rate of 1.0%, which includes 22 families.
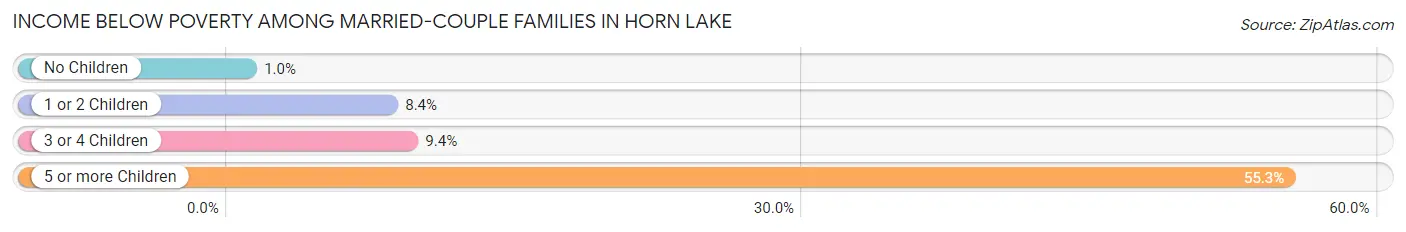
| Children | Above Poverty | Below Poverty |
| No Children | 2,172 (99.0%) | 22 (1.0%) |
| 1 or 2 Children | 1,183 (91.6%) | 108 (8.4%) |
| 3 or 4 Children | 279 (90.6%) | 29 (9.4%) |
| 5 or more Children | 34 (44.7%) | 42 (55.3%) |
| Total | 3,668 (94.8%) | 201 (5.2%) |
Income Below Poverty Among Single-Parent Households in Horn Lake
According to the poverty data in Horn Lake, 6.6% or 50 single-father households and 27.8% or 584 single-mother households are living below the poverty line. Among single-father households, those with 3 or 4 children have the highest poverty rate, with 28 households (40.6%) experiencing poverty. Likewise, among single-mother households, those with 5 or more children have the highest poverty rate, with 29 households (74.4%) falling below the poverty line.
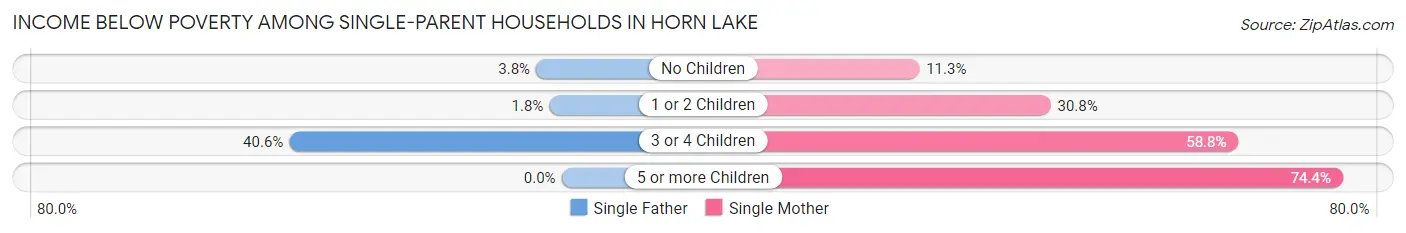
| Children | Single Father | Single Mother |
| No Children | 18 (3.8%) | 92 (11.3%) |
| 1 or 2 Children | 4 (1.8%) | 296 (30.8%) |
| 3 or 4 Children | 28 (40.6%) | 167 (58.8%) |
| 5 or more Children | 0 (0.0%) | 29 (74.4%) |
| Total | 50 (6.6%) | 584 (27.8%) |
Income Below Poverty Among Married-Couple vs Single-Parent Households in Horn Lake
The poverty data for Horn Lake shows that 201 of the married-couple family households (5.2%) and 634 of the single-parent households (22.2%) are living below the poverty level. Within the married-couple family households, those with 5 or more children have the highest poverty rate, with 42 households (55.3%) falling below the poverty line. Among the single-parent households, those with 5 or more children have the highest poverty rate, with 29 household (74.4%) living below poverty.
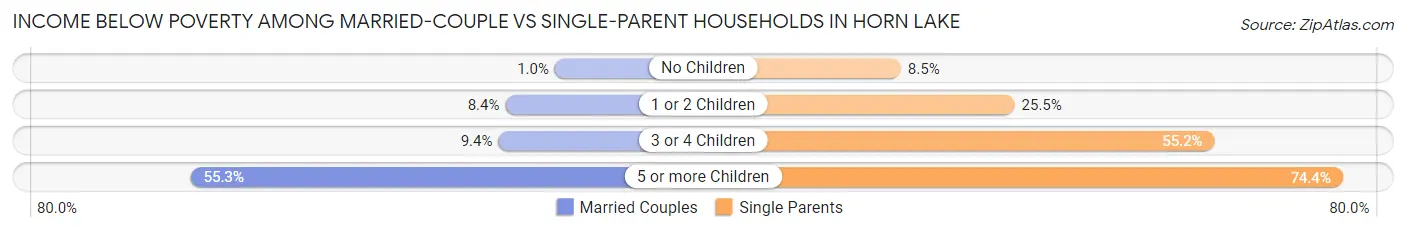
| Children | Married-Couple Families | Single-Parent Households |
| No Children | 22 (1.0%) | 110 (8.5%) |
| 1 or 2 Children | 108 (8.4%) | 300 (25.5%) |
| 3 or 4 Children | 29 (9.4%) | 195 (55.2%) |
| 5 or more Children | 42 (55.3%) | 29 (74.4%) |
| Total | 201 (5.2%) | 634 (22.2%) |
Employment Characteristics in Horn Lake
Employment by Class of Employer in Horn Lake
Among the 12,755 employed individuals in Horn Lake, private company employees (9,438 | 74.0%), not-for-profit organizations (838 | 6.6%), and local government employees (685 | 5.4%) make up the most common classes of employment.
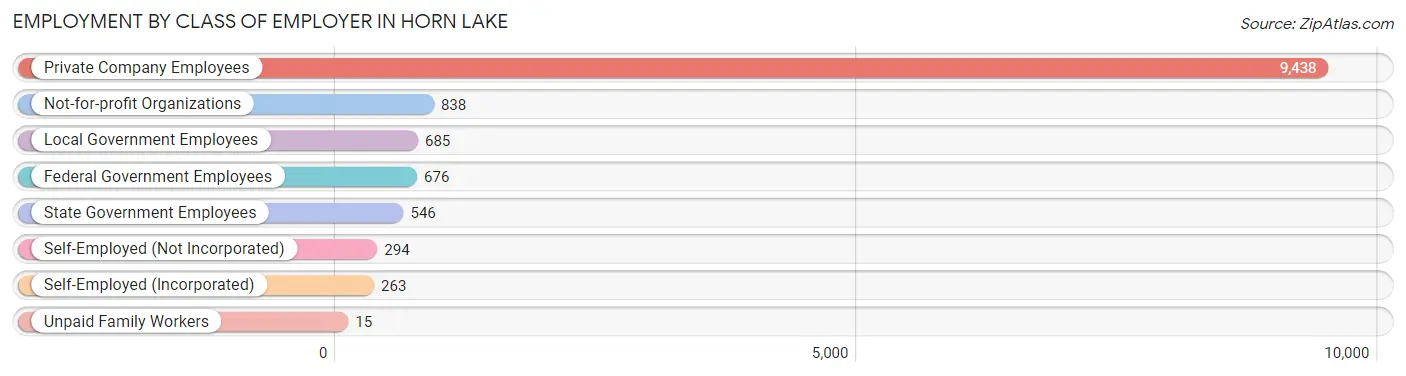
| Employer Class | # Employees | % Employees |
| Private Company Employees | 9,438 | 74.0% |
| Self-Employed (Incorporated) | 263 | 2.1% |
| Self-Employed (Not Incorporated) | 294 | 2.3% |
| Not-for-profit Organizations | 838 | 6.6% |
| Local Government Employees | 685 | 5.4% |
| State Government Employees | 546 | 4.3% |
| Federal Government Employees | 676 | 5.3% |
| Unpaid Family Workers | 15 | 0.1% |
| Total | 12,755 | 100.0% |
Employment Status by Age in Horn Lake
According to the labor force statistics for Horn Lake, out of the total population over 16 years of age (21,229), 66.7% or 14,160 individuals are in the labor force, with 7.9% or 1,119 of them unemployed. The age group with the highest labor force participation rate is 25 to 29 years, with 88.8% or 1,717 individuals in the labor force. Within the labor force, the 16 to 19 years age range has the highest percentage of unemployed individuals, with 28.0% or 200 of them being unemployed.
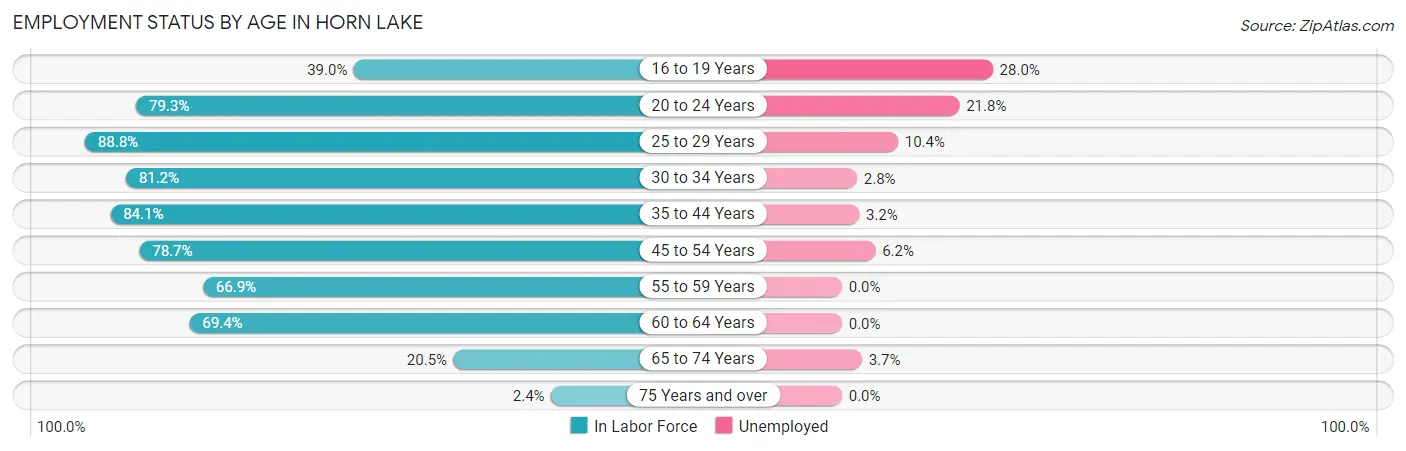
| Age Bracket | In Labor Force | Unemployed |
| 16 to 19 Years | 714 (39.0%) | 200 (28.0%) |
| 20 to 24 Years | 1,914 (79.3%) | 417 (21.8%) |
| 25 to 29 Years | 1,717 (88.8%) | 179 (10.4%) |
| 30 to 34 Years | 1,281 (81.2%) | 36 (2.8%) |
| 35 to 44 Years | 3,421 (84.1%) | 109 (3.2%) |
| 45 to 54 Years | 2,702 (78.7%) | 168 (6.2%) |
| 55 to 59 Years | 1,032 (66.9%) | 0 (0.0%) |
| 60 to 64 Years | 1,022 (69.4%) | 0 (0.0%) |
| 65 to 74 Years | 325 (20.5%) | 12 (3.7%) |
| 75 Years and over | 33 (2.4%) | 0 (0.0%) |
| Total | 14,160 (66.7%) | 1,119 (7.9%) |
Employment Status by Educational Attainment in Horn Lake
According to labor force statistics for Horn Lake, 79.7% of individuals (11,180) out of the total population between 25 and 64 years of age (14,027) are in the labor force, with 4.4% or 492 of them being unemployed. The group with the highest labor force participation rate are those with the educational attainment of bachelor's degree or higher, with 89.0% or 2,173 individuals in the labor force. Within the labor force, individuals with high school diploma education have the highest percentage of unemployment, with 6.9% or 265 of them being unemployed.
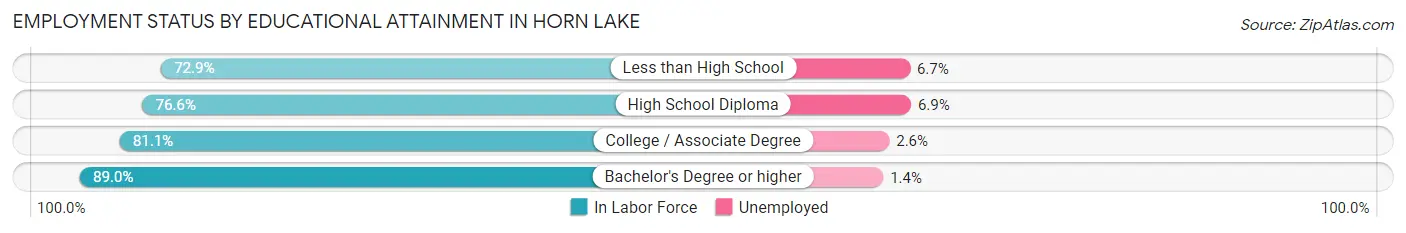
| Educational Attainment | In Labor Force | Unemployed |
| Less than High School | 1,473 (72.9%) | 135 (6.7%) |
| High School Diploma | 3,845 (76.6%) | 346 (6.9%) |
| College / Associate Degree | 3,687 (81.1%) | 118 (2.6%) |
| Bachelor's Degree or higher | 2,173 (89.0%) | 34 (1.4%) |
| Total | 11,180 (79.7%) | 617 (4.4%) |
Employment Occupations by Sex in Horn Lake
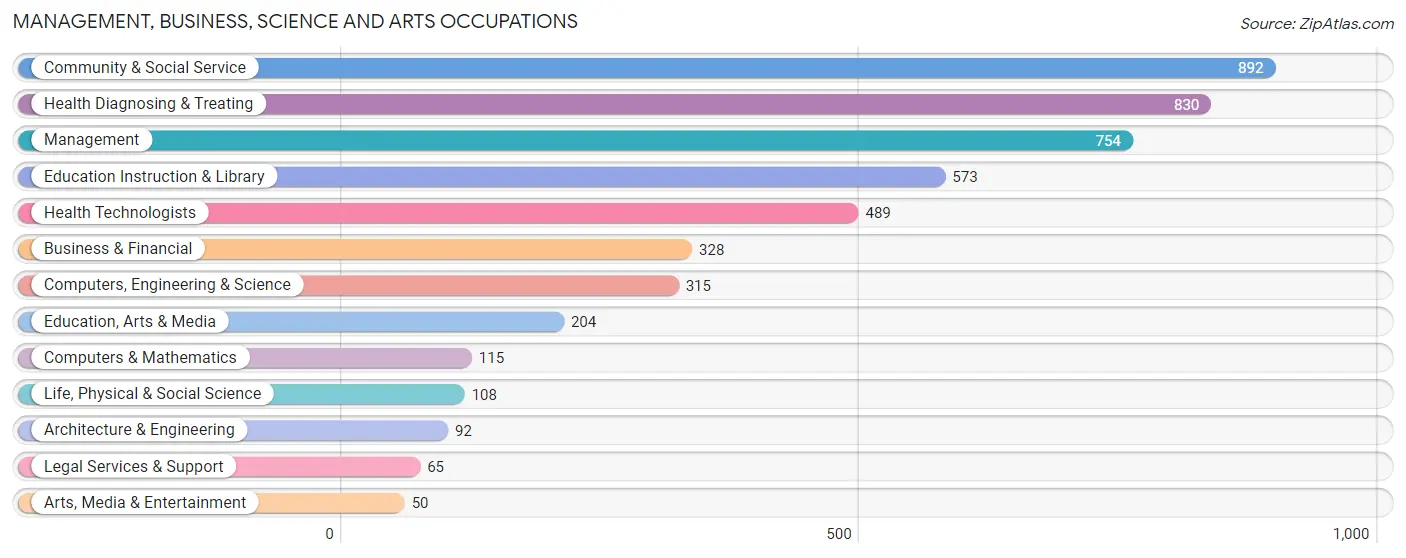
Management, Business, Science and Arts Occupations
The most common Management, Business, Science and Arts occupations in Horn Lake are Community & Social Service (892 | 6.9%), Health Diagnosing & Treating (830 | 6.4%), Management (754 | 5.8%), Education Instruction & Library (573 | 4.4%), and Health Technologists (489 | 3.8%).
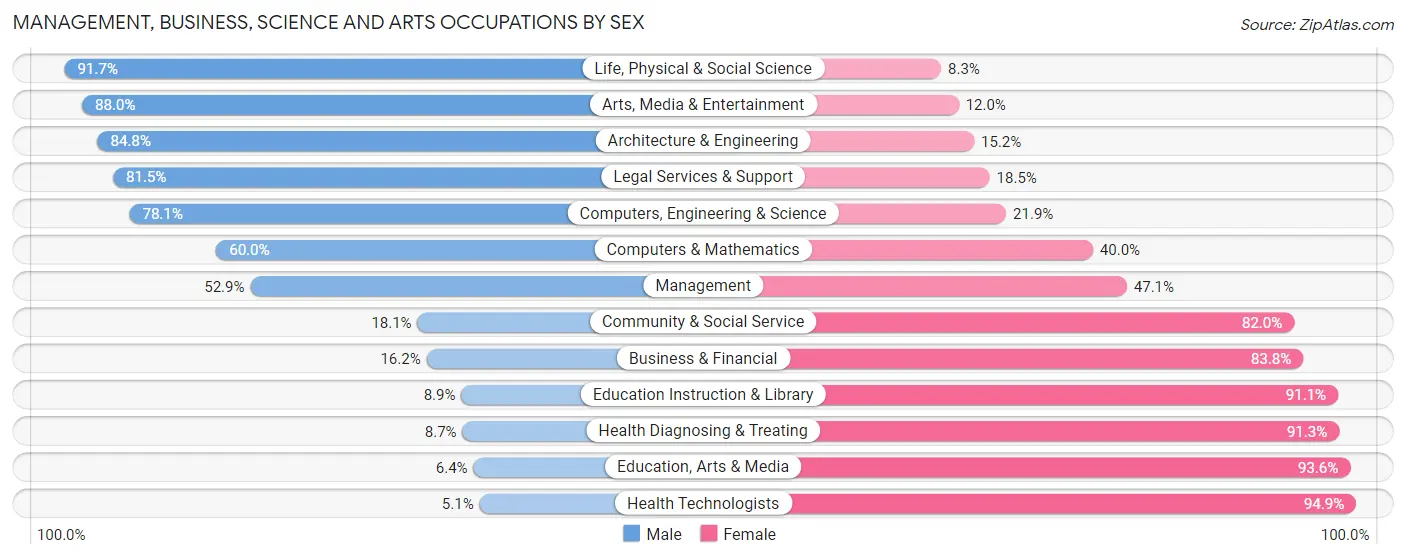
Management, Business, Science and Arts Occupations by Sex
Within the Management, Business, Science and Arts occupations in Horn Lake, the most male-oriented occupations are Life, Physical & Social Science (91.7%), Arts, Media & Entertainment (88.0%), and Architecture & Engineering (84.8%), while the most female-oriented occupations are Health Technologists (94.9%), Education, Arts & Media (93.6%), and Health Diagnosing & Treating (91.3%).
| Occupation | Male | Female |
| Management | 399 (52.9%) | 355 (47.1%) |
| Business & Financial | 53 (16.2%) | 275 (83.8%) |
| Computers, Engineering & Science | 246 (78.1%) | 69 (21.9%) |
| Computers & Mathematics | 69 (60.0%) | 46 (40.0%) |
| Architecture & Engineering | 78 (84.8%) | 14 (15.2%) |
| Life, Physical & Social Science | 99 (91.7%) | 9 (8.3%) |
| Community & Social Service | 161 (18.0%) | 731 (82.0%) |
| Education, Arts & Media | 13 (6.4%) | 191 (93.6%) |
| Legal Services & Support | 53 (81.5%) | 12 (18.5%) |
| Education Instruction & Library | 51 (8.9%) | 522 (91.1%) |
| Arts, Media & Entertainment | 44 (88.0%) | 6 (12.0%) |
| Health Diagnosing & Treating | 72 (8.7%) | 758 (91.3%) |
| Health Technologists | 25 (5.1%) | 464 (94.9%) |
| Total (Category) | 931 (29.8%) | 2,188 (70.2%) |
| Total (Overall) | 6,524 (50.2%) | 6,479 (49.8%) |
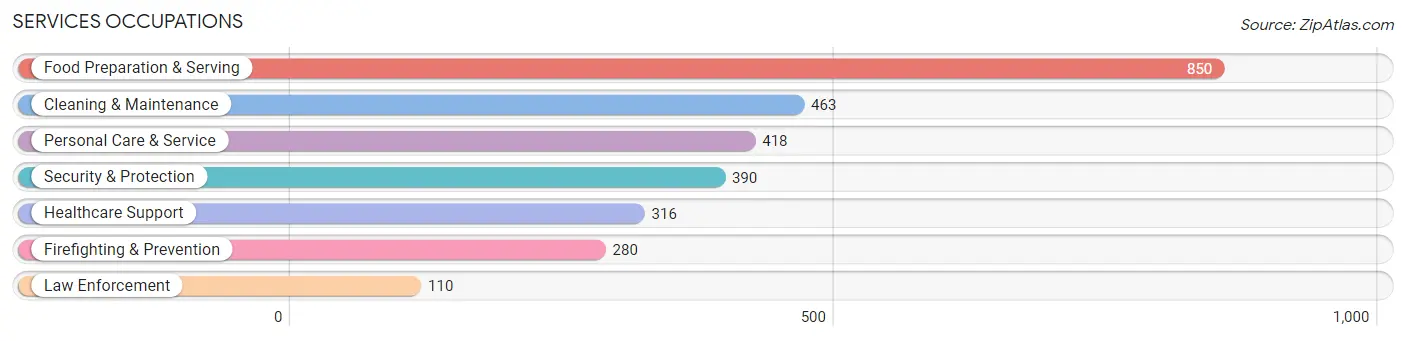
Services Occupations
The most common Services occupations in Horn Lake are Food Preparation & Serving (850 | 6.5%), Cleaning & Maintenance (463 | 3.6%), Personal Care & Service (418 | 3.2%), Security & Protection (390 | 3.0%), and Healthcare Support (316 | 2.4%).
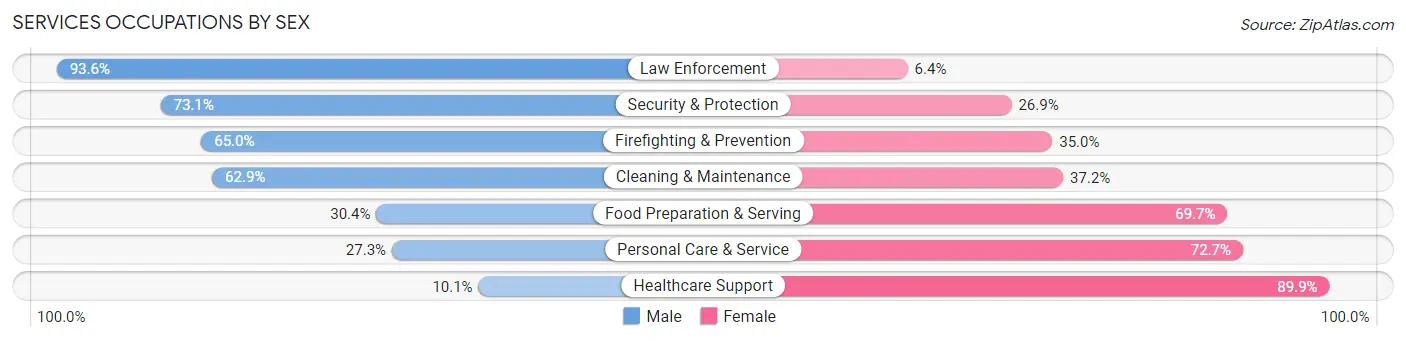
Services Occupations by Sex
Within the Services occupations in Horn Lake, the most male-oriented occupations are Law Enforcement (93.6%), Security & Protection (73.1%), and Firefighting & Prevention (65.0%), while the most female-oriented occupations are Healthcare Support (89.9%), Personal Care & Service (72.7%), and Food Preparation & Serving (69.7%).
| Occupation | Male | Female |
| Healthcare Support | 32 (10.1%) | 284 (89.9%) |
| Security & Protection | 285 (73.1%) | 105 (26.9%) |
| Firefighting & Prevention | 182 (65.0%) | 98 (35.0%) |
| Law Enforcement | 103 (93.6%) | 7 (6.4%) |
| Food Preparation & Serving | 258 (30.3%) | 592 (69.7%) |
| Cleaning & Maintenance | 291 (62.8%) | 172 (37.1%) |
| Personal Care & Service | 114 (27.3%) | 304 (72.7%) |
| Total (Category) | 980 (40.2%) | 1,457 (59.8%) |
| Total (Overall) | 6,524 (50.2%) | 6,479 (49.8%) |
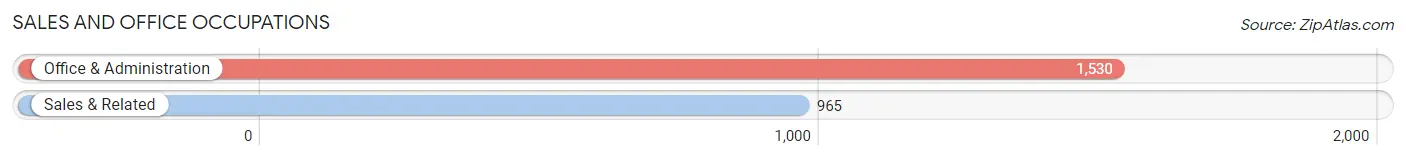
Sales and Office Occupations
The most common Sales and Office occupations in Horn Lake are Office & Administration (1,530 | 11.8%), and Sales & Related (965 | 7.4%).
Sales and Office Occupations by Sex
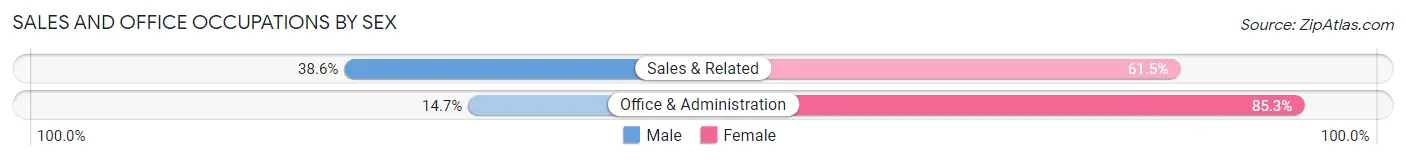
| Occupation | Male | Female |
| Sales & Related | 372 (38.6%) | 593 (61.5%) |
| Office & Administration | 225 (14.7%) | 1,305 (85.3%) |
| Total (Category) | 597 (23.9%) | 1,898 (76.1%) |
| Total (Overall) | 6,524 (50.2%) | 6,479 (49.8%) |
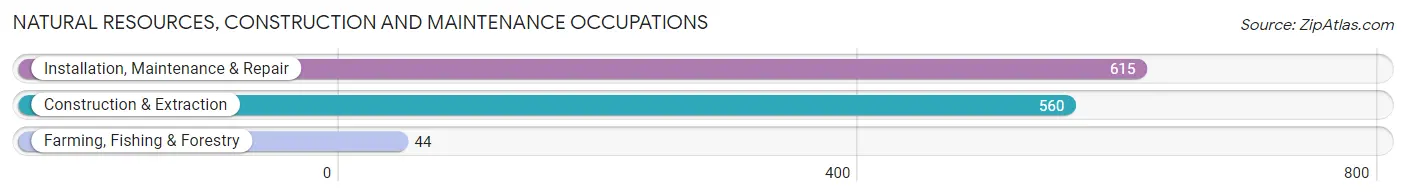
Natural Resources, Construction and Maintenance Occupations
The most common Natural Resources, Construction and Maintenance occupations in Horn Lake are Installation, Maintenance & Repair (615 | 4.7%), Construction & Extraction (560 | 4.3%), and Farming, Fishing & Forestry (44 | 0.3%).
Natural Resources, Construction and Maintenance Occupations by Sex
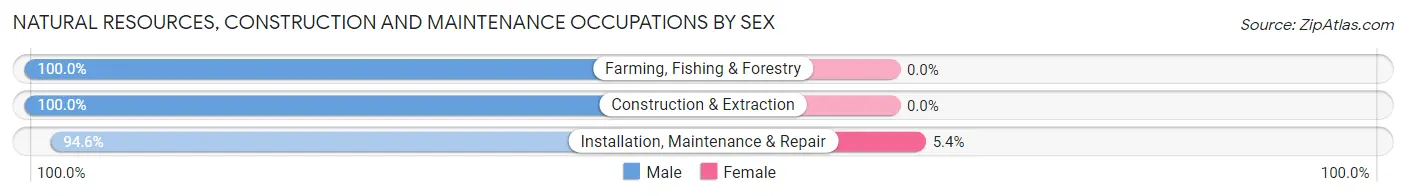
| Occupation | Male | Female |
| Farming, Fishing & Forestry | 44 (100.0%) | 0 (0.0%) |
| Construction & Extraction | 560 (100.0%) | 0 (0.0%) |
| Installation, Maintenance & Repair | 582 (94.6%) | 33 (5.4%) |
| Total (Category) | 1,186 (97.3%) | 33 (2.7%) |
| Total (Overall) | 6,524 (50.2%) | 6,479 (49.8%) |
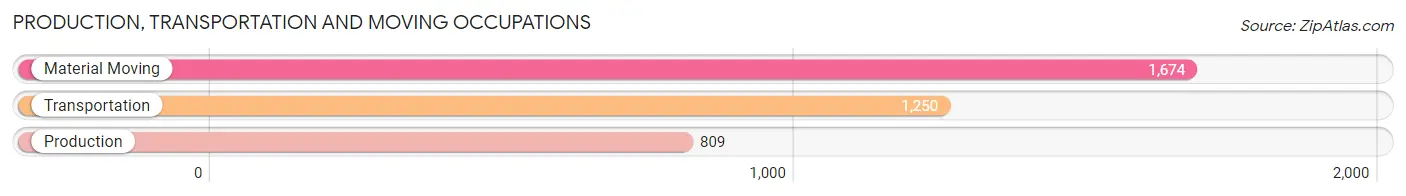
Production, Transportation and Moving Occupations
The most common Production, Transportation and Moving occupations in Horn Lake are Material Moving (1,674 | 12.9%), Transportation (1,250 | 9.6%), and Production (809 | 6.2%).
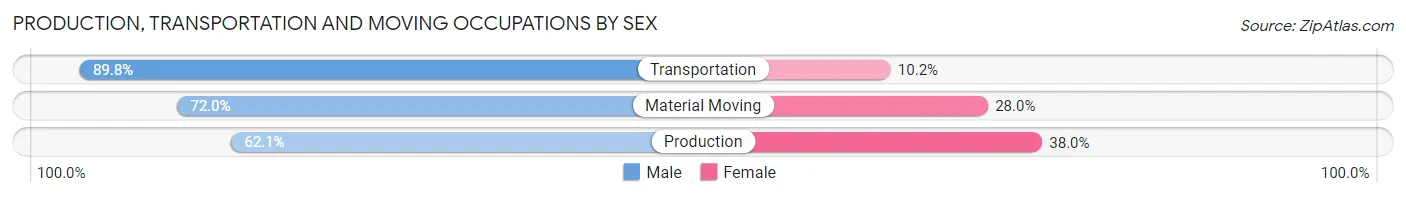
Production, Transportation and Moving Occupations by Sex
| Occupation | Male | Female |
| Production | 502 (62.1%) | 307 (38.0%) |
| Transportation | 1,123 (89.8%) | 127 (10.2%) |
| Material Moving | 1,205 (72.0%) | 469 (28.0%) |
| Total (Category) | 2,830 (75.8%) | 903 (24.2%) |
| Total (Overall) | 6,524 (50.2%) | 6,479 (49.8%) |
Employment Industries by Sex in Horn Lake
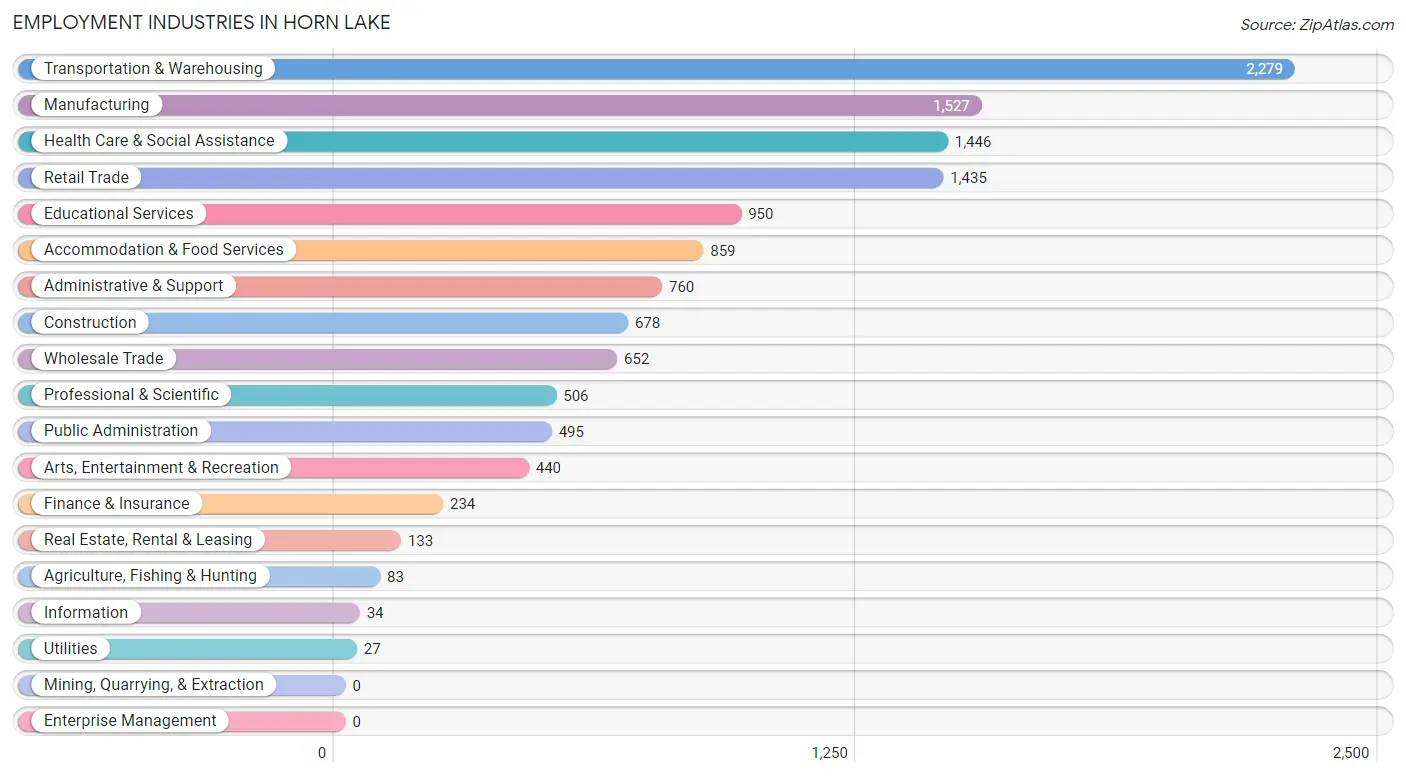
Employment Industries in Horn Lake
The major employment industries in Horn Lake include Transportation & Warehousing (2,279 | 17.5%), Manufacturing (1,527 | 11.7%), Health Care & Social Assistance (1,446 | 11.1%), Retail Trade (1,435 | 11.0%), and Educational Services (950 | 7.3%).
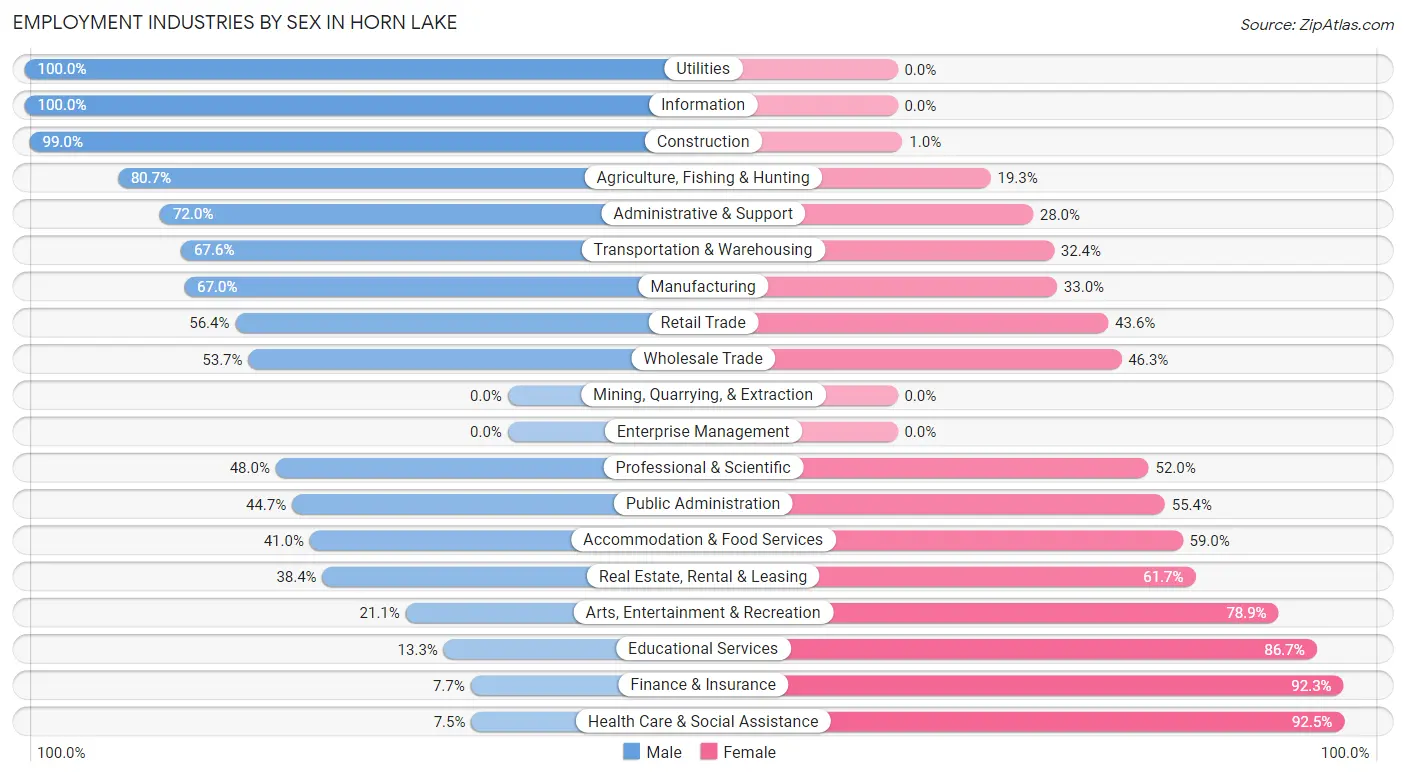
Employment Industries by Sex in Horn Lake
The Horn Lake industries that see more men than women are Utilities (100.0%), Information (100.0%), and Construction (99.0%), whereas the industries that tend to have a higher number of women are Health Care & Social Assistance (92.5%), Finance & Insurance (92.3%), and Educational Services (86.7%).
| Industry | Male | Female |
| Agriculture, Fishing & Hunting | 67 (80.7%) | 16 (19.3%) |
| Mining, Quarrying, & Extraction | 0 (0.0%) | 0 (0.0%) |
| Construction | 671 (99.0%) | 7 (1.0%) |
| Manufacturing | 1,023 (67.0%) | 504 (33.0%) |
| Wholesale Trade | 350 (53.7%) | 302 (46.3%) |
| Retail Trade | 809 (56.4%) | 626 (43.6%) |
| Transportation & Warehousing | 1,541 (67.6%) | 738 (32.4%) |
| Utilities | 27 (100.0%) | 0 (0.0%) |
| Information | 34 (100.0%) | 0 (0.0%) |
| Finance & Insurance | 18 (7.7%) | 216 (92.3%) |
| Real Estate, Rental & Leasing | 51 (38.4%) | 82 (61.7%) |
| Professional & Scientific | 243 (48.0%) | 263 (52.0%) |
| Enterprise Management | 0 (0.0%) | 0 (0.0%) |
| Administrative & Support | 547 (72.0%) | 213 (28.0%) |
| Educational Services | 126 (13.3%) | 824 (86.7%) |
| Health Care & Social Assistance | 109 (7.5%) | 1,337 (92.5%) |
| Arts, Entertainment & Recreation | 93 (21.1%) | 347 (78.9%) |
| Accommodation & Food Services | 352 (41.0%) | 507 (59.0%) |
| Public Administration | 221 (44.7%) | 274 (55.3%) |
| Total | 6,524 (50.2%) | 6,479 (49.8%) |
Education in Horn Lake
School Enrollment in Horn Lake
The most common levels of schooling among the 7,347 students in Horn Lake are high school (1,986 | 27.0%), middle school (1,509 | 20.5%), and elementary school (1,480 | 20.1%).
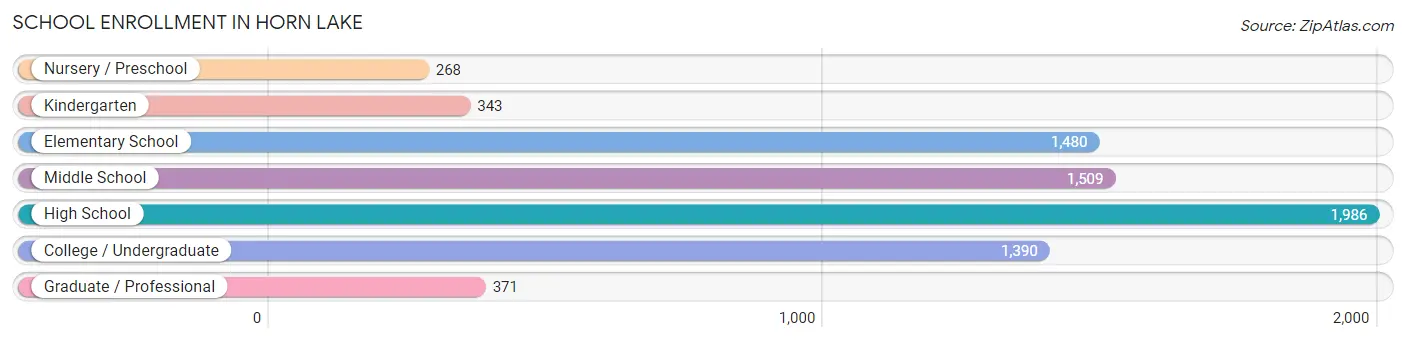
| School Level | # Students | % Students |
| Nursery / Preschool | 268 | 3.6% |
| Kindergarten | 343 | 4.7% |
| Elementary School | 1,480 | 20.1% |
| Middle School | 1,509 | 20.5% |
| High School | 1,986 | 27.0% |
| College / Undergraduate | 1,390 | 18.9% |
| Graduate / Professional | 371 | 5.1% |
| Total | 7,347 | 100.0% |
School Enrollment by Age by Funding Source in Horn Lake
Out of a total of 7,347 students who are enrolled in schools in Horn Lake, 602 (8.2%) attend a private institution, while the remaining 6,745 (91.8%) are enrolled in public schools. The age group of 25 to 34 year olds has the highest likelihood of being enrolled in private schools, with 94 (26.3% in the age bracket) enrolled. Conversely, the age group of 10 to 14 year olds has the lowest likelihood of being enrolled in a private school, with 1,790 (96.8% in the age bracket) attending a public institution.
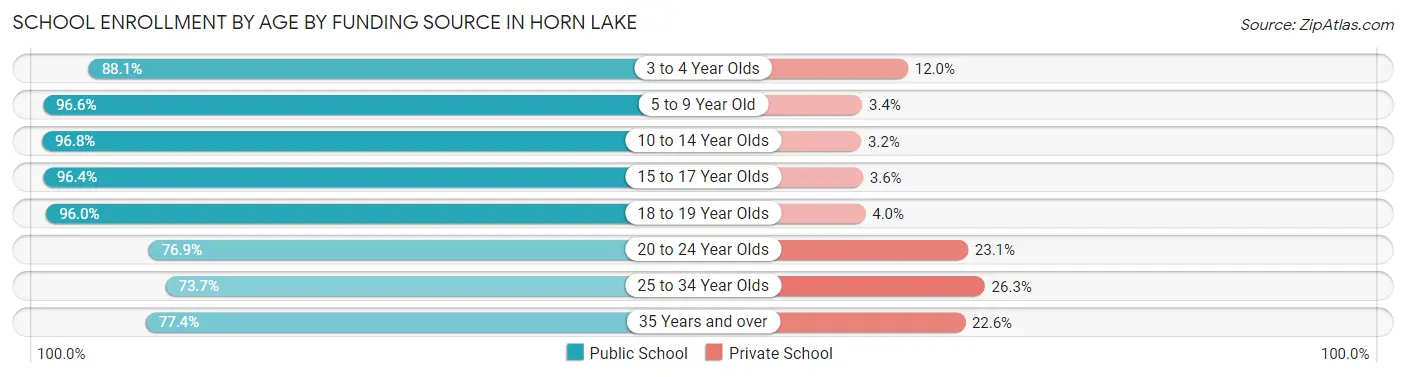
| Age Bracket | Public School | Private School |
| 3 to 4 Year Olds | 199 (88.0%) | 27 (11.9%) |
| 5 to 9 Year Old | 1,631 (96.6%) | 58 (3.4%) |
| 10 to 14 Year Olds | 1,790 (96.8%) | 60 (3.2%) |
| 15 to 17 Year Olds | 1,403 (96.4%) | 52 (3.6%) |
| 18 to 19 Year Olds | 453 (96.0%) | 19 (4.0%) |
| 20 to 24 Year Olds | 422 (76.9%) | 127 (23.1%) |
| 25 to 34 Year Olds | 264 (73.7%) | 94 (26.3%) |
| 35 Years and over | 579 (77.4%) | 169 (22.6%) |
| Total | 6,745 (91.8%) | 602 (8.2%) |
Educational Attainment by Field of Study in Horn Lake
Business (670 | 22.4%), education (422 | 14.1%), arts & humanities (414 | 13.8%), science & technology (350 | 11.7%), and psychology (199 | 6.7%) are the most common fields of study among 2,993 individuals in Horn Lake who have obtained a bachelor's degree or higher.
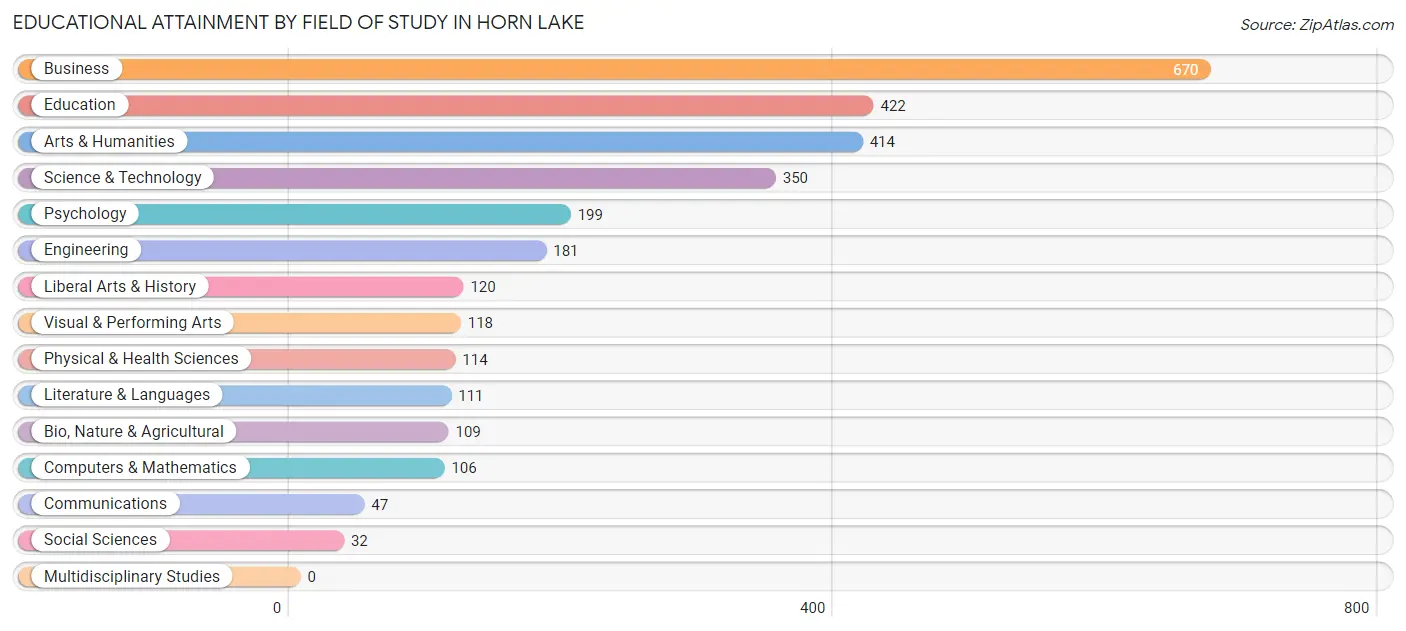
| Field of Study | # Graduates | % Graduates |
| Computers & Mathematics | 106 | 3.5% |
| Bio, Nature & Agricultural | 109 | 3.6% |
| Physical & Health Sciences | 114 | 3.8% |
| Psychology | 199 | 6.7% |
| Social Sciences | 32 | 1.1% |
| Engineering | 181 | 6.0% |
| Multidisciplinary Studies | 0 | 0.0% |
| Science & Technology | 350 | 11.7% |
| Business | 670 | 22.4% |
| Education | 422 | 14.1% |
| Literature & Languages | 111 | 3.7% |
| Liberal Arts & History | 120 | 4.0% |
| Visual & Performing Arts | 118 | 3.9% |
| Communications | 47 | 1.6% |
| Arts & Humanities | 414 | 13.8% |
| Total | 2,993 | 100.0% |
Transportation & Commute in Horn Lake
Vehicle Availability by Sex in Horn Lake
The most prevalent vehicle ownership categories in Horn Lake are males with 2 vehicles (2,622, accounting for 41.3%) and females with 2 vehicles (2,864, making up 41.0%).
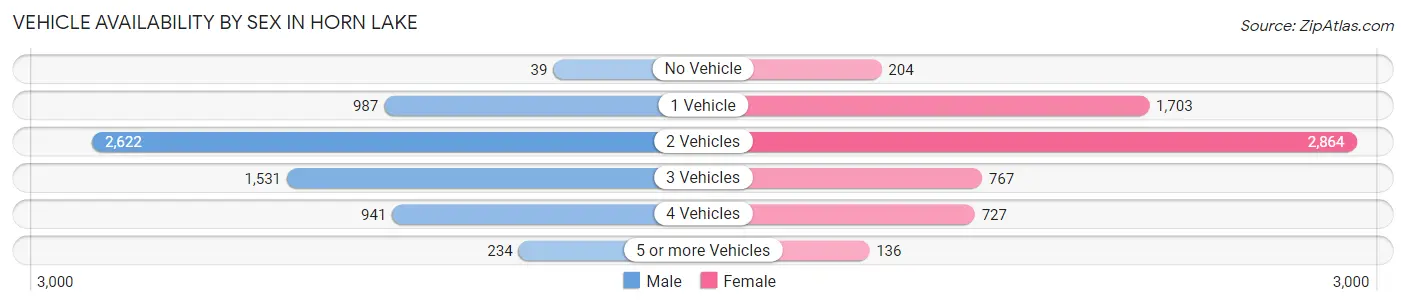
| Vehicles Available | Male | Female |
| No Vehicle | 39 (0.6%) | 204 (3.2%) |
| 1 Vehicle | 987 (15.5%) | 1,703 (26.6%) |
| 2 Vehicles | 2,622 (41.3%) | 2,864 (44.7%) |
| 3 Vehicles | 1,531 (24.1%) | 767 (12.0%) |
| 4 Vehicles | 941 (14.8%) | 727 (11.4%) |
| 5 or more Vehicles | 234 (3.7%) | 136 (2.1%) |
| Total | 6,354 (100.0%) | 6,401 (100.0%) |
Commute Time in Horn Lake
The most frequently occuring commute durations in Horn Lake are 30 to 34 minutes (2,515 commuters, 20.2%), 20 to 24 minutes (1,745 commuters, 14.0%), and 15 to 19 minutes (1,709 commuters, 13.7%).
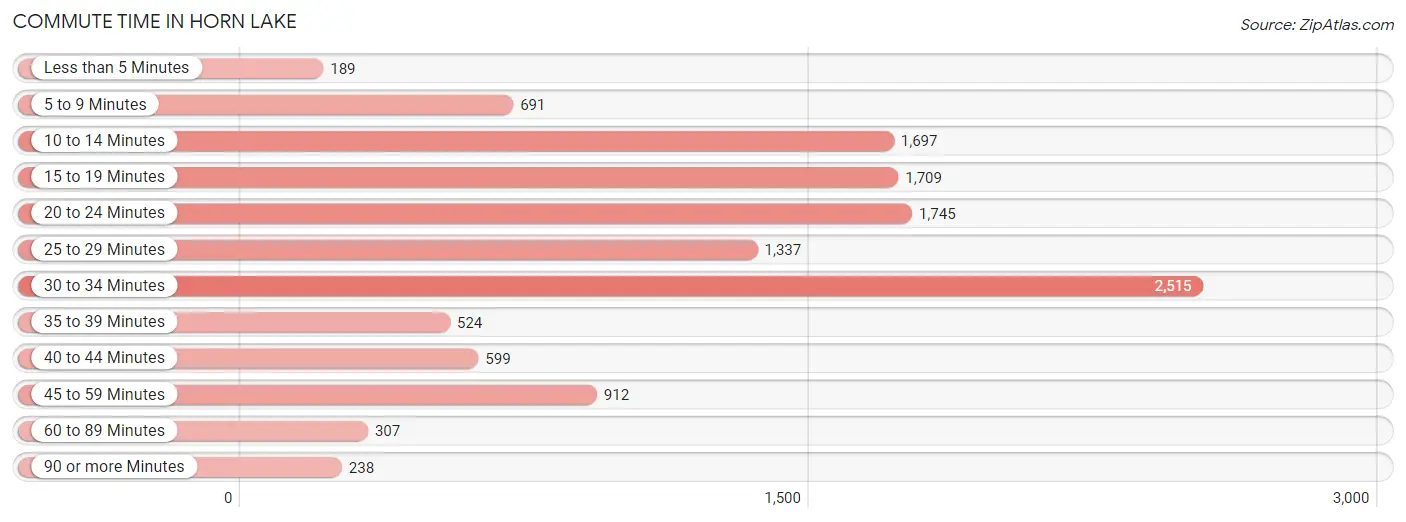
| Commute Time | # Commuters | % Commuters |
| Less than 5 Minutes | 189 | 1.5% |
| 5 to 9 Minutes | 691 | 5.5% |
| 10 to 14 Minutes | 1,697 | 13.6% |
| 15 to 19 Minutes | 1,709 | 13.7% |
| 20 to 24 Minutes | 1,745 | 14.0% |
| 25 to 29 Minutes | 1,337 | 10.7% |
| 30 to 34 Minutes | 2,515 | 20.2% |
| 35 to 39 Minutes | 524 | 4.2% |
| 40 to 44 Minutes | 599 | 4.8% |
| 45 to 59 Minutes | 912 | 7.3% |
| 60 to 89 Minutes | 307 | 2.5% |
| 90 or more Minutes | 238 | 1.9% |
Commute Time by Sex in Horn Lake
The most common commute times in Horn Lake are 30 to 34 minutes (1,607 commuters, 25.9%) for males and 20 to 24 minutes (1,053 commuters, 16.8%) for females.
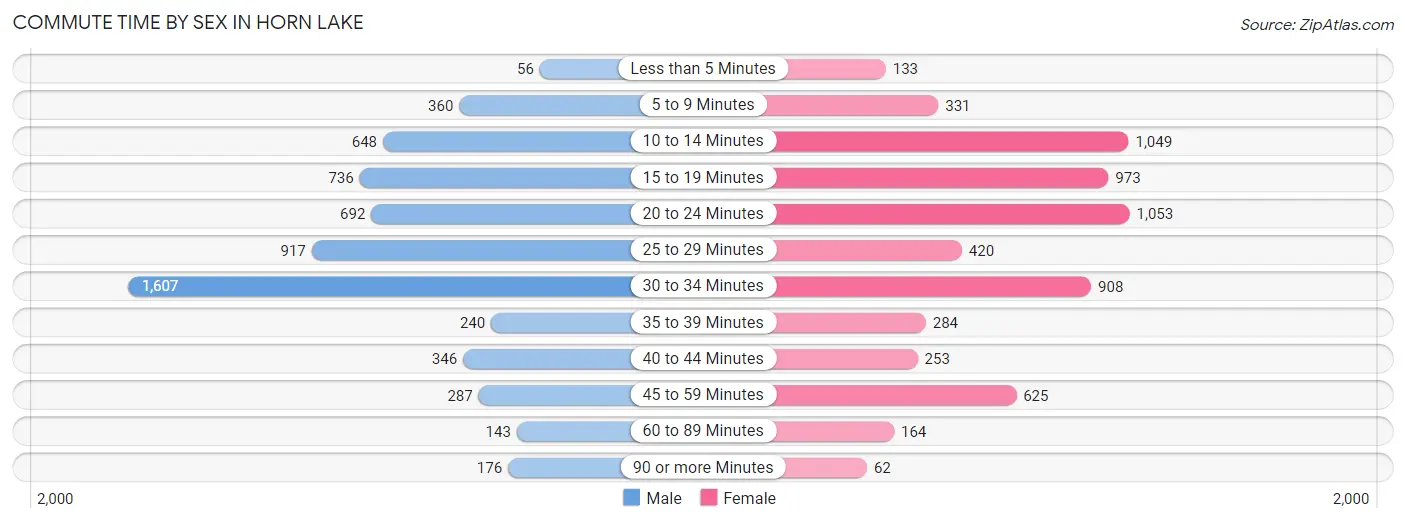
| Commute Time | Male | Female |
| Less than 5 Minutes | 56 (0.9%) | 133 (2.1%) |
| 5 to 9 Minutes | 360 (5.8%) | 331 (5.3%) |
| 10 to 14 Minutes | 648 (10.4%) | 1,049 (16.8%) |
| 15 to 19 Minutes | 736 (11.9%) | 973 (15.6%) |
| 20 to 24 Minutes | 692 (11.2%) | 1,053 (16.8%) |
| 25 to 29 Minutes | 917 (14.8%) | 420 (6.7%) |
| 30 to 34 Minutes | 1,607 (25.9%) | 908 (14.5%) |
| 35 to 39 Minutes | 240 (3.9%) | 284 (4.5%) |
| 40 to 44 Minutes | 346 (5.6%) | 253 (4.0%) |
| 45 to 59 Minutes | 287 (4.6%) | 625 (10.0%) |
| 60 to 89 Minutes | 143 (2.3%) | 164 (2.6%) |
| 90 or more Minutes | 176 (2.8%) | 62 (1.0%) |
Time of Departure to Work by Sex in Horn Lake
The most frequent times of departure to work in Horn Lake are 4:00 PM to 11:59 PM (930, 15.0%) for males and 7:00 AM to 7:29 AM (943, 15.1%) for females.
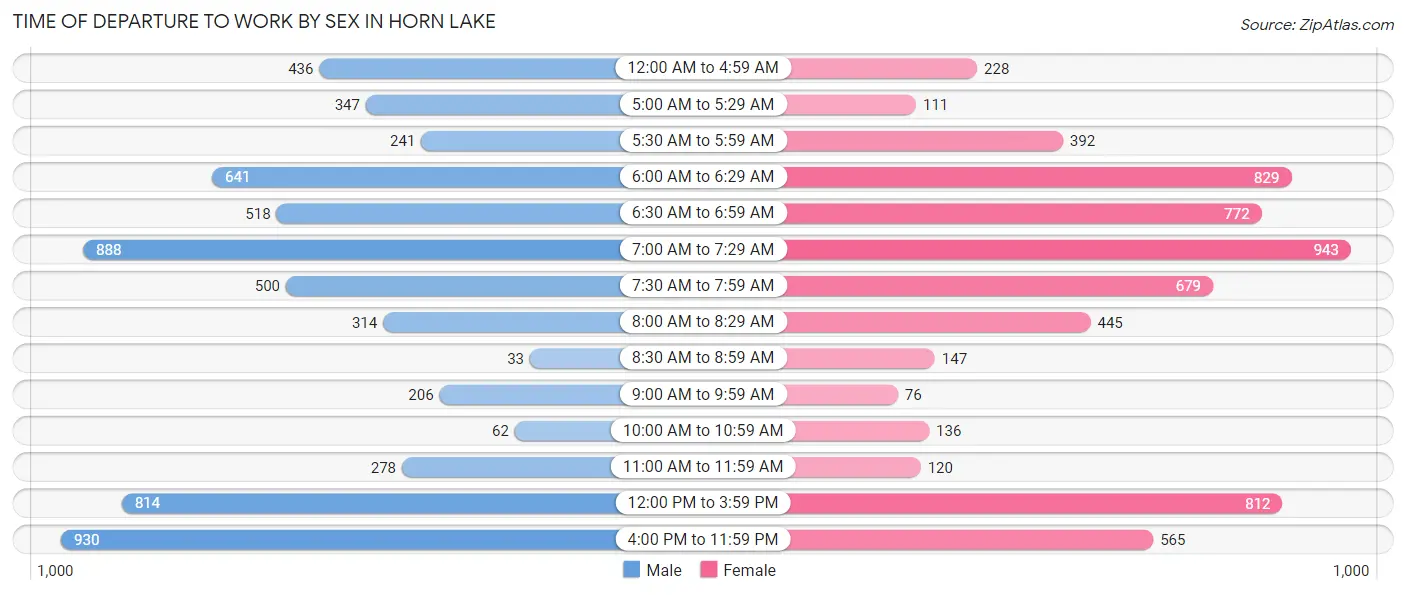
| Time of Departure | Male | Female |
| 12:00 AM to 4:59 AM | 436 (7.0%) | 228 (3.6%) |
| 5:00 AM to 5:29 AM | 347 (5.6%) | 111 (1.8%) |
| 5:30 AM to 5:59 AM | 241 (3.9%) | 392 (6.3%) |
| 6:00 AM to 6:29 AM | 641 (10.3%) | 829 (13.3%) |
| 6:30 AM to 6:59 AM | 518 (8.3%) | 772 (12.3%) |
| 7:00 AM to 7:29 AM | 888 (14.3%) | 943 (15.1%) |
| 7:30 AM to 7:59 AM | 500 (8.1%) | 679 (10.9%) |
| 8:00 AM to 8:29 AM | 314 (5.1%) | 445 (7.1%) |
| 8:30 AM to 8:59 AM | 33 (0.5%) | 147 (2.4%) |
| 9:00 AM to 9:59 AM | 206 (3.3%) | 76 (1.2%) |
| 10:00 AM to 10:59 AM | 62 (1.0%) | 136 (2.2%) |
| 11:00 AM to 11:59 AM | 278 (4.5%) | 120 (1.9%) |
| 12:00 PM to 3:59 PM | 814 (13.1%) | 812 (13.0%) |
| 4:00 PM to 11:59 PM | 930 (15.0%) | 565 (9.0%) |
| Total | 6,208 (100.0%) | 6,255 (100.0%) |
Housing Occupancy in Horn Lake
Occupancy by Ownership in Horn Lake
Of the total 9,998 dwellings in Horn Lake, owner-occupied units account for 5,882 (58.8%), while renter-occupied units make up 4,116 (41.2%).
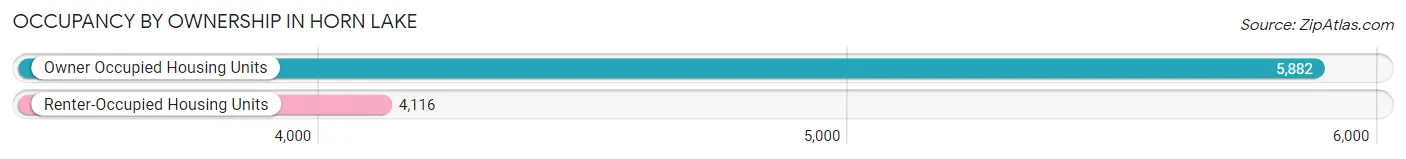
| Occupancy | # Housing Units | % Housing Units |
| Owner Occupied Housing Units | 5,882 | 58.8% |
| Renter-Occupied Housing Units | 4,116 | 41.2% |
| Total Occupied Housing Units | 9,998 | 100.0% |
Occupancy by Household Size in Horn Lake
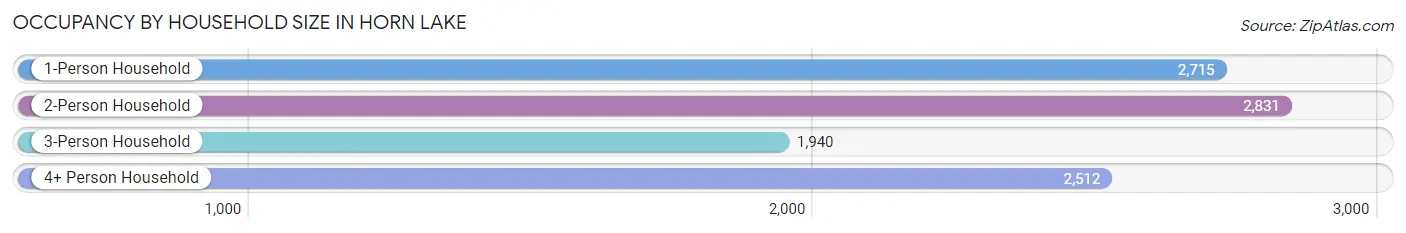
| Household Size | # Housing Units | % Housing Units |
| 1-Person Household | 2,715 | 27.2% |
| 2-Person Household | 2,831 | 28.3% |
| 3-Person Household | 1,940 | 19.4% |
| 4+ Person Household | 2,512 | 25.1% |
| Total Housing Units | 9,998 | 100.0% |
Occupancy by Ownership by Household Size in Horn Lake
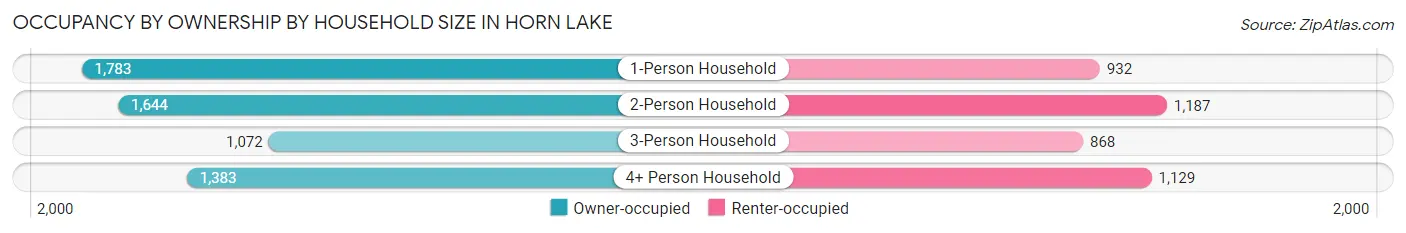
| Household Size | Owner-occupied | Renter-occupied |
| 1-Person Household | 1,783 (65.7%) | 932 (34.3%) |
| 2-Person Household | 1,644 (58.1%) | 1,187 (41.9%) |
| 3-Person Household | 1,072 (55.3%) | 868 (44.7%) |
| 4+ Person Household | 1,383 (55.1%) | 1,129 (44.9%) |
| Total Housing Units | 5,882 (58.8%) | 4,116 (41.2%) |
Occupancy by Educational Attainment in Horn Lake
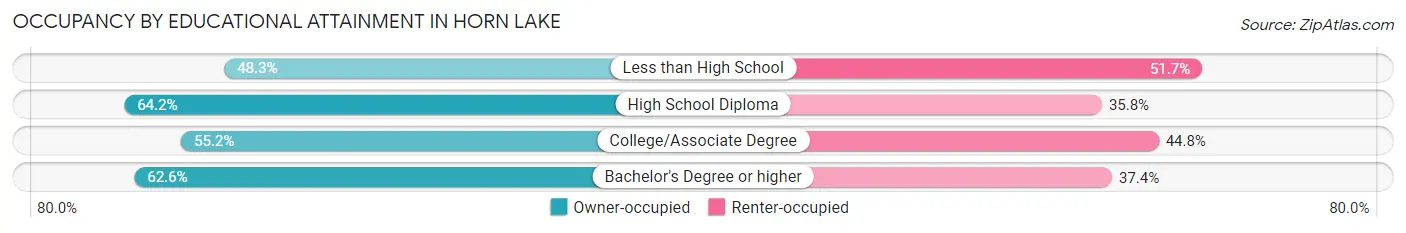
| Household Size | Owner-occupied | Renter-occupied |
| Less than High School | 606 (48.3%) | 648 (51.7%) |
| High School Diploma | 2,228 (64.2%) | 1,243 (35.8%) |
| College/Associate Degree | 1,882 (55.2%) | 1,528 (44.8%) |
| Bachelor's Degree or higher | 1,166 (62.6%) | 697 (37.4%) |
Occupancy by Age of Householder in Horn Lake
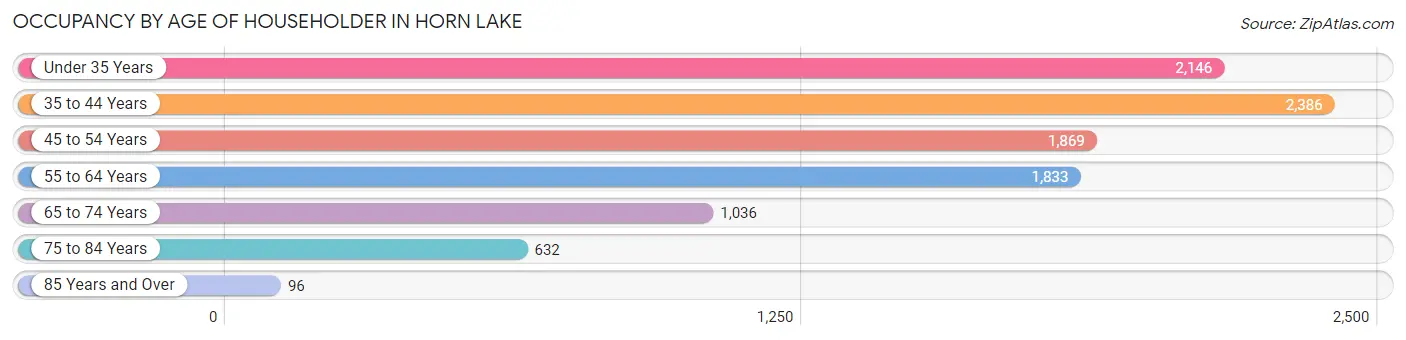
| Age Bracket | # Households | % Households |
| Under 35 Years | 2,146 | 21.5% |
| 35 to 44 Years | 2,386 | 23.9% |
| 45 to 54 Years | 1,869 | 18.7% |
| 55 to 64 Years | 1,833 | 18.3% |
| 65 to 74 Years | 1,036 | 10.4% |
| 75 to 84 Years | 632 | 6.3% |
| 85 Years and Over | 96 | 1.0% |
| Total | 9,998 | 100.0% |
Housing Finances in Horn Lake
Median Income by Occupancy in Horn Lake
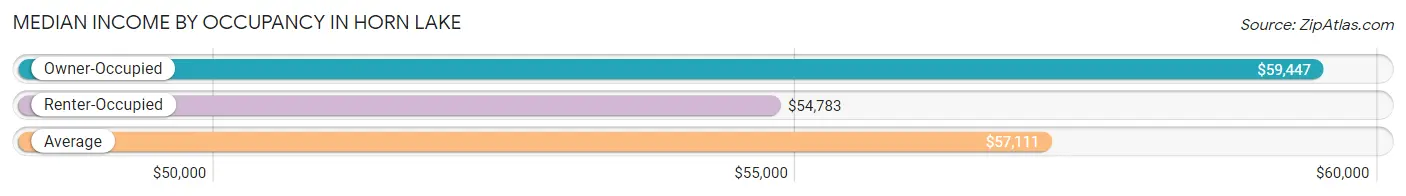
| Occupancy Type | # Households | Median Income |
| Owner-Occupied | 5,882 (58.8%) | $59,447 |
| Renter-Occupied | 4,116 (41.2%) | $54,783 |
| Average | 9,998 (100.0%) | $57,111 |
Occupancy by Householder Income Bracket in Horn Lake
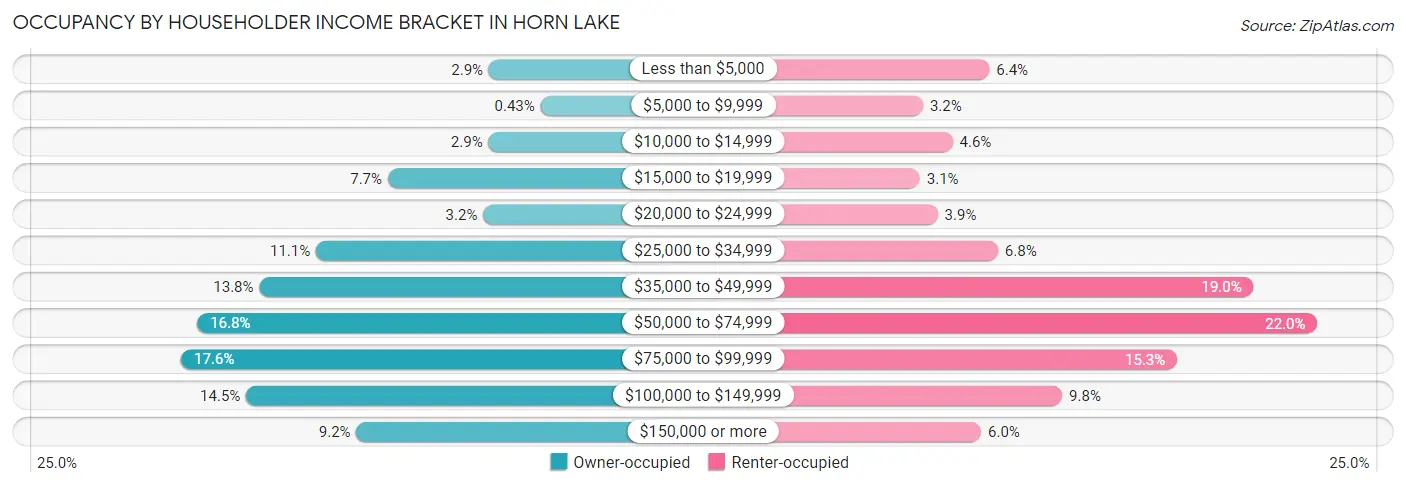
| Income Bracket | Owner-occupied | Renter-occupied |
| Less than $5,000 | 170 (2.9%) | 262 (6.4%) |
| $5,000 to $9,999 | 25 (0.4%) | 132 (3.2%) |
| $10,000 to $14,999 | 171 (2.9%) | 190 (4.6%) |
| $15,000 to $19,999 | 453 (7.7%) | 126 (3.1%) |
| $20,000 to $24,999 | 186 (3.2%) | 161 (3.9%) |
| $25,000 to $34,999 | 654 (11.1%) | 279 (6.8%) |
| $35,000 to $49,999 | 813 (13.8%) | 780 (19.0%) |
| $50,000 to $74,999 | 987 (16.8%) | 905 (22.0%) |
| $75,000 to $99,999 | 1,032 (17.5%) | 630 (15.3%) |
| $100,000 to $149,999 | 850 (14.4%) | 405 (9.8%) |
| $150,000 or more | 541 (9.2%) | 246 (6.0%) |
| Total | 5,882 (100.0%) | 4,116 (100.0%) |
Monthly Housing Cost Tiers in Horn Lake
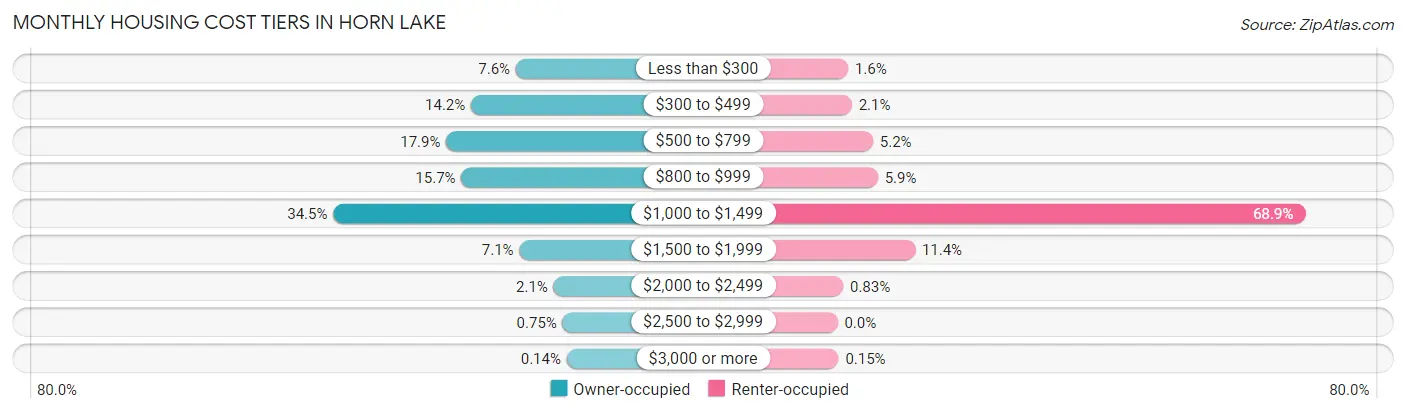
| Monthly Cost | Owner-occupied | Renter-occupied |
| Less than $300 | 449 (7.6%) | 64 (1.5%) |
| $300 to $499 | 837 (14.2%) | 87 (2.1%) |
| $500 to $799 | 1,052 (17.9%) | 215 (5.2%) |
| $800 to $999 | 921 (15.7%) | 244 (5.9%) |
| $1,000 to $1,499 | 2,031 (34.5%) | 2,836 (68.9%) |
| $1,500 to $1,999 | 418 (7.1%) | 470 (11.4%) |
| $2,000 to $2,499 | 122 (2.1%) | 34 (0.8%) |
| $2,500 to $2,999 | 44 (0.7%) | 0 (0.0%) |
| $3,000 or more | 8 (0.1%) | 6 (0.2%) |
| Total | 5,882 (100.0%) | 4,116 (100.0%) |
Physical Housing Characteristics in Horn Lake
Housing Structures in Horn Lake
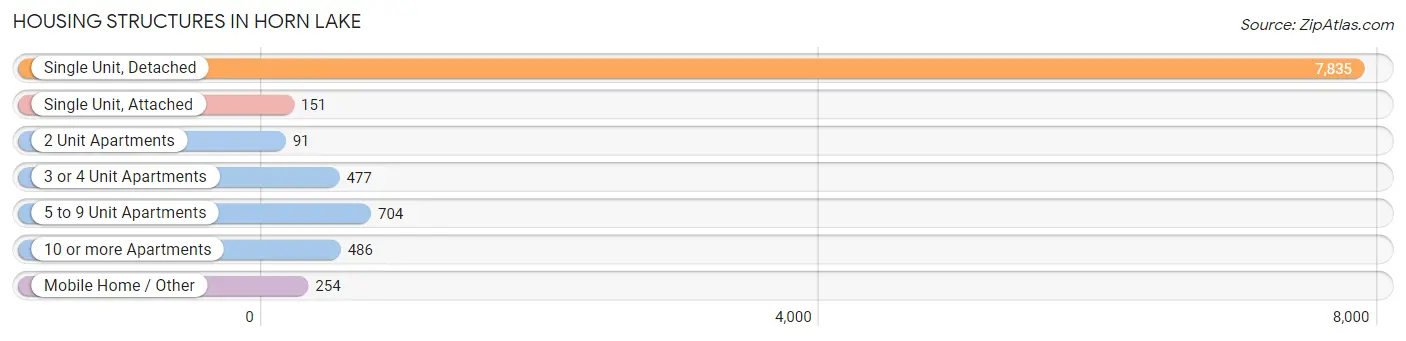
| Structure Type | # Housing Units | % Housing Units |
| Single Unit, Detached | 7,835 | 78.4% |
| Single Unit, Attached | 151 | 1.5% |
| 2 Unit Apartments | 91 | 0.9% |
| 3 or 4 Unit Apartments | 477 | 4.8% |
| 5 to 9 Unit Apartments | 704 | 7.0% |
| 10 or more Apartments | 486 | 4.9% |
| Mobile Home / Other | 254 | 2.5% |
| Total | 9,998 | 100.0% |
Housing Structures by Occupancy in Horn Lake
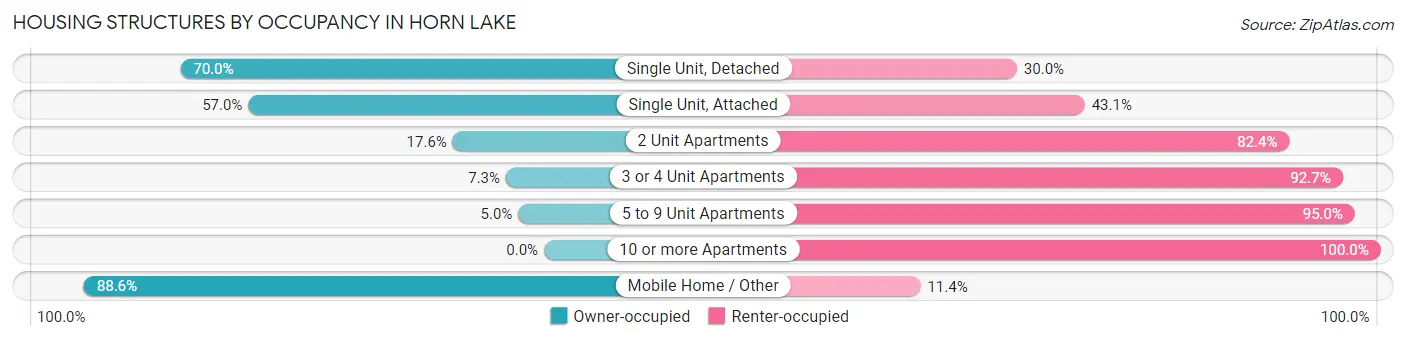
| Structure Type | Owner-occupied | Renter-occupied |
| Single Unit, Detached | 5,485 (70.0%) | 2,350 (30.0%) |
| Single Unit, Attached | 86 (57.0%) | 65 (43.0%) |
| 2 Unit Apartments | 16 (17.6%) | 75 (82.4%) |
| 3 or 4 Unit Apartments | 35 (7.3%) | 442 (92.7%) |
| 5 to 9 Unit Apartments | 35 (5.0%) | 669 (95.0%) |
| 10 or more Apartments | 0 (0.0%) | 486 (100.0%) |
| Mobile Home / Other | 225 (88.6%) | 29 (11.4%) |
| Total | 5,882 (58.8%) | 4,116 (41.2%) |
Housing Structures by Number of Rooms in Horn Lake
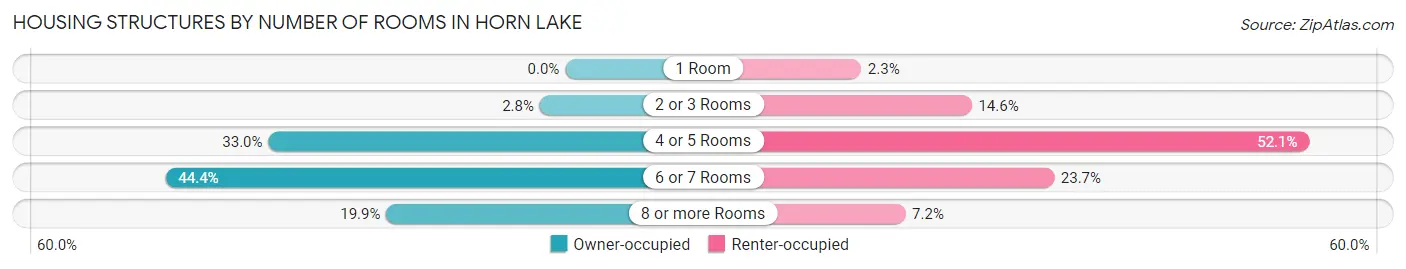
| Number of Rooms | Owner-occupied | Renter-occupied |
| 1 Room | 0 (0.0%) | 96 (2.3%) |
| 2 or 3 Rooms | 166 (2.8%) | 601 (14.6%) |
| 4 or 5 Rooms | 1,938 (33.0%) | 2,144 (52.1%) |
| 6 or 7 Rooms | 2,610 (44.4%) | 977 (23.7%) |
| 8 or more Rooms | 1,168 (19.9%) | 298 (7.2%) |
| Total | 5,882 (100.0%) | 4,116 (100.0%) |
Housing Structure by Heating Type in Horn Lake
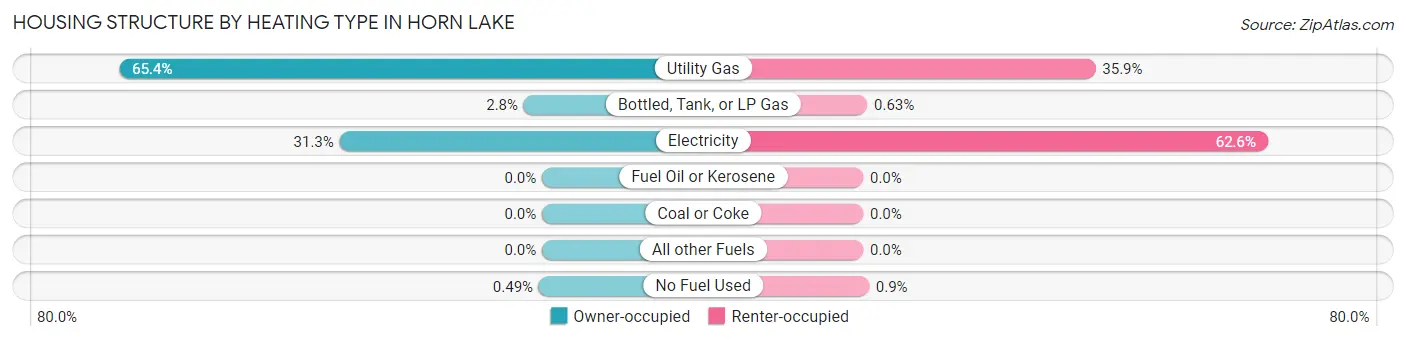
| Heating Type | Owner-occupied | Renter-occupied |
| Utility Gas | 3,846 (65.4%) | 1,478 (35.9%) |
| Bottled, Tank, or LP Gas | 166 (2.8%) | 26 (0.6%) |
| Electricity | 1,841 (31.3%) | 2,575 (62.6%) |
| Fuel Oil or Kerosene | 0 (0.0%) | 0 (0.0%) |
| Coal or Coke | 0 (0.0%) | 0 (0.0%) |
| All other Fuels | 0 (0.0%) | 0 (0.0%) |
| No Fuel Used | 29 (0.5%) | 37 (0.9%) |
| Total | 5,882 (100.0%) | 4,116 (100.0%) |
Household Vehicle Usage in Horn Lake
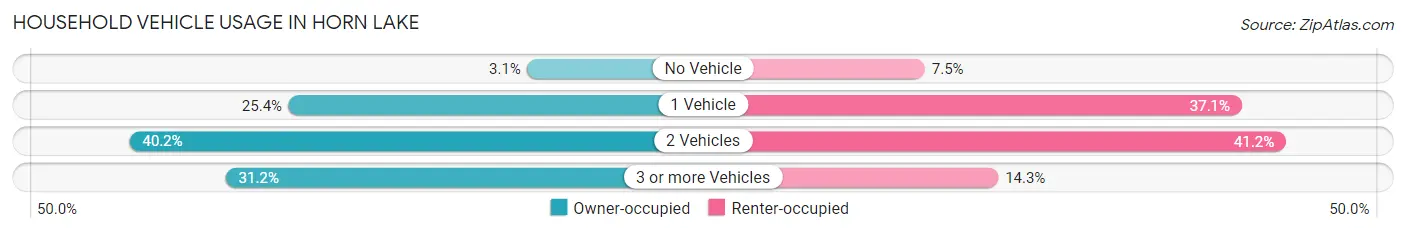
| Vehicles per Household | Owner-occupied | Renter-occupied |
| No Vehicle | 184 (3.1%) | 307 (7.5%) |
| 1 Vehicle | 1,495 (25.4%) | 1,525 (37.0%) |
| 2 Vehicles | 2,366 (40.2%) | 1,695 (41.2%) |
| 3 or more Vehicles | 1,837 (31.2%) | 589 (14.3%) |
| Total | 5,882 (100.0%) | 4,116 (100.0%) |
Real Estate & Mortgages in Horn Lake
Real Estate and Mortgage Overview in Horn Lake
| Characteristic | Without Mortgage | With Mortgage |
| Housing Units | 1,848 | 4,034 |
| Median Property Value | $134,500 | $151,400 |
| Median Household Income | $60,389 | $247 |
| Monthly Housing Costs | $385 | $8 |
| Real Estate Taxes | $939 | $545 |
Property Value by Mortgage Status in Horn Lake
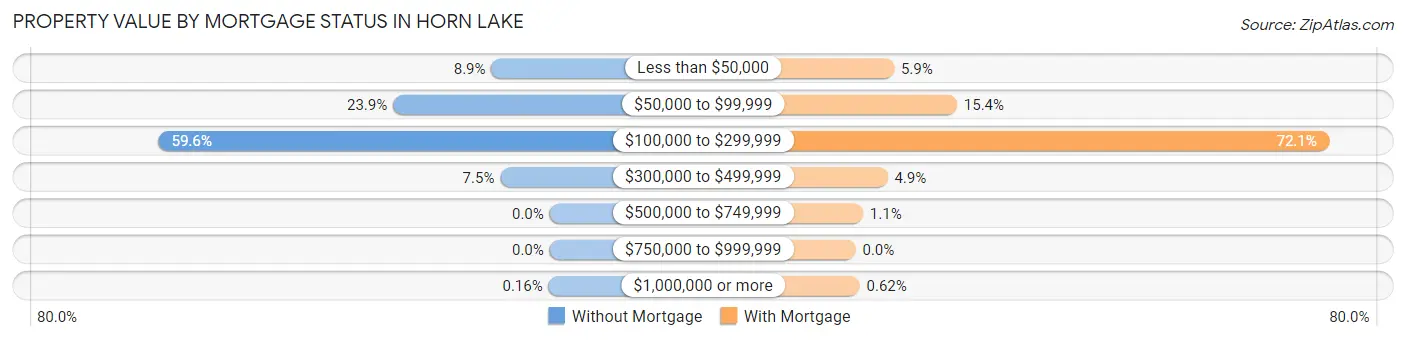
| Property Value | Without Mortgage | With Mortgage |
| Less than $50,000 | 164 (8.9%) | 236 (5.9%) |
| $50,000 to $99,999 | 441 (23.9%) | 623 (15.4%) |
| $100,000 to $299,999 | 1,101 (59.6%) | 2,909 (72.1%) |
| $300,000 to $499,999 | 139 (7.5%) | 196 (4.9%) |
| $500,000 to $749,999 | 0 (0.0%) | 45 (1.1%) |
| $750,000 to $999,999 | 0 (0.0%) | 0 (0.0%) |
| $1,000,000 or more | 3 (0.2%) | 25 (0.6%) |
| Total | 1,848 (100.0%) | 4,034 (100.0%) |
Household Income by Mortgage Status in Horn Lake
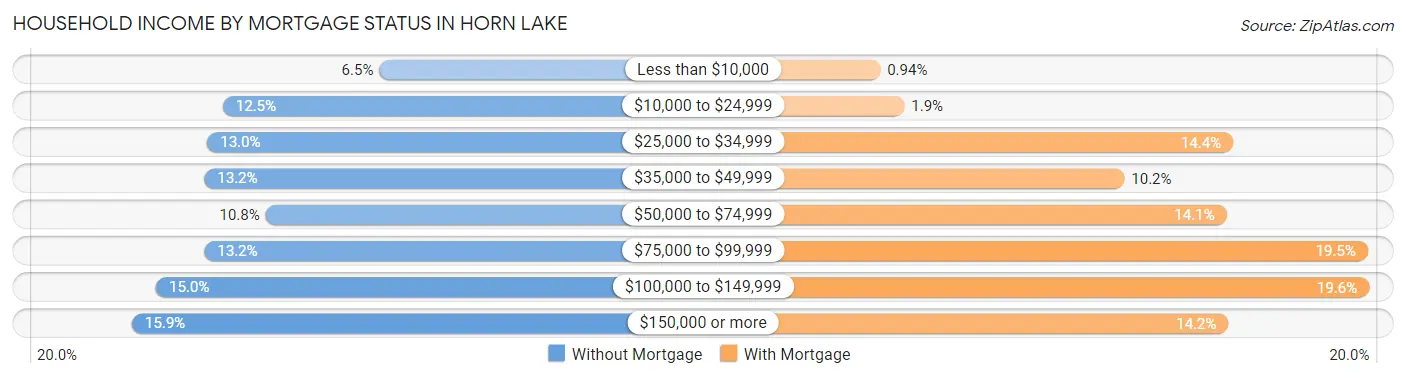
| Household Income | Without Mortgage | With Mortgage |
| Less than $10,000 | 120 (6.5%) | 38 (0.9%) |
| $10,000 to $24,999 | 230 (12.4%) | 75 (1.9%) |
| $25,000 to $34,999 | 241 (13.0%) | 580 (14.4%) |
| $35,000 to $49,999 | 243 (13.2%) | 413 (10.2%) |
| $50,000 to $74,999 | 200 (10.8%) | 570 (14.1%) |
| $75,000 to $99,999 | 243 (13.2%) | 787 (19.5%) |
| $100,000 to $149,999 | 277 (15.0%) | 789 (19.6%) |
| $150,000 or more | 294 (15.9%) | 573 (14.2%) |
| Total | 1,848 (100.0%) | 4,034 (100.0%) |
Property Value to Household Income Ratio in Horn Lake
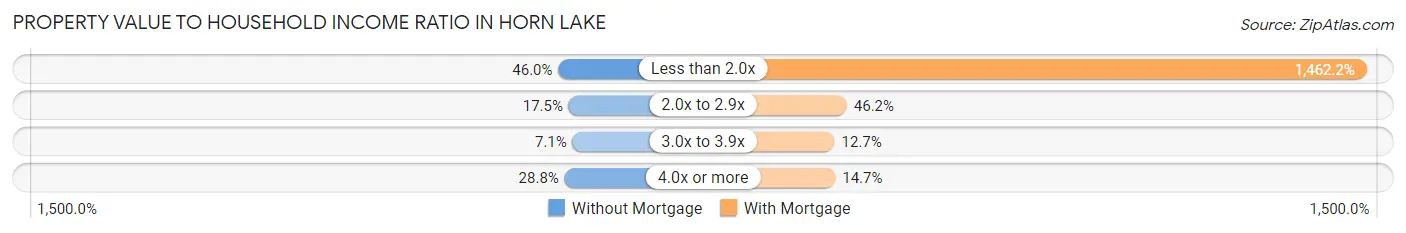
| Value-to-Income Ratio | Without Mortgage | With Mortgage |
| Less than 2.0x | 850 (46.0%) | 58,986 (1,462.2%) |
| 2.0x to 2.9x | 323 (17.5%) | 1,862 (46.2%) |
| 3.0x to 3.9x | 131 (7.1%) | 514 (12.7%) |
| 4.0x or more | 532 (28.8%) | 593 (14.7%) |
| Total | 1,848 (100.0%) | 4,034 (100.0%) |
Real Estate Taxes by Mortgage Status in Horn Lake
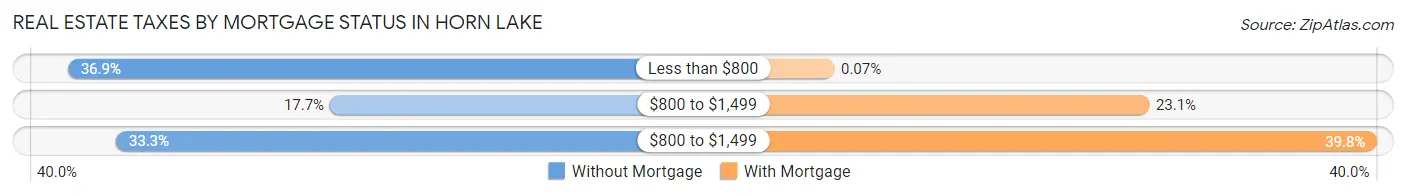
| Property Taxes | Without Mortgage | With Mortgage |
| Less than $800 | 681 (36.8%) | 3 (0.1%) |
| $800 to $1,499 | 327 (17.7%) | 931 (23.1%) |
| $800 to $1,499 | 616 (33.3%) | 1,604 (39.8%) |
| Total | 1,848 (100.0%) | 4,034 (100.0%) |
Health & Disability in Horn Lake
Health Insurance Coverage by Age in Horn Lake
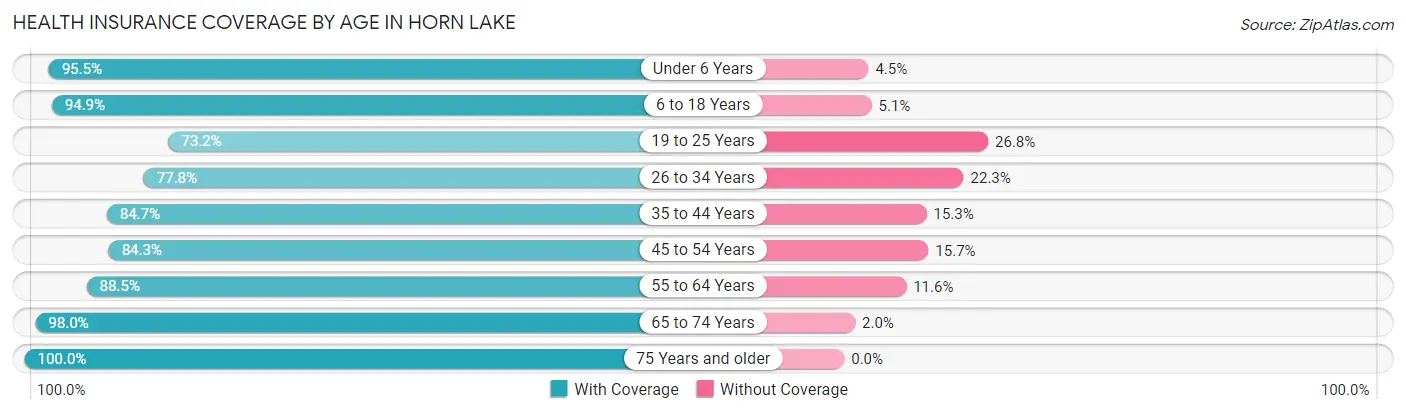
| Age Bracket | With Coverage | Without Coverage |
| Under 6 Years | 1,587 (95.5%) | 75 (4.5%) |
| 6 to 18 Years | 4,922 (94.9%) | 264 (5.1%) |
| 19 to 25 Years | 2,278 (73.2%) | 835 (26.8%) |
| 26 to 34 Years | 2,498 (77.7%) | 715 (22.3%) |
| 35 to 44 Years | 3,444 (84.7%) | 624 (15.3%) |
| 45 to 54 Years | 2,864 (84.3%) | 533 (15.7%) |
| 55 to 64 Years | 2,642 (88.4%) | 345 (11.6%) |
| 65 to 74 Years | 1,552 (98.0%) | 32 (2.0%) |
| 75 Years and older | 1,332 (100.0%) | 0 (0.0%) |
| Total | 23,119 (87.1%) | 3,423 (12.9%) |
Health Insurance Coverage by Citizenship Status in Horn Lake
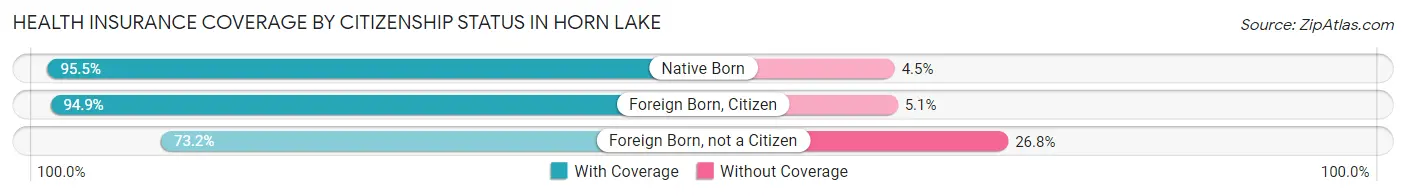
| Citizenship Status | With Coverage | Without Coverage |
| Native Born | 1,587 (95.5%) | 75 (4.5%) |
| Foreign Born, Citizen | 4,922 (94.9%) | 264 (5.1%) |
| Foreign Born, not a Citizen | 2,278 (73.2%) | 835 (26.8%) |
Health Insurance Coverage by Household Income in Horn Lake
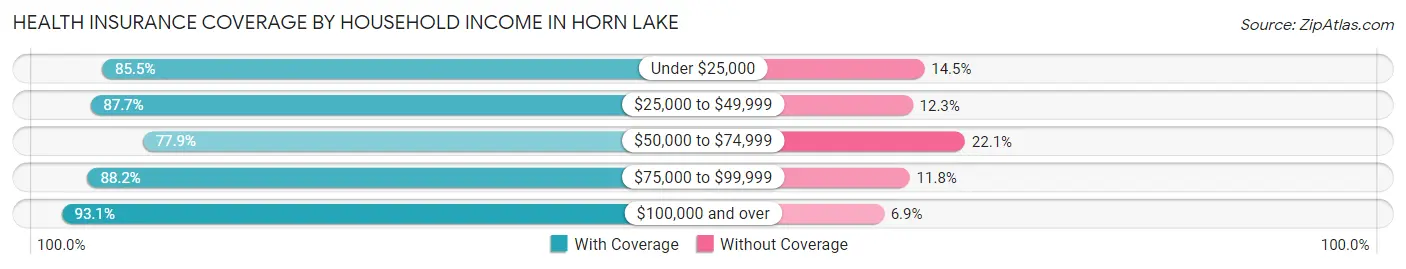
| Household Income | With Coverage | Without Coverage |
| Under $25,000 | 3,391 (85.5%) | 576 (14.5%) |
| $25,000 to $49,999 | 5,120 (87.7%) | 720 (12.3%) |
| $50,000 to $74,999 | 3,814 (77.9%) | 1,084 (22.1%) |
| $75,000 to $99,999 | 4,066 (88.2%) | 543 (11.8%) |
| $100,000 and over | 6,728 (93.1%) | 500 (6.9%) |
Public vs Private Health Insurance Coverage by Age in Horn Lake
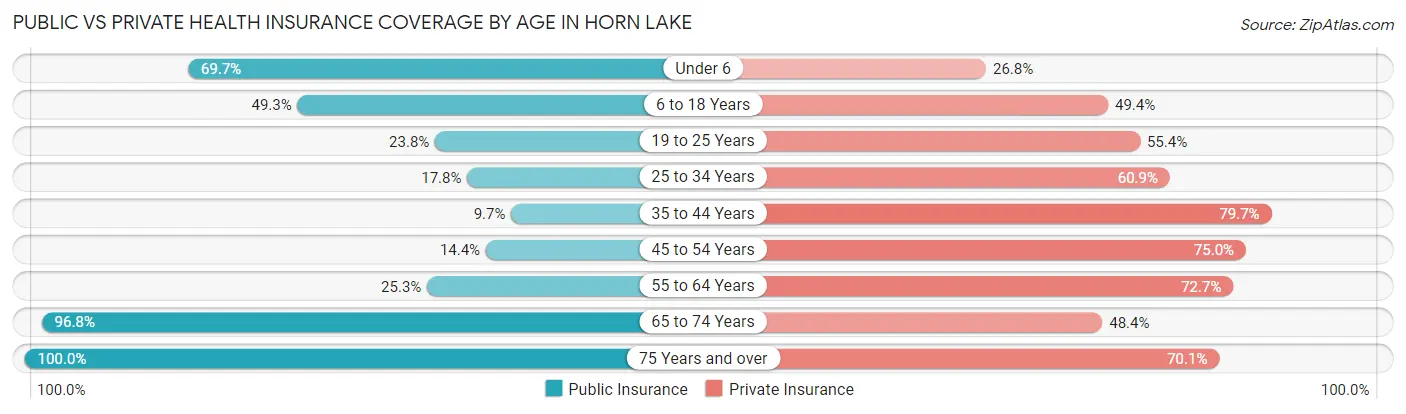
| Age Bracket | Public Insurance | Private Insurance |
| Under 6 | 1,158 (69.7%) | 445 (26.8%) |
| 6 to 18 Years | 2,558 (49.3%) | 2,563 (49.4%) |
| 19 to 25 Years | 741 (23.8%) | 1,723 (55.3%) |
| 25 to 34 Years | 573 (17.8%) | 1,956 (60.9%) |
| 35 to 44 Years | 393 (9.7%) | 3,244 (79.7%) |
| 45 to 54 Years | 488 (14.4%) | 2,548 (75.0%) |
| 55 to 64 Years | 755 (25.3%) | 2,170 (72.7%) |
| 65 to 74 Years | 1,534 (96.8%) | 766 (48.4%) |
| 75 Years and over | 1,332 (100.0%) | 933 (70.1%) |
| Total | 9,532 (35.9%) | 16,348 (61.6%) |
Disability Status by Sex by Age in Horn Lake
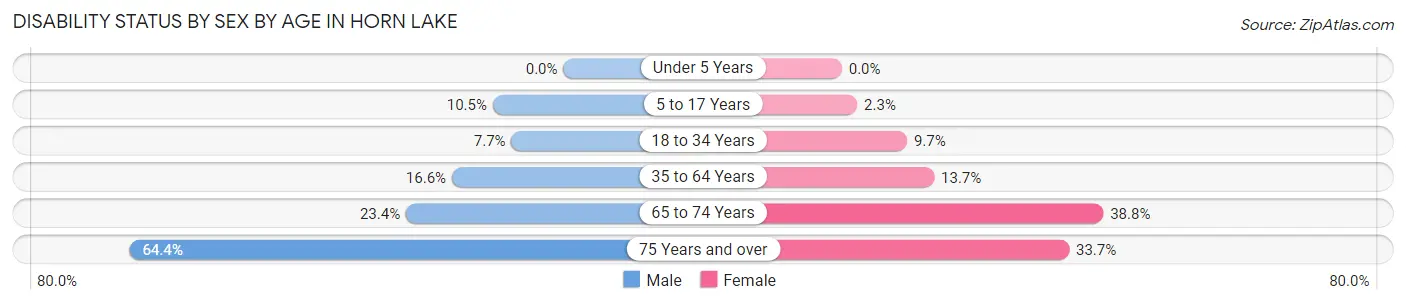
| Age Bracket | Male | Female |
| Under 5 Years | 0 (0.0%) | 0 (0.0%) |
| 5 to 17 Years | 274 (10.5%) | 57 (2.3%) |
| 18 to 34 Years | 261 (7.7%) | 316 (9.7%) |
| 35 to 64 Years | 771 (16.6%) | 794 (13.7%) |
| 65 to 74 Years | 136 (23.4%) | 389 (38.8%) |
| 75 Years and over | 335 (64.4%) | 274 (33.7%) |
Disability Class by Sex by Age in Horn Lake
Disability Class: Hearing Difficulty
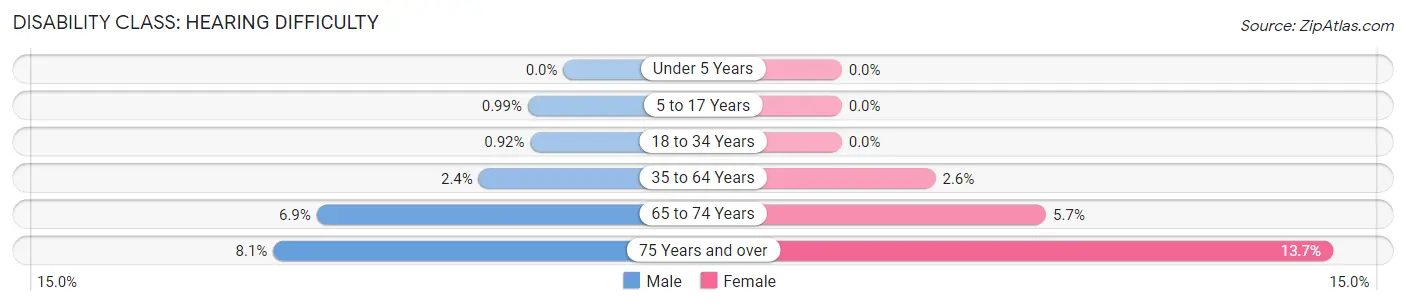
| Age Bracket | Male | Female |
| Under 5 Years | 0 (0.0%) | 0 (0.0%) |
| 5 to 17 Years | 26 (1.0%) | 0 (0.0%) |
| 18 to 34 Years | 31 (0.9%) | 0 (0.0%) |
| 35 to 64 Years | 110 (2.4%) | 151 (2.6%) |
| 65 to 74 Years | 40 (6.9%) | 57 (5.7%) |
| 75 Years and over | 42 (8.1%) | 111 (13.7%) |
Disability Class: Vision Difficulty
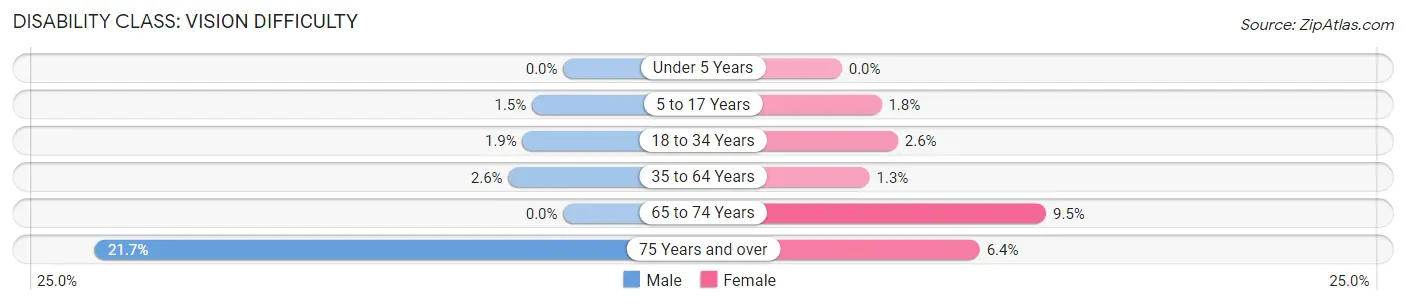
| Age Bracket | Male | Female |
| Under 5 Years | 0 (0.0%) | 0 (0.0%) |
| 5 to 17 Years | 38 (1.5%) | 46 (1.8%) |
| 18 to 34 Years | 64 (1.9%) | 85 (2.6%) |
| 35 to 64 Years | 119 (2.5%) | 75 (1.3%) |
| 65 to 74 Years | 0 (0.0%) | 95 (9.5%) |
| 75 Years and over | 113 (21.7%) | 52 (6.4%) |
Disability Class: Cognitive Difficulty
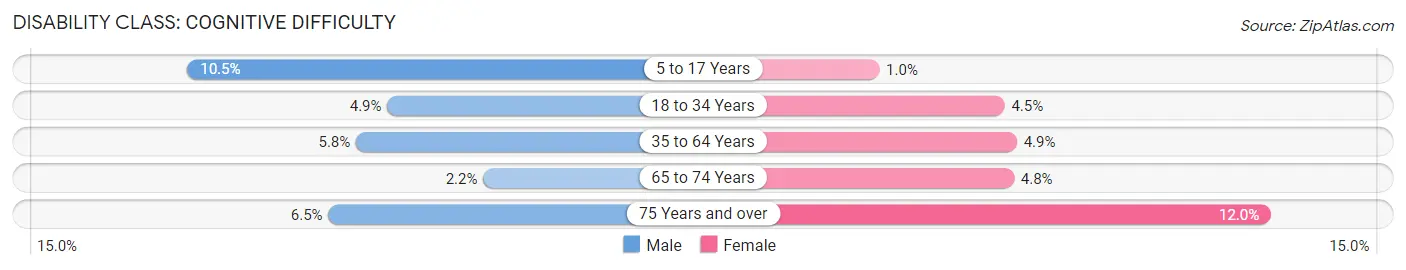
| Age Bracket | Male | Female |
| 5 to 17 Years | 274 (10.5%) | 26 (1.0%) |
| 18 to 34 Years | 166 (4.9%) | 148 (4.5%) |
| 35 to 64 Years | 269 (5.8%) | 282 (4.9%) |
| 65 to 74 Years | 13 (2.2%) | 48 (4.8%) |
| 75 Years and over | 34 (6.5%) | 97 (11.9%) |
Disability Class: Ambulatory Difficulty
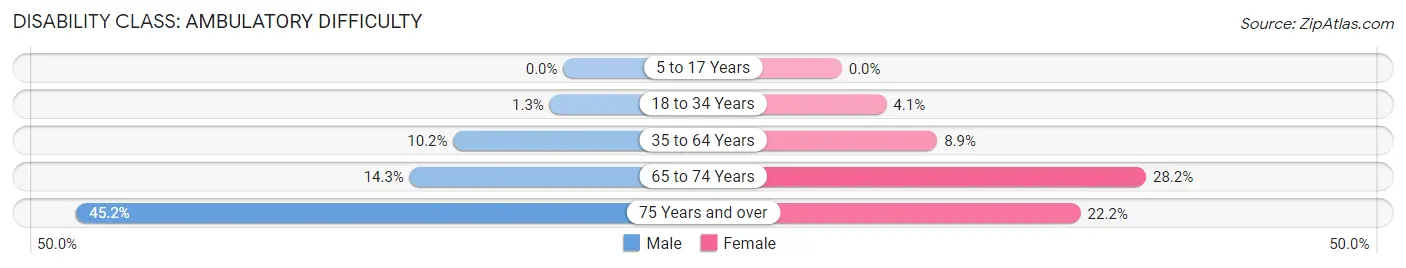
| Age Bracket | Male | Female |
| 5 to 17 Years | 0 (0.0%) | 0 (0.0%) |
| 18 to 34 Years | 43 (1.3%) | 135 (4.1%) |
| 35 to 64 Years | 476 (10.2%) | 513 (8.9%) |
| 65 to 74 Years | 83 (14.3%) | 283 (28.2%) |
| 75 Years and over | 235 (45.2%) | 180 (22.2%) |
Disability Class: Self-Care Difficulty
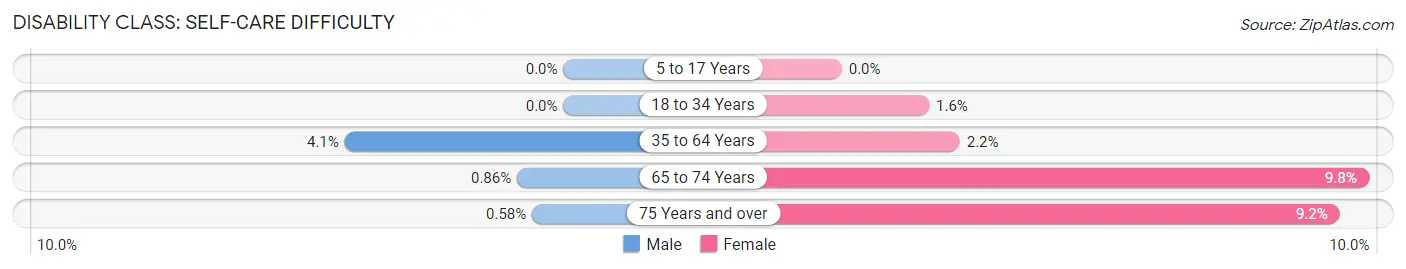
| Age Bracket | Male | Female |
| 5 to 17 Years | 0 (0.0%) | 0 (0.0%) |
| 18 to 34 Years | 0 (0.0%) | 53 (1.6%) |
| 35 to 64 Years | 189 (4.1%) | 127 (2.2%) |
| 65 to 74 Years | 5 (0.9%) | 98 (9.8%) |
| 75 Years and over | 3 (0.6%) | 75 (9.2%) |
Technology Access in Horn Lake
Computing Device Access in Horn Lake
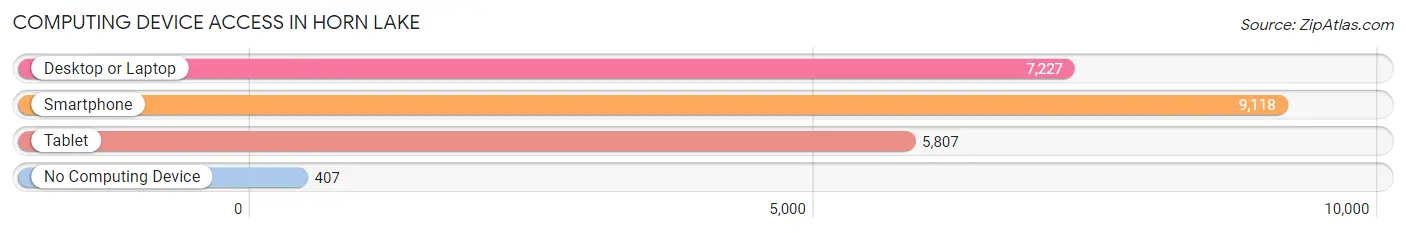
| Device Type | # Households | % Households |
| Desktop or Laptop | 7,227 | 72.3% |
| Smartphone | 9,118 | 91.2% |
| Tablet | 5,807 | 58.1% |
| No Computing Device | 407 | 4.1% |
| Total | 9,998 | 100.0% |
Internet Access in Horn Lake
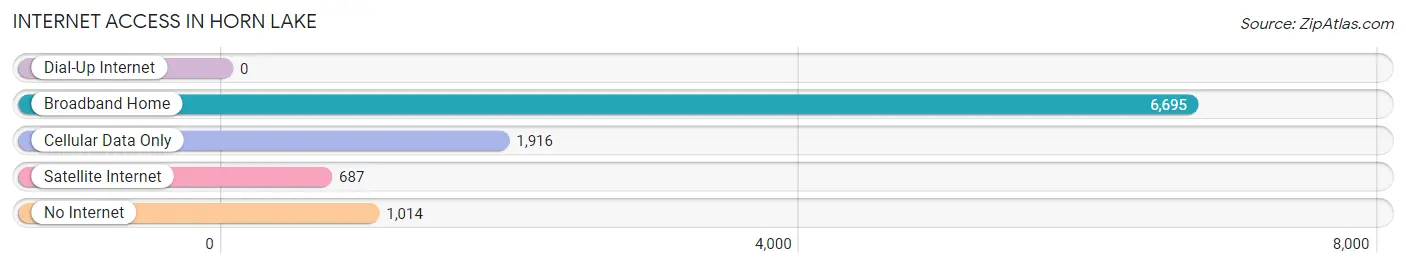
| Internet Type | # Households | % Households |
| Dial-Up Internet | 0 | 0.0% |
| Broadband Home | 6,695 | 67.0% |
| Cellular Data Only | 1,916 | 19.2% |
| Satellite Internet | 687 | 6.9% |
| No Internet | 1,014 | 10.1% |
| Total | 9,998 | 100.0% |
Horn Lake Summary
Horn Lake is a city located in DeSoto County, Mississippi, United States. The population was 26,066 at the 2010 census, up from 14,099 at the 2000 census. Horn Lake is located in the Memphis metropolitan area.
History
Horn Lake was first settled in the early 1800s by the Chickasaw Indians. The city was named after a nearby lake, which was named for the large number of deer horns found in the area. The city was officially incorporated in 1972.
Geography
Horn Lake is located in the northwest corner of DeSoto County at 35°10′25″N 90°2′2″W (35.173600, -90.033400). It is bordered to the north by the city of Southaven, to the east by the city of Walls, to the south by the city of Hernando, and to the west by the state of Arkansas.
According to the United States Census Bureau, the city has a total area of 28.2 square miles (73.1 km2), of which 28.1 square miles (72.9 km2) is land and 0.1 square miles (0.2 km2) (0.39%) is water.
Economy
Horn Lake is home to several large employers, including the DeSoto County School District, Baptist Memorial Hospital-DeSoto, and the DeSoto County government. The city is also home to several small businesses, including restaurants, retail stores, and service providers.
Demographics
As of the census of 2000, there were 14,099 people, 5,093 households, and 3,845 families residing in the city. The population density was 517.2 people per square mile (199.7/km2). There were 5,541 housing units at an average density of 201.2 per square mile (77.6/km2). The racial makeup of the city was 79.2% White, 17.2% African American, 0.3% Native American, 0.7% Asian, 0.1% Pacific Islander, 1.2% from other races, and 1.3% from two or more races. Hispanic or Latino of any race were 2.7% of the population.
There were 5,093 households, out of which 37.2% had children under the age of 18 living with them, 56.2% were married couples living together, 13.2% had a female householder with no husband present, and 26.2% were non-families. 22.2% of all households were made up of individuals, and 6.2% had someone living alone who was 65 years of age or older. The average household size was 2.68 and the average family size was 3.14.
In the city, the population was spread out, with 27.2% under the age of 18, 8.7% from 18 to 24, 32.2% from 25 to 44, 21.3% from 45 to 64, and 10.6% who were 65 years of age or older. The median age was 34 years. For every 100 females, there were 93.2 males. For every 100 females age 18 and over, there were 89.3 males.
The median income for a household in the city was $41,945, and the median income for a family was $48,845. Males had a median income of $35,945 versus $25,945 for females. The per capita income for the city was $19,945. About 6.2% of families and 8.2% of the population were below the poverty line, including 10.2% of those under age 18 and 8.2% of those age 65 or over.
Common Questions
What is the Total Population of Horn Lake?
Total Population of Horn Lake is 26,652.
What is the Total Male Population of Horn Lake?
Total Male Population of Horn Lake is 12,353.
What is the Total Female Population of Horn Lake?
Total Female Population of Horn Lake is 14,299.
What is the Ratio of Males per 100 Females in Horn Lake?
There are 86.39 Males per 100 Females in Horn Lake.
What is the Ratio of Females per 100 Males in Horn Lake?
There are 115.75 Females per 100 Males in Horn Lake.
What is the Median Population Age in Horn Lake?
Median Population Age in Horn Lake is 35.5 Years.
What is the Average Family Size in Horn Lake
Average Family Size in Horn Lake is 3.3 People.
What is the Average Household Size in Horn Lake
Average Household Size in Horn Lake is 2.7 People.
What is Per Capita Income in Horn Lake?
Per Capita income in Horn Lake is $26,341.
What is the Median Family Income in Horn Lake?
Median Family Income in Horn Lake is $65,706.
What is the Median Household income in Horn Lake?
Median Household Income in Horn Lake is $57,111.
What is Income or Wage Gap in Horn Lake?
Income or Wage Gap in Horn Lake is 14.2%.
Women in Horn Lake earn 85.8 cents for every dollar earned by a man.
What is Family Income Deficit in Horn Lake?
Family Income Deficit in Horn Lake is $14,243.
Families that are below poverty line in Horn Lake earn $14,243 less on average than the poverty threshold level.
What is Inequality or Gini Index in Horn Lake?
Inequality or Gini Index in Horn Lake is 0.40.
How Large is the Labor Force in Horn Lake?
There are 14,160 People in the Labor Forcein in Horn Lake.
What is the Percentage of People in the Labor Force in Horn Lake?
66.7% of People are in the Labor Force in Horn Lake.
What is the Unemployment Rate in Horn Lake?
Unemployment Rate in Horn Lake is 7.9%.