Jackson, MS
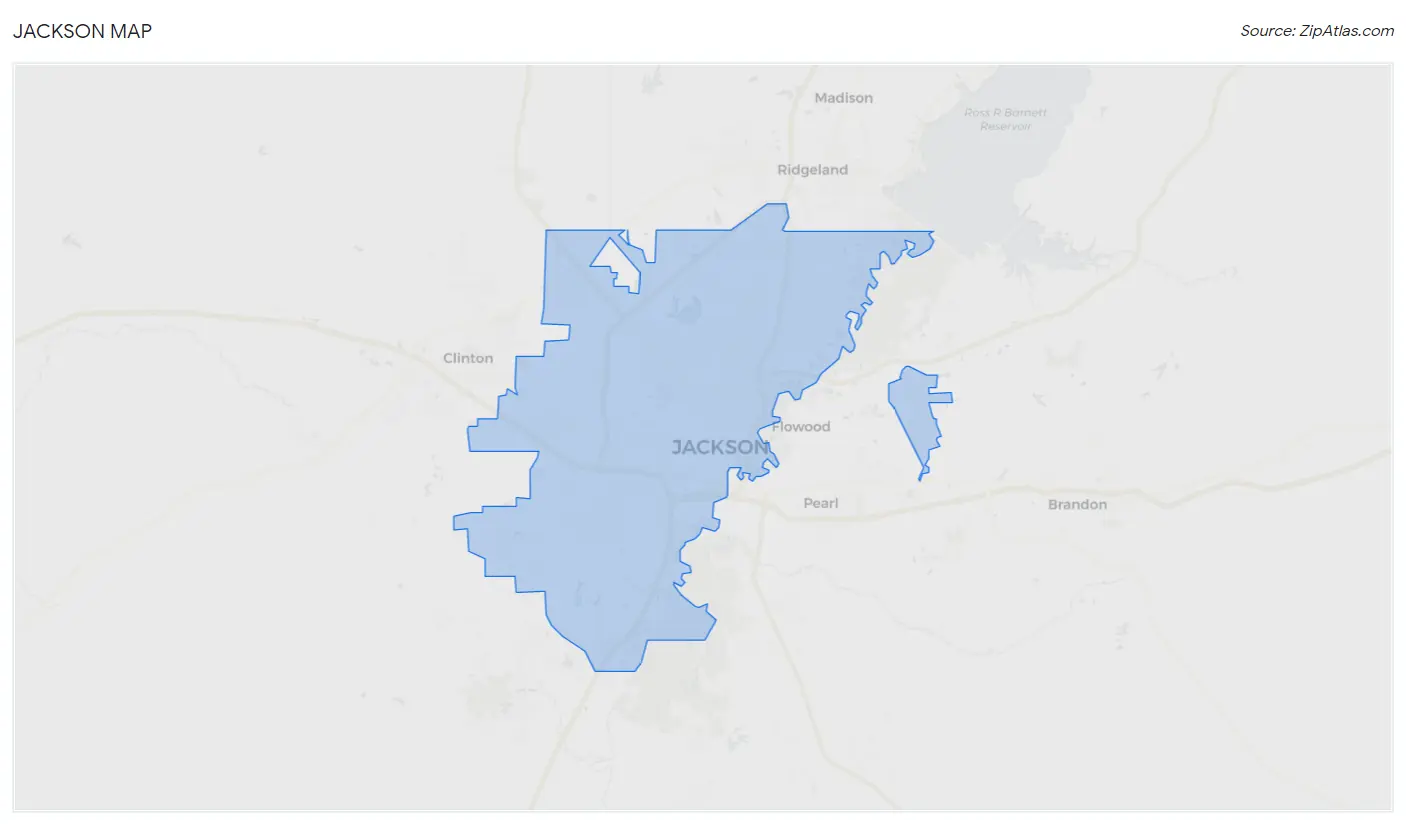
Jackson Map
Jackson Overview
153,271
TOTAL POPULATION
70,518
MALE POPULATION
82,753
FEMALE POPULATION
85.22
MALES / 100 FEMALES
117.35
FEMALES / 100 MALES
34.1
MEDIAN AGE
3.2
AVG FAMILY SIZE
2.4
AVG HOUSEHOLD SIZE
$25,413
PER CAPITA INCOME
$52,443
AVG FAMILY INCOME
$42,193
AVG HOUSEHOLD INCOME
21.9%
WAGE / INCOME GAP [ % ]
78.1¢/ $1
WAGE / INCOME GAP [ $ ]
$11,115
FAMILY INCOME DEFICIT
0.50
INEQUALITY / GINI INDEX
72,835
LABOR FORCE [ PEOPLE ]
60.6%
PERCENT IN LABOR FORCE
9.3%
UNEMPLOYMENT RATE
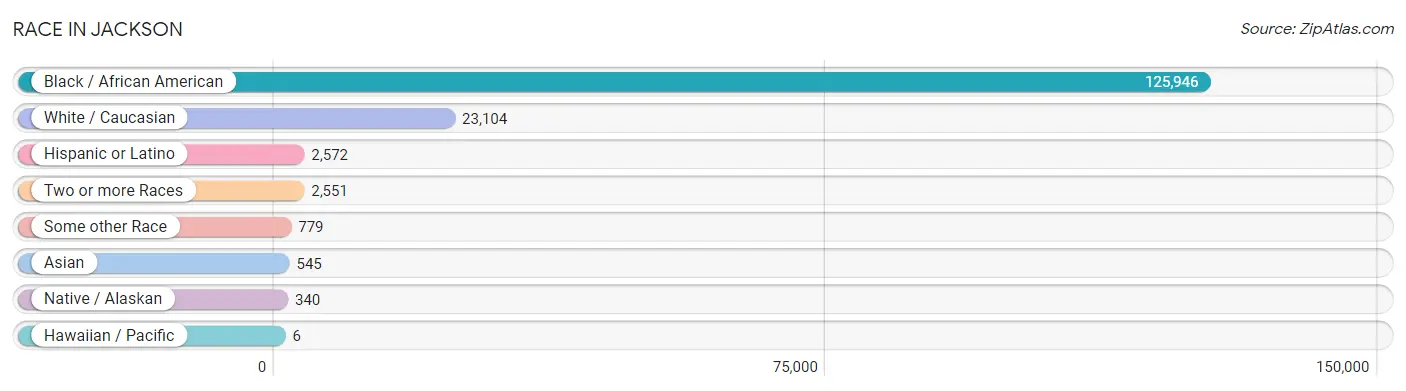
Race in Jackson
The most populous races in Jackson are Black / African American (125,946 | 82.2%), White / Caucasian (23,104 | 15.1%), and Hispanic or Latino (2,572 | 1.7%).
| Race | # Population | % Population |
| Asian | 545 | 0.4% |
| Black / African American | 125,946 | 82.2% |
| Hawaiian / Pacific | 6 | 0.0% |
| Hispanic or Latino | 2,572 | 1.7% |
| Native / Alaskan | 340 | 0.2% |
| White / Caucasian | 23,104 | 15.1% |
| Two or more Races | 2,551 | 1.7% |
| Some other Race | 779 | 0.5% |
| Total | 153,271 | 100.0% |
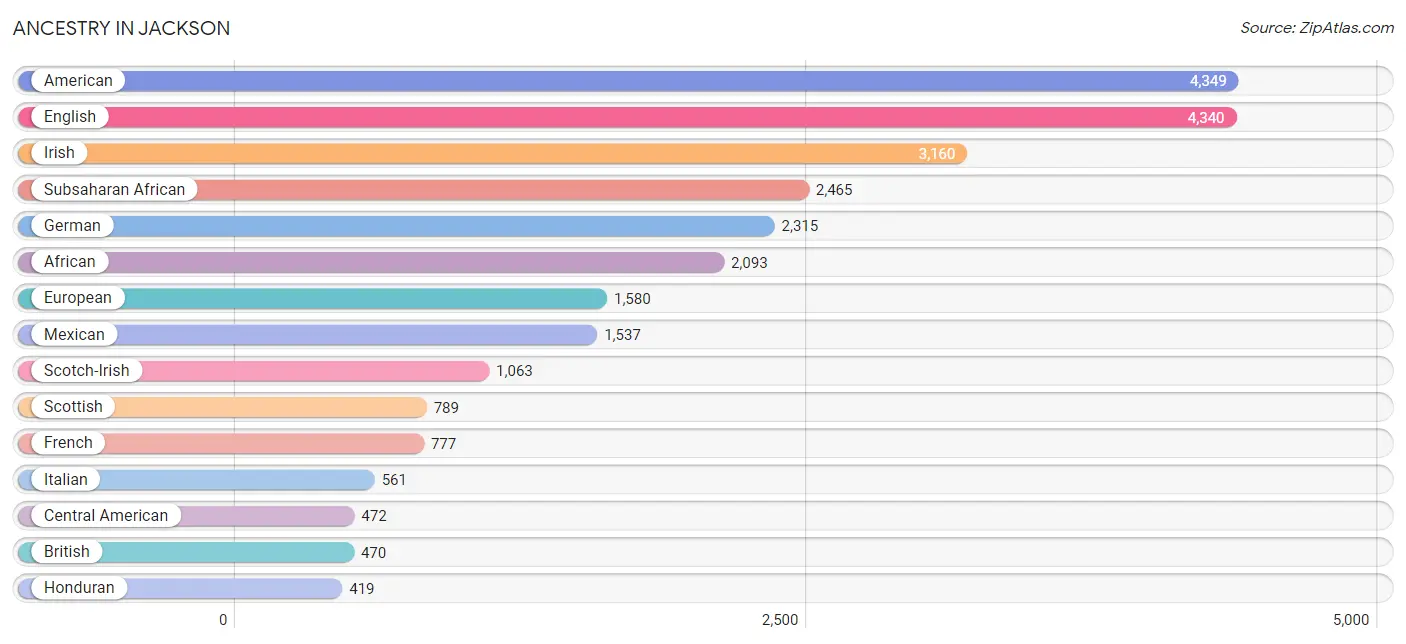
Ancestry in Jackson
The most populous ancestries reported in Jackson are American (4,349 | 2.8%), English (4,340 | 2.8%), Irish (3,160 | 2.1%), Subsaharan African (2,465 | 1.6%), and German (2,315 | 1.5%), together accounting for 10.9% of all Jackson residents.
| Ancestry | # Population | % Population |
| African | 2,093 | 1.4% |
| Albanian | 7 | 0.0% |
| American | 4,349 | 2.8% |
| Arab | 339 | 0.2% |
| Austrian | 14 | 0.0% |
| Belgian | 7 | 0.0% |
| Belizean | 8 | 0.0% |
| Blackfeet | 266 | 0.2% |
| British | 470 | 0.3% |
| Bulgarian | 7 | 0.0% |
| Burmese | 77 | 0.1% |
| Cajun | 55 | 0.0% |
| Canadian | 38 | 0.0% |
| Carpatho Rusyn | 31 | 0.0% |
| Central American | 472 | 0.3% |
| Central American Indian | 210 | 0.1% |
| Cherokee | 82 | 0.1% |
| Cheyenne | 11 | 0.0% |
| Chickasaw | 25 | 0.0% |
| Chinese | 11 | 0.0% |
| Chippewa | 12 | 0.0% |
| Choctaw | 148 | 0.1% |
| Colombian | 80 | 0.1% |
| Creek | 20 | 0.0% |
| Cuban | 103 | 0.1% |
| Czech | 19 | 0.0% |
| Danish | 19 | 0.0% |
| Dominican | 55 | 0.0% |
| Dutch | 234 | 0.2% |
| Eastern European | 7 | 0.0% |
| Ecuadorian | 18 | 0.0% |
| Egyptian | 42 | 0.0% |
| English | 4,340 | 2.8% |
| Ethiopian | 58 | 0.0% |
| European | 1,580 | 1.0% |
| Finnish | 11 | 0.0% |
| French | 777 | 0.5% |
| French Canadian | 107 | 0.1% |
| German | 2,315 | 1.5% |
| Greek | 285 | 0.2% |
| Guamanian / Chamorro | 6 | 0.0% |
| Guatemalan | 35 | 0.0% |
| Haitian | 62 | 0.0% |
| Honduran | 419 | 0.3% |
| Indian (Asian) | 261 | 0.2% |
| Iranian | 49 | 0.0% |
| Irish | 3,160 | 2.1% |
| Israeli | 238 | 0.2% |
| Italian | 561 | 0.4% |
| Jamaican | 120 | 0.1% |
| Korean | 85 | 0.1% |
| Lebanese | 225 | 0.2% |
| Lithuanian | 5 | 0.0% |
| Mexican | 1,537 | 1.0% |
| Mexican American Indian | 21 | 0.0% |
| Moroccan | 34 | 0.0% |
| Nigerian | 286 | 0.2% |
| Northern European | 51 | 0.0% |
| Norwegian | 78 | 0.1% |
| Pakistani | 20 | 0.0% |
| Palestinian | 5 | 0.0% |
| Polish | 272 | 0.2% |
| Portuguese | 37 | 0.0% |
| Puerto Rican | 178 | 0.1% |
| Russian | 36 | 0.0% |
| Salvadoran | 18 | 0.0% |
| Scandinavian | 125 | 0.1% |
| Scotch-Irish | 1,063 | 0.7% |
| Scottish | 789 | 0.5% |
| Serbian | 10 | 0.0% |
| Shoshone | 6 | 0.0% |
| Slovak | 18 | 0.0% |
| South American | 98 | 0.1% |
| Spaniard | 14 | 0.0% |
| Spanish | 102 | 0.1% |
| Sri Lankan | 77 | 0.1% |
| Subsaharan African | 2,465 | 1.6% |
| Swedish | 299 | 0.2% |
| Swiss | 27 | 0.0% |
| Thai | 175 | 0.1% |
| Ukrainian | 11 | 0.0% |
| Welsh | 193 | 0.1% | View All 82 Rows |
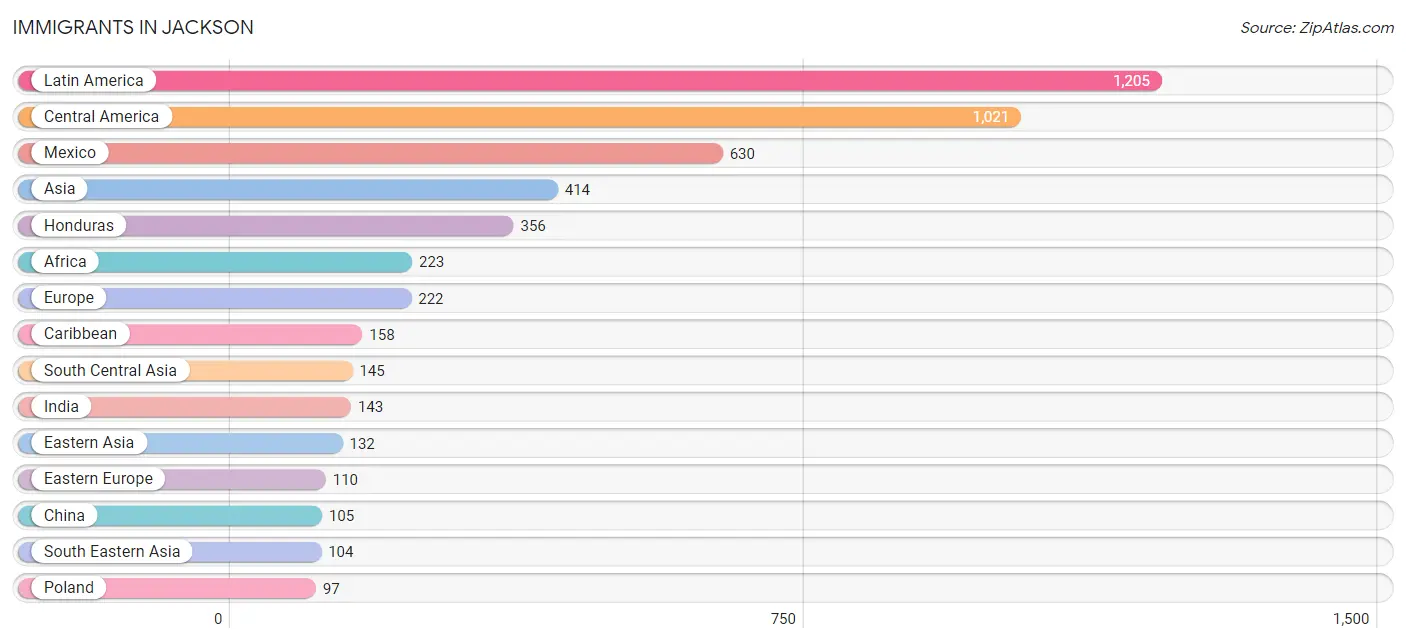
Immigrants in Jackson
The most numerous immigrant groups reported in Jackson came from Latin America (1,205 | 0.8%), Central America (1,021 | 0.7%), Mexico (630 | 0.4%), Asia (414 | 0.3%), and Honduras (356 | 0.2%), together accounting for 2.4% of all Jackson residents.
| Immigration Origin | # Population | % Population |
| Africa | 223 | 0.2% |
| Asia | 414 | 0.3% |
| Barbados | 15 | 0.0% |
| Belgium | 7 | 0.0% |
| Brazil | 1 | 0.0% |
| Bulgaria | 7 | 0.0% |
| Canada | 15 | 0.0% |
| Caribbean | 158 | 0.1% |
| Central America | 1,021 | 0.7% |
| China | 105 | 0.1% |
| Colombia | 7 | 0.0% |
| Cuba | 38 | 0.0% |
| Dominican Republic | 1 | 0.0% |
| Eastern Africa | 58 | 0.0% |
| Eastern Asia | 132 | 0.1% |
| Eastern Europe | 110 | 0.1% |
| Ecuador | 18 | 0.0% |
| England | 32 | 0.0% |
| Ethiopia | 58 | 0.0% |
| Europe | 222 | 0.1% |
| Germany | 20 | 0.0% |
| Guatemala | 35 | 0.0% |
| Haiti | 40 | 0.0% |
| Honduras | 356 | 0.2% |
| India | 143 | 0.1% |
| Italy | 3 | 0.0% |
| Jamaica | 64 | 0.0% |
| Japan | 5 | 0.0% |
| Kazakhstan | 2 | 0.0% |
| Korea | 22 | 0.0% |
| Latin America | 1,205 | 0.8% |
| Lebanon | 33 | 0.0% |
| Liberia | 16 | 0.0% |
| Mexico | 630 | 0.4% |
| Morocco | 23 | 0.0% |
| Netherlands | 12 | 0.0% |
| Nigeria | 81 | 0.1% |
| Northern Africa | 23 | 0.0% |
| Northern Europe | 32 | 0.0% |
| Philippines | 63 | 0.0% |
| Poland | 97 | 0.1% |
| Russia | 6 | 0.0% |
| South Africa | 30 | 0.0% |
| South America | 26 | 0.0% |
| South Central Asia | 145 | 0.1% |
| South Eastern Asia | 104 | 0.1% |
| Southern Europe | 35 | 0.0% |
| Spain | 32 | 0.0% |
| Switzerland | 6 | 0.0% |
| Taiwan | 30 | 0.0% |
| Thailand | 7 | 0.0% |
| Vietnam | 34 | 0.0% |
| Western Africa | 97 | 0.1% |
| Western Asia | 33 | 0.0% |
| Western Europe | 45 | 0.0% | View All 55 Rows |
Sex and Age in Jackson
Sex and Age in Jackson
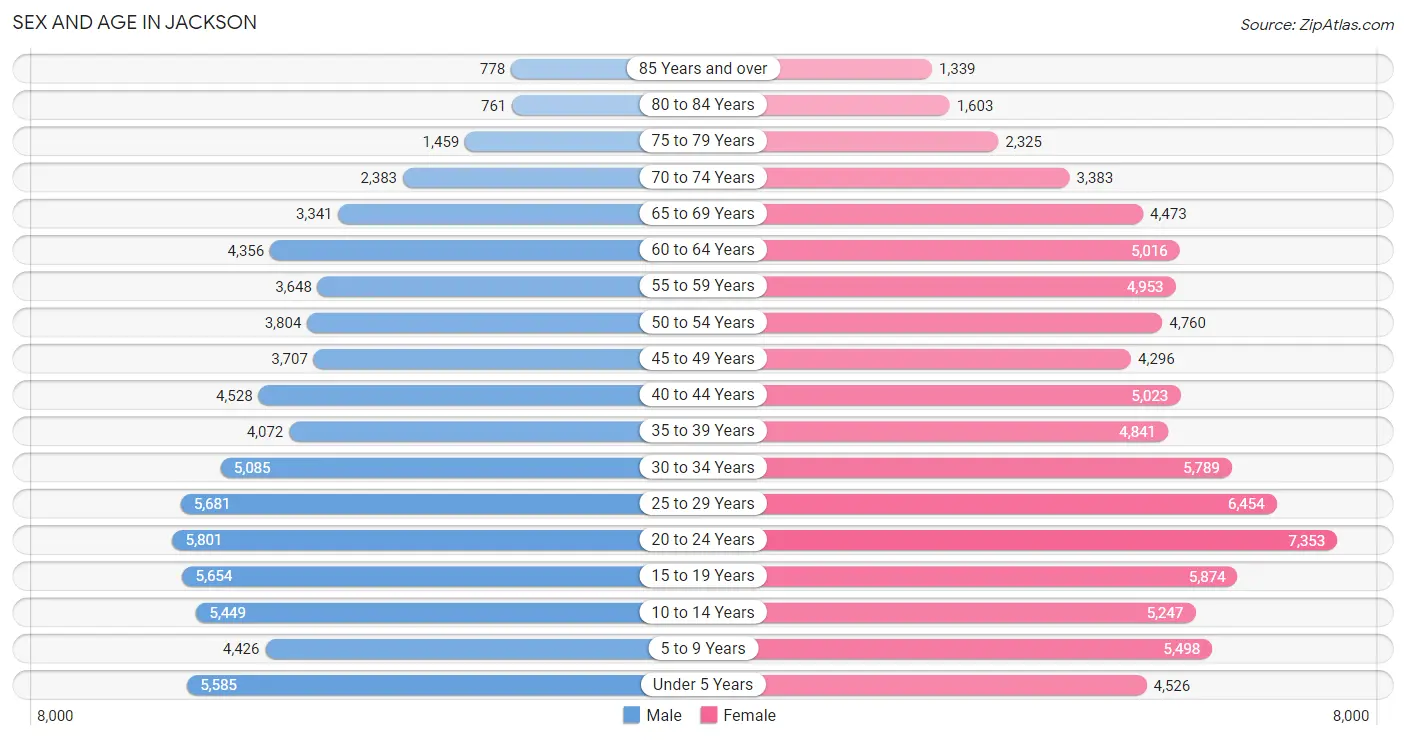
The most populous age groups in Jackson are 20 to 24 Years (5,801 | 8.2%) for men and 20 to 24 Years (7,353 | 8.9%) for women.
| Age Bracket | Male | Female |
| Under 5 Years | 5,585 (7.9%) | 4,526 (5.5%) |
| 5 to 9 Years | 4,426 (6.3%) | 5,498 (6.6%) |
| 10 to 14 Years | 5,449 (7.7%) | 5,247 (6.3%) |
| 15 to 19 Years | 5,654 (8.0%) | 5,874 (7.1%) |
| 20 to 24 Years | 5,801 (8.2%) | 7,353 (8.9%) |
| 25 to 29 Years | 5,681 (8.1%) | 6,454 (7.8%) |
| 30 to 34 Years | 5,085 (7.2%) | 5,789 (7.0%) |
| 35 to 39 Years | 4,072 (5.8%) | 4,841 (5.9%) |
| 40 to 44 Years | 4,528 (6.4%) | 5,023 (6.1%) |
| 45 to 49 Years | 3,707 (5.3%) | 4,296 (5.2%) |
| 50 to 54 Years | 3,804 (5.4%) | 4,760 (5.8%) |
| 55 to 59 Years | 3,648 (5.2%) | 4,953 (6.0%) |
| 60 to 64 Years | 4,356 (6.2%) | 5,016 (6.1%) |
| 65 to 69 Years | 3,341 (4.7%) | 4,473 (5.4%) |
| 70 to 74 Years | 2,383 (3.4%) | 3,383 (4.1%) |
| 75 to 79 Years | 1,459 (2.1%) | 2,325 (2.8%) |
| 80 to 84 Years | 761 (1.1%) | 1,603 (1.9%) |
| 85 Years and over | 778 (1.1%) | 1,339 (1.6%) |
| Total | 70,518 (100.0%) | 82,753 (100.0%) |
Families and Households in Jackson
Median Family Size in Jackson
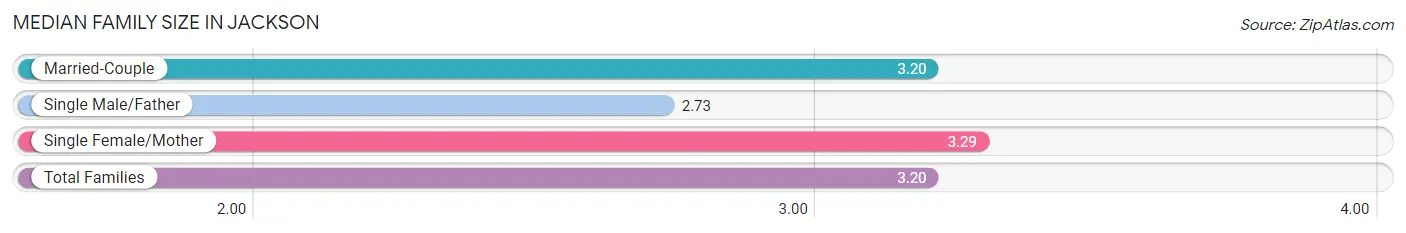
The median family size in Jackson is 3.20 persons per family, with single female/mother families (15,323 | 44.0%) accounting for the largest median family size of 3.29 persons per family. On the other hand, single male/father families (3,058 | 8.8%) represent the smallest median family size with 2.73 persons per family.
| Family Type | # Families | Family Size |
| Married-Couple | 16,435 (47.2%) | 3.20 |
| Single Male/Father | 3,058 (8.8%) | 2.73 |
| Single Female/Mother | 15,323 (44.0%) | 3.29 |
| Total Families | 34,816 (100.0%) | 3.20 |
Median Household Size in Jackson
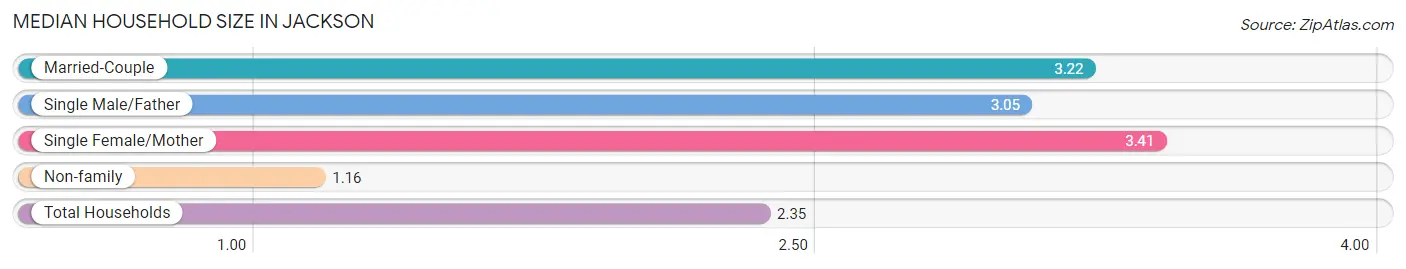
The median household size in Jackson is 2.35 persons per household, with single female/mother households (15,323 | 24.7%) accounting for the largest median household size of 3.41 persons per household. non-family households (27,237 | 43.9%) represent the smallest median household size with 1.16 persons per household.
| Household Type | # Households | Household Size |
| Married-Couple | 16,435 (26.5%) | 3.22 |
| Single Male/Father | 3,058 (4.9%) | 3.05 |
| Single Female/Mother | 15,323 (24.7%) | 3.41 |
| Non-family | 27,237 (43.9%) | 1.16 |
| Total Households | 62,053 (100.0%) | 2.35 |
Household Size by Marriage Status in Jackson
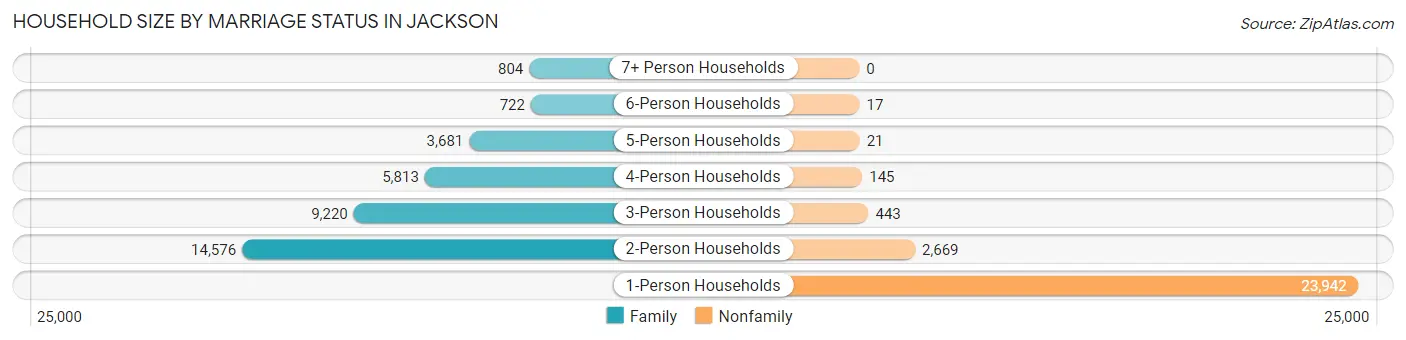
Out of a total of 62,053 households in Jackson, 34,816 (56.1%) are family households, while 27,237 (43.9%) are nonfamily households. The most numerous type of family households are 2-person households, comprising 14,576, and the most common type of nonfamily households are 1-person households, comprising 23,942.
| Household Size | Family Households | Nonfamily Households |
| 1-Person Households | - | 23,942 (38.6%) |
| 2-Person Households | 14,576 (23.5%) | 2,669 (4.3%) |
| 3-Person Households | 9,220 (14.9%) | 443 (0.7%) |
| 4-Person Households | 5,813 (9.4%) | 145 (0.2%) |
| 5-Person Households | 3,681 (5.9%) | 21 (0.0%) |
| 6-Person Households | 722 (1.2%) | 17 (0.0%) |
| 7+ Person Households | 804 (1.3%) | 0 (0.0%) |
| Total | 34,816 (56.1%) | 27,237 (43.9%) |
Female Fertility in Jackson
Fertility by Age in Jackson
Average fertility rate in Jackson is 58.0 births per 1,000 women. Women in the age bracket of 20 to 34 years have the highest fertility rate with 101.0 births per 1,000 women. Women in the age bracket of 20 to 34 years acount for 82.9% of all women with births.
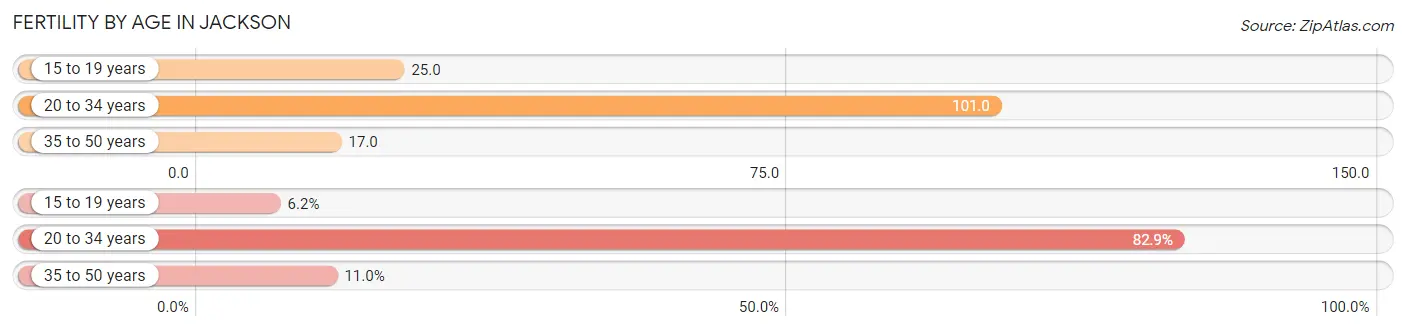
| Age Bracket | Women with Births | Births / 1,000 Women |
| 15 to 19 years | 147 (6.2%) | 25.0 |
| 20 to 34 years | 1,977 (82.9%) | 101.0 |
| 35 to 50 years | 262 (11.0%) | 17.0 |
| Total | 2,386 (100.0%) | 58.0 |
Fertility by Age by Marriage Status in Jackson
24.3% of women with births (2,386) in Jackson are married. The highest percentage of unmarried women with births falls into 15 to 19 years age bracket with 95.2% of them unmarried at the time of birth, while the lowest percentage of unmarried women with births belong to 35 to 50 years age bracket with 43.1% of them unmarried.
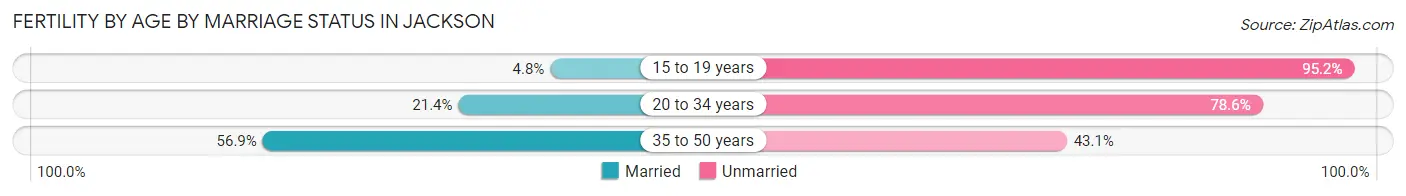
| Age Bracket | Married | Unmarried |
| 15 to 19 years | 7 (4.8%) | 140 (95.2%) |
| 20 to 34 years | 423 (21.4%) | 1,554 (78.6%) |
| 35 to 50 years | 149 (56.9%) | 113 (43.1%) |
| Total | 580 (24.3%) | 1,806 (75.7%) |
Fertility by Education in Jackson
Average fertility rate in Jackson is 58.0 births per 1,000 women. Women with the education attainment of high school diploma have the highest fertility rate of 75.0 births per 1,000 women, while women with the education attainment of bachelor's degree have the lowest fertility at 40.0 births per 1,000 women. Women with the education attainment of college or associate's degree represent 41.2% of all women with births.
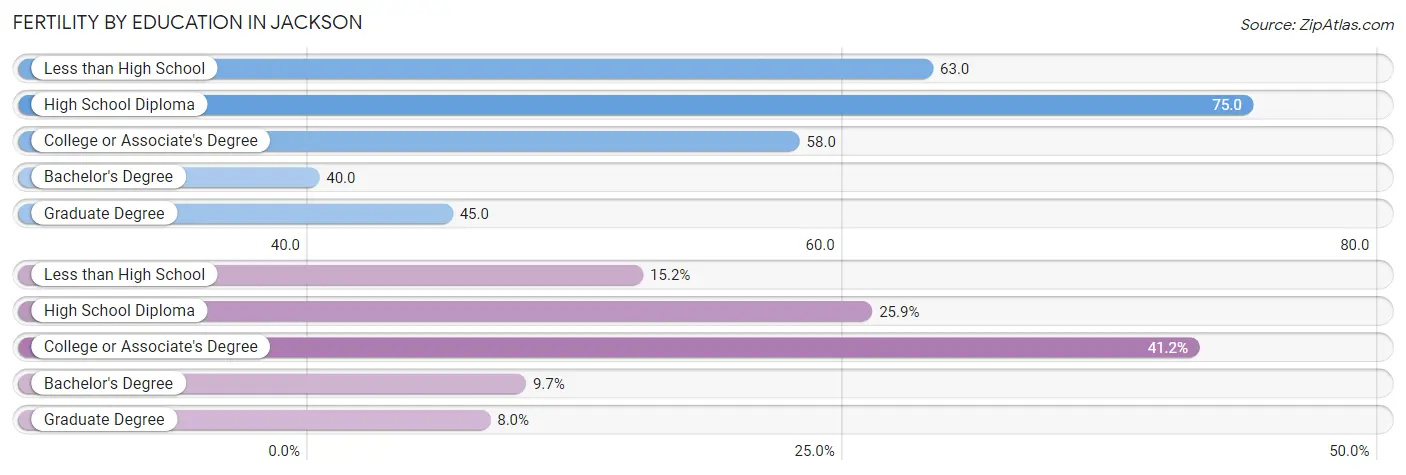
| Educational Attainment | Women with Births | Births / 1,000 Women |
| Less than High School | 362 (15.2%) | 63.0 |
| High School Diploma | 618 (25.9%) | 75.0 |
| College or Associate's Degree | 984 (41.2%) | 58.0 |
| Bachelor's Degree | 231 (9.7%) | 40.0 |
| Graduate Degree | 191 (8.0%) | 45.0 |
| Total | 2,386 (100.0%) | 58.0 |
Fertility by Education by Marriage Status in Jackson
75.7% of women with births in Jackson are unmarried. Women with the educational attainment of graduate degree are most likely to be married with 84.8% of them married at childbirth, while women with the educational attainment of high school diploma are least likely to be married with 94.5% of them unmarried at childbirth.
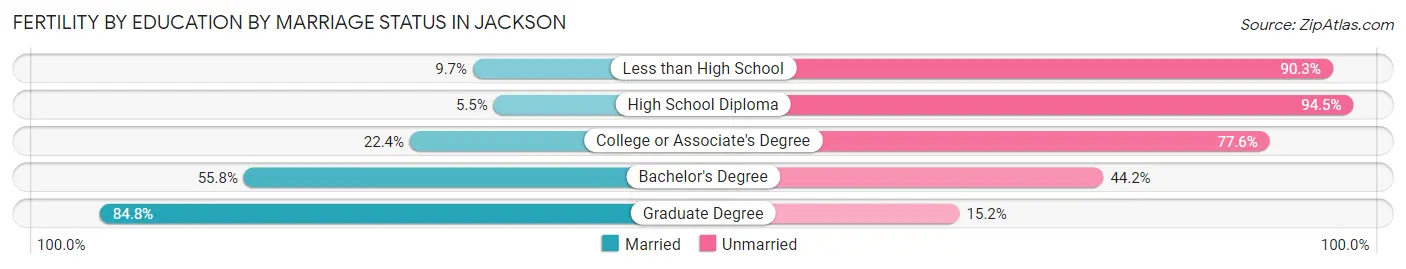
| Educational Attainment | Married | Unmarried |
| Less than High School | 35 (9.7%) | 327 (90.3%) |
| High School Diploma | 34 (5.5%) | 584 (94.5%) |
| College or Associate's Degree | 220 (22.4%) | 764 (77.6%) |
| Bachelor's Degree | 129 (55.8%) | 102 (44.2%) |
| Graduate Degree | 162 (84.8%) | 29 (15.2%) |
| Total | 580 (24.3%) | 1,806 (75.7%) |
Income in Jackson
Income Overview in Jackson
Per Capita Income in Jackson is $25,413, while median incomes of families and households are $52,443 and $42,193 respectively.
| Characteristic | Number | Measure |
| Per Capita Income | 153,271 | $25,413 |
| Median Family Income | 34,816 | $52,443 |
| Mean Family Income | 34,816 | $76,021 |
| Median Household Income | 62,053 | $42,193 |
| Mean Household Income | 62,053 | $61,182 |
| Income Deficit | 34,816 | $11,115 |
| Wage / Income Gap (%) | 153,271 | 21.87% |
| Wage / Income Gap ($) | 153,271 | 78.13¢ per $1 |
| Gini / Inequality Index | 153,271 | 0.50 |
Earnings by Sex in Jackson
Average Earnings in Jackson are $28,901, $33,311 for men and $26,027 for women, a difference of 21.9%.
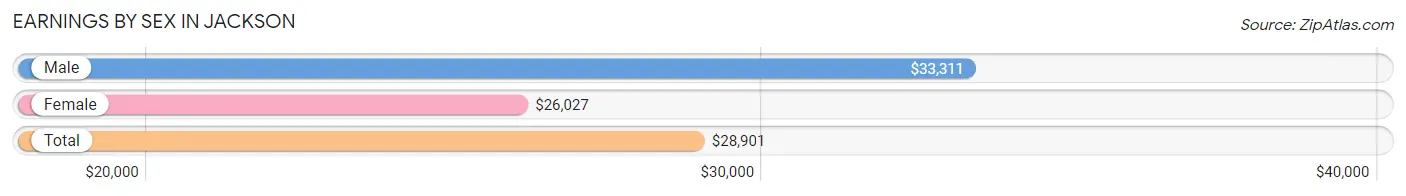
| Sex | Number | Average Earnings |
| Male | 33,922 (45.8%) | $33,311 |
| Female | 40,106 (54.2%) | $26,027 |
| Total | 74,028 (100.0%) | $28,901 |
Earnings by Sex by Income Bracket in Jackson
The most common earnings brackets in Jackson are $55,000 to $64,999 for men (2,844 | 8.4%) and $25,000 to $29,999 for women (4,205 | 10.5%).
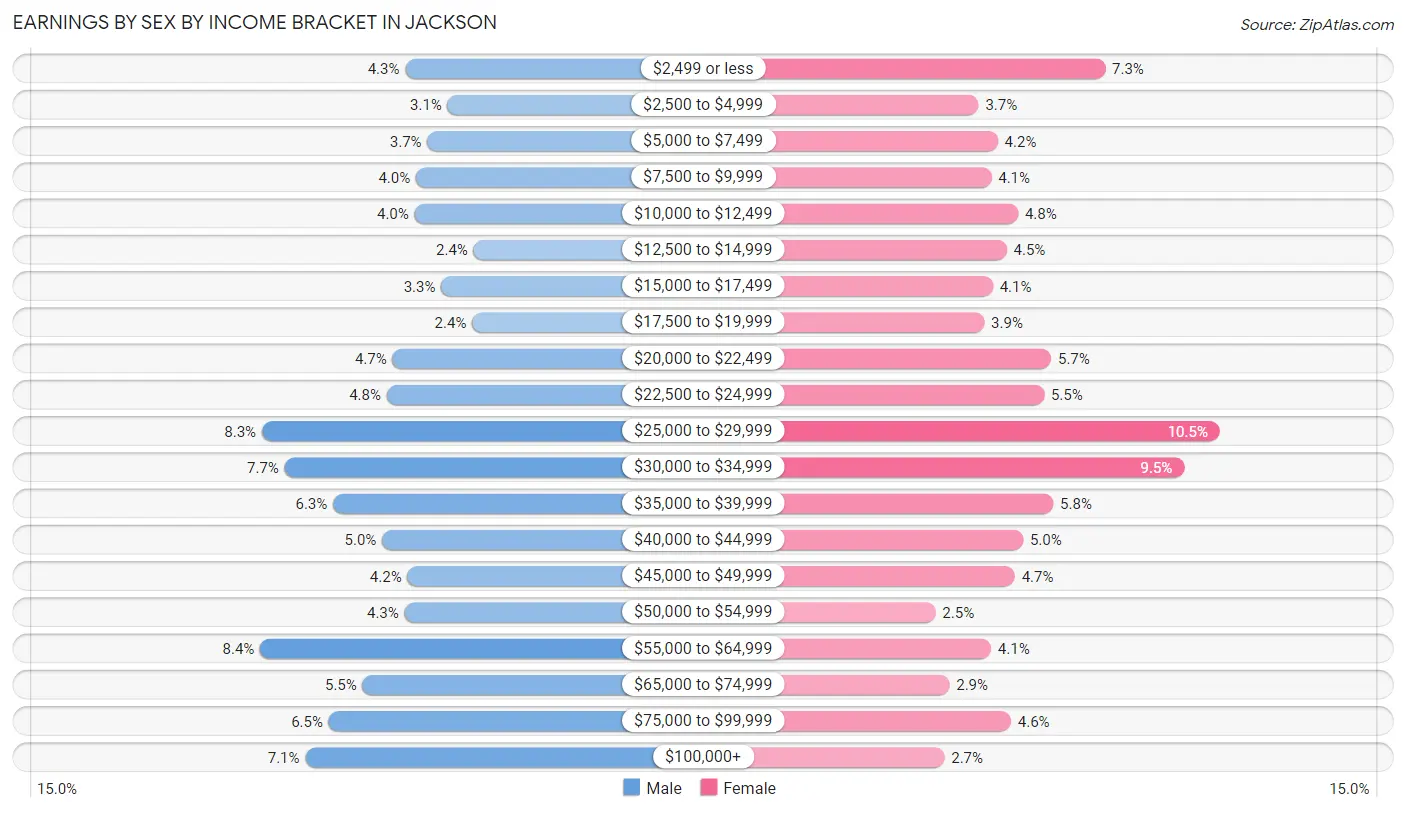
| Income | Male | Female |
| $2,499 or less | 1,460 (4.3%) | 2,913 (7.3%) |
| $2,500 to $4,999 | 1,055 (3.1%) | 1,482 (3.7%) |
| $5,000 to $7,499 | 1,247 (3.7%) | 1,699 (4.2%) |
| $7,500 to $9,999 | 1,356 (4.0%) | 1,627 (4.1%) |
| $10,000 to $12,499 | 1,372 (4.0%) | 1,931 (4.8%) |
| $12,500 to $14,999 | 809 (2.4%) | 1,801 (4.5%) |
| $15,000 to $17,499 | 1,116 (3.3%) | 1,643 (4.1%) |
| $17,500 to $19,999 | 820 (2.4%) | 1,550 (3.9%) |
| $20,000 to $22,499 | 1,580 (4.7%) | 2,302 (5.7%) |
| $22,500 to $24,999 | 1,635 (4.8%) | 2,221 (5.5%) |
| $25,000 to $29,999 | 2,827 (8.3%) | 4,205 (10.5%) |
| $30,000 to $34,999 | 2,607 (7.7%) | 3,803 (9.5%) |
| $35,000 to $39,999 | 2,147 (6.3%) | 2,328 (5.8%) |
| $40,000 to $44,999 | 1,679 (5.0%) | 1,986 (5.0%) |
| $45,000 to $49,999 | 1,437 (4.2%) | 1,894 (4.7%) |
| $50,000 to $54,999 | 1,464 (4.3%) | 997 (2.5%) |
| $55,000 to $64,999 | 2,844 (8.4%) | 1,624 (4.1%) |
| $65,000 to $74,999 | 1,867 (5.5%) | 1,154 (2.9%) |
| $75,000 to $99,999 | 2,187 (6.5%) | 1,848 (4.6%) |
| $100,000+ | 2,413 (7.1%) | 1,098 (2.7%) |
| Total | 33,922 (100.0%) | 40,106 (100.0%) |
Earnings by Sex by Educational Attainment in Jackson
Average earnings in Jackson are $37,887 for men and $28,729 for women, a difference of 24.2%. Men with an educational attainment of graduate degree enjoy the highest average annual earnings of $72,569, while those with less than high school education earn the least with $23,843. Women with an educational attainment of graduate degree earn the most with the average annual earnings of $48,361, while those with less than high school education have the smallest earnings of $13,772.
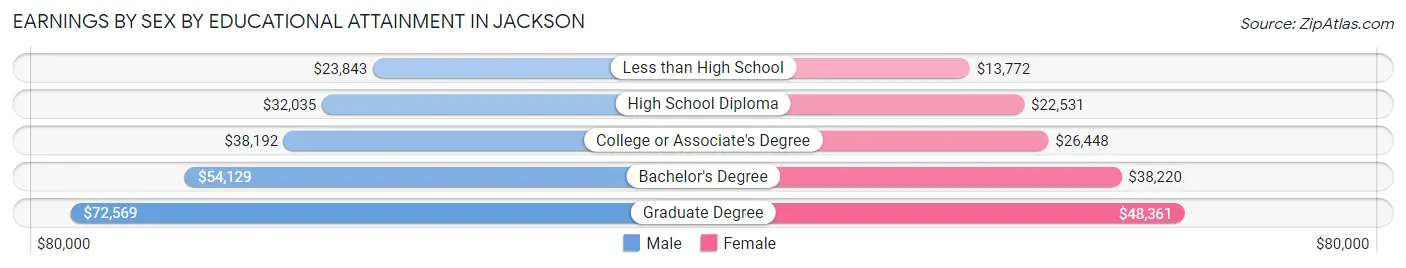
| Educational Attainment | Male Income | Female Income |
| Less than High School | $23,843 | $13,772 |
| High School Diploma | $32,035 | $22,531 |
| College or Associate's Degree | $38,192 | $26,448 |
| Bachelor's Degree | $54,129 | $38,220 |
| Graduate Degree | $72,569 | $48,361 |
| Total | $37,887 | $28,729 |
Family Income in Jackson
Family Income Brackets in Jackson
According to the Jackson family income data, there are 6,754 families falling into the $50,000 to $74,999 income range, which is the most common income bracket and makes up 19.4% of all families. Conversely, the $200,000+ income bracket is the least frequent group with only 1,636 families (4.7%) belonging to this category.
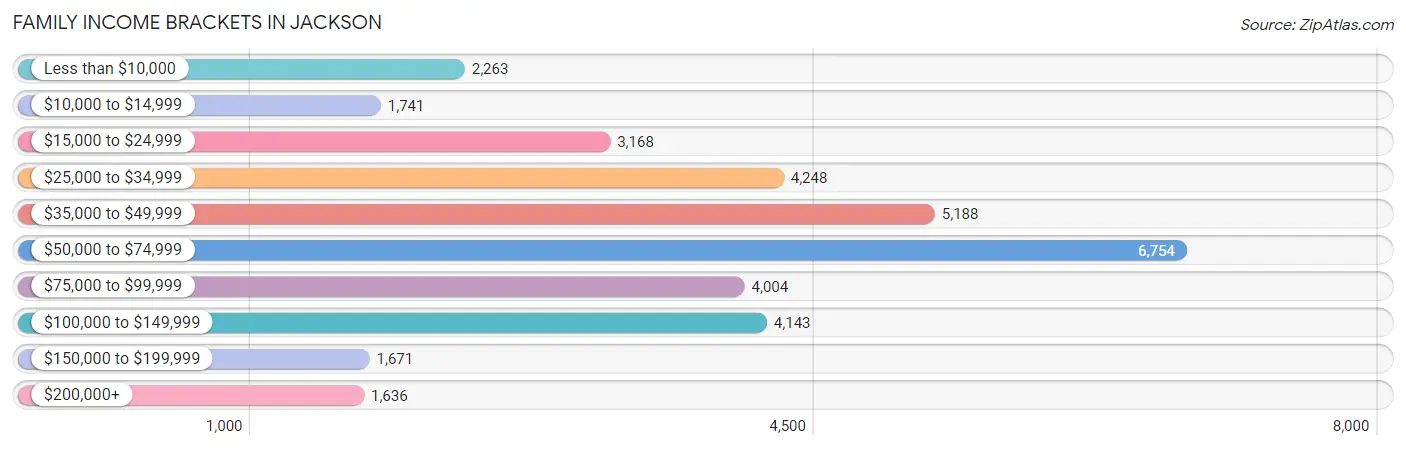
| Income Bracket | # Families | % Families |
| Less than $10,000 | 2,263 | 6.5% |
| $10,000 to $14,999 | 1,741 | 5.0% |
| $15,000 to $24,999 | 3,168 | 9.1% |
| $25,000 to $34,999 | 4,248 | 12.2% |
| $35,000 to $49,999 | 5,188 | 14.9% |
| $50,000 to $74,999 | 6,754 | 19.4% |
| $75,000 to $99,999 | 4,004 | 11.5% |
| $100,000 to $149,999 | 4,143 | 11.9% |
| $150,000 to $199,999 | 1,671 | 4.8% |
| $200,000+ | 1,636 | 4.7% |
Family Income by Famaliy Size in Jackson
5-person families (3,064 | 8.8%) account for the highest median family income in Jackson with $67,584 per family, while 2-person families (15,512 | 44.6%) have the highest median income of $24,663 per family member.
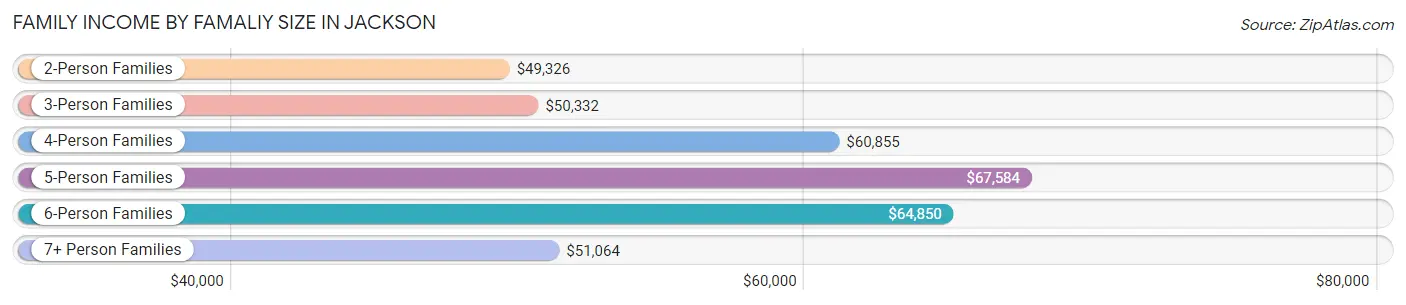
| Income Bracket | # Families | Median Income |
| 2-Person Families | 15,512 (44.6%) | $49,326 |
| 3-Person Families | 9,259 (26.6%) | $50,332 |
| 4-Person Families | 5,566 (16.0%) | $60,855 |
| 5-Person Families | 3,064 (8.8%) | $67,584 |
| 6-Person Families | 675 (1.9%) | $64,850 |
| 7+ Person Families | 740 (2.1%) | $51,064 |
| Total | 34,816 (100.0%) | $52,443 |
Family Income by Number of Earners in Jackson
The median family income in Jackson is $52,443, with families comprising 3+ earners (3,575) having the highest median family income of $97,425, while families with no earners (4,909) have the lowest median family income of $25,248, accounting for 10.3% and 14.1% of families, respectively.
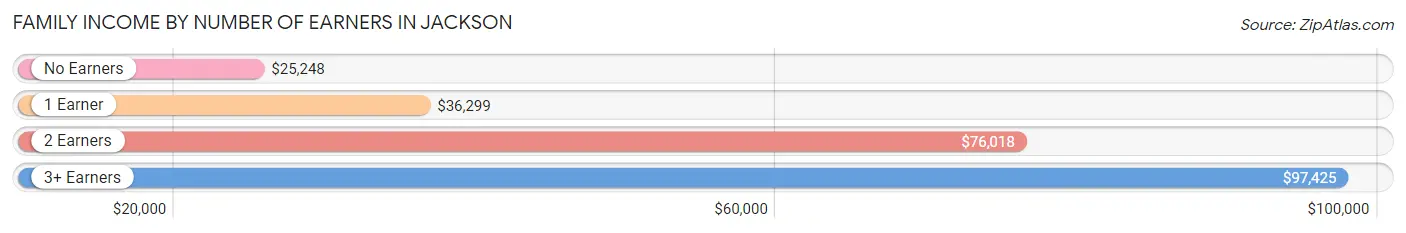
| Number of Earners | # Families | Median Income |
| No Earners | 4,909 (14.1%) | $25,248 |
| 1 Earner | 14,683 (42.2%) | $36,299 |
| 2 Earners | 11,649 (33.5%) | $76,018 |
| 3+ Earners | 3,575 (10.3%) | $97,425 |
| Total | 34,816 (100.0%) | $52,443 |
Household Income in Jackson
Household Income Brackets in Jackson
With 11,356 households falling in the category, the $50,000 to $74,999 income range is the most frequent in Jackson, accounting for 18.3% of all households. In contrast, only 1,924 households (3.1%) fall into the $200,000+ income bracket, making it the least populous group.
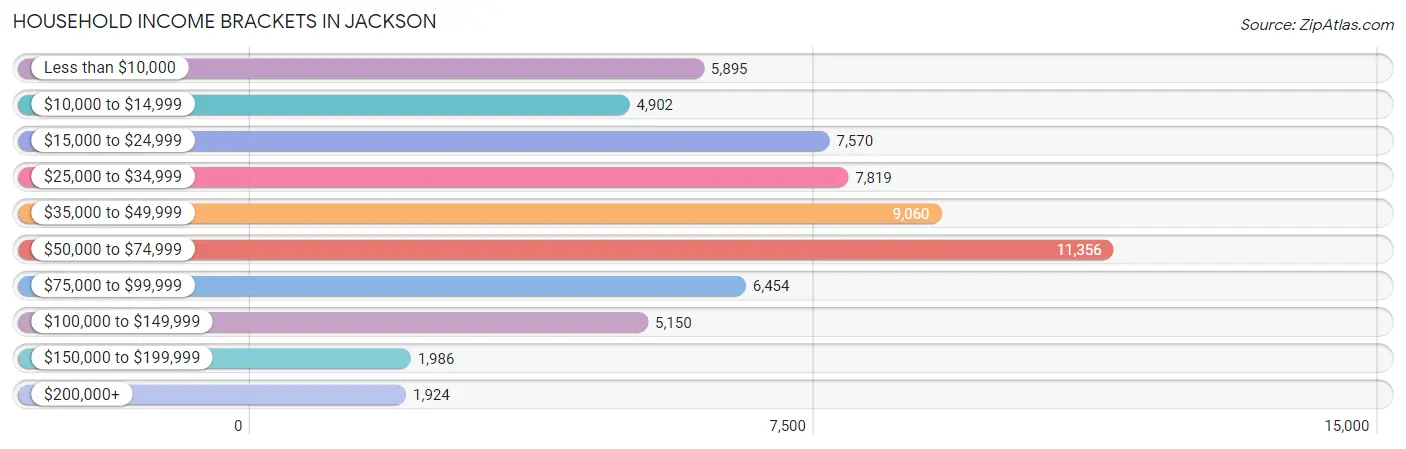
| Income Bracket | # Households | % Households |
| Less than $10,000 | 5,895 | 9.5% |
| $10,000 to $14,999 | 4,902 | 7.9% |
| $15,000 to $24,999 | 7,570 | 12.2% |
| $25,000 to $34,999 | 7,819 | 12.6% |
| $35,000 to $49,999 | 9,060 | 14.6% |
| $50,000 to $74,999 | 11,356 | 18.3% |
| $75,000 to $99,999 | 6,454 | 10.4% |
| $100,000 to $149,999 | 5,150 | 8.3% |
| $150,000 to $199,999 | 1,986 | 3.2% |
| $200,000+ | 1,924 | 3.1% |
Household Income by Householder Age in Jackson
The median household income in Jackson is $42,193, with the highest median household income of $50,036 found in the 45 to 64 years age bracket for the primary householder. A total of 22,232 households (35.8%) fall into this category. Meanwhile, the 15 to 24 years age bracket for the primary householder has the lowest median household income of $24,338, with 2,615 households (4.2%) in this group.
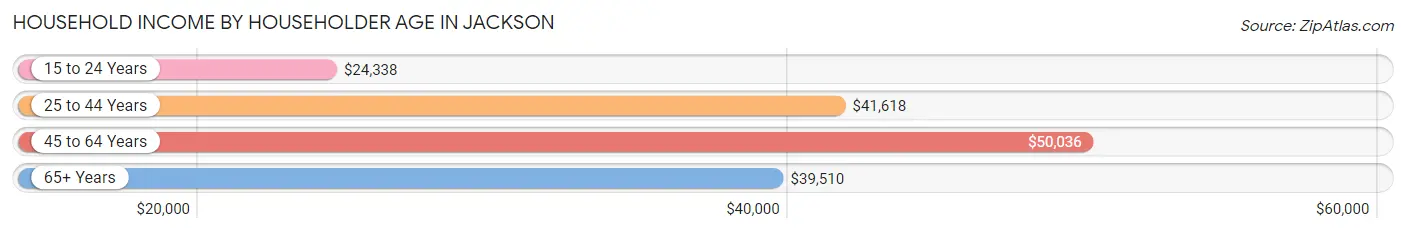
| Income Bracket | # Households | Median Income |
| 15 to 24 Years | 2,615 (4.2%) | $24,338 |
| 25 to 44 Years | 22,439 (36.2%) | $41,618 |
| 45 to 64 Years | 22,232 (35.8%) | $50,036 |
| 65+ Years | 14,767 (23.8%) | $39,510 |
| Total | 62,053 (100.0%) | $42,193 |
Poverty in Jackson
Income Below Poverty by Sex and Age in Jackson
With 23.6% poverty level for males and 27.9% for females among the residents of Jackson, 6 to 11 year old males and 5 year old females are the most vulnerable to poverty, with 2,585 males (46.3%) and 514 females (43.6%) in their respective age groups living below the poverty level.
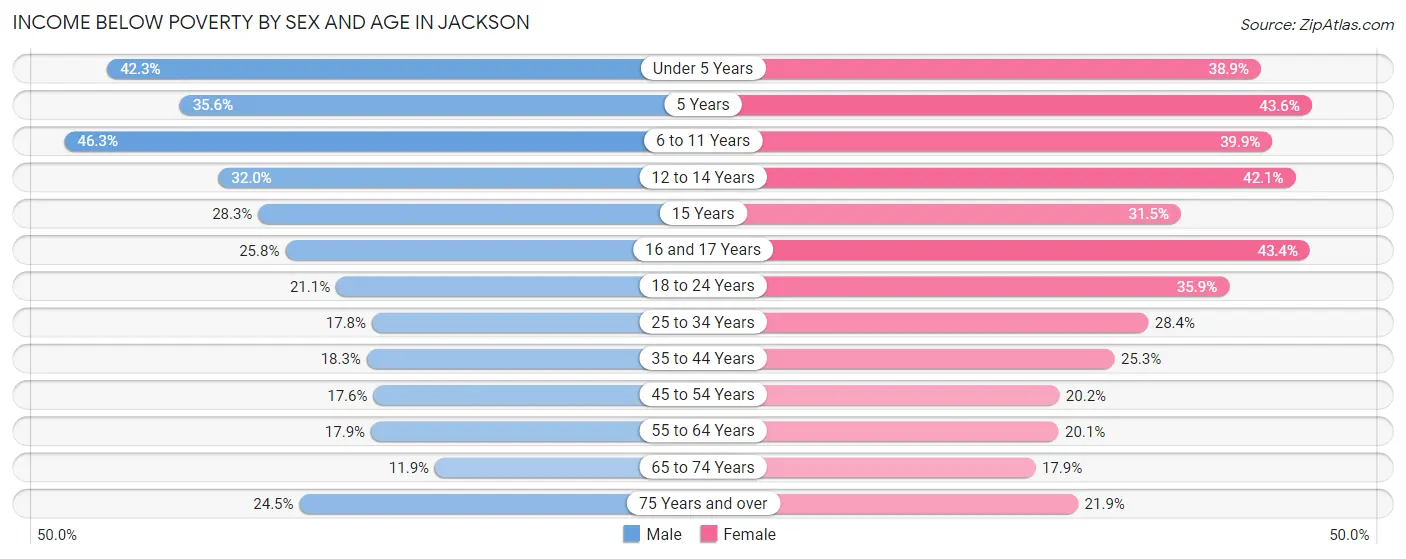
| Age Bracket | Male | Female |
| Under 5 Years | 2,362 (42.3%) | 1,710 (38.9%) |
| 5 Years | 320 (35.6%) | 514 (43.6%) |
| 6 to 11 Years | 2,585 (46.3%) | 2,526 (39.9%) |
| 12 to 14 Years | 1,016 (32.0%) | 1,291 (42.1%) |
| 15 Years | 328 (28.3%) | 370 (31.5%) |
| 16 and 17 Years | 500 (25.8%) | 767 (43.4%) |
| 18 to 24 Years | 1,358 (21.1%) | 2,567 (35.9%) |
| 25 to 34 Years | 1,881 (17.8%) | 3,469 (28.4%) |
| 35 to 44 Years | 1,558 (18.2%) | 2,491 (25.3%) |
| 45 to 54 Years | 1,311 (17.6%) | 1,819 (20.2%) |
| 55 to 64 Years | 1,421 (17.9%) | 1,987 (20.1%) |
| 65 to 74 Years | 674 (11.9%) | 1,404 (17.9%) |
| 75 Years and over | 665 (24.5%) | 1,074 (21.9%) |
| Total | 15,979 (23.6%) | 21,989 (27.9%) |
Income Above Poverty by Sex and Age in Jackson
According to the poverty statistics in Jackson, males aged 65 to 74 years and females aged 65 to 74 years are the age groups that are most secure financially, with 88.1% of males and 82.1% of females in these age groups living above the poverty line.
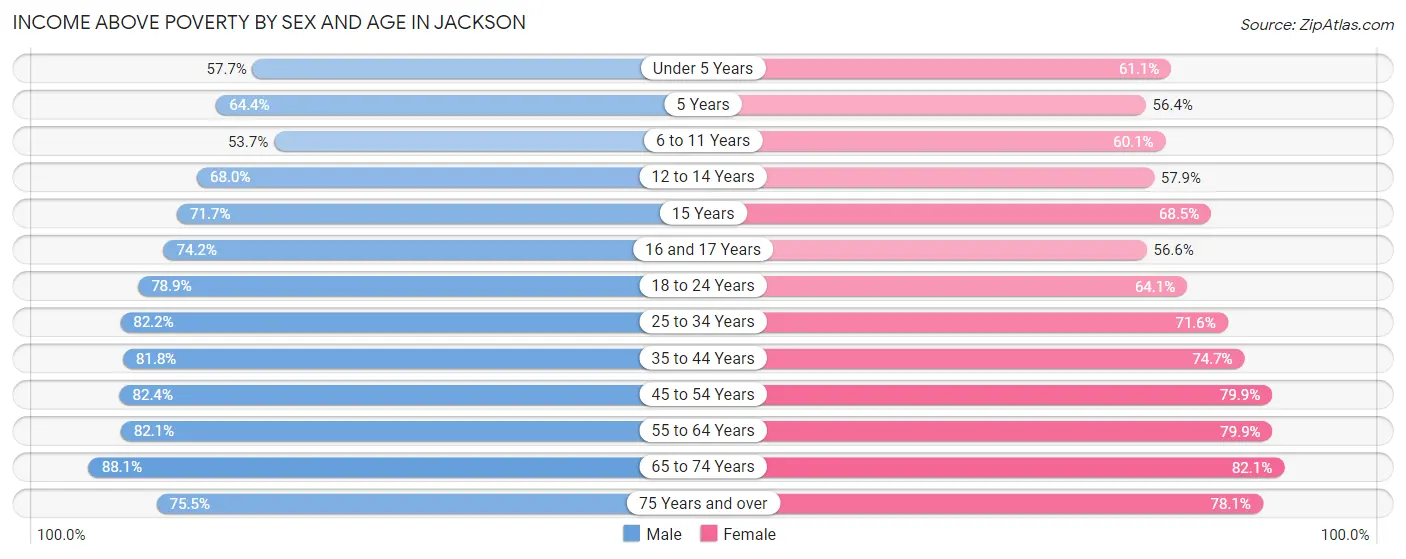
| Age Bracket | Male | Female |
| Under 5 Years | 3,218 (57.7%) | 2,688 (61.1%) |
| 5 Years | 579 (64.4%) | 665 (56.4%) |
| 6 to 11 Years | 2,999 (53.7%) | 3,799 (60.1%) |
| 12 to 14 Years | 2,158 (68.0%) | 1,776 (57.9%) |
| 15 Years | 830 (71.7%) | 806 (68.5%) |
| 16 and 17 Years | 1,437 (74.2%) | 999 (56.6%) |
| 18 to 24 Years | 5,077 (78.9%) | 4,577 (64.1%) |
| 25 to 34 Years | 8,702 (82.2%) | 8,745 (71.6%) |
| 35 to 44 Years | 6,979 (81.8%) | 7,368 (74.7%) |
| 45 to 54 Years | 6,123 (82.4%) | 7,208 (79.8%) |
| 55 to 64 Years | 6,534 (82.1%) | 7,910 (79.9%) |
| 65 to 74 Years | 4,979 (88.1%) | 6,425 (82.1%) |
| 75 Years and over | 2,049 (75.5%) | 3,832 (78.1%) |
| Total | 51,664 (76.4%) | 56,798 (72.1%) |
Income Below Poverty Among Married-Couple Families in Jackson
The poverty statistics for married-couple families in Jackson show that 6.7% or 1,107 of the total 16,435 families live below the poverty line. Families with 5 or more children have the highest poverty rate of 64.0%, comprising of 71 families. On the other hand, families with 1 or 2 children have the lowest poverty rate of 4.3%, which includes 203 families.
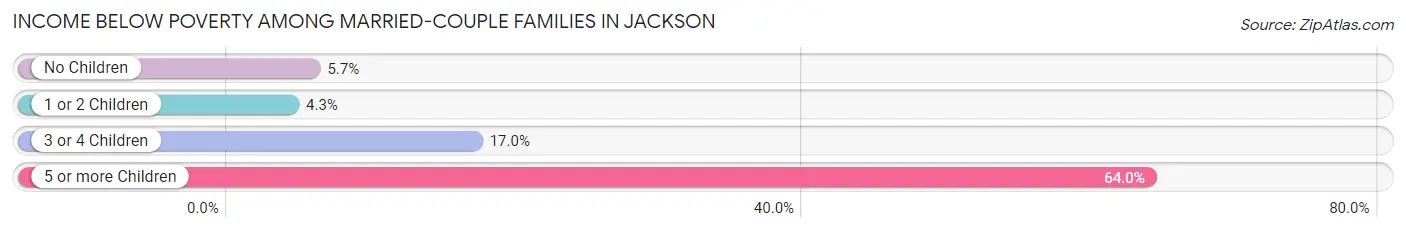
| Children | Above Poverty | Below Poverty |
| No Children | 9,467 (94.3%) | 577 (5.7%) |
| 1 or 2 Children | 4,575 (95.8%) | 203 (4.3%) |
| 3 or 4 Children | 1,246 (83.0%) | 256 (17.0%) |
| 5 or more Children | 40 (36.0%) | 71 (64.0%) |
| Total | 15,328 (93.3%) | 1,107 (6.7%) |
Income Below Poverty Among Single-Parent Households in Jackson
According to the poverty data in Jackson, 28.5% or 872 single-father households and 33.1% or 5,072 single-mother households are living below the poverty line. Among single-father households, those with 3 or 4 children have the highest poverty rate, with 70 households (57.9%) experiencing poverty. Likewise, among single-mother households, those with 5 or more children have the highest poverty rate, with 302 households (97.4%) falling below the poverty line.
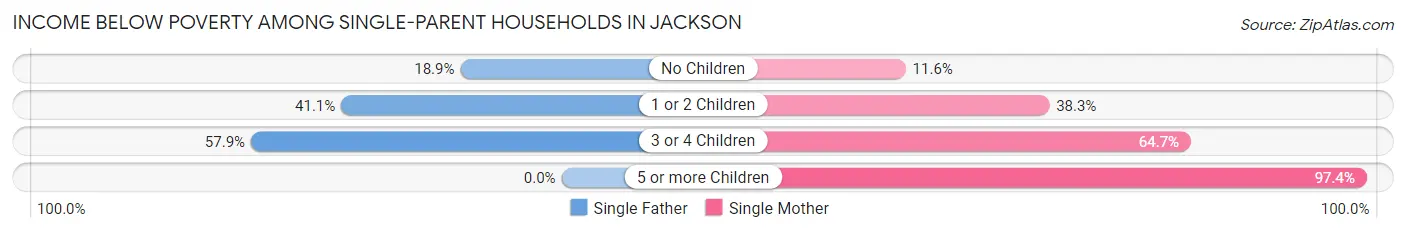
| Children | Single Father | Single Mother |
| No Children | 339 (18.9%) | 631 (11.6%) |
| 1 or 2 Children | 463 (41.0%) | 2,953 (38.3%) |
| 3 or 4 Children | 70 (57.9%) | 1,186 (64.7%) |
| 5 or more Children | 0 (0.0%) | 302 (97.4%) |
| Total | 872 (28.5%) | 5,072 (33.1%) |
Income Below Poverty Among Married-Couple vs Single-Parent Households in Jackson
The poverty data for Jackson shows that 1,107 of the married-couple family households (6.7%) and 5,944 of the single-parent households (32.3%) are living below the poverty level. Within the married-couple family households, those with 5 or more children have the highest poverty rate, with 71 households (64.0%) falling below the poverty line. Among the single-parent households, those with 5 or more children have the highest poverty rate, with 302 household (94.1%) living below poverty.
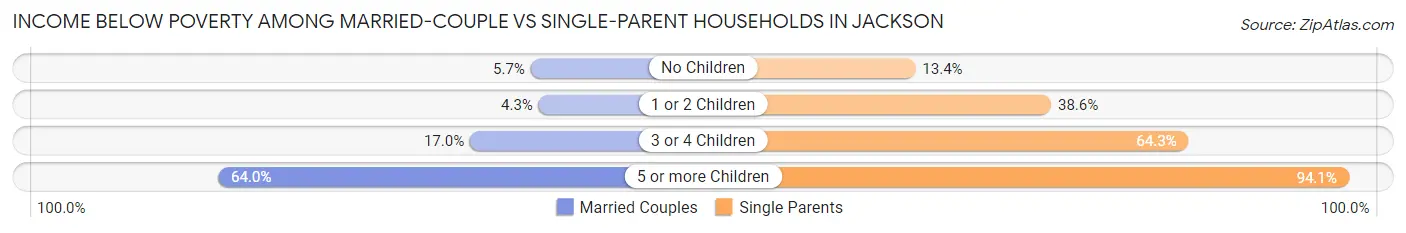
| Children | Married-Couple Families | Single-Parent Households |
| No Children | 577 (5.7%) | 970 (13.4%) |
| 1 or 2 Children | 203 (4.3%) | 3,416 (38.6%) |
| 3 or 4 Children | 256 (17.0%) | 1,256 (64.2%) |
| 5 or more Children | 71 (64.0%) | 302 (94.1%) |
| Total | 1,107 (6.7%) | 5,944 (32.3%) |
Employment Characteristics in Jackson
Employment by Class of Employer in Jackson
Among the 64,354 employed individuals in Jackson, private company employees (40,222 | 62.5%), state government employees (7,629 | 11.8%), and not-for-profit organizations (5,357 | 8.3%) make up the most common classes of employment.
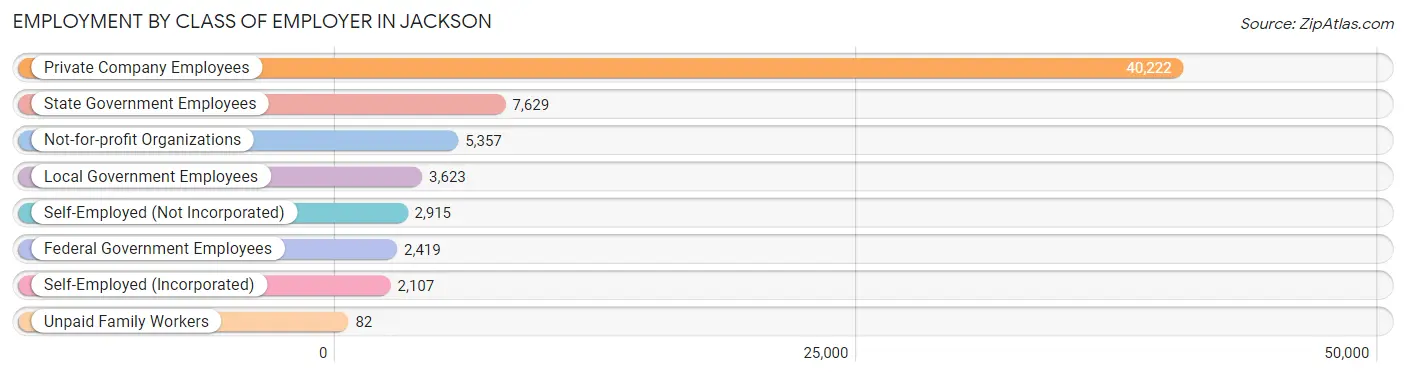
| Employer Class | # Employees | % Employees |
| Private Company Employees | 40,222 | 62.5% |
| Self-Employed (Incorporated) | 2,107 | 3.3% |
| Self-Employed (Not Incorporated) | 2,915 | 4.5% |
| Not-for-profit Organizations | 5,357 | 8.3% |
| Local Government Employees | 3,623 | 5.6% |
| State Government Employees | 7,629 | 11.8% |
| Federal Government Employees | 2,419 | 3.8% |
| Unpaid Family Workers | 82 | 0.1% |
| Total | 64,354 | 100.0% |
Employment Status by Age in Jackson
According to the labor force statistics for Jackson, out of the total population over 16 years of age (120,189), 60.6% or 72,835 individuals are in the labor force, with 9.3% or 6,774 of them unemployed. The age group with the highest labor force participation rate is 30 to 34 years, with 83.5% or 9,080 individuals in the labor force. Within the labor force, the 16 to 19 years age range has the highest percentage of unemployed individuals, with 25.7% or 658 of them being unemployed.
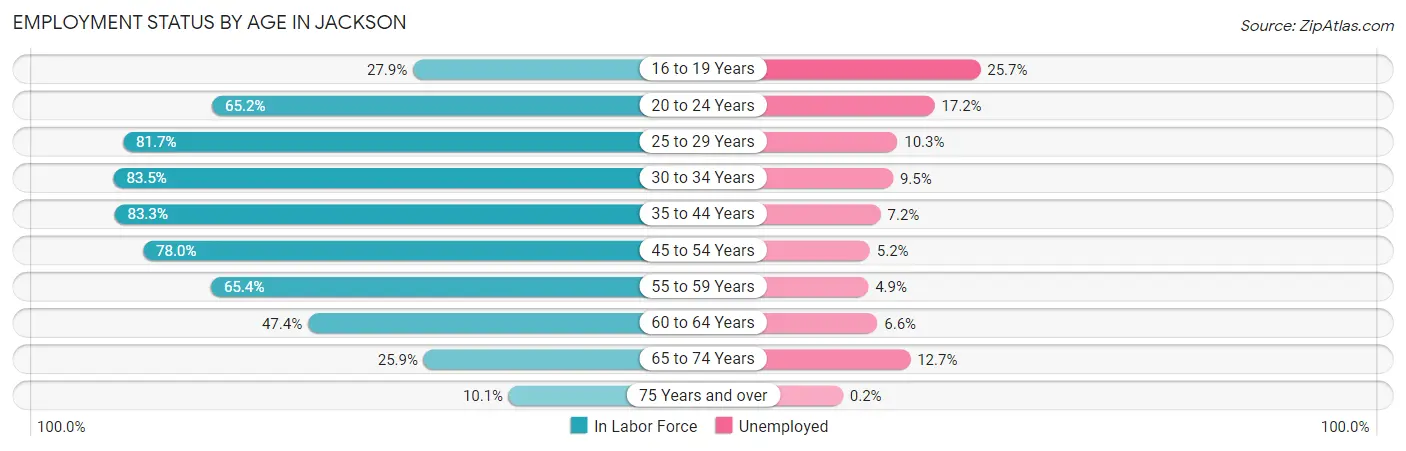
| Age Bracket | In Labor Force | Unemployed |
| 16 to 19 Years | 2,560 (27.9%) | 658 (25.7%) |
| 20 to 24 Years | 8,576 (65.2%) | 1,475 (17.2%) |
| 25 to 29 Years | 9,914 (81.7%) | 1,021 (10.3%) |
| 30 to 34 Years | 9,080 (83.5%) | 863 (9.5%) |
| 35 to 44 Years | 15,381 (83.3%) | 1,107 (7.2%) |
| 45 to 54 Years | 12,922 (78.0%) | 672 (5.2%) |
| 55 to 59 Years | 5,625 (65.4%) | 276 (4.9%) |
| 60 to 64 Years | 4,442 (47.4%) | 293 (6.6%) |
| 65 to 74 Years | 3,517 (25.9%) | 447 (12.7%) |
| 75 Years and over | 835 (10.1%) | 2 (0.2%) |
| Total | 72,835 (60.6%) | 6,774 (9.3%) |
Employment Status by Educational Attainment in Jackson
According to labor force statistics for Jackson, 75.5% of individuals (57,390) out of the total population between 25 and 64 years of age (76,013) are in the labor force, with 7.4% or 4,247 of them being unemployed. The group with the highest labor force participation rate are those with the educational attainment of bachelor's degree or higher, with 84.5% or 17,908 individuals in the labor force. Within the labor force, individuals with less than high school education have the highest percentage of unemployment, with 19.2% or 863 of them being unemployed.
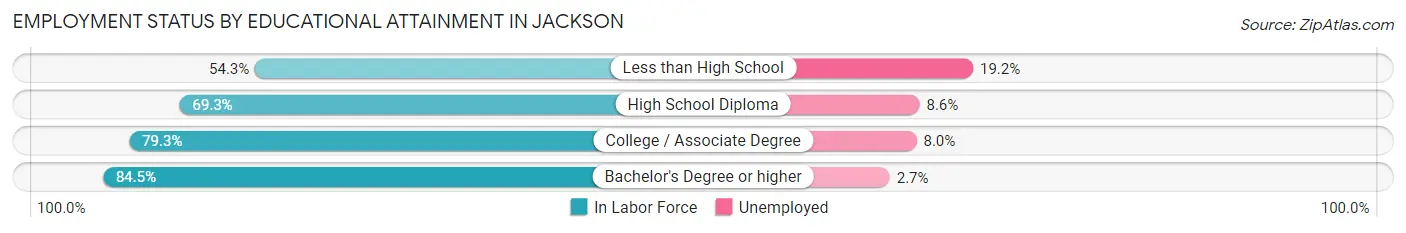
| Educational Attainment | In Labor Force | Unemployed |
| Less than High School | 4,493 (54.3%) | 1,589 (19.2%) |
| High School Diploma | 13,286 (69.3%) | 1,649 (8.6%) |
| College / Associate Degree | 21,708 (79.3%) | 2,190 (8.0%) |
| Bachelor's Degree or higher | 17,908 (84.5%) | 572 (2.7%) |
| Total | 57,390 (75.5%) | 5,625 (7.4%) |
Employment Occupations by Sex in Jackson
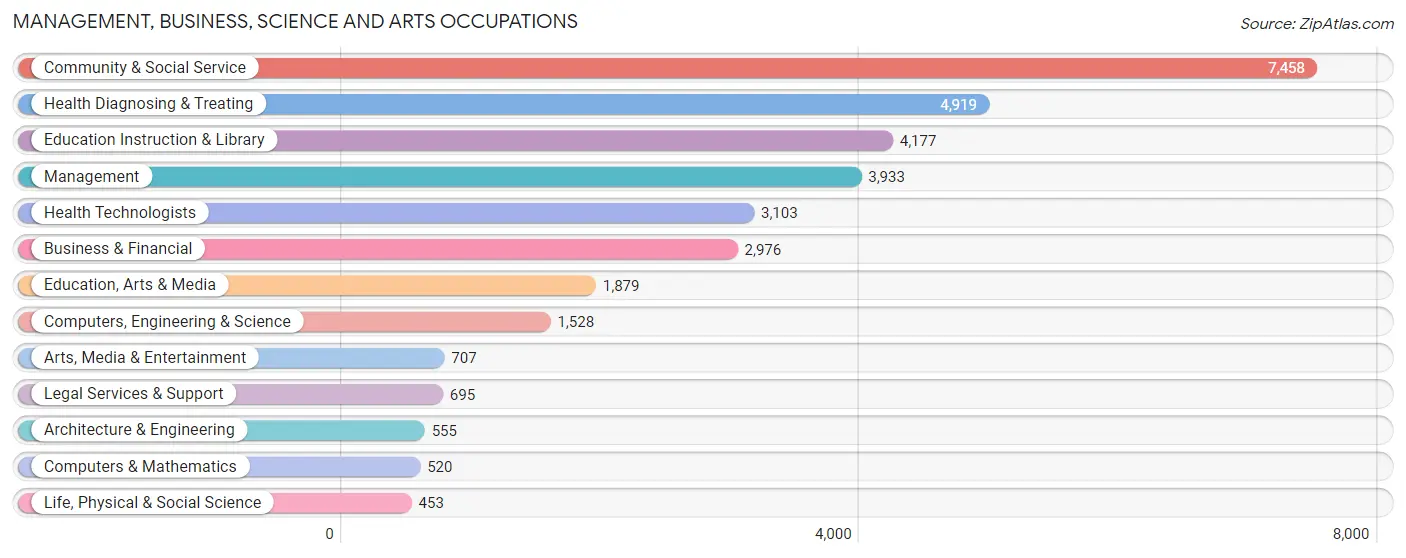
Management, Business, Science and Arts Occupations
The most common Management, Business, Science and Arts occupations in Jackson are Community & Social Service (7,458 | 11.3%), Health Diagnosing & Treating (4,919 | 7.5%), Education Instruction & Library (4,177 | 6.3%), Management (3,933 | 6.0%), and Health Technologists (3,103 | 4.7%).
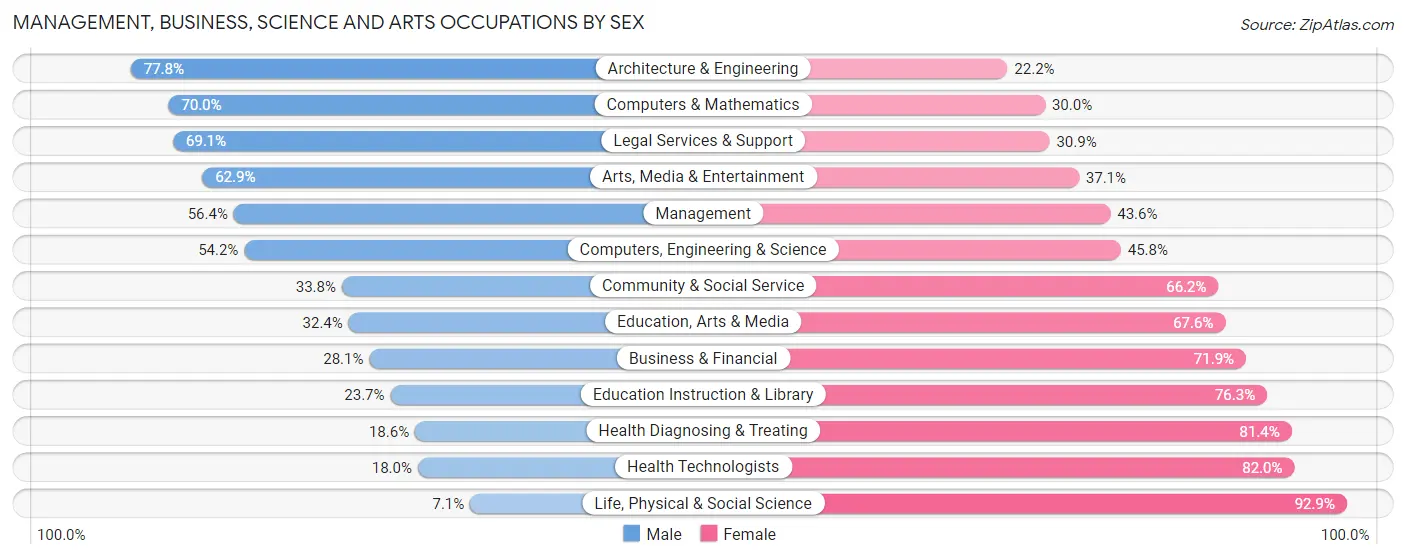
Management, Business, Science and Arts Occupations by Sex
Within the Management, Business, Science and Arts occupations in Jackson, the most male-oriented occupations are Architecture & Engineering (77.8%), Computers & Mathematics (70.0%), and Legal Services & Support (69.1%), while the most female-oriented occupations are Life, Physical & Social Science (92.9%), Health Technologists (82.0%), and Health Diagnosing & Treating (81.4%).
| Occupation | Male | Female |
| Management | 2,217 (56.4%) | 1,716 (43.6%) |
| Business & Financial | 836 (28.1%) | 2,140 (71.9%) |
| Computers, Engineering & Science | 828 (54.2%) | 700 (45.8%) |
| Computers & Mathematics | 364 (70.0%) | 156 (30.0%) |
| Architecture & Engineering | 432 (77.8%) | 123 (22.2%) |
| Life, Physical & Social Science | 32 (7.1%) | 421 (92.9%) |
| Community & Social Service | 2,524 (33.8%) | 4,934 (66.2%) |
| Education, Arts & Media | 609 (32.4%) | 1,270 (67.6%) |
| Legal Services & Support | 480 (69.1%) | 215 (30.9%) |
| Education Instruction & Library | 990 (23.7%) | 3,187 (76.3%) |
| Arts, Media & Entertainment | 445 (62.9%) | 262 (37.1%) |
| Health Diagnosing & Treating | 913 (18.6%) | 4,006 (81.4%) |
| Health Technologists | 558 (18.0%) | 2,545 (82.0%) |
| Total (Category) | 7,318 (35.2%) | 13,496 (64.8%) |
| Total (Overall) | 30,619 (46.5%) | 35,292 (53.5%) |
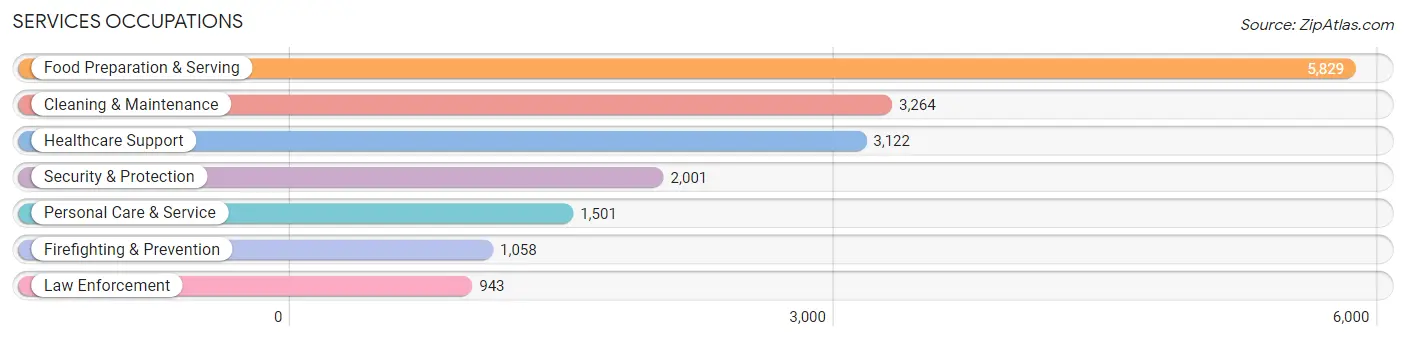
Services Occupations
The most common Services occupations in Jackson are Food Preparation & Serving (5,829 | 8.8%), Cleaning & Maintenance (3,264 | 5.0%), Healthcare Support (3,122 | 4.7%), Security & Protection (2,001 | 3.0%), and Personal Care & Service (1,501 | 2.3%).
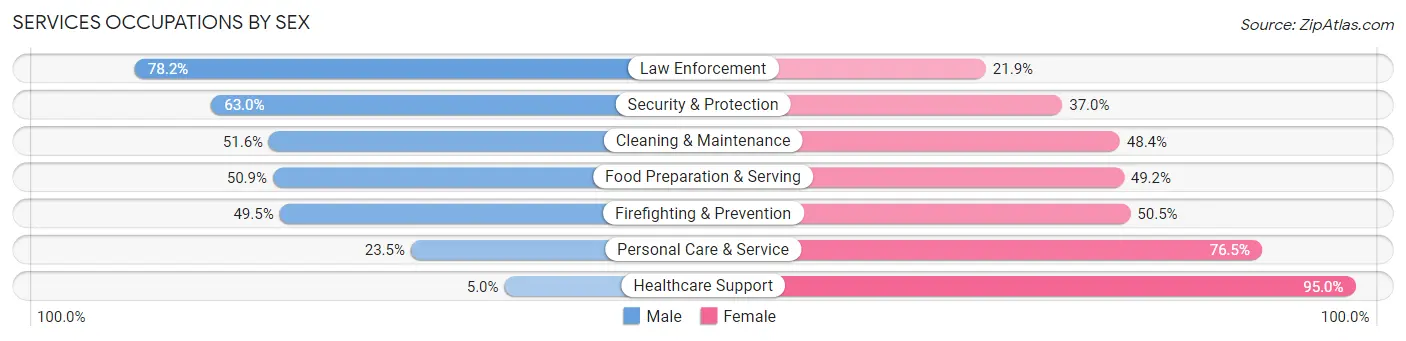
Services Occupations by Sex
Within the Services occupations in Jackson, the most male-oriented occupations are Law Enforcement (78.1%), Security & Protection (63.0%), and Cleaning & Maintenance (51.6%), while the most female-oriented occupations are Healthcare Support (95.0%), Personal Care & Service (76.5%), and Firefighting & Prevention (50.5%).
| Occupation | Male | Female |
| Healthcare Support | 156 (5.0%) | 2,966 (95.0%) |
| Security & Protection | 1,261 (63.0%) | 740 (37.0%) |
| Firefighting & Prevention | 524 (49.5%) | 534 (50.5%) |
| Law Enforcement | 737 (78.1%) | 206 (21.8%) |
| Food Preparation & Serving | 2,964 (50.8%) | 2,865 (49.1%) |
| Cleaning & Maintenance | 1,685 (51.6%) | 1,579 (48.4%) |
| Personal Care & Service | 353 (23.5%) | 1,148 (76.5%) |
| Total (Category) | 6,419 (40.8%) | 9,298 (59.2%) |
| Total (Overall) | 30,619 (46.5%) | 35,292 (53.5%) |
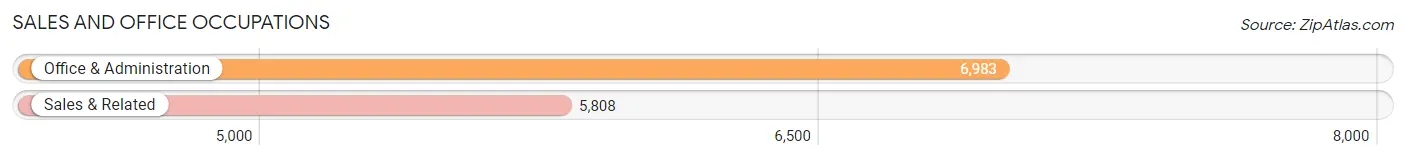
Sales and Office Occupations
The most common Sales and Office occupations in Jackson are Office & Administration (6,983 | 10.6%), and Sales & Related (5,808 | 8.8%).
Sales and Office Occupations by Sex
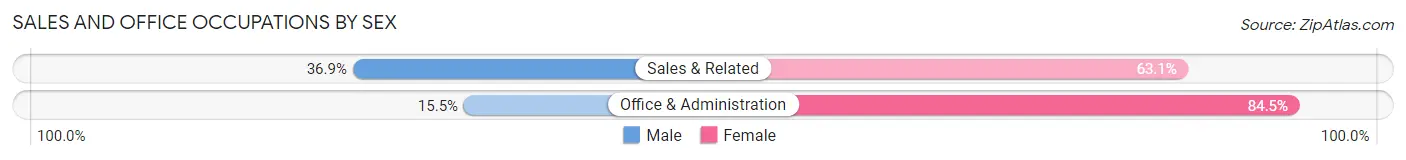
| Occupation | Male | Female |
| Sales & Related | 2,143 (36.9%) | 3,665 (63.1%) |
| Office & Administration | 1,084 (15.5%) | 5,899 (84.5%) |
| Total (Category) | 3,227 (25.2%) | 9,564 (74.8%) |
| Total (Overall) | 30,619 (46.5%) | 35,292 (53.5%) |
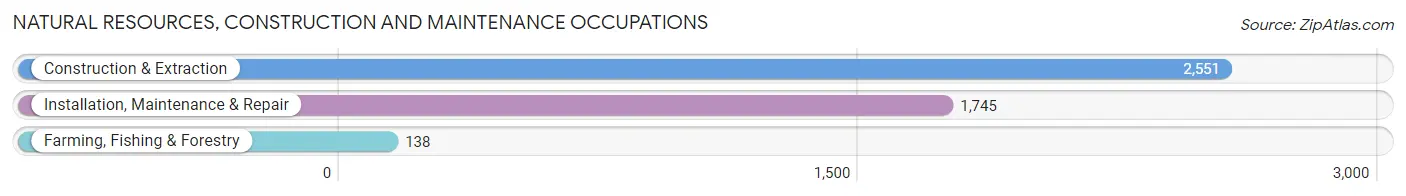
Natural Resources, Construction and Maintenance Occupations
The most common Natural Resources, Construction and Maintenance occupations in Jackson are Construction & Extraction (2,551 | 3.9%), Installation, Maintenance & Repair (1,745 | 2.6%), and Farming, Fishing & Forestry (138 | 0.2%).
Natural Resources, Construction and Maintenance Occupations by Sex
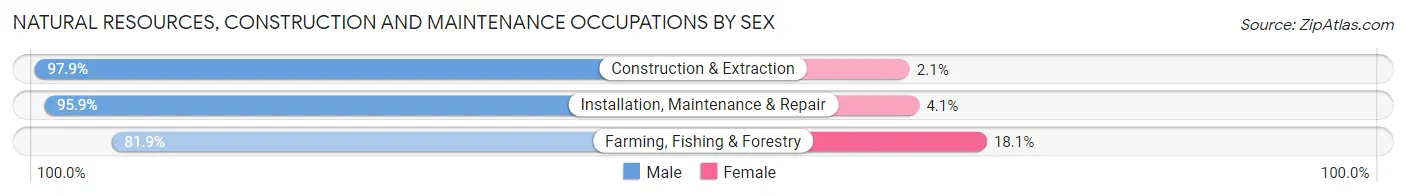
| Occupation | Male | Female |
| Farming, Fishing & Forestry | 113 (81.9%) | 25 (18.1%) |
| Construction & Extraction | 2,498 (97.9%) | 53 (2.1%) |
| Installation, Maintenance & Repair | 1,674 (95.9%) | 71 (4.1%) |
| Total (Category) | 4,285 (96.6%) | 149 (3.4%) |
| Total (Overall) | 30,619 (46.5%) | 35,292 (53.5%) |
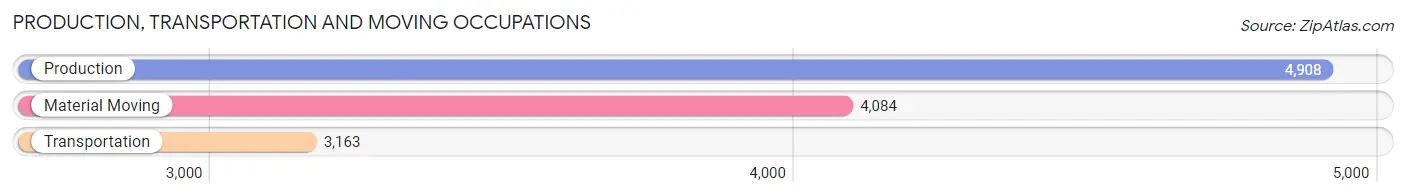
Production, Transportation and Moving Occupations
The most common Production, Transportation and Moving occupations in Jackson are Production (4,908 | 7.4%), Material Moving (4,084 | 6.2%), and Transportation (3,163 | 4.8%).
Production, Transportation and Moving Occupations by Sex
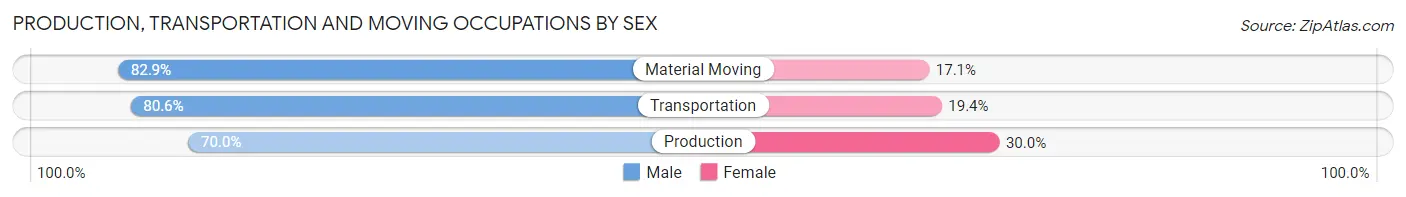
| Occupation | Male | Female |
| Production | 3,436 (70.0%) | 1,472 (30.0%) |
| Transportation | 2,549 (80.6%) | 614 (19.4%) |
| Material Moving | 3,385 (82.9%) | 699 (17.1%) |
| Total (Category) | 9,370 (77.1%) | 2,785 (22.9%) |
| Total (Overall) | 30,619 (46.5%) | 35,292 (53.5%) |
Employment Industries by Sex in Jackson
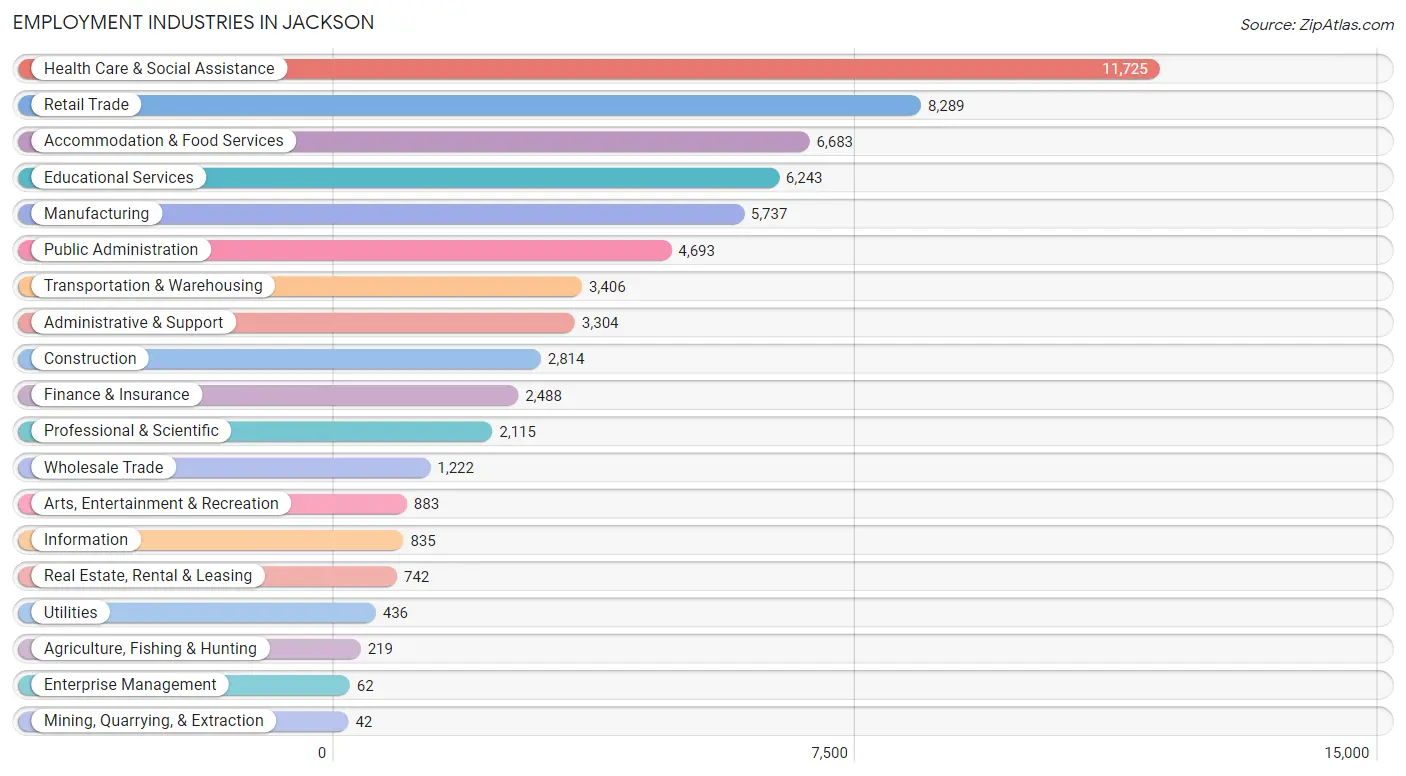
Employment Industries in Jackson
The major employment industries in Jackson include Health Care & Social Assistance (11,725 | 17.8%), Retail Trade (8,289 | 12.6%), Accommodation & Food Services (6,683 | 10.1%), Educational Services (6,243 | 9.5%), and Manufacturing (5,737 | 8.7%).
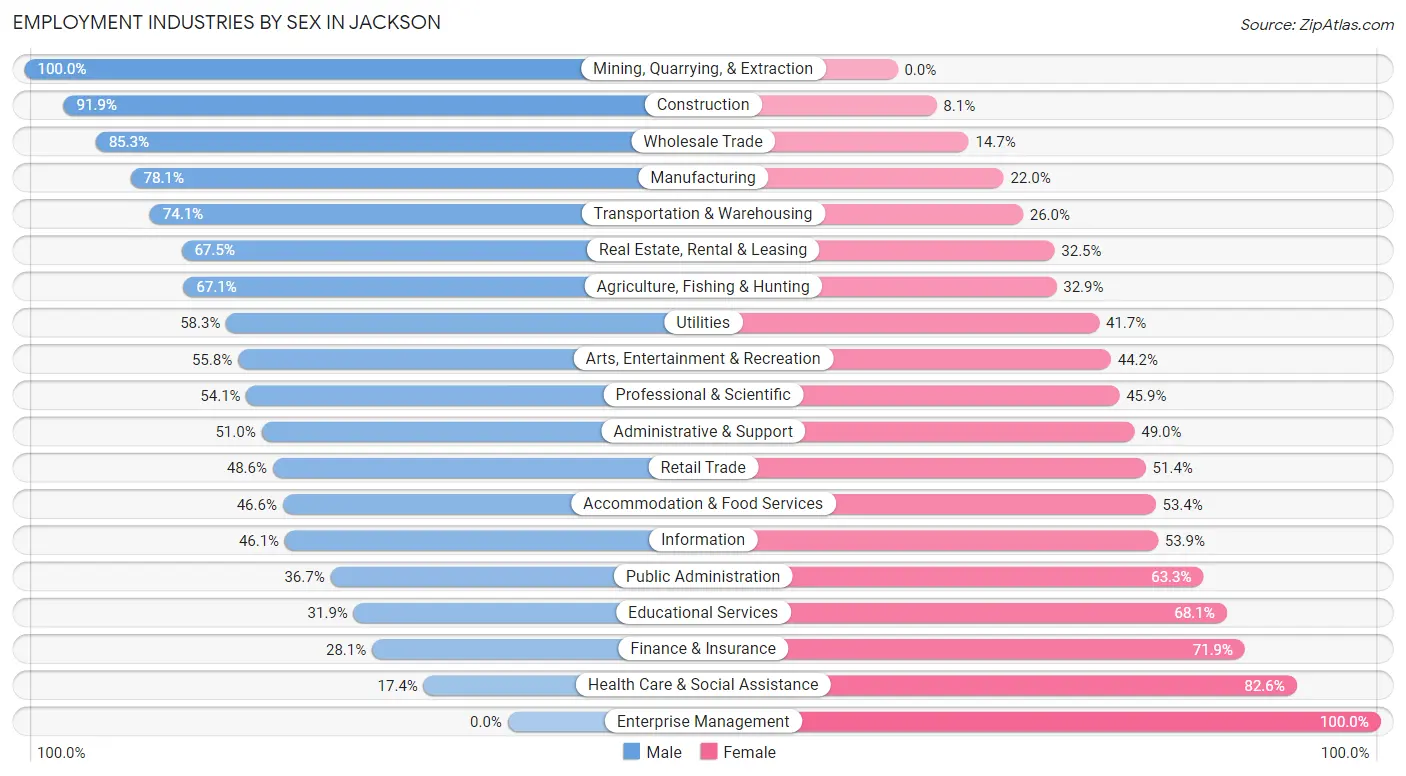
Employment Industries by Sex in Jackson
The Jackson industries that see more men than women are Mining, Quarrying, & Extraction (100.0%), Construction (91.9%), and Wholesale Trade (85.3%), whereas the industries that tend to have a higher number of women are Enterprise Management (100.0%), Health Care & Social Assistance (82.6%), and Finance & Insurance (71.9%).
| Industry | Male | Female |
| Agriculture, Fishing & Hunting | 147 (67.1%) | 72 (32.9%) |
| Mining, Quarrying, & Extraction | 42 (100.0%) | 0 (0.0%) |
| Construction | 2,587 (91.9%) | 227 (8.1%) |
| Manufacturing | 4,478 (78.0%) | 1,259 (22.0%) |
| Wholesale Trade | 1,042 (85.3%) | 180 (14.7%) |
| Retail Trade | 4,030 (48.6%) | 4,259 (51.4%) |
| Transportation & Warehousing | 2,522 (74.1%) | 884 (26.0%) |
| Utilities | 254 (58.3%) | 182 (41.7%) |
| Information | 385 (46.1%) | 450 (53.9%) |
| Finance & Insurance | 699 (28.1%) | 1,789 (71.9%) |
| Real Estate, Rental & Leasing | 501 (67.5%) | 241 (32.5%) |
| Professional & Scientific | 1,144 (54.1%) | 971 (45.9%) |
| Enterprise Management | 0 (0.0%) | 62 (100.0%) |
| Administrative & Support | 1,684 (51.0%) | 1,620 (49.0%) |
| Educational Services | 1,991 (31.9%) | 4,252 (68.1%) |
| Health Care & Social Assistance | 2,040 (17.4%) | 9,685 (82.6%) |
| Arts, Entertainment & Recreation | 493 (55.8%) | 390 (44.2%) |
| Accommodation & Food Services | 3,112 (46.6%) | 3,571 (53.4%) |
| Public Administration | 1,722 (36.7%) | 2,971 (63.3%) |
| Total | 30,619 (46.5%) | 35,292 (53.5%) |
Education in Jackson
School Enrollment in Jackson
The most common levels of schooling among the 42,687 students in Jackson are college / undergraduate (10,955 | 25.7%), middle school (8,542 | 20.0%), and elementary school (7,670 | 18.0%).
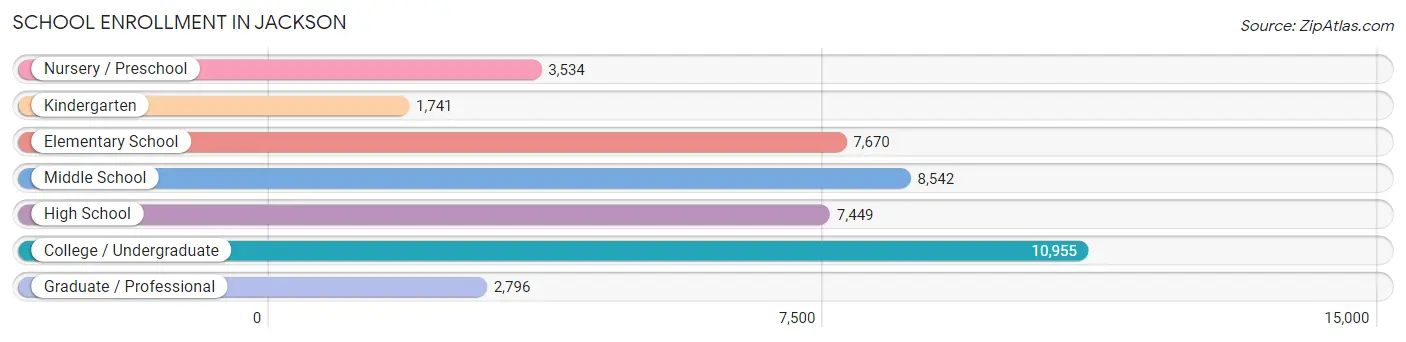
| School Level | # Students | % Students |
| Nursery / Preschool | 3,534 | 8.3% |
| Kindergarten | 1,741 | 4.1% |
| Elementary School | 7,670 | 18.0% |
| Middle School | 8,542 | 20.0% |
| High School | 7,449 | 17.4% |
| College / Undergraduate | 10,955 | 25.7% |
| Graduate / Professional | 2,796 | 6.6% |
| Total | 42,687 | 100.0% |
School Enrollment by Age by Funding Source in Jackson
Out of a total of 42,687 students who are enrolled in schools in Jackson, 7,428 (17.4%) attend a private institution, while the remaining 35,259 (82.6%) are enrolled in public schools. The age group of 3 to 4 year olds has the highest likelihood of being enrolled in private schools, with 1,374 (47.7% in the age bracket) enrolled. Conversely, the age group of 10 to 14 year olds has the lowest likelihood of being enrolled in a private school, with 9,225 (89.0% in the age bracket) attending a public institution.
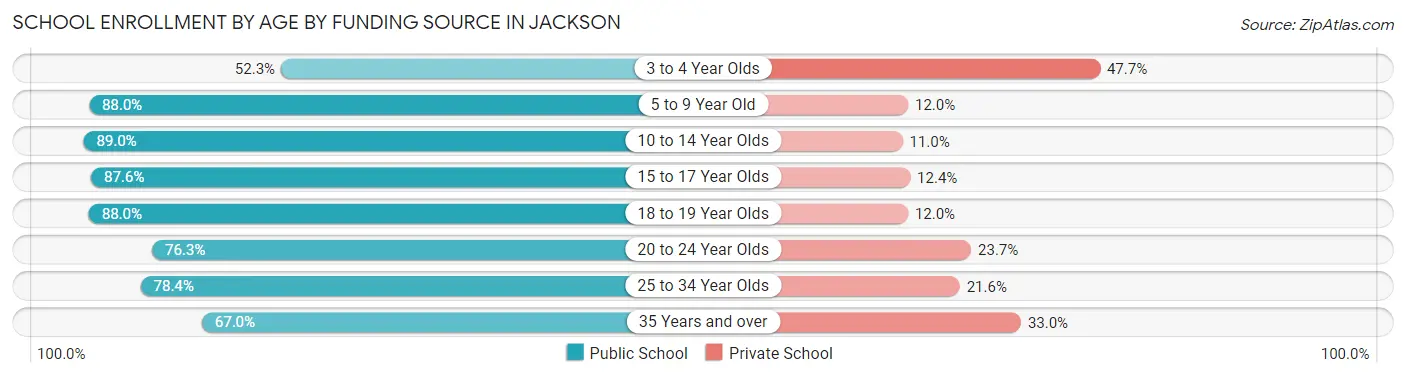
| Age Bracket | Public School | Private School |
| 3 to 4 Year Olds | 1,504 (52.3%) | 1,374 (47.7%) |
| 5 to 9 Year Old | 7,744 (88.0%) | 1,055 (12.0%) |
| 10 to 14 Year Olds | 9,225 (89.0%) | 1,137 (11.0%) |
| 15 to 17 Year Olds | 5,112 (87.6%) | 722 (12.4%) |
| 18 to 19 Year Olds | 3,727 (88.0%) | 507 (12.0%) |
| 20 to 24 Year Olds | 4,622 (76.3%) | 1,439 (23.7%) |
| 25 to 34 Year Olds | 2,056 (78.4%) | 567 (21.6%) |
| 35 Years and over | 1,270 (67.0%) | 626 (33.0%) |
| Total | 35,259 (82.6%) | 7,428 (17.4%) |
Educational Attainment by Field of Study in Jackson
Business (5,584 | 18.8%), education (4,202 | 14.1%), science & technology (3,912 | 13.2%), bio, nature & agricultural (2,560 | 8.6%), and arts & humanities (2,366 | 8.0%) are the most common fields of study among 29,758 individuals in Jackson who have obtained a bachelor's degree or higher.
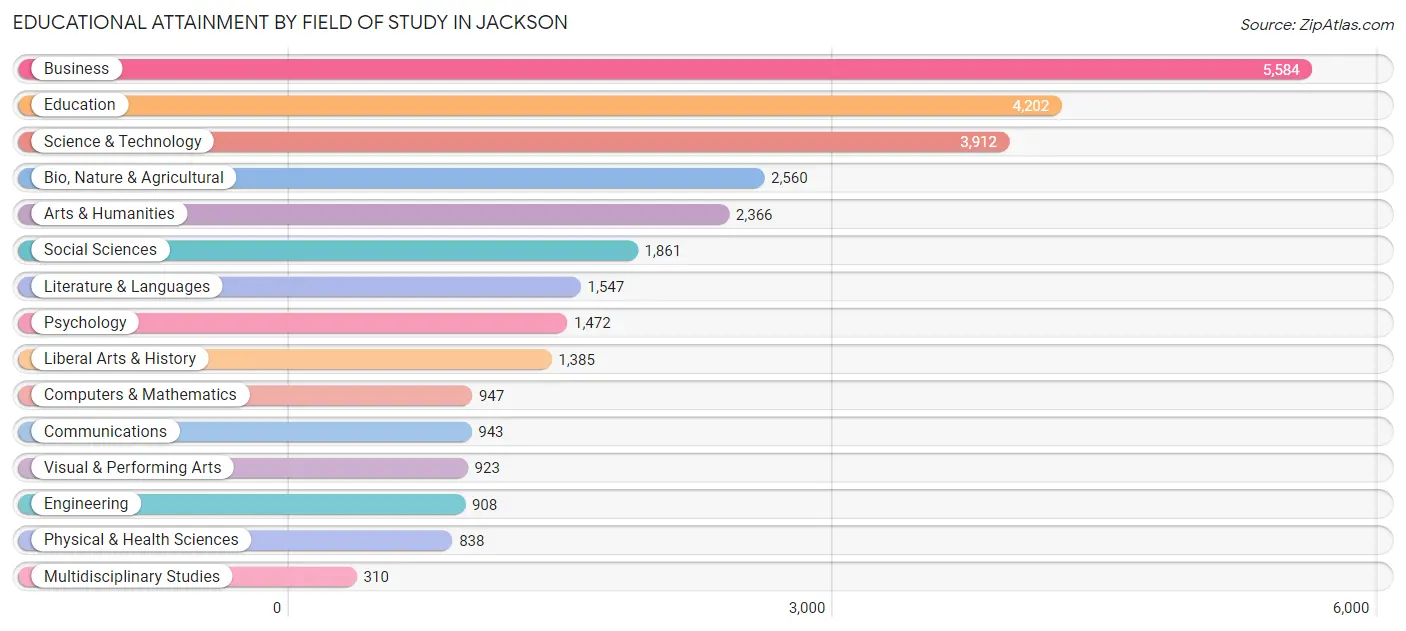
| Field of Study | # Graduates | % Graduates |
| Computers & Mathematics | 947 | 3.2% |
| Bio, Nature & Agricultural | 2,560 | 8.6% |
| Physical & Health Sciences | 838 | 2.8% |
| Psychology | 1,472 | 5.0% |
| Social Sciences | 1,861 | 6.2% |
| Engineering | 908 | 3.0% |
| Multidisciplinary Studies | 310 | 1.0% |
| Science & Technology | 3,912 | 13.2% |
| Business | 5,584 | 18.8% |
| Education | 4,202 | 14.1% |
| Literature & Languages | 1,547 | 5.2% |
| Liberal Arts & History | 1,385 | 4.6% |
| Visual & Performing Arts | 923 | 3.1% |
| Communications | 943 | 3.2% |
| Arts & Humanities | 2,366 | 8.0% |
| Total | 29,758 | 100.0% |
Transportation & Commute in Jackson
Vehicle Availability by Sex in Jackson
The most prevalent vehicle ownership categories in Jackson are males with 2 vehicles (12,066, accounting for 40.2%) and females with 2 vehicles (11,309, making up 35.6%).
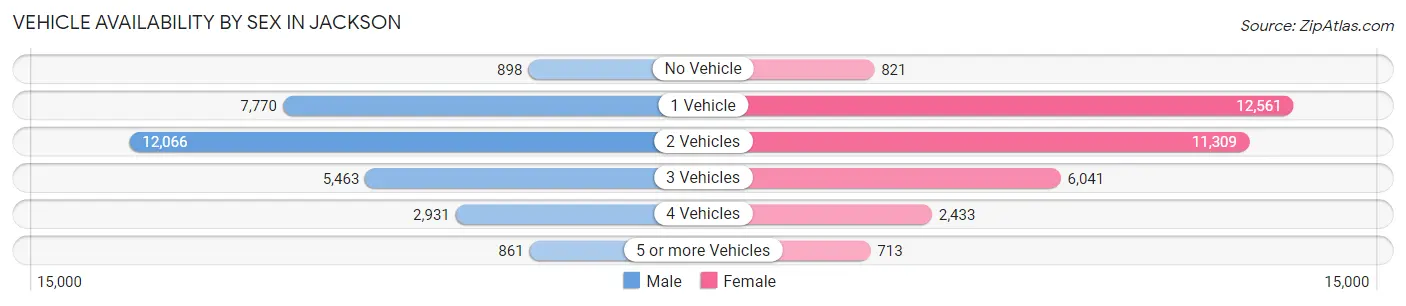
| Vehicles Available | Male | Female |
| No Vehicle | 898 (3.0%) | 821 (2.4%) |
| 1 Vehicle | 7,770 (25.9%) | 12,561 (37.1%) |
| 2 Vehicles | 12,066 (40.2%) | 11,309 (33.4%) |
| 3 Vehicles | 5,463 (18.2%) | 6,041 (17.8%) |
| 4 Vehicles | 2,931 (9.8%) | 2,433 (7.2%) |
| 5 or more Vehicles | 861 (2.9%) | 713 (2.1%) |
| Total | 29,989 (100.0%) | 33,878 (100.0%) |
Commute Time in Jackson
The most frequently occuring commute durations in Jackson are 15 to 19 minutes (14,548 commuters, 24.1%), 20 to 24 minutes (13,993 commuters, 23.2%), and 10 to 14 minutes (9,517 commuters, 15.8%).
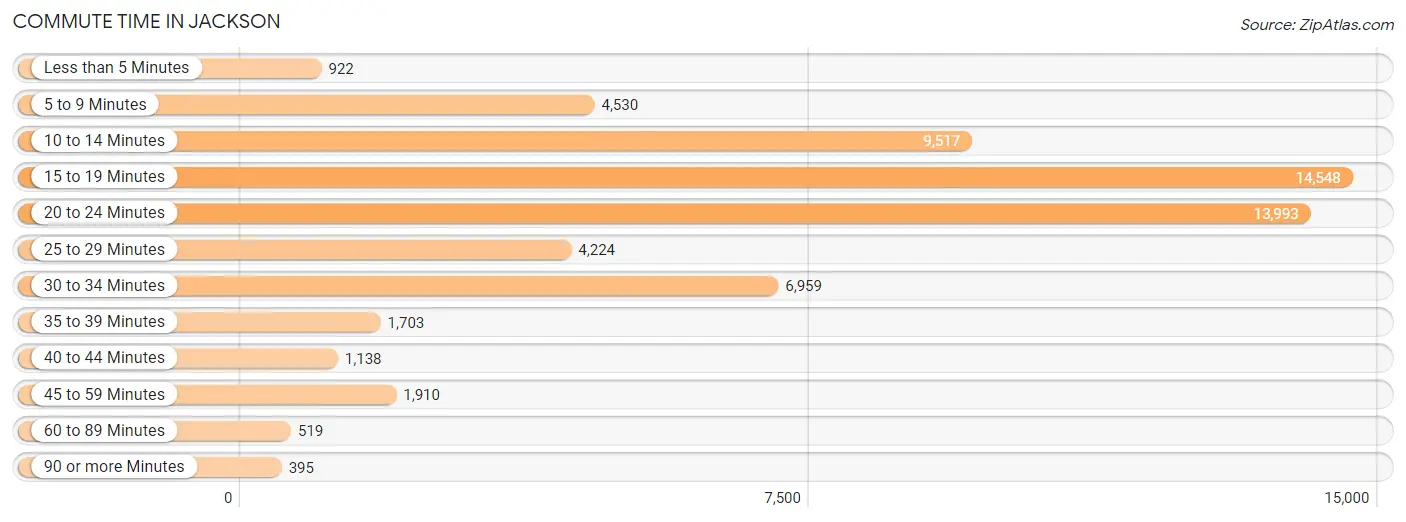
| Commute Time | # Commuters | % Commuters |
| Less than 5 Minutes | 922 | 1.5% |
| 5 to 9 Minutes | 4,530 | 7.5% |
| 10 to 14 Minutes | 9,517 | 15.8% |
| 15 to 19 Minutes | 14,548 | 24.1% |
| 20 to 24 Minutes | 13,993 | 23.2% |
| 25 to 29 Minutes | 4,224 | 7.0% |
| 30 to 34 Minutes | 6,959 | 11.5% |
| 35 to 39 Minutes | 1,703 | 2.8% |
| 40 to 44 Minutes | 1,138 | 1.9% |
| 45 to 59 Minutes | 1,910 | 3.2% |
| 60 to 89 Minutes | 519 | 0.9% |
| 90 or more Minutes | 395 | 0.6% |
Commute Time by Sex in Jackson
The most common commute times in Jackson are 15 to 19 minutes (7,264 commuters, 25.3%) for males and 15 to 19 minutes (7,284 commuters, 23.0%) for females.
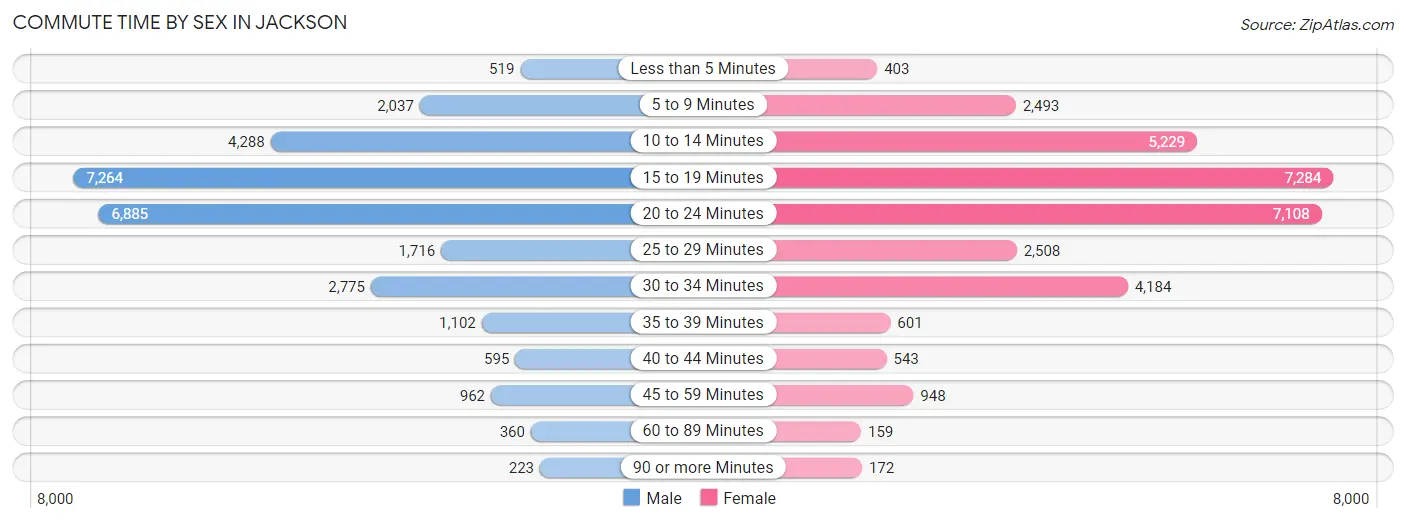
| Commute Time | Male | Female |
| Less than 5 Minutes | 519 (1.8%) | 403 (1.3%) |
| 5 to 9 Minutes | 2,037 (7.1%) | 2,493 (7.9%) |
| 10 to 14 Minutes | 4,288 (14.9%) | 5,229 (16.5%) |
| 15 to 19 Minutes | 7,264 (25.3%) | 7,284 (23.0%) |
| 20 to 24 Minutes | 6,885 (24.0%) | 7,108 (22.5%) |
| 25 to 29 Minutes | 1,716 (6.0%) | 2,508 (7.9%) |
| 30 to 34 Minutes | 2,775 (9.7%) | 4,184 (13.2%) |
| 35 to 39 Minutes | 1,102 (3.8%) | 601 (1.9%) |
| 40 to 44 Minutes | 595 (2.1%) | 543 (1.7%) |
| 45 to 59 Minutes | 962 (3.4%) | 948 (3.0%) |
| 60 to 89 Minutes | 360 (1.3%) | 159 (0.5%) |
| 90 or more Minutes | 223 (0.8%) | 172 (0.5%) |
Time of Departure to Work by Sex in Jackson
The most frequent times of departure to work in Jackson are 4:00 PM to 11:59 PM (4,462, 15.5%) for males and 7:00 AM to 7:29 AM (5,760, 18.2%) for females.
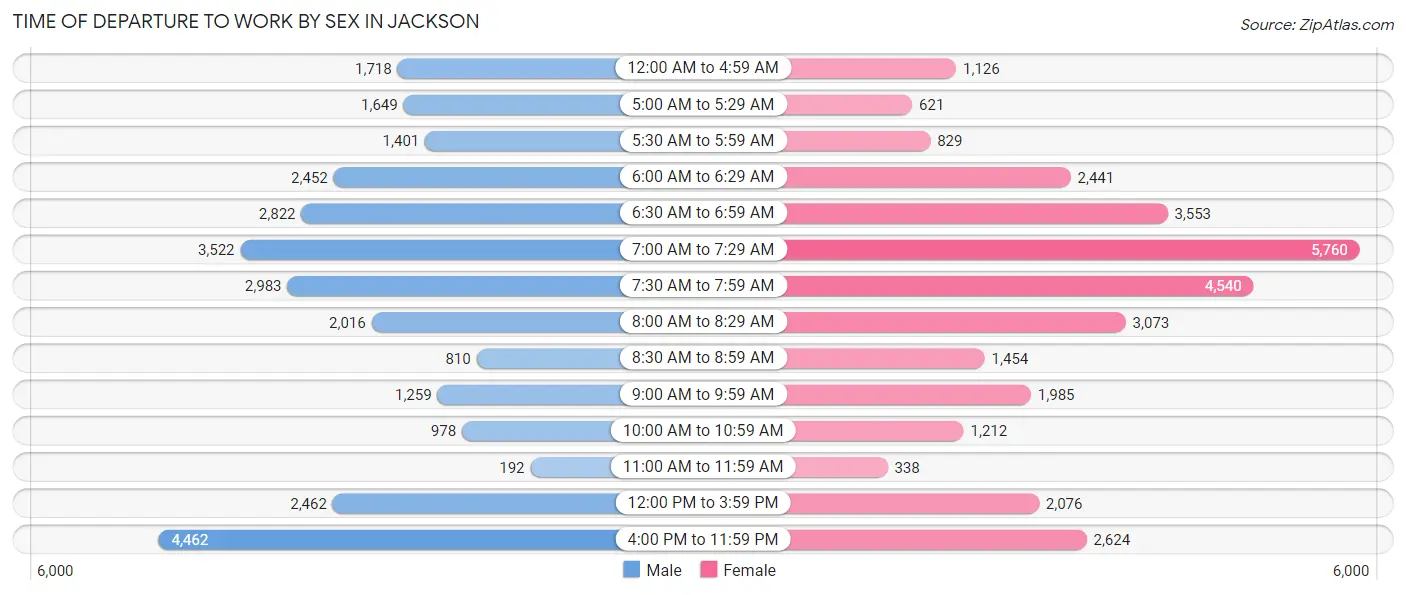
| Time of Departure | Male | Female |
| 12:00 AM to 4:59 AM | 1,718 (6.0%) | 1,126 (3.6%) |
| 5:00 AM to 5:29 AM | 1,649 (5.7%) | 621 (2.0%) |
| 5:30 AM to 5:59 AM | 1,401 (4.9%) | 829 (2.6%) |
| 6:00 AM to 6:29 AM | 2,452 (8.5%) | 2,441 (7.7%) |
| 6:30 AM to 6:59 AM | 2,822 (9.8%) | 3,553 (11.2%) |
| 7:00 AM to 7:29 AM | 3,522 (12.3%) | 5,760 (18.2%) |
| 7:30 AM to 7:59 AM | 2,983 (10.4%) | 4,540 (14.3%) |
| 8:00 AM to 8:29 AM | 2,016 (7.0%) | 3,073 (9.7%) |
| 8:30 AM to 8:59 AM | 810 (2.8%) | 1,454 (4.6%) |
| 9:00 AM to 9:59 AM | 1,259 (4.4%) | 1,985 (6.3%) |
| 10:00 AM to 10:59 AM | 978 (3.4%) | 1,212 (3.8%) |
| 11:00 AM to 11:59 AM | 192 (0.7%) | 338 (1.1%) |
| 12:00 PM to 3:59 PM | 2,462 (8.6%) | 2,076 (6.6%) |
| 4:00 PM to 11:59 PM | 4,462 (15.5%) | 2,624 (8.3%) |
| Total | 28,726 (100.0%) | 31,632 (100.0%) |
Housing Occupancy in Jackson
Occupancy by Ownership in Jackson
Of the total 62,053 dwellings in Jackson, owner-occupied units account for 30,370 (48.9%), while renter-occupied units make up 31,683 (51.1%).

| Occupancy | # Housing Units | % Housing Units |
| Owner Occupied Housing Units | 30,370 | 48.9% |
| Renter-Occupied Housing Units | 31,683 | 51.1% |
| Total Occupied Housing Units | 62,053 | 100.0% |
Occupancy by Household Size in Jackson
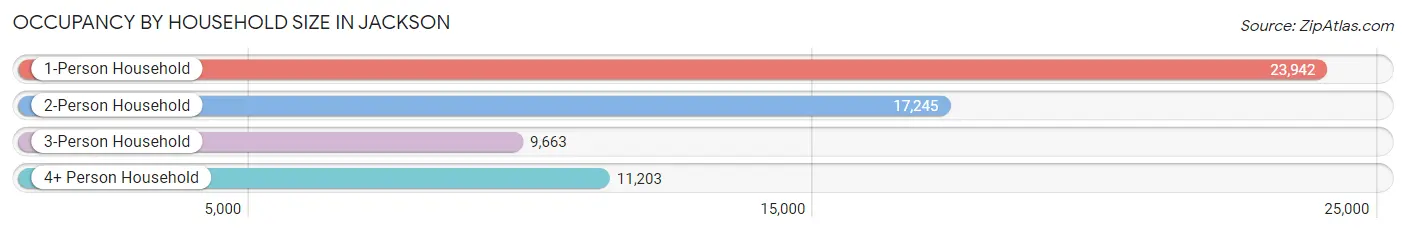
| Household Size | # Housing Units | % Housing Units |
| 1-Person Household | 23,942 | 38.6% |
| 2-Person Household | 17,245 | 27.8% |
| 3-Person Household | 9,663 | 15.6% |
| 4+ Person Household | 11,203 | 18.0% |
| Total Housing Units | 62,053 | 100.0% |
Occupancy by Ownership by Household Size in Jackson
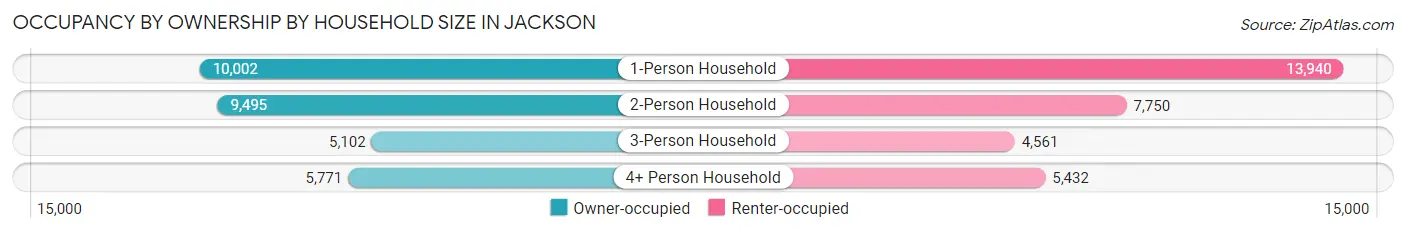
| Household Size | Owner-occupied | Renter-occupied |
| 1-Person Household | 10,002 (41.8%) | 13,940 (58.2%) |
| 2-Person Household | 9,495 (55.1%) | 7,750 (44.9%) |
| 3-Person Household | 5,102 (52.8%) | 4,561 (47.2%) |
| 4+ Person Household | 5,771 (51.5%) | 5,432 (48.5%) |
| Total Housing Units | 30,370 (48.9%) | 31,683 (51.1%) |
Occupancy by Educational Attainment in Jackson
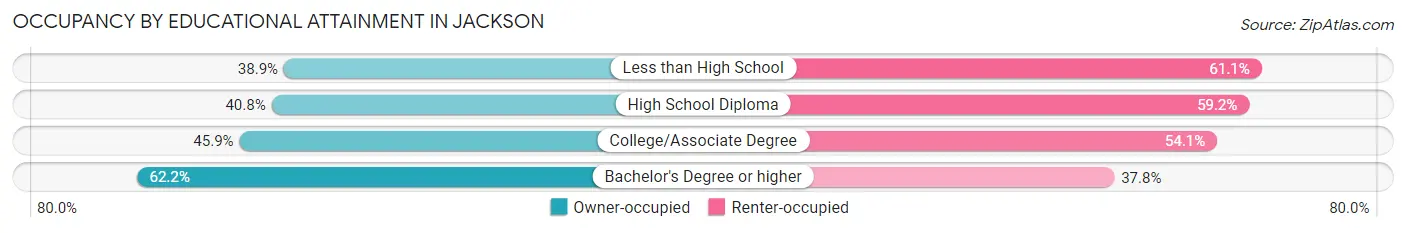
| Household Size | Owner-occupied | Renter-occupied |
| Less than High School | 2,800 (38.9%) | 4,404 (61.1%) |
| High School Diploma | 5,648 (40.8%) | 8,180 (59.2%) |
| College/Associate Degree | 10,164 (45.9%) | 11,967 (54.1%) |
| Bachelor's Degree or higher | 11,758 (62.2%) | 7,132 (37.8%) |
Occupancy by Age of Householder in Jackson
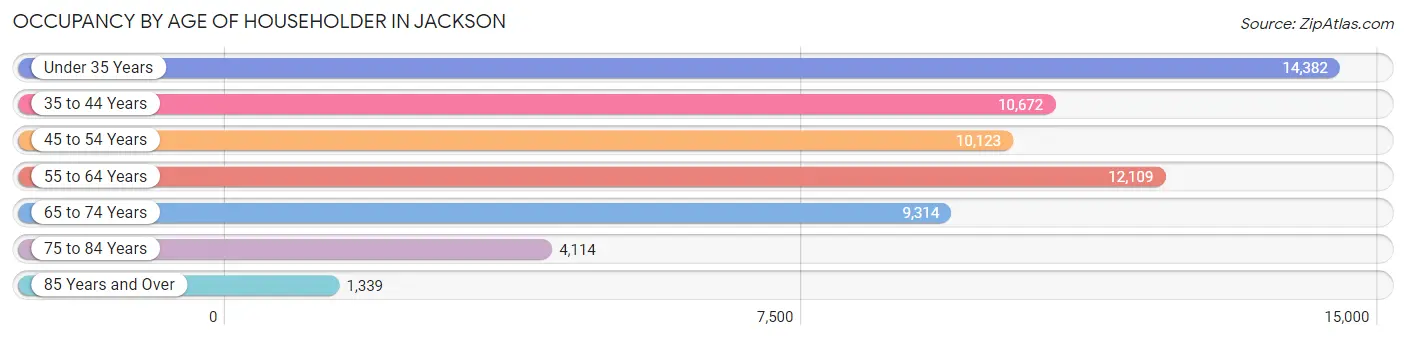
| Age Bracket | # Households | % Households |
| Under 35 Years | 14,382 | 23.2% |
| 35 to 44 Years | 10,672 | 17.2% |
| 45 to 54 Years | 10,123 | 16.3% |
| 55 to 64 Years | 12,109 | 19.5% |
| 65 to 74 Years | 9,314 | 15.0% |
| 75 to 84 Years | 4,114 | 6.6% |
| 85 Years and Over | 1,339 | 2.2% |
| Total | 62,053 | 100.0% |
Housing Finances in Jackson
Median Income by Occupancy in Jackson
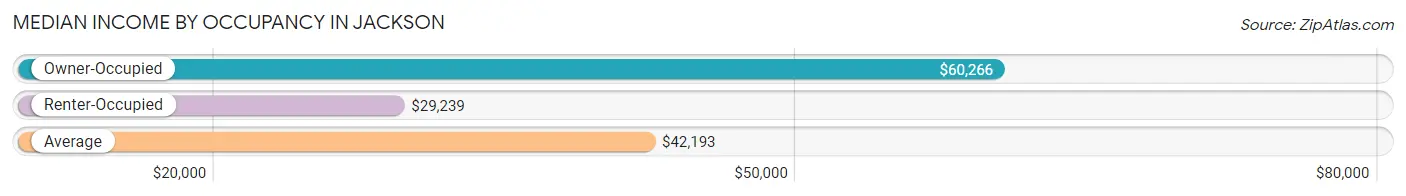
| Occupancy Type | # Households | Median Income |
| Owner-Occupied | 30,370 (48.9%) | $60,266 |
| Renter-Occupied | 31,683 (51.1%) | $29,239 |
| Average | 62,053 (100.0%) | $42,193 |
Occupancy by Householder Income Bracket in Jackson
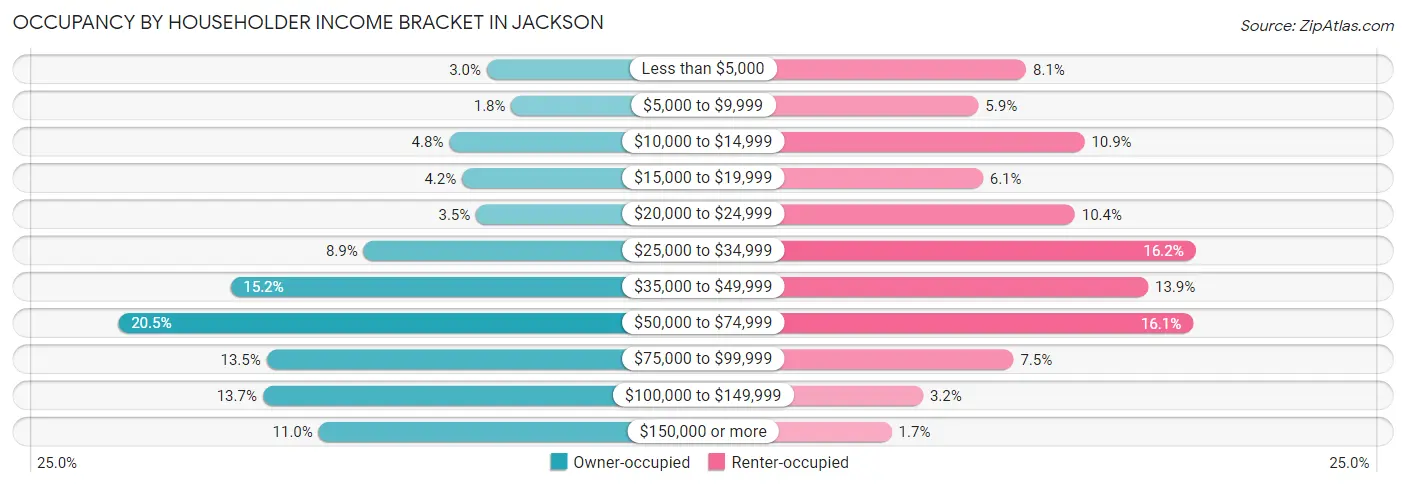
| Income Bracket | Owner-occupied | Renter-occupied |
| Less than $5,000 | 909 (3.0%) | 2,573 (8.1%) |
| $5,000 to $9,999 | 553 (1.8%) | 1,854 (5.9%) |
| $10,000 to $14,999 | 1,452 (4.8%) | 3,454 (10.9%) |
| $15,000 to $19,999 | 1,267 (4.2%) | 1,919 (6.1%) |
| $20,000 to $24,999 | 1,062 (3.5%) | 3,307 (10.4%) |
| $25,000 to $34,999 | 2,690 (8.9%) | 5,128 (16.2%) |
| $35,000 to $49,999 | 4,616 (15.2%) | 4,413 (13.9%) |
| $50,000 to $74,999 | 6,237 (20.5%) | 5,092 (16.1%) |
| $75,000 to $99,999 | 4,093 (13.5%) | 2,381 (7.5%) |
| $100,000 to $149,999 | 4,149 (13.7%) | 1,016 (3.2%) |
| $150,000 or more | 3,342 (11.0%) | 546 (1.7%) |
| Total | 30,370 (100.0%) | 31,683 (100.0%) |
Monthly Housing Cost Tiers in Jackson
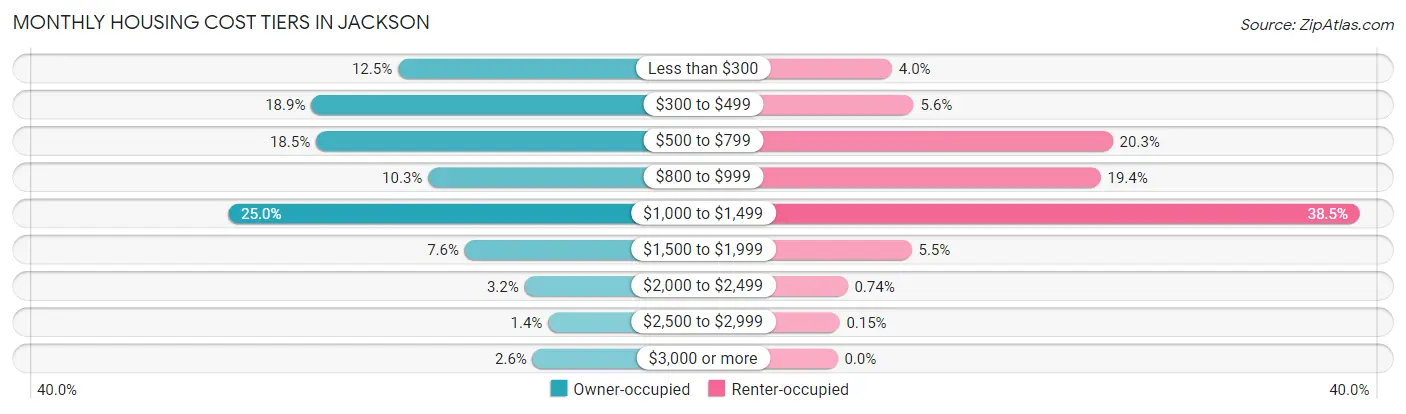
| Monthly Cost | Owner-occupied | Renter-occupied |
| Less than $300 | 3,795 (12.5%) | 1,270 (4.0%) |
| $300 to $499 | 5,736 (18.9%) | 1,779 (5.6%) |
| $500 to $799 | 5,632 (18.5%) | 6,422 (20.3%) |
| $800 to $999 | 3,122 (10.3%) | 6,140 (19.4%) |
| $1,000 to $1,499 | 7,596 (25.0%) | 12,188 (38.5%) |
| $1,500 to $1,999 | 2,303 (7.6%) | 1,729 (5.5%) |
| $2,000 to $2,499 | 965 (3.2%) | 234 (0.7%) |
| $2,500 to $2,999 | 436 (1.4%) | 48 (0.2%) |
| $3,000 or more | 785 (2.6%) | 0 (0.0%) |
| Total | 30,370 (100.0%) | 31,683 (100.0%) |
Physical Housing Characteristics in Jackson
Housing Structures in Jackson
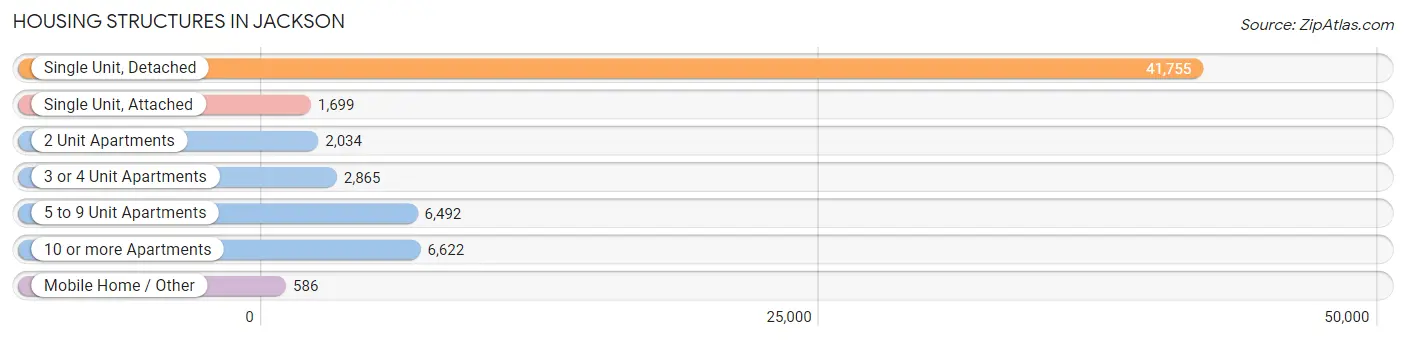
| Structure Type | # Housing Units | % Housing Units |
| Single Unit, Detached | 41,755 | 67.3% |
| Single Unit, Attached | 1,699 | 2.7% |
| 2 Unit Apartments | 2,034 | 3.3% |
| 3 or 4 Unit Apartments | 2,865 | 4.6% |
| 5 to 9 Unit Apartments | 6,492 | 10.5% |
| 10 or more Apartments | 6,622 | 10.7% |
| Mobile Home / Other | 586 | 0.9% |
| Total | 62,053 | 100.0% |
Housing Structures by Occupancy in Jackson
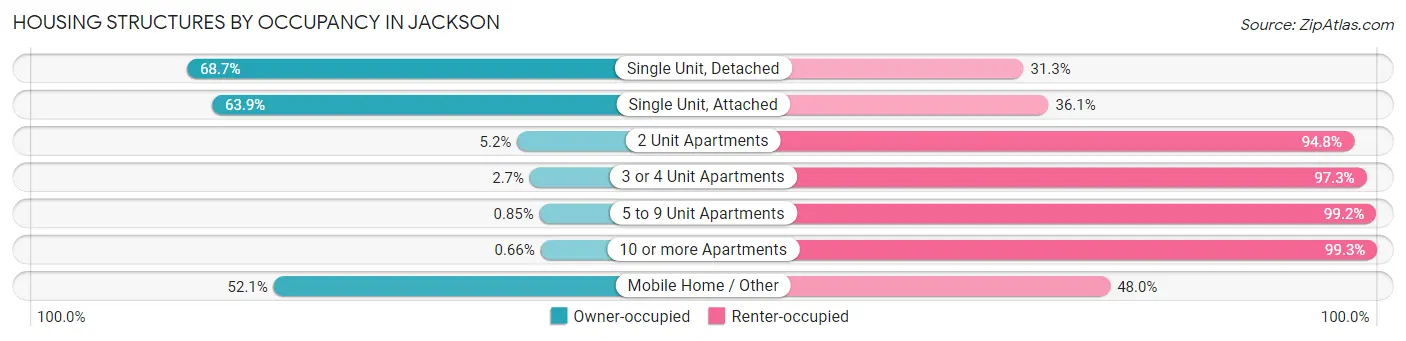
| Structure Type | Owner-occupied | Renter-occupied |
| Single Unit, Detached | 28,697 (68.7%) | 13,058 (31.3%) |
| Single Unit, Attached | 1,086 (63.9%) | 613 (36.1%) |
| 2 Unit Apartments | 105 (5.2%) | 1,929 (94.8%) |
| 3 or 4 Unit Apartments | 78 (2.7%) | 2,787 (97.3%) |
| 5 to 9 Unit Apartments | 55 (0.9%) | 6,437 (99.2%) |
| 10 or more Apartments | 44 (0.7%) | 6,578 (99.3%) |
| Mobile Home / Other | 305 (52.0%) | 281 (47.9%) |
| Total | 30,370 (48.9%) | 31,683 (51.1%) |
Housing Structures by Number of Rooms in Jackson
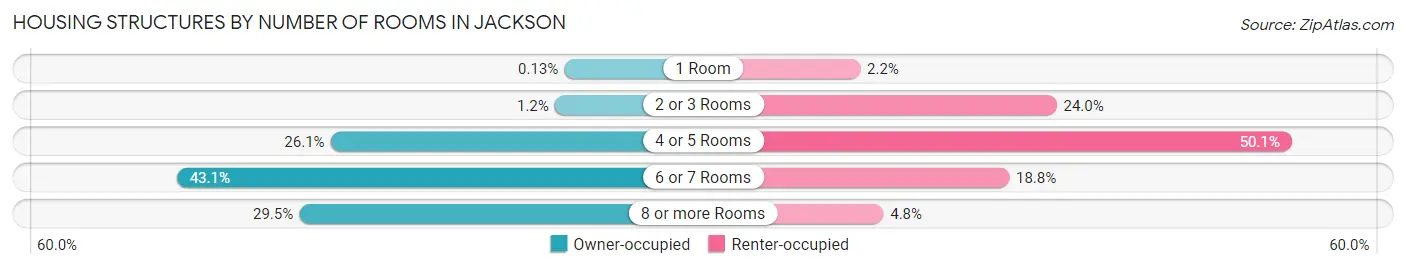
| Number of Rooms | Owner-occupied | Renter-occupied |
| 1 Room | 38 (0.1%) | 709 (2.2%) |
| 2 or 3 Rooms | 357 (1.2%) | 7,617 (24.0%) |
| 4 or 5 Rooms | 7,913 (26.1%) | 15,885 (50.1%) |
| 6 or 7 Rooms | 13,092 (43.1%) | 5,948 (18.8%) |
| 8 or more Rooms | 8,970 (29.5%) | 1,524 (4.8%) |
| Total | 30,370 (100.0%) | 31,683 (100.0%) |
Housing Structure by Heating Type in Jackson
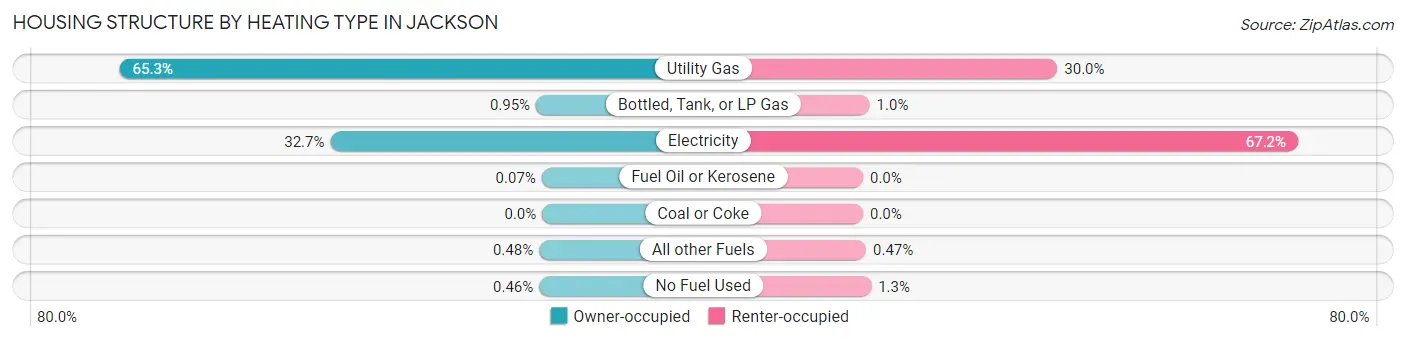
| Heating Type | Owner-occupied | Renter-occupied |
| Utility Gas | 19,833 (65.3%) | 9,516 (30.0%) |
| Bottled, Tank, or LP Gas | 287 (0.9%) | 323 (1.0%) |
| Electricity | 9,943 (32.7%) | 21,295 (67.2%) |
| Fuel Oil or Kerosene | 21 (0.1%) | 0 (0.0%) |
| Coal or Coke | 0 (0.0%) | 0 (0.0%) |
| All other Fuels | 145 (0.5%) | 149 (0.5%) |
| No Fuel Used | 141 (0.5%) | 400 (1.3%) |
| Total | 30,370 (100.0%) | 31,683 (100.0%) |
Household Vehicle Usage in Jackson
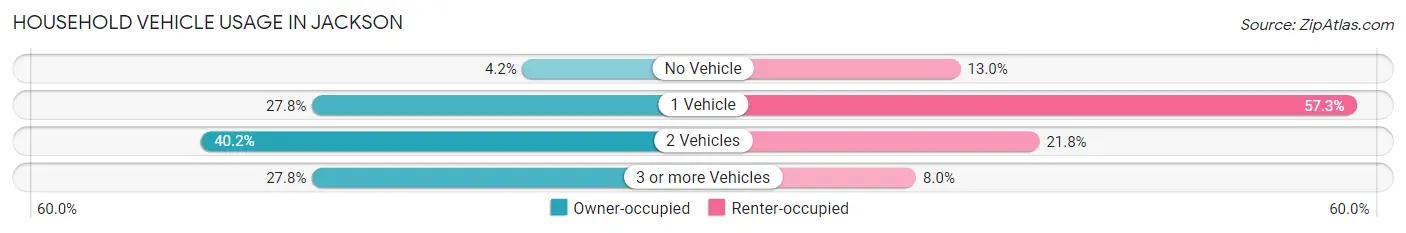
| Vehicles per Household | Owner-occupied | Renter-occupied |
| No Vehicle | 1,283 (4.2%) | 4,106 (13.0%) |
| 1 Vehicle | 8,439 (27.8%) | 18,145 (57.3%) |
| 2 Vehicles | 12,211 (40.2%) | 6,903 (21.8%) |
| 3 or more Vehicles | 8,437 (27.8%) | 2,529 (8.0%) |
| Total | 30,370 (100.0%) | 31,683 (100.0%) |
Real Estate & Mortgages in Jackson
Real Estate and Mortgage Overview in Jackson
| Characteristic | Without Mortgage | With Mortgage |
| Housing Units | 13,924 | 16,446 |
| Median Property Value | $85,700 | $121,600 |
| Median Household Income | $46,324 | $2,301 |
| Monthly Housing Costs | $414 | $785 |
| Real Estate Taxes | $1,038 | $2,521 |
Property Value by Mortgage Status in Jackson
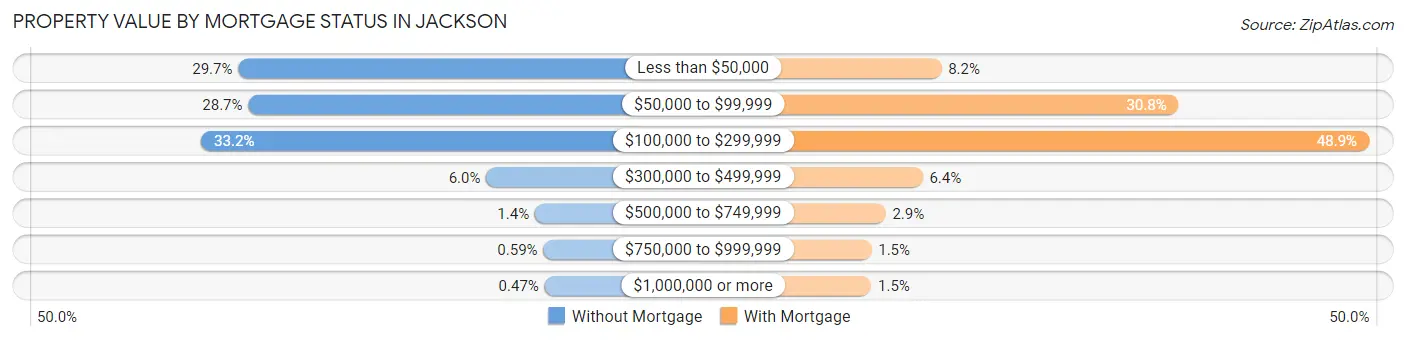
| Property Value | Without Mortgage | With Mortgage |
| Less than $50,000 | 4,129 (29.6%) | 1,342 (8.2%) |
| $50,000 to $99,999 | 3,995 (28.7%) | 5,060 (30.8%) |
| $100,000 to $299,999 | 4,620 (33.2%) | 8,040 (48.9%) |
| $300,000 to $499,999 | 840 (6.0%) | 1,047 (6.4%) |
| $500,000 to $749,999 | 193 (1.4%) | 468 (2.9%) |
| $750,000 to $999,999 | 82 (0.6%) | 246 (1.5%) |
| $1,000,000 or more | 65 (0.5%) | 243 (1.5%) |
| Total | 13,924 (100.0%) | 16,446 (100.0%) |
Household Income by Mortgage Status in Jackson
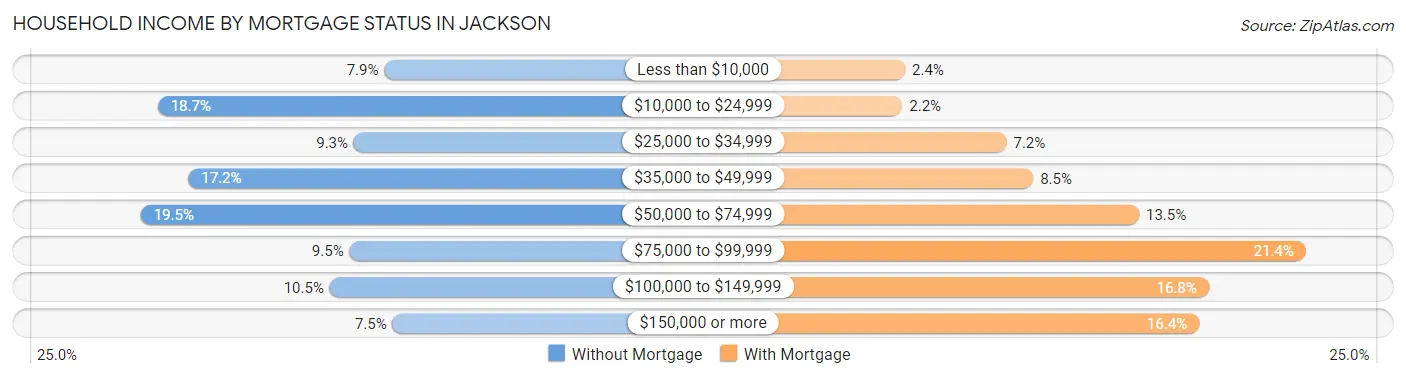
| Household Income | Without Mortgage | With Mortgage |
| Less than $10,000 | 1,096 (7.9%) | 388 (2.4%) |
| $10,000 to $24,999 | 2,598 (18.7%) | 366 (2.2%) |
| $25,000 to $34,999 | 1,298 (9.3%) | 1,183 (7.2%) |
| $35,000 to $49,999 | 2,395 (17.2%) | 1,392 (8.5%) |
| $50,000 to $74,999 | 2,711 (19.5%) | 2,221 (13.5%) |
| $75,000 to $99,999 | 1,327 (9.5%) | 3,526 (21.4%) |
| $100,000 to $149,999 | 1,458 (10.5%) | 2,766 (16.8%) |
| $150,000 or more | 1,041 (7.5%) | 2,691 (16.4%) |
| Total | 13,924 (100.0%) | 16,446 (100.0%) |
Property Value to Household Income Ratio in Jackson
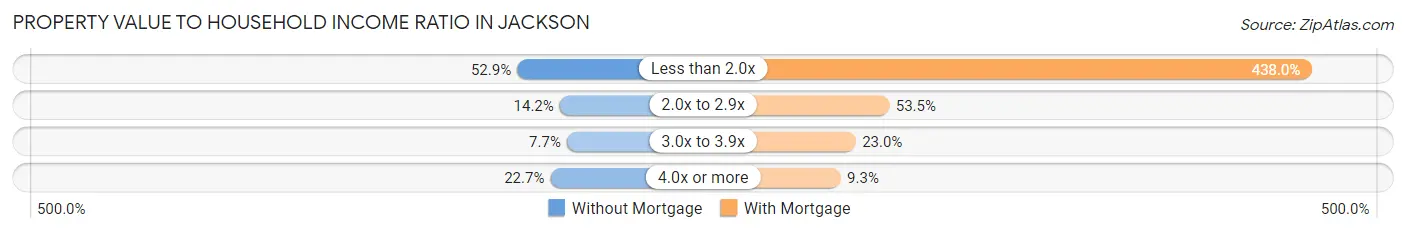
| Value-to-Income Ratio | Without Mortgage | With Mortgage |
| Less than 2.0x | 7,366 (52.9%) | 72,027 (438.0%) |
| 2.0x to 2.9x | 1,972 (14.2%) | 8,792 (53.5%) |
| 3.0x to 3.9x | 1,074 (7.7%) | 3,775 (23.0%) |
| 4.0x or more | 3,160 (22.7%) | 1,527 (9.3%) |
| Total | 13,924 (100.0%) | 16,446 (100.0%) |
Real Estate Taxes by Mortgage Status in Jackson
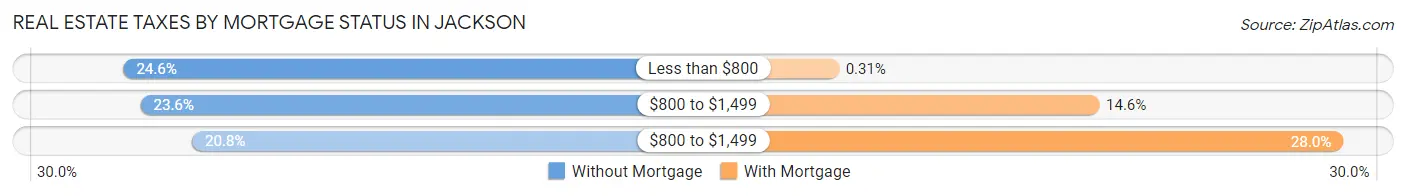
| Property Taxes | Without Mortgage | With Mortgage |
| Less than $800 | 3,422 (24.6%) | 51 (0.3%) |
| $800 to $1,499 | 3,292 (23.6%) | 2,398 (14.6%) |
| $800 to $1,499 | 2,899 (20.8%) | 4,596 (28.0%) |
| Total | 13,924 (100.0%) | 16,446 (100.0%) |
Health & Disability in Jackson
Health Insurance Coverage by Age in Jackson
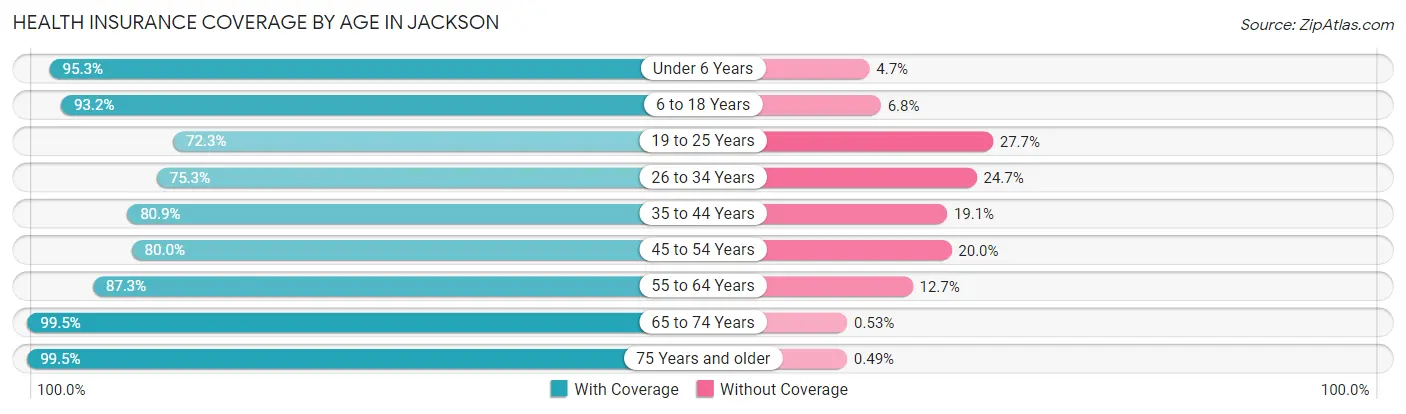
| Age Bracket | With Coverage | Without Coverage |
| Under 6 Years | 11,630 (95.3%) | 571 (4.7%) |
| 6 to 18 Years | 25,595 (93.2%) | 1,865 (6.8%) |
| 19 to 25 Years | 13,359 (72.3%) | 5,116 (27.7%) |
| 26 to 34 Years | 15,001 (75.3%) | 4,911 (24.7%) |
| 35 to 44 Years | 14,884 (80.9%) | 3,523 (19.1%) |
| 45 to 54 Years | 13,153 (80.0%) | 3,282 (20.0%) |
| 55 to 64 Years | 15,586 (87.3%) | 2,274 (12.7%) |
| 65 to 74 Years | 13,411 (99.5%) | 71 (0.5%) |
| 75 Years and older | 7,583 (99.5%) | 37 (0.5%) |
| Total | 130,202 (85.7%) | 21,650 (14.3%) |
Health Insurance Coverage by Citizenship Status in Jackson
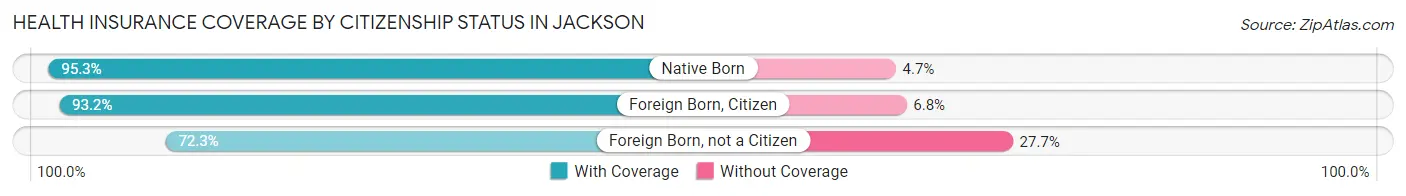
| Citizenship Status | With Coverage | Without Coverage |
| Native Born | 11,630 (95.3%) | 571 (4.7%) |
| Foreign Born, Citizen | 25,595 (93.2%) | 1,865 (6.8%) |
| Foreign Born, not a Citizen | 13,359 (72.3%) | 5,116 (27.7%) |
Health Insurance Coverage by Household Income in Jackson
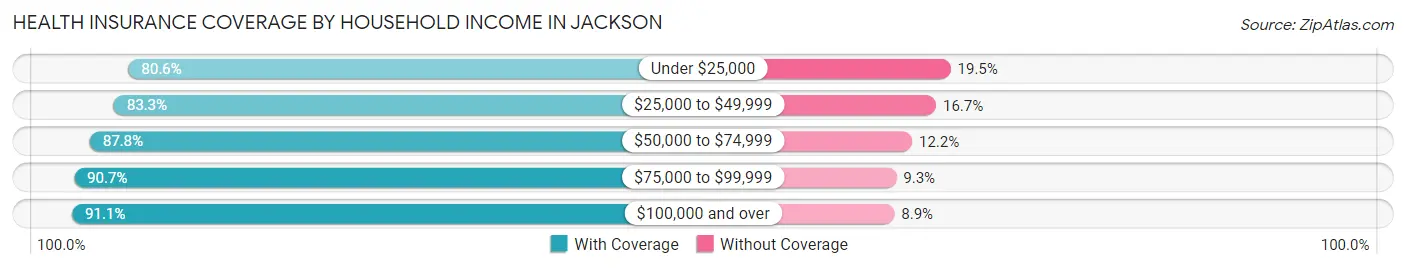
| Household Income | With Coverage | Without Coverage |
| Under $25,000 | 27,056 (80.5%) | 6,534 (19.5%) |
| $25,000 to $49,999 | 32,009 (83.3%) | 6,425 (16.7%) |
| $50,000 to $74,999 | 25,740 (87.8%) | 3,582 (12.2%) |
| $75,000 to $99,999 | 14,980 (90.7%) | 1,534 (9.3%) |
| $100,000 and over | 25,601 (91.1%) | 2,503 (8.9%) |
Public vs Private Health Insurance Coverage by Age in Jackson
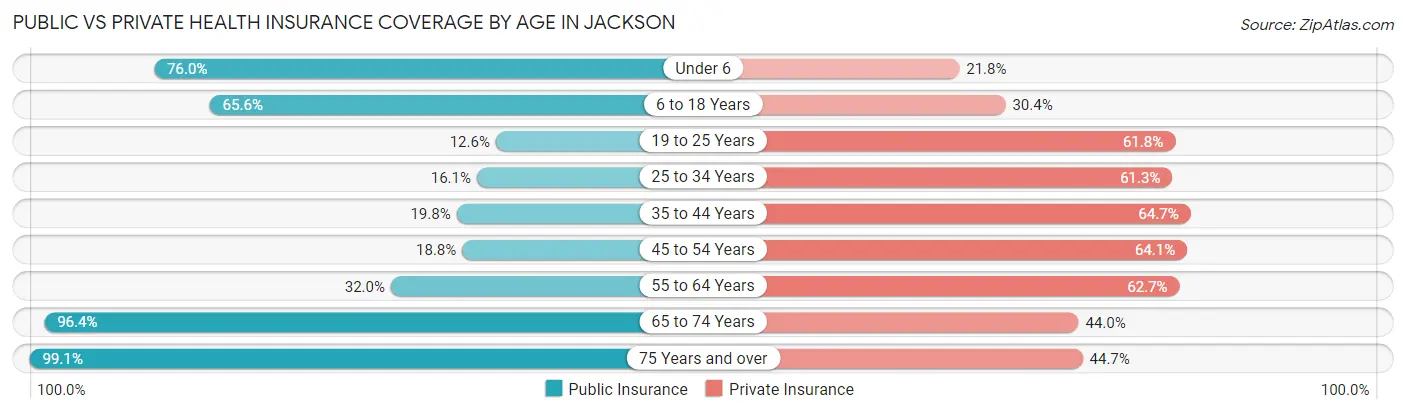
| Age Bracket | Public Insurance | Private Insurance |
| Under 6 | 9,270 (76.0%) | 2,661 (21.8%) |
| 6 to 18 Years | 18,024 (65.6%) | 8,343 (30.4%) |
| 19 to 25 Years | 2,319 (12.6%) | 11,425 (61.8%) |
| 25 to 34 Years | 3,200 (16.1%) | 12,213 (61.3%) |
| 35 to 44 Years | 3,652 (19.8%) | 11,917 (64.7%) |
| 45 to 54 Years | 3,088 (18.8%) | 10,532 (64.1%) |
| 55 to 64 Years | 5,721 (32.0%) | 11,192 (62.7%) |
| 65 to 74 Years | 12,991 (96.4%) | 5,926 (44.0%) |
| 75 Years and over | 7,551 (99.1%) | 3,406 (44.7%) |
| Total | 65,816 (43.3%) | 77,615 (51.1%) |
Disability Status by Sex by Age in Jackson
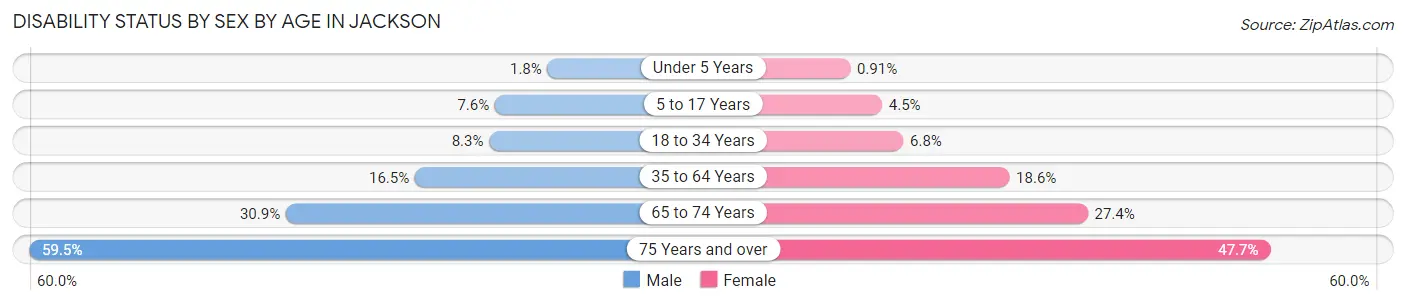
| Age Bracket | Male | Female |
| Under 5 Years | 98 (1.8%) | 41 (0.9%) |
| 5 to 17 Years | 985 (7.6%) | 610 (4.5%) |
| 18 to 34 Years | 1,556 (8.3%) | 1,534 (6.8%) |
| 35 to 64 Years | 3,962 (16.5%) | 5,355 (18.6%) |
| 65 to 74 Years | 1,746 (30.9%) | 2,143 (27.4%) |
| 75 Years and over | 1,615 (59.5%) | 2,341 (47.7%) |
Disability Class by Sex by Age in Jackson
Disability Class: Hearing Difficulty
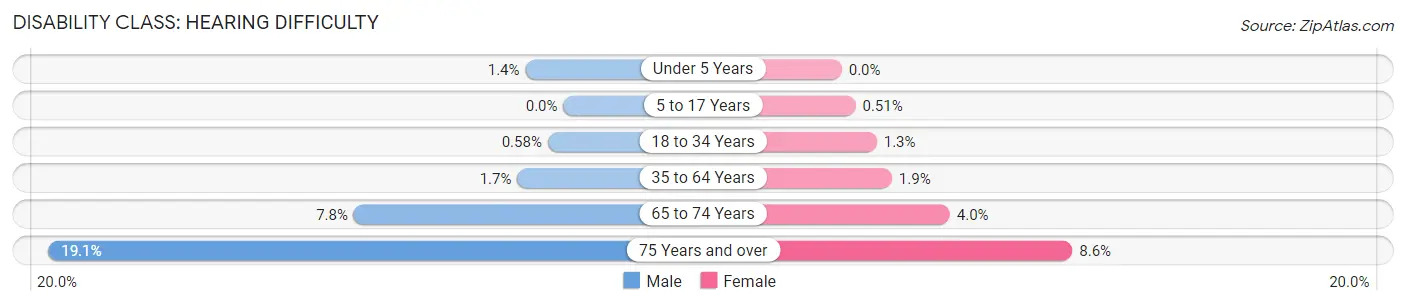
| Age Bracket | Male | Female |
| Under 5 Years | 79 (1.4%) | 0 (0.0%) |
| 5 to 17 Years | 0 (0.0%) | 70 (0.5%) |
| 18 to 34 Years | 109 (0.6%) | 292 (1.3%) |
| 35 to 64 Years | 409 (1.7%) | 534 (1.9%) |
| 65 to 74 Years | 440 (7.8%) | 314 (4.0%) |
| 75 Years and over | 519 (19.1%) | 420 (8.6%) |
Disability Class: Vision Difficulty
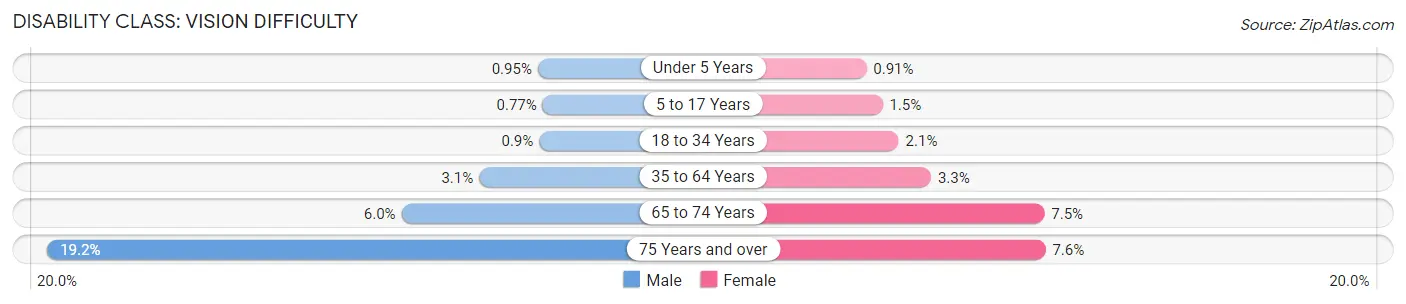
| Age Bracket | Male | Female |
| Under 5 Years | 53 (0.9%) | 41 (0.9%) |
| 5 to 17 Years | 100 (0.8%) | 207 (1.5%) |
| 18 to 34 Years | 169 (0.9%) | 473 (2.1%) |
| 35 to 64 Years | 751 (3.1%) | 950 (3.3%) |
| 65 to 74 Years | 340 (6.0%) | 589 (7.5%) |
| 75 Years and over | 520 (19.2%) | 371 (7.6%) |
Disability Class: Cognitive Difficulty
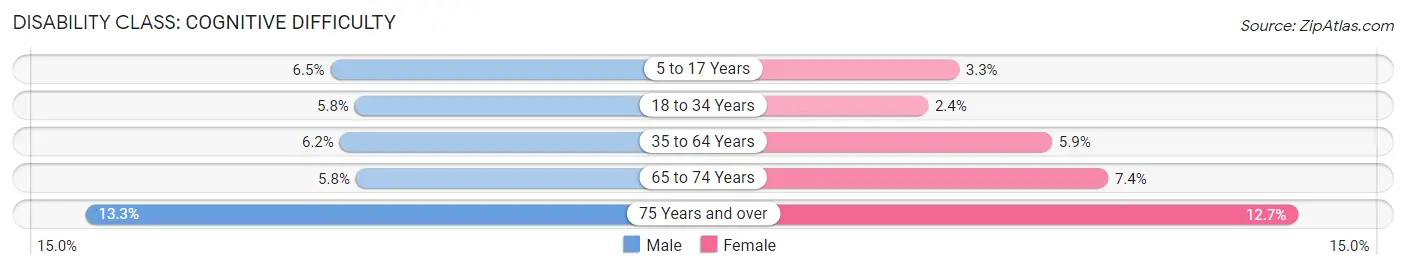
| Age Bracket | Male | Female |
| 5 to 17 Years | 840 (6.5%) | 446 (3.3%) |
| 18 to 34 Years | 1,096 (5.8%) | 538 (2.4%) |
| 35 to 64 Years | 1,493 (6.2%) | 1,679 (5.9%) |
| 65 to 74 Years | 327 (5.8%) | 580 (7.4%) |
| 75 Years and over | 361 (13.3%) | 623 (12.7%) |
Disability Class: Ambulatory Difficulty
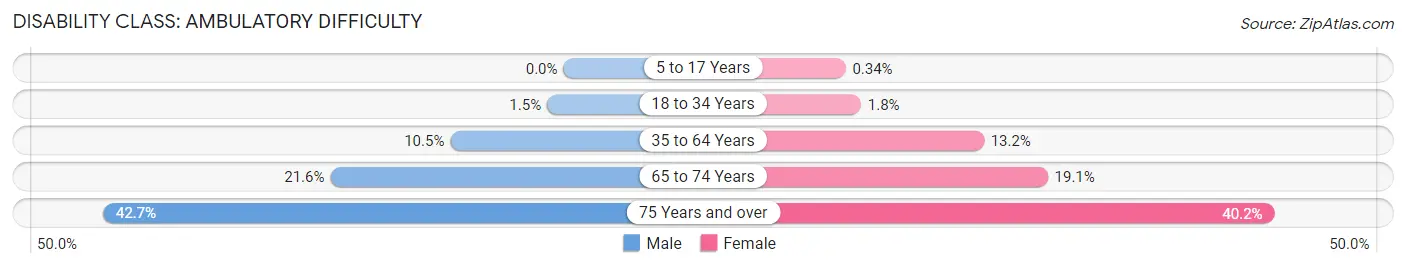
| Age Bracket | Male | Female |
| 5 to 17 Years | 0 (0.0%) | 46 (0.3%) |
| 18 to 34 Years | 286 (1.5%) | 398 (1.8%) |
| 35 to 64 Years | 2,517 (10.5%) | 3,783 (13.2%) |
| 65 to 74 Years | 1,223 (21.6%) | 1,495 (19.1%) |
| 75 Years and over | 1,160 (42.7%) | 1,970 (40.2%) |
Disability Class: Self-Care Difficulty
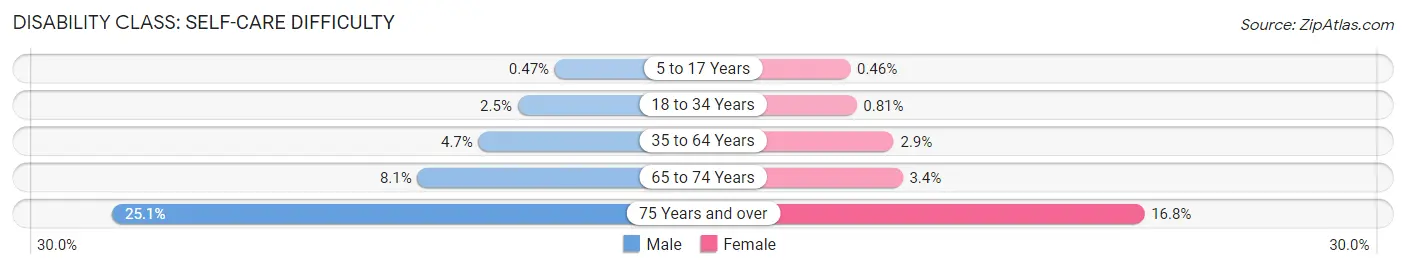
| Age Bracket | Male | Female |
| 5 to 17 Years | 61 (0.5%) | 63 (0.5%) |
| 18 to 34 Years | 479 (2.5%) | 182 (0.8%) |
| 35 to 64 Years | 1,132 (4.7%) | 827 (2.9%) |
| 65 to 74 Years | 459 (8.1%) | 265 (3.4%) |
| 75 Years and over | 682 (25.1%) | 826 (16.8%) |
Technology Access in Jackson
Computing Device Access in Jackson
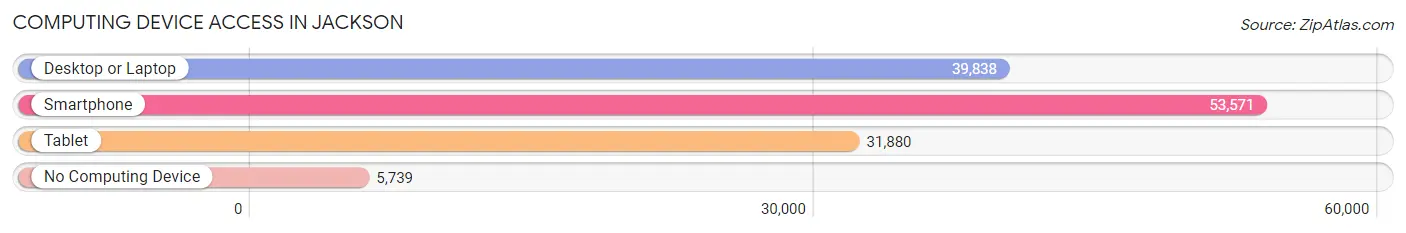
| Device Type | # Households | % Households |
| Desktop or Laptop | 39,838 | 64.2% |
| Smartphone | 53,571 | 86.3% |
| Tablet | 31,880 | 51.4% |
| No Computing Device | 5,739 | 9.2% |
| Total | 62,053 | 100.0% |
Internet Access in Jackson
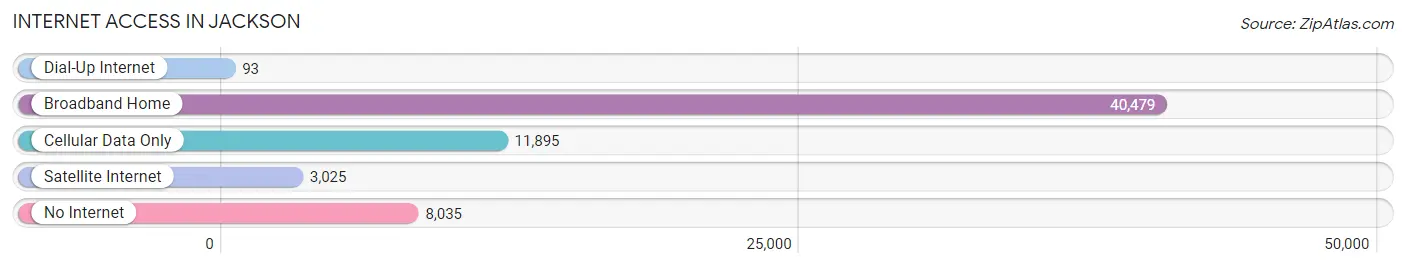
| Internet Type | # Households | % Households |
| Dial-Up Internet | 93 | 0.2% |
| Broadband Home | 40,479 | 65.2% |
| Cellular Data Only | 11,895 | 19.2% |
| Satellite Internet | 3,025 | 4.9% |
| No Internet | 8,035 | 13.0% |
| Total | 62,053 | 100.0% |
Jackson Summary
Jackson, Mississippi is the capital and most populous city of the state of Mississippi. It is located in the central region of the state, along the Pearl River. The city is named after Andrew Jackson, the seventh president of the United States. Jackson is the county seat of Hinds County and the anchor of the Jackson metropolitan area, which is home to around 579,000 people.
History
The area that is now Jackson was first inhabited by the Choctaw Native American tribe. The city was founded in 1821 and named after Andrew Jackson, who was then the president of the United States. Jackson was chosen as the state capital in 1822 and was incorporated in 1822.
During the Civil War, Jackson was a strategic target for Union forces. The city was captured by Union forces in 1863 and was the site of several battles. After the war, Jackson was rebuilt and became an important center for the state’s economy.
In the late 19th century, Jackson was a major railroad hub and a center for the lumber industry. The city was also home to several large cotton mills. In the early 20th century, Jackson was a major center for the civil rights movement.
Geography
Jackson is located in the central region of Mississippi, along the Pearl River. The city has a total area of 115.2 square miles, of which 114.9 square miles is land and 0.3 square miles is water. The city is located in the Jackson Prairie region of the state, which is characterized by rolling hills and flat plains.
The climate in Jackson is humid subtropical, with hot, humid summers and mild winters. The average annual temperature is 64.3°F, with an average high of 81.3°F in July and an average low of 46.7°F in January.
Economy
Jackson’s economy is largely based on government, healthcare, and education. The city is home to several large government agencies, including the Mississippi Department of Transportation, the Mississippi Department of Human Services, and the Mississippi Department of Corrections.
The city is also home to several large healthcare organizations, including the University of Mississippi Medical Center, St. Dominic Hospital, and the Mississippi Baptist Medical Center. Jackson is also home to several colleges and universities, including Jackson State University, Millsaps College, and Belhaven University.
The city’s economy is also supported by several large corporations, including Entergy Mississippi, AT&T, and Trustmark National Bank. Jackson is also home to several large retail centers, including the Metrocenter Mall and the Jackson Mall.
Demographics
As of the 2010 census, Jackson had a population of 173,514. The city’s population is racially diverse, with African Americans making up the majority of the population (60.7%). The city also has a large Hispanic population (7.2%), as well as a small Asian population (2.2%).
The median household income in Jackson is $35,945, and the median home value is $90,400. The city’s poverty rate is 28.2%, and the unemployment rate is 8.2%. The city’s population is also highly educated, with 33.2% of the population having a bachelor’s degree or higher.
Common Questions
What is the Total Population of Jackson?
Total Population of Jackson is 153,271.
What is the Total Male Population of Jackson?
Total Male Population of Jackson is 70,518.
What is the Total Female Population of Jackson?
Total Female Population of Jackson is 82,753.
What is the Ratio of Males per 100 Females in Jackson?
There are 85.22 Males per 100 Females in Jackson.
What is the Ratio of Females per 100 Males in Jackson?
There are 117.35 Females per 100 Males in Jackson.
What is the Median Population Age in Jackson?
Median Population Age in Jackson is 34.1 Years.
What is the Average Family Size in Jackson
Average Family Size in Jackson is 3.2 People.
What is the Average Household Size in Jackson
Average Household Size in Jackson is 2.4 People.
What is Per Capita Income in Jackson?
Per Capita income in Jackson is $25,413.
What is the Median Family Income in Jackson?
Median Family Income in Jackson is $52,443.
What is the Median Household income in Jackson?
Median Household Income in Jackson is $42,193.
What is Income or Wage Gap in Jackson?
Income or Wage Gap in Jackson is 21.9%.
Women in Jackson earn 78.1 cents for every dollar earned by a man.
What is Family Income Deficit in Jackson?
Family Income Deficit in Jackson is $11,115.
Families that are below poverty line in Jackson earn $11,115 less on average than the poverty threshold level.
What is Inequality or Gini Index in Jackson?
Inequality or Gini Index in Jackson is 0.50.
How Large is the Labor Force in Jackson?
There are 72,835 People in the Labor Forcein in Jackson.
What is the Percentage of People in the Labor Force in Jackson?
60.6% of People are in the Labor Force in Jackson.
What is the Unemployment Rate in Jackson?
Unemployment Rate in Jackson is 9.3%.