Chackbay, LA
Chackbay Map
Chackbay Overview
5,641
TOTAL POPULATION
2,805
MALE POPULATION
2,836
FEMALE POPULATION
98.91
MALES / 100 FEMALES
101.11
FEMALES / 100 MALES
41.0
MEDIAN AGE
2.9
AVG FAMILY SIZE
2.5
AVG HOUSEHOLD SIZE
$32,785
PER CAPITA INCOME
$74,563
AVG FAMILY INCOME
$68,376
AVG HOUSEHOLD INCOME
43.8%
WAGE / INCOME GAP [ % ]
56.2¢/ $1
WAGE / INCOME GAP [ $ ]
$9,537
FAMILY INCOME DEFICIT
0.43
INEQUALITY / GINI INDEX
2,975
LABOR FORCE [ PEOPLE ]
66.9%
PERCENT IN LABOR FORCE
6.9%
UNEMPLOYMENT RATE
Race in Chackbay
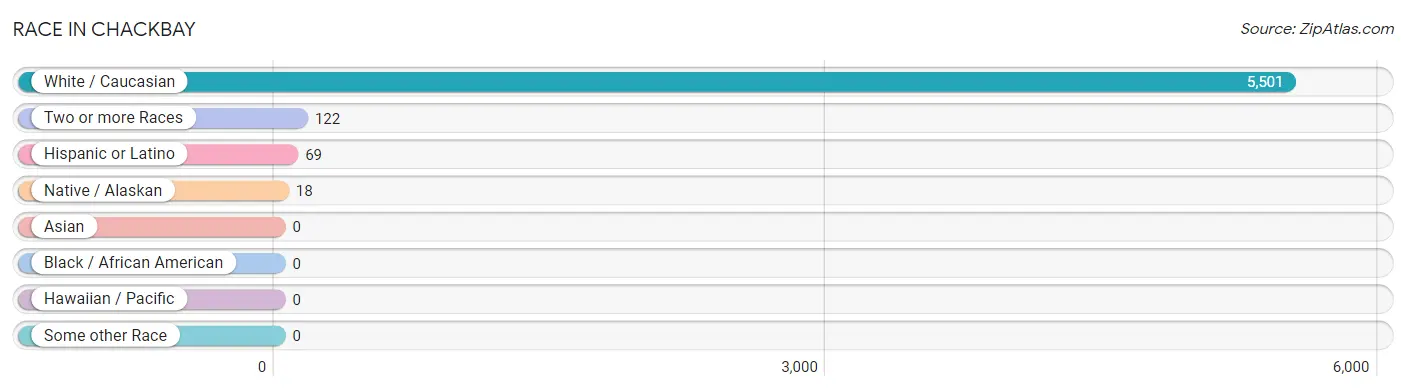
The most populous races in Chackbay are White / Caucasian (5,501 | 97.5%), Two or more Races (122 | 2.2%), and Hispanic or Latino (69 | 1.2%).
| Race | # Population | % Population |
| Asian | 0 | 0.0% |
| Black / African American | 0 | 0.0% |
| Hawaiian / Pacific | 0 | 0.0% |
| Hispanic or Latino | 69 | 1.2% |
| Native / Alaskan | 18 | 0.3% |
| White / Caucasian | 5,501 | 97.5% |
| Two or more Races | 122 | 2.2% |
| Some other Race | 0 | 0.0% |
| Total | 5,641 | 100.0% |
Ancestry in Chackbay
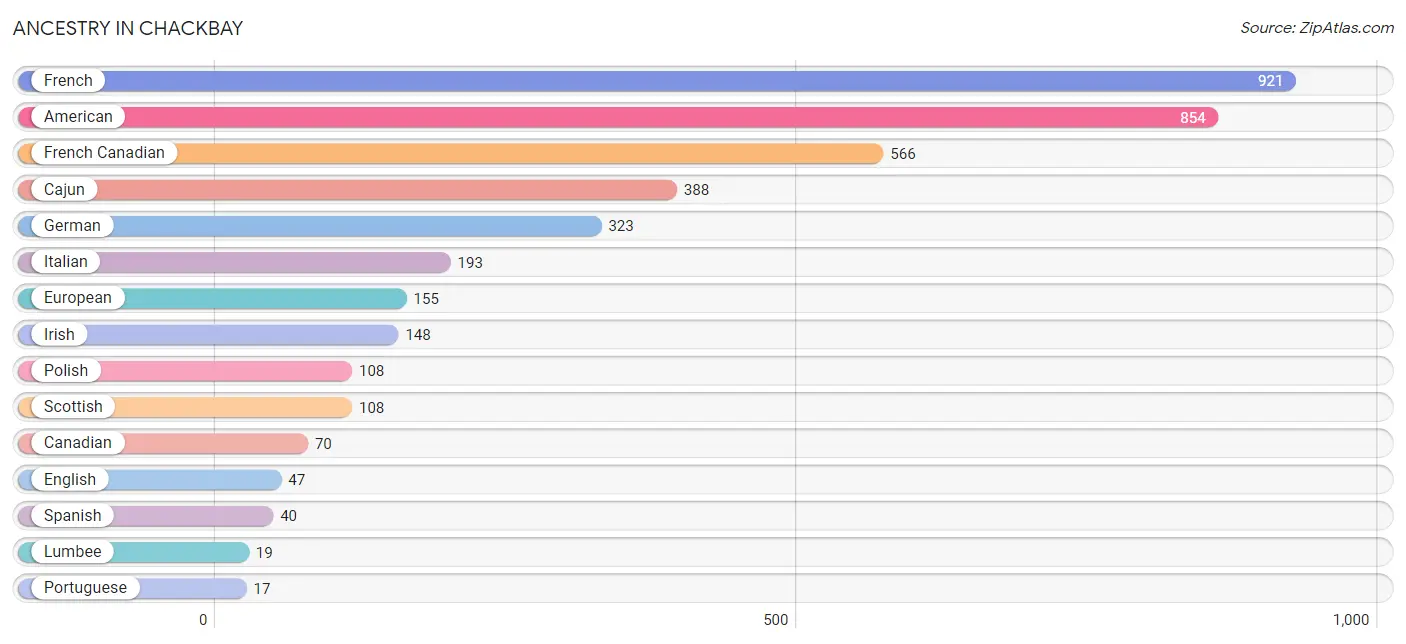
The most populous ancestries reported in Chackbay are French (921 | 16.3%), American (854 | 15.1%), French Canadian (566 | 10.0%), Cajun (388 | 6.9%), and German (323 | 5.7%), together accounting for 54.1% of all Chackbay residents.
| Ancestry | # Population | % Population |
| American | 854 | 15.1% |
| Cajun | 388 | 6.9% |
| Canadian | 70 | 1.2% |
| Choctaw | 7 | 0.1% |
| English | 47 | 0.8% |
| European | 155 | 2.8% |
| French | 921 | 16.3% |
| French Canadian | 566 | 10.0% |
| German | 323 | 5.7% |
| Houma | 11 | 0.2% |
| Irish | 148 | 2.6% |
| Italian | 193 | 3.4% |
| Lumbee | 19 | 0.3% |
| Mexican | 15 | 0.3% |
| Polish | 108 | 1.9% |
| Portuguese | 17 | 0.3% |
| Scottish | 108 | 1.9% |
| Spaniard | 14 | 0.3% |
| Spanish | 40 | 0.7% | View All 19 Rows |
Immigrants in Chackbay

| Immigration Origin | # Population | % Population | View All 0 Rows |
Sex and Age in Chackbay
Sex and Age in Chackbay
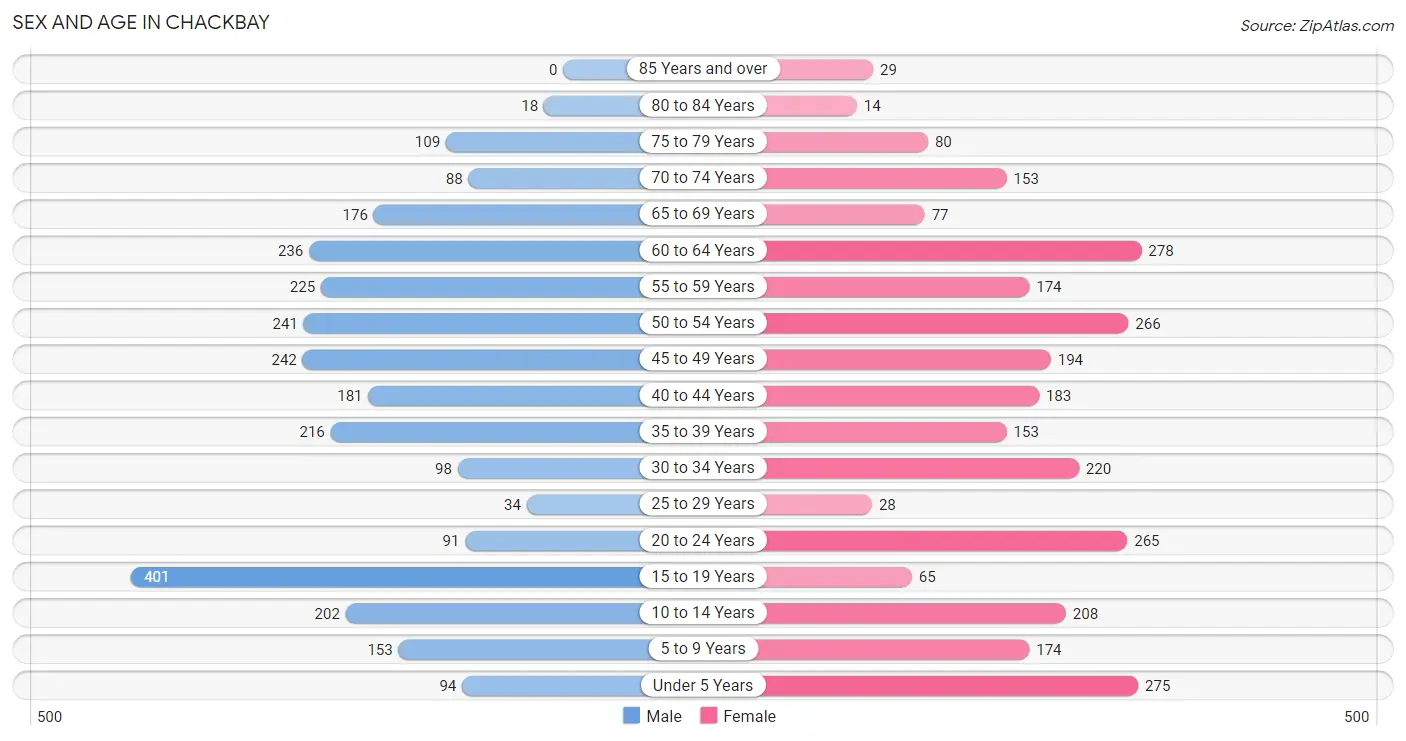
The most populous age groups in Chackbay are 15 to 19 Years (401 | 14.3%) for men and 60 to 64 Years (278 | 9.8%) for women.
| Age Bracket | Male | Female |
| Under 5 Years | 94 (3.4%) | 275 (9.7%) |
| 5 to 9 Years | 153 (5.4%) | 174 (6.1%) |
| 10 to 14 Years | 202 (7.2%) | 208 (7.3%) |
| 15 to 19 Years | 401 (14.3%) | 65 (2.3%) |
| 20 to 24 Years | 91 (3.2%) | 265 (9.3%) |
| 25 to 29 Years | 34 (1.2%) | 28 (1.0%) |
| 30 to 34 Years | 98 (3.5%) | 220 (7.8%) |
| 35 to 39 Years | 216 (7.7%) | 153 (5.4%) |
| 40 to 44 Years | 181 (6.5%) | 183 (6.5%) |
| 45 to 49 Years | 242 (8.6%) | 194 (6.8%) |
| 50 to 54 Years | 241 (8.6%) | 266 (9.4%) |
| 55 to 59 Years | 225 (8.0%) | 174 (6.1%) |
| 60 to 64 Years | 236 (8.4%) | 278 (9.8%) |
| 65 to 69 Years | 176 (6.3%) | 77 (2.7%) |
| 70 to 74 Years | 88 (3.1%) | 153 (5.4%) |
| 75 to 79 Years | 109 (3.9%) | 80 (2.8%) |
| 80 to 84 Years | 18 (0.6%) | 14 (0.5%) |
| 85 Years and over | 0 (0.0%) | 29 (1.0%) |
| Total | 2,805 (100.0%) | 2,836 (100.0%) |
Families and Households in Chackbay
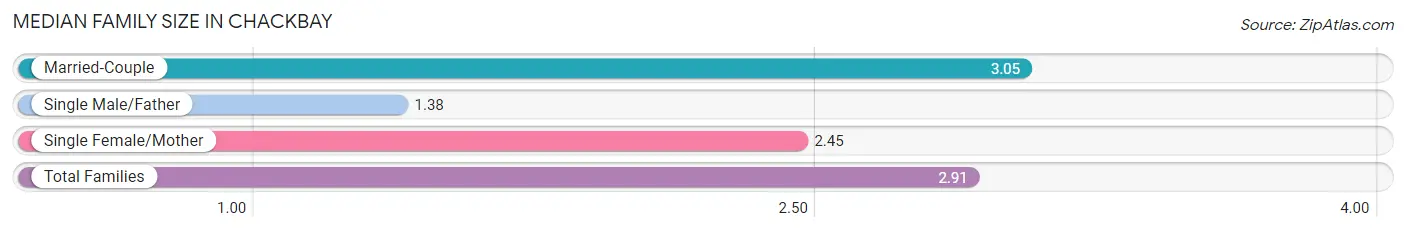
Median Family Size in Chackbay
The median family size in Chackbay is 2.91 persons per family, with married-couple families (1,336 | 80.1%) accounting for the largest median family size of 3.05 persons per family. On the other hand, single male/father families (40 | 2.4%) represent the smallest median family size with 1.38 persons per family.
| Family Type | # Families | Family Size |
| Married-Couple | 1,336 (80.1%) | 3.05 |
| Single Male/Father | 40 (2.4%) | 1.38 |
| Single Female/Mother | 292 (17.5%) | 2.45 |
| Total Families | 1,668 (100.0%) | 2.91 |
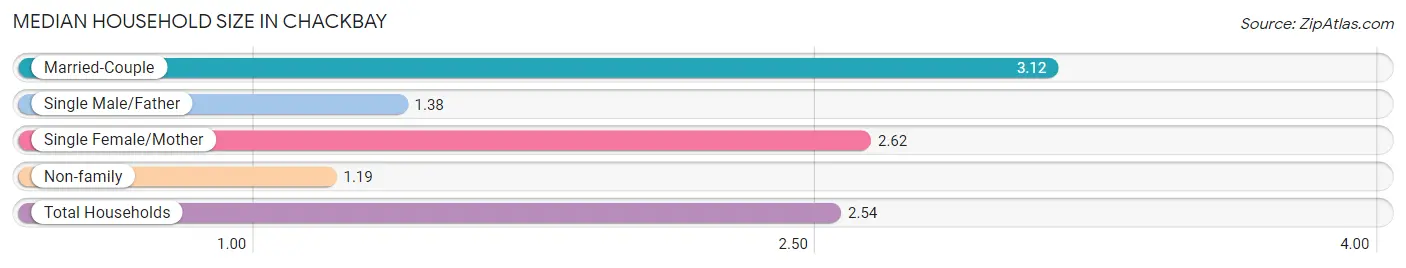
Median Household Size in Chackbay
The median household size in Chackbay is 2.54 persons per household, with married-couple households (1,336 | 60.2%) accounting for the largest median household size of 3.12 persons per household. non-family households (551 | 24.8%) represent the smallest median household size with 1.19 persons per household.
| Household Type | # Households | Household Size |
| Married-Couple | 1,336 (60.2%) | 3.12 |
| Single Male/Father | 40 (1.8%) | 1.38 |
| Single Female/Mother | 292 (13.2%) | 2.62 |
| Non-family | 551 (24.8%) | 1.19 |
| Total Households | 2,219 (100.0%) | 2.54 |
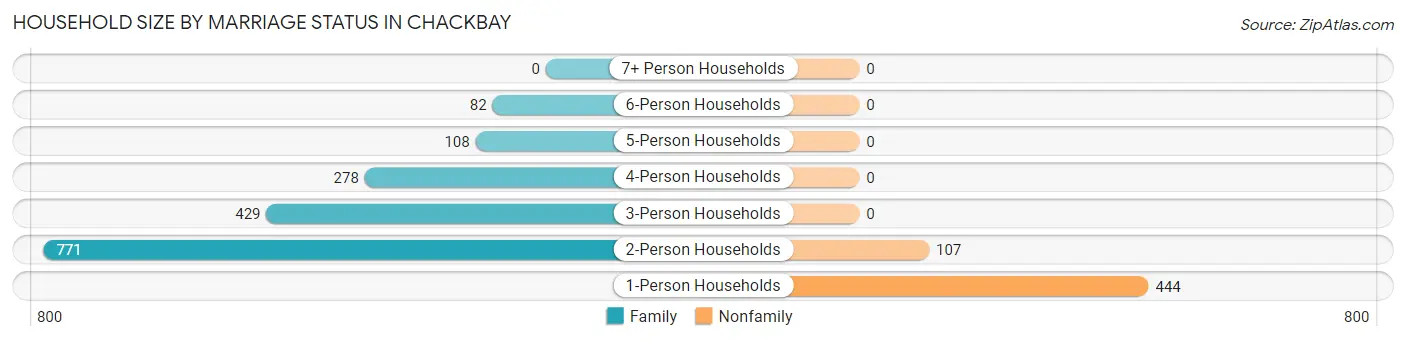
Household Size by Marriage Status in Chackbay
Out of a total of 2,219 households in Chackbay, 1,668 (75.2%) are family households, while 551 (24.8%) are nonfamily households. The most numerous type of family households are 2-person households, comprising 771, and the most common type of nonfamily households are 1-person households, comprising 444.
| Household Size | Family Households | Nonfamily Households |
| 1-Person Households | - | 444 (20.0%) |
| 2-Person Households | 771 (34.7%) | 107 (4.8%) |
| 3-Person Households | 429 (19.3%) | 0 (0.0%) |
| 4-Person Households | 278 (12.5%) | 0 (0.0%) |
| 5-Person Households | 108 (4.9%) | 0 (0.0%) |
| 6-Person Households | 82 (3.7%) | 0 (0.0%) |
| 7+ Person Households | 0 (0.0%) | 0 (0.0%) |
| Total | 1,668 (75.2%) | 551 (24.8%) |
Female Fertility in Chackbay
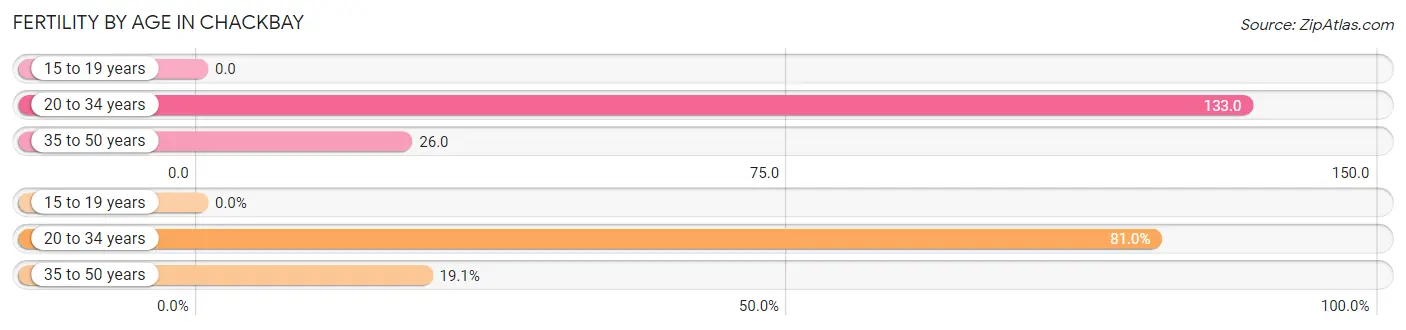
Fertility by Age in Chackbay
Average fertility rate in Chackbay is 70.0 births per 1,000 women. Women in the age bracket of 20 to 34 years have the highest fertility rate with 133.0 births per 1,000 women. Women in the age bracket of 20 to 34 years acount for 80.9% of all women with births.
| Age Bracket | Women with Births | Births / 1,000 Women |
| 15 to 19 years | 0 (0.0%) | 0.0 |
| 20 to 34 years | 68 (80.9%) | 133.0 |
| 35 to 50 years | 16 (19.1%) | 26.0 |
| Total | 84 (100.0%) | 70.0 |
Fertility by Age by Marriage Status in Chackbay
19.0% of women with births (84) in Chackbay are married. The highest percentage of unmarried women with births falls into 20 to 34 years age bracket with 100.0% of them unmarried at the time of birth, while the lowest percentage of unmarried women with births belong to 35 to 50 years age bracket with 0.0% of them unmarried.
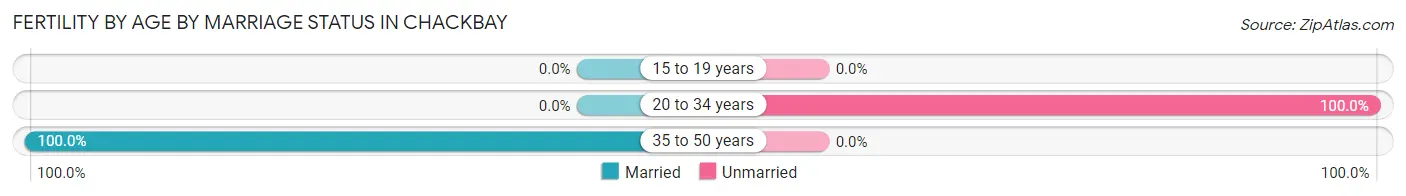
| Age Bracket | Married | Unmarried |
| 15 to 19 years | 0 (0.0%) | 0 (0.0%) |
| 20 to 34 years | 0 (0.0%) | 68 (100.0%) |
| 35 to 50 years | 16 (100.0%) | 0 (0.0%) |
| Total | 16 (19.1%) | 68 (80.9%) |
Fertility by Education in Chackbay
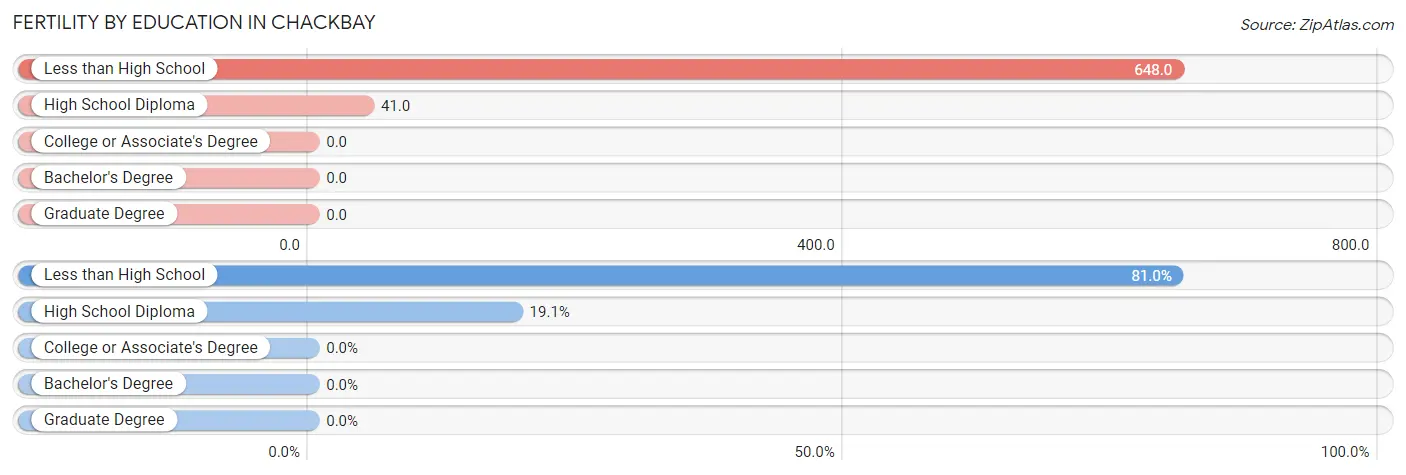
| Educational Attainment | Women with Births | Births / 1,000 Women |
| Less than High School | 68 (80.9%) | 648.0 |
| High School Diploma | 16 (19.1%) | 41.0 |
| College or Associate's Degree | 0 (0.0%) | 0.0 |
| Bachelor's Degree | 0 (0.0%) | 0.0 |
| Graduate Degree | 0 (0.0%) | 0.0 |
| Total | 84 (100.0%) | 70.0 |
Fertility by Education by Marriage Status in Chackbay
80.9% of women with births in Chackbay are unmarried. Women with the educational attainment of high school diploma are most likely to be married with 100.0% of them married at childbirth, while women with the educational attainment of less than high school are least likely to be married with 100.0% of them unmarried at childbirth.
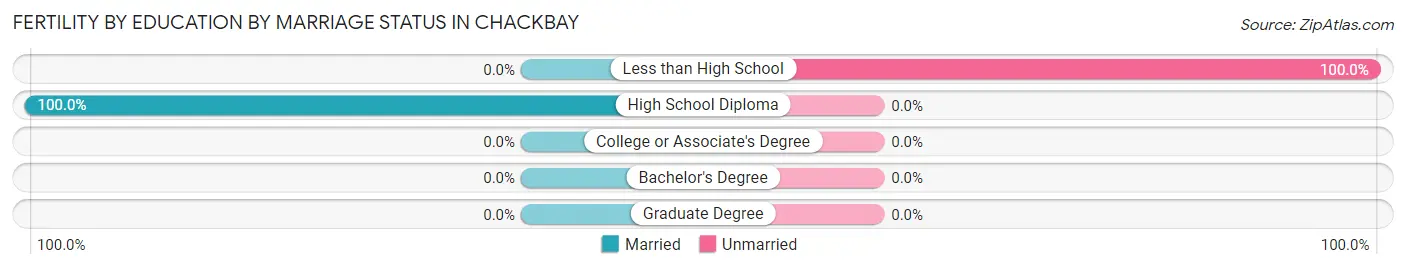
| Educational Attainment | Married | Unmarried |
| Less than High School | 0 (0.0%) | 68 (100.0%) |
| High School Diploma | 16 (100.0%) | 0 (0.0%) |
| College or Associate's Degree | 0 (0.0%) | 0 (0.0%) |
| Bachelor's Degree | 0 (0.0%) | 0 (0.0%) |
| Graduate Degree | 0 (0.0%) | 0 (0.0%) |
| Total | 16 (19.1%) | 68 (80.9%) |
Income in Chackbay
Income Overview in Chackbay
Per Capita Income in Chackbay is $32,785, while median incomes of families and households are $74,563 and $68,376 respectively.
| Characteristic | Number | Measure |
| Per Capita Income | 5,641 | $32,785 |
| Median Family Income | 1,668 | $74,563 |
| Mean Family Income | 1,668 | $93,570 |
| Median Household Income | 2,219 | $68,376 |
| Mean Household Income | 2,219 | $84,228 |
| Income Deficit | 1,668 | $9,537 |
| Wage / Income Gap (%) | 5,641 | 43.81% |
| Wage / Income Gap ($) | 5,641 | 56.19¢ per $1 |
| Gini / Inequality Index | 5,641 | 0.43 |
Earnings by Sex in Chackbay
Average Earnings in Chackbay are $46,548, $58,442 for men and $32,837 for women, a difference of 43.8%.
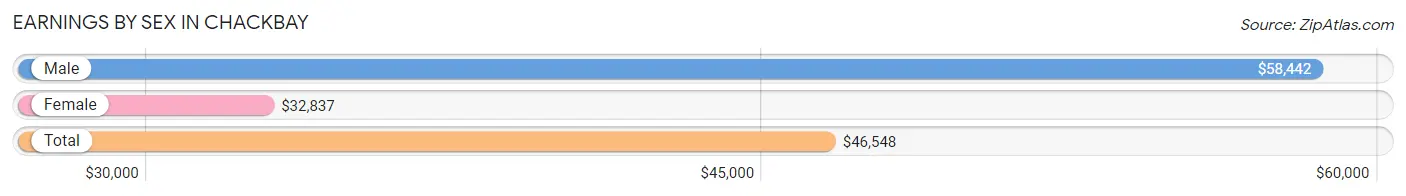
| Sex | Number | Average Earnings |
| Male | 1,483 (52.0%) | $58,442 |
| Female | 1,369 (48.0%) | $32,837 |
| Total | 2,852 (100.0%) | $46,548 |
Earnings by Sex by Income Bracket in Chackbay
The most common earnings brackets in Chackbay are $75,000 to $99,999 for men (309 | 20.8%) and $45,000 to $49,999 for women (175 | 12.8%).
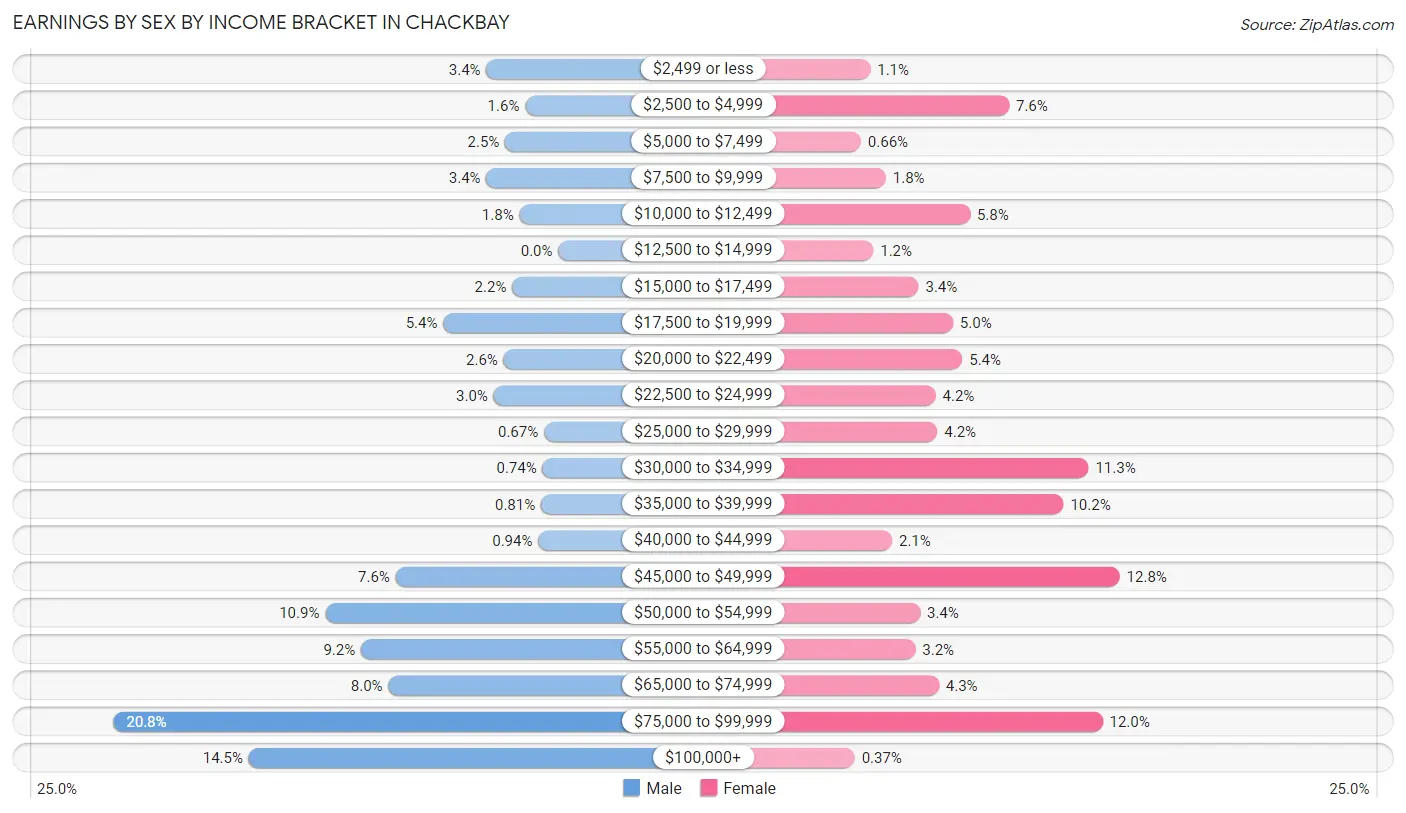
| Income | Male | Female |
| $2,499 or less | 50 (3.4%) | 15 (1.1%) |
| $2,500 to $4,999 | 23 (1.5%) | 104 (7.6%) |
| $5,000 to $7,499 | 37 (2.5%) | 9 (0.7%) |
| $7,500 to $9,999 | 50 (3.4%) | 25 (1.8%) |
| $10,000 to $12,499 | 27 (1.8%) | 79 (5.8%) |
| $12,500 to $14,999 | 0 (0.0%) | 17 (1.2%) |
| $15,000 to $17,499 | 32 (2.2%) | 46 (3.4%) |
| $17,500 to $19,999 | 80 (5.4%) | 68 (5.0%) |
| $20,000 to $22,499 | 38 (2.6%) | 74 (5.4%) |
| $22,500 to $24,999 | 45 (3.0%) | 57 (4.2%) |
| $25,000 to $29,999 | 10 (0.7%) | 58 (4.2%) |
| $30,000 to $34,999 | 11 (0.7%) | 155 (11.3%) |
| $35,000 to $39,999 | 12 (0.8%) | 139 (10.2%) |
| $40,000 to $44,999 | 14 (0.9%) | 29 (2.1%) |
| $45,000 to $49,999 | 113 (7.6%) | 175 (12.8%) |
| $50,000 to $54,999 | 162 (10.9%) | 47 (3.4%) |
| $55,000 to $64,999 | 137 (9.2%) | 44 (3.2%) |
| $65,000 to $74,999 | 118 (8.0%) | 59 (4.3%) |
| $75,000 to $99,999 | 309 (20.8%) | 164 (12.0%) |
| $100,000+ | 215 (14.5%) | 5 (0.4%) |
| Total | 1,483 (100.0%) | 1,369 (100.0%) |
Earnings by Sex by Educational Attainment in Chackbay
Average earnings in Chackbay are $70,919 for men and $36,394 for women, a difference of 48.7%. Men with an educational attainment of college or associate's degree enjoy the highest average annual earnings of $83,200, while those with high school diploma education earn the least with $54,646. Women with an educational attainment of bachelor's degree earn the most with the average annual earnings of $50,479, while those with high school diploma education have the smallest earnings of $30,556.
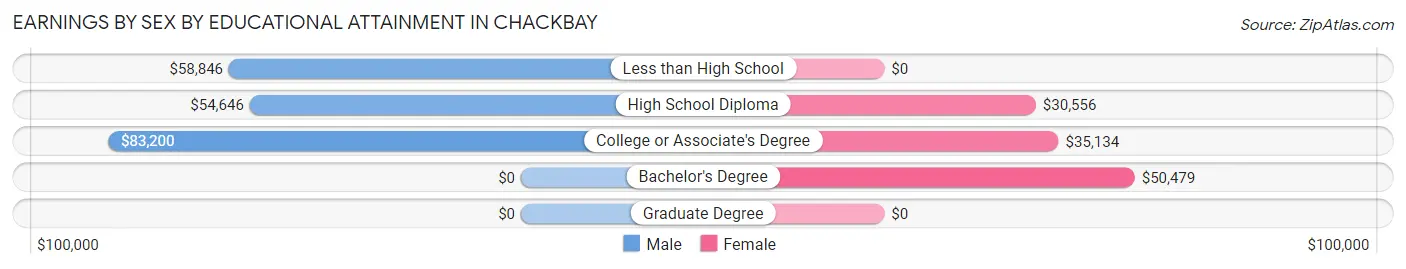
| Educational Attainment | Male Income | Female Income |
| Less than High School | $58,846 | $0 |
| High School Diploma | $54,646 | $30,556 |
| College or Associate's Degree | $83,200 | $35,134 |
| Bachelor's Degree | - | - |
| Graduate Degree | - | - |
| Total | $70,919 | $36,394 |
Family Income in Chackbay
Family Income Brackets in Chackbay
According to the Chackbay family income data, there are 382 families falling into the $100,000 to $149,999 income range, which is the most common income bracket and makes up 22.9% of all families. Conversely, the $10,000 to $14,999 income bracket is the least frequent group with only 42 families (2.5%) belonging to this category.
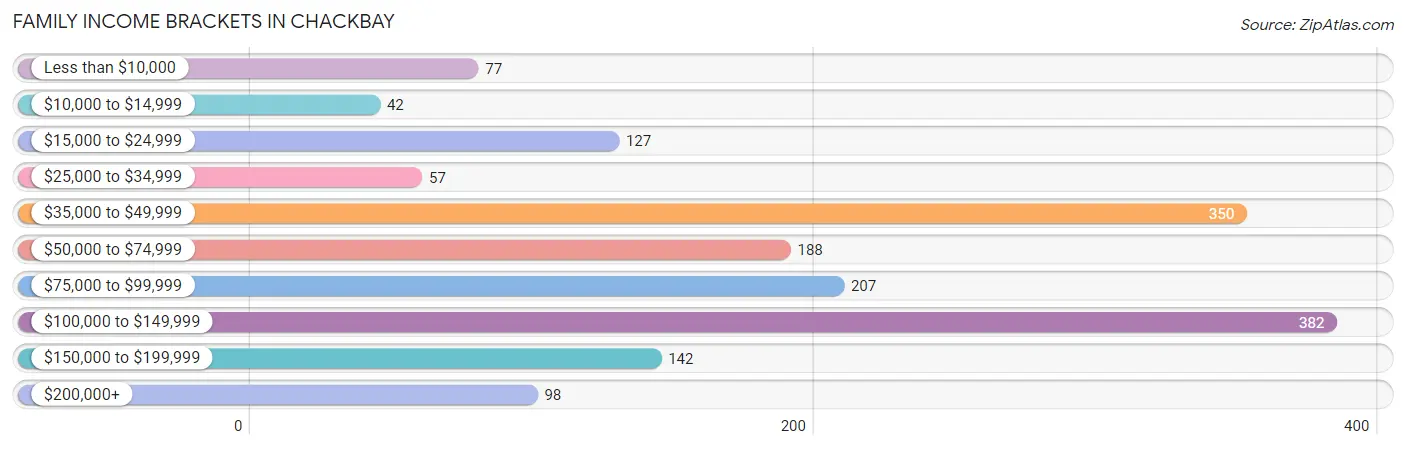
| Income Bracket | # Families | % Families |
| Less than $10,000 | 77 | 4.6% |
| $10,000 to $14,999 | 42 | 2.5% |
| $15,000 to $24,999 | 127 | 7.6% |
| $25,000 to $34,999 | 57 | 3.4% |
| $35,000 to $49,999 | 350 | 21.0% |
| $50,000 to $74,999 | 188 | 11.3% |
| $75,000 to $99,999 | 207 | 12.4% |
| $100,000 to $149,999 | 382 | 22.9% |
| $150,000 to $199,999 | 142 | 8.5% |
| $200,000+ | 98 | 5.9% |
Family Income by Famaliy Size in Chackbay
4-person families (218 | 13.1%) account for the highest median family income in Chackbay with $130,313 per family, while 4-person families (218 | 13.1%) have the highest median income of $32,578 per family member.
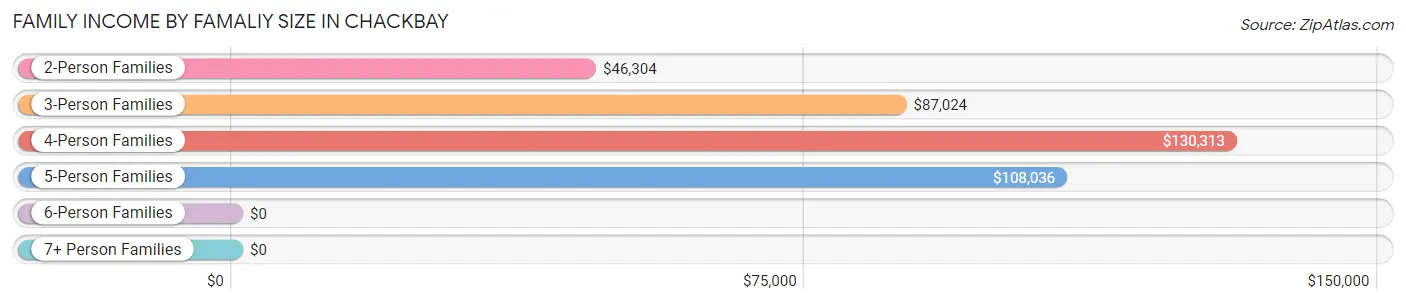
| Income Bracket | # Families | Median Income |
| 2-Person Families | 864 (51.8%) | $46,304 |
| 3-Person Families | 396 (23.7%) | $87,024 |
| 4-Person Families | 218 (13.1%) | $130,313 |
| 5-Person Families | 128 (7.7%) | $108,036 |
| 6-Person Families | 62 (3.7%) | $0 |
| 7+ Person Families | 0 (0.0%) | $0 |
| Total | 1,668 (100.0%) | $74,563 |
Family Income by Number of Earners in Chackbay
The median family income in Chackbay is $74,563, with families comprising 3+ earners (207) having the highest median family income of $146,206, while families with 1 earner (472) have the lowest median family income of $38,849, accounting for 12.4% and 28.3% of families, respectively.
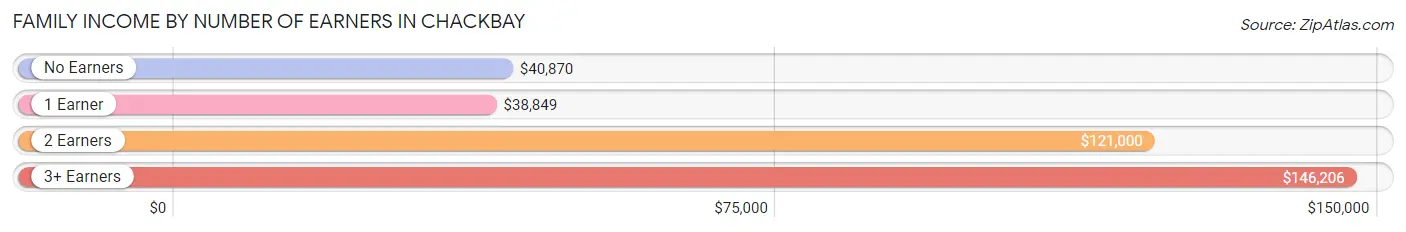
| Number of Earners | # Families | Median Income |
| No Earners | 327 (19.6%) | $40,870 |
| 1 Earner | 472 (28.3%) | $38,849 |
| 2 Earners | 662 (39.7%) | $121,000 |
| 3+ Earners | 207 (12.4%) | $146,206 |
| Total | 1,668 (100.0%) | $74,563 |
Household Income in Chackbay
Household Income Brackets in Chackbay
With 424 households falling in the category, the $35,000 to $49,999 income range is the most frequent in Chackbay, accounting for 19.1% of all households. In contrast, only 98 households (4.4%) fall into the $200,000+ income bracket, making it the least populous group.
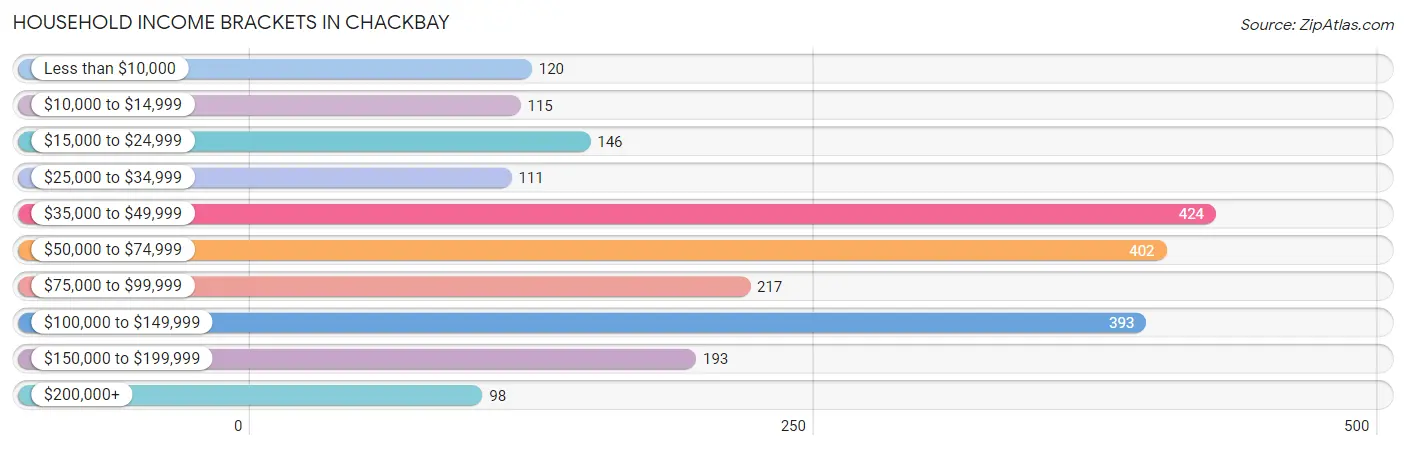
| Income Bracket | # Households | % Households |
| Less than $10,000 | 120 | 5.4% |
| $10,000 to $14,999 | 115 | 5.2% |
| $15,000 to $24,999 | 146 | 6.6% |
| $25,000 to $34,999 | 111 | 5.0% |
| $35,000 to $49,999 | 424 | 19.1% |
| $50,000 to $74,999 | 402 | 18.1% |
| $75,000 to $99,999 | 217 | 9.8% |
| $100,000 to $149,999 | 393 | 17.7% |
| $150,000 to $199,999 | 193 | 8.7% |
| $200,000+ | 98 | 4.4% |
Household Income by Householder Age in Chackbay
The median household income in Chackbay is $68,376, with the highest median household income of $107,902 found in the 25 to 44 years age bracket for the primary householder. A total of 579 households (26.1%) fall into this category. Meanwhile, the 15 to 24 years age bracket for the primary householder has the lowest median household income of $2,499, with 130 households (5.9%) in this group.
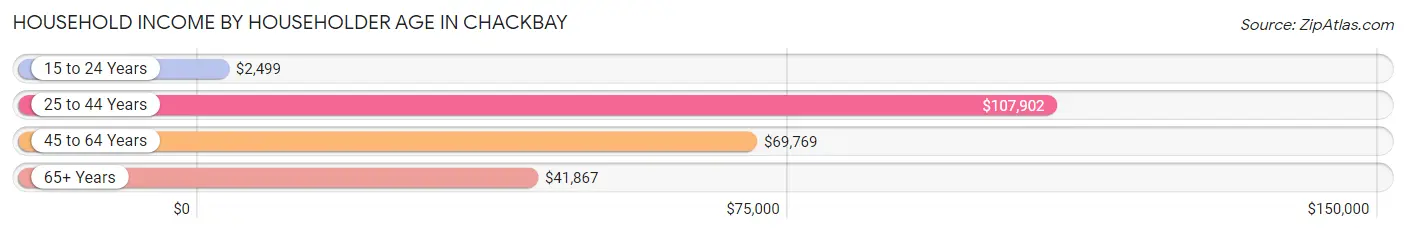
| Income Bracket | # Households | Median Income |
| 15 to 24 Years | 130 (5.9%) | $2,499 |
| 25 to 44 Years | 579 (26.1%) | $107,902 |
| 45 to 64 Years | 1,014 (45.7%) | $69,769 |
| 65+ Years | 496 (22.4%) | $41,867 |
| Total | 2,219 (100.0%) | $68,376 |
Poverty in Chackbay
Income Below Poverty by Sex and Age in Chackbay
With 8.3% poverty level for males and 23.3% for females among the residents of Chackbay, 5 year old males and 5 year old females are the most vulnerable to poverty, with 25 males (44.6%) and 41 females (100.0%) in their respective age groups living below the poverty level.
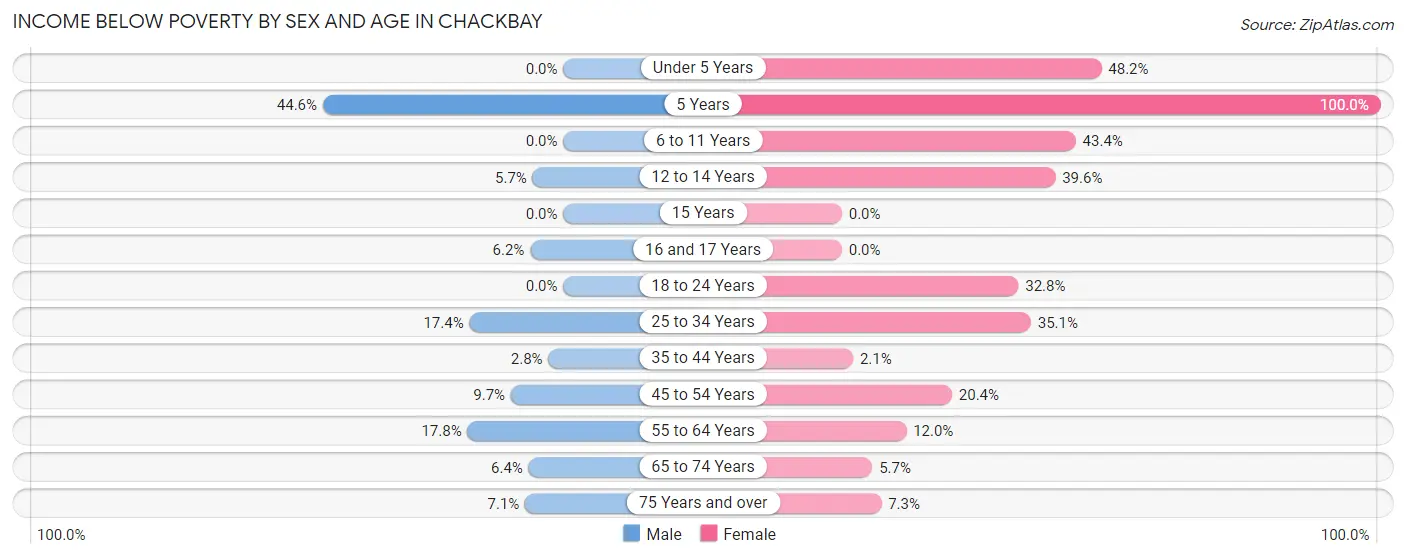
| Age Bracket | Male | Female |
| Under 5 Years | 0 (0.0%) | 106 (48.2%) |
| 5 Years | 25 (44.6%) | 41 (100.0%) |
| 6 to 11 Years | 0 (0.0%) | 79 (43.4%) |
| 12 to 14 Years | 7 (5.7%) | 63 (39.6%) |
| 15 Years | 0 (0.0%) | 0 (0.0%) |
| 16 and 17 Years | 8 (6.1%) | 0 (0.0%) |
| 18 to 24 Years | 0 (0.0%) | 95 (32.8%) |
| 25 to 34 Years | 23 (17.4%) | 87 (35.1%) |
| 35 to 44 Years | 11 (2.8%) | 7 (2.1%) |
| 45 to 54 Years | 47 (9.7%) | 94 (20.4%) |
| 55 to 64 Years | 82 (17.8%) | 54 (11.9%) |
| 65 to 74 Years | 17 (6.4%) | 13 (5.7%) |
| 75 Years and over | 9 (7.1%) | 9 (7.3%) |
| Total | 229 (8.3%) | 648 (23.3%) |
Income Above Poverty by Sex and Age in Chackbay
According to the poverty statistics in Chackbay, males aged under 5 years and females aged 16 and 17 years are the age groups that are most secure financially, with 100.0% of males and 100.0% of females in these age groups living above the poverty line.
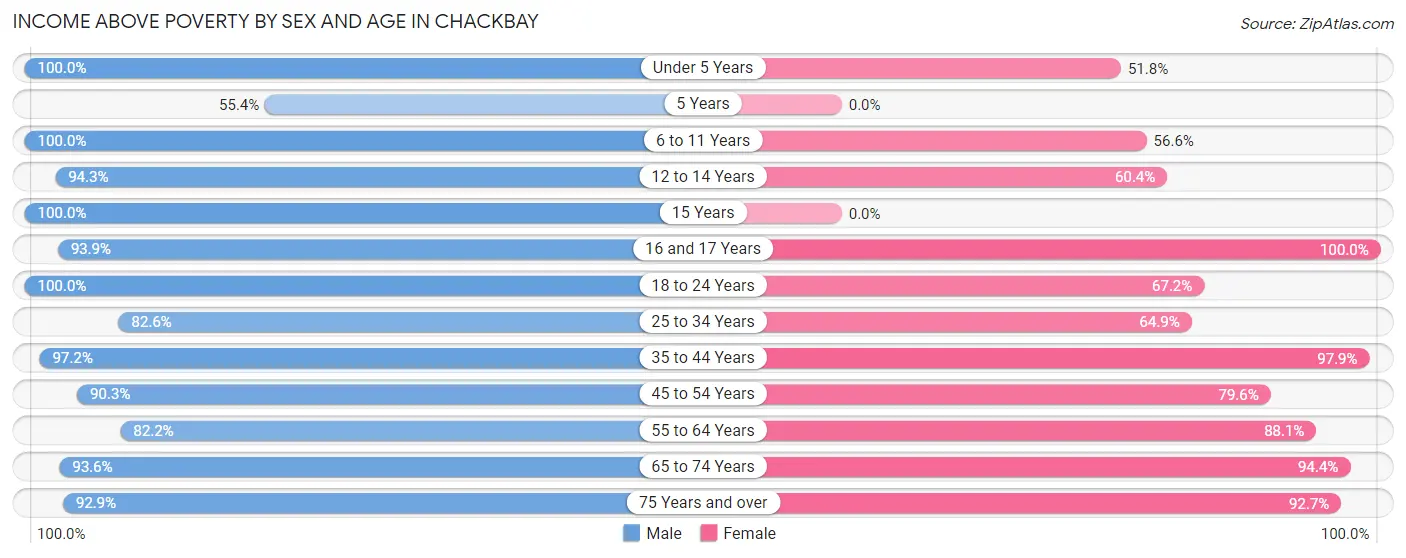
| Age Bracket | Male | Female |
| Under 5 Years | 62 (100.0%) | 114 (51.8%) |
| 5 Years | 31 (55.4%) | 0 (0.0%) |
| 6 to 11 Years | 176 (100.0%) | 103 (56.6%) |
| 12 to 14 Years | 116 (94.3%) | 96 (60.4%) |
| 15 Years | 88 (100.0%) | 0 (0.0%) |
| 16 and 17 Years | 122 (93.9%) | 40 (100.0%) |
| 18 to 24 Years | 274 (100.0%) | 195 (67.2%) |
| 25 to 34 Years | 109 (82.6%) | 161 (64.9%) |
| 35 to 44 Years | 386 (97.2%) | 329 (97.9%) |
| 45 to 54 Years | 436 (90.3%) | 366 (79.6%) |
| 55 to 64 Years | 379 (82.2%) | 398 (88.0%) |
| 65 to 74 Years | 247 (93.6%) | 217 (94.4%) |
| 75 Years and over | 118 (92.9%) | 114 (92.7%) |
| Total | 2,544 (91.7%) | 2,133 (76.7%) |
Income Below Poverty Among Married-Couple Families in Chackbay
The poverty statistics for married-couple families in Chackbay show that 4.8% or 64 of the total 1,336 families live below the poverty line. Families with 3 or 4 children have the highest poverty rate of 14.7%, comprising of 23 families. On the other hand, families with no children have the lowest poverty rate of 3.1%, which includes 28 families.
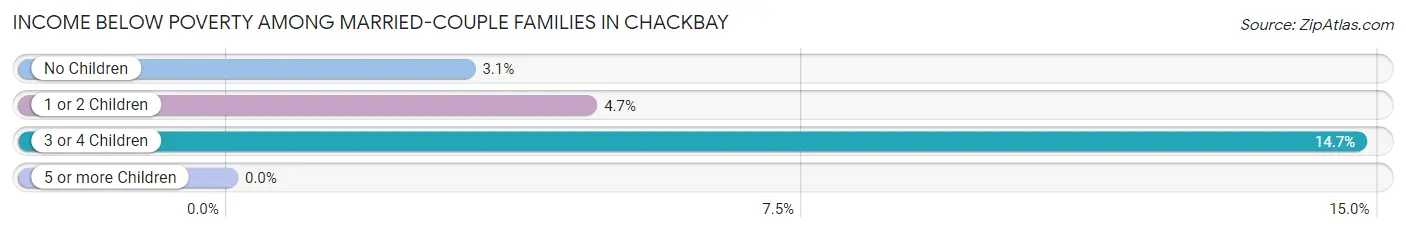
| Children | Above Poverty | Below Poverty |
| No Children | 875 (96.9%) | 28 (3.1%) |
| 1 or 2 Children | 264 (95.3%) | 13 (4.7%) |
| 3 or 4 Children | 133 (85.3%) | 23 (14.7%) |
| 5 or more Children | 0 (0.0%) | 0 (0.0%) |
| Total | 1,272 (95.2%) | 64 (4.8%) |
Income Below Poverty Among Single-Parent Households in Chackbay
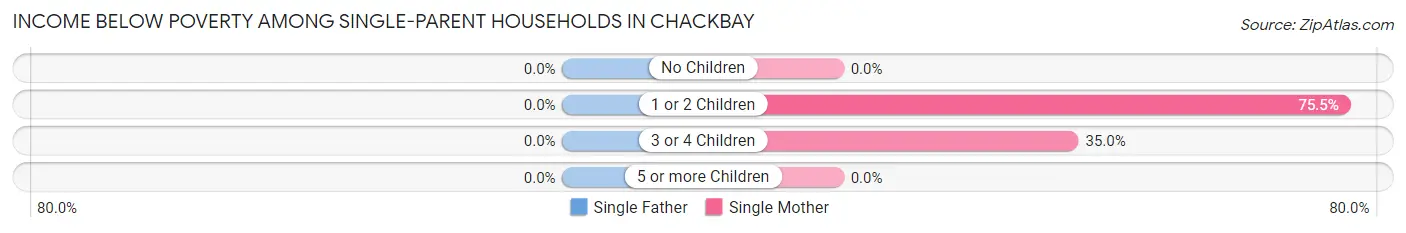
| Children | Single Father | Single Mother |
| No Children | 0 (0.0%) | 0 (0.0%) |
| 1 or 2 Children | 0 (0.0%) | 182 (75.5%) |
| 3 or 4 Children | 0 (0.0%) | 7 (35.0%) |
| 5 or more Children | 0 (0.0%) | 0 (0.0%) |
| Total | 0 (0.0%) | 189 (64.7%) |
Income Below Poverty Among Married-Couple vs Single-Parent Households in Chackbay
The poverty data for Chackbay shows that 64 of the married-couple family households (4.8%) and 189 of the single-parent households (56.9%) are living below the poverty level. Within the married-couple family households, those with 3 or 4 children have the highest poverty rate, with 23 households (14.7%) falling below the poverty line. Among the single-parent households, those with 1 or 2 children have the highest poverty rate, with 182 household (75.5%) living below poverty.
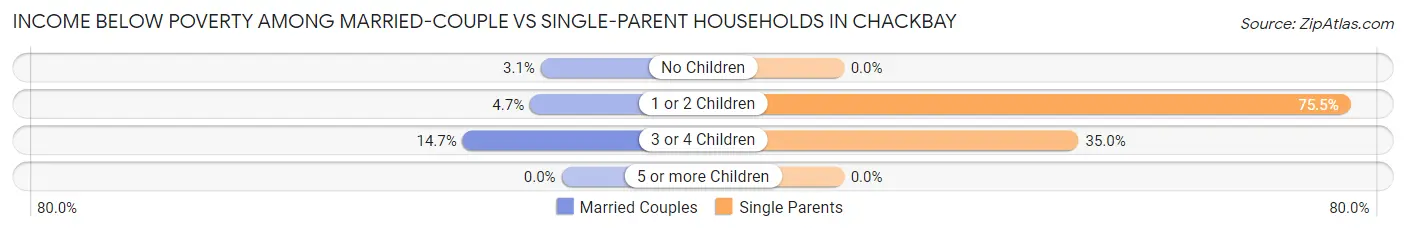
| Children | Married-Couple Families | Single-Parent Households |
| No Children | 28 (3.1%) | 0 (0.0%) |
| 1 or 2 Children | 13 (4.7%) | 182 (75.5%) |
| 3 or 4 Children | 23 (14.7%) | 7 (35.0%) |
| 5 or more Children | 0 (0.0%) | 0 (0.0%) |
| Total | 64 (4.8%) | 189 (56.9%) |
Employment Characteristics in Chackbay
Employment by Class of Employer in Chackbay
Among the 2,759 employed individuals in Chackbay, private company employees (1,696 | 61.5%), local government employees (390 | 14.1%), and not-for-profit organizations (262 | 9.5%) make up the most common classes of employment.
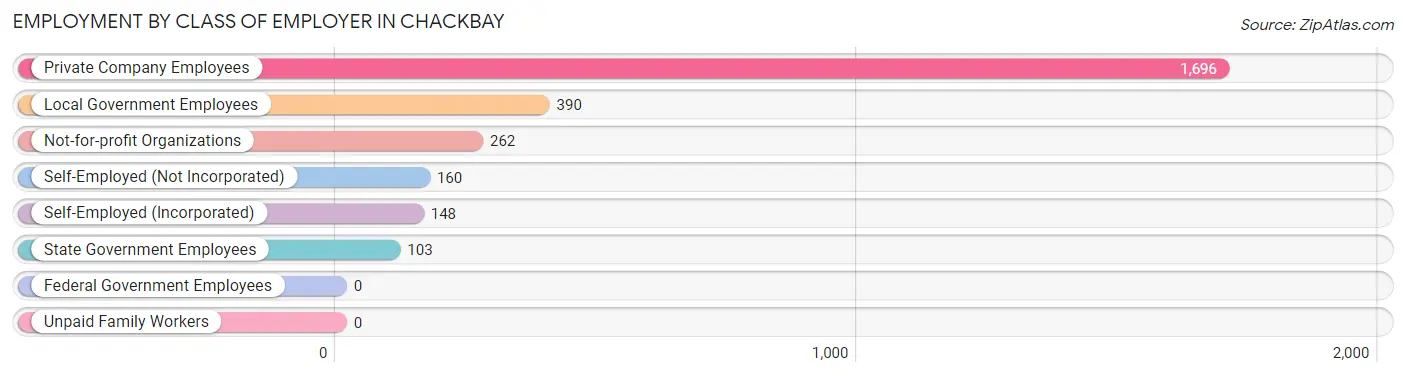
| Employer Class | # Employees | % Employees |
| Private Company Employees | 1,696 | 61.5% |
| Self-Employed (Incorporated) | 148 | 5.4% |
| Self-Employed (Not Incorporated) | 160 | 5.8% |
| Not-for-profit Organizations | 262 | 9.5% |
| Local Government Employees | 390 | 14.1% |
| State Government Employees | 103 | 3.7% |
| Federal Government Employees | 0 | 0.0% |
| Unpaid Family Workers | 0 | 0.0% |
| Total | 2,759 | 100.0% |
Employment Status by Age in Chackbay
According to the labor force statistics for Chackbay, out of the total population over 16 years of age (4,447), 66.9% or 2,975 individuals are in the labor force, with 6.9% or 205 of them unemployed. The age group with the highest labor force participation rate is 20 to 24 years, with 100.0% or 356 individuals in the labor force. Within the labor force, the 20 to 24 years age range has the highest percentage of unemployed individuals, with 31.5% or 112 of them being unemployed.
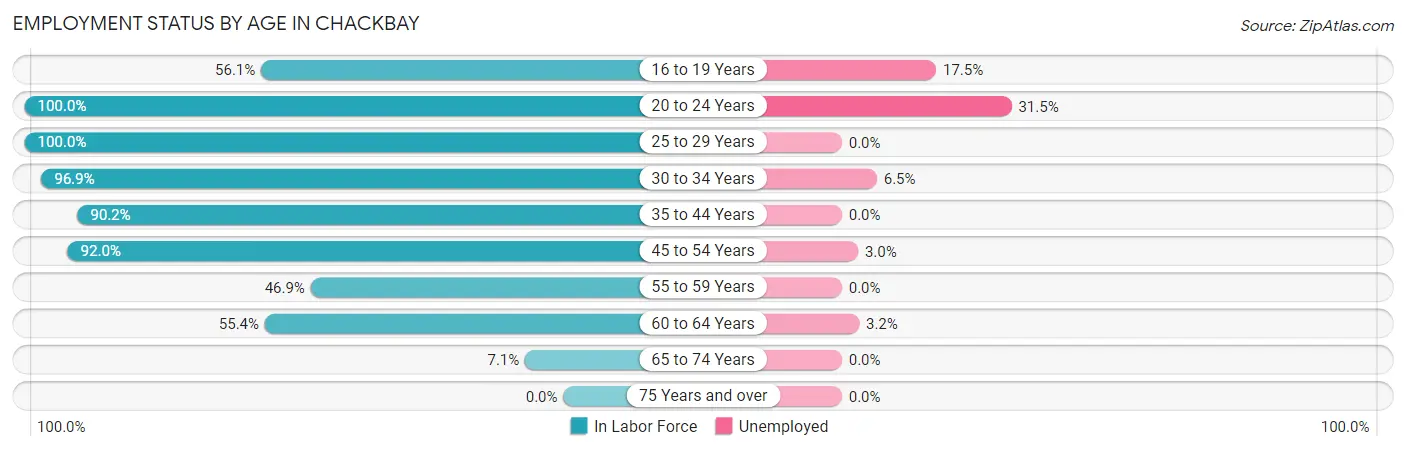
| Age Bracket | In Labor Force | Unemployed |
| 16 to 19 Years | 212 (56.1%) | 37 (17.5%) |
| 20 to 24 Years | 356 (100.0%) | 112 (31.5%) |
| 25 to 29 Years | 62 (100.0%) | 0 (0.0%) |
| 30 to 34 Years | 308 (96.9%) | 20 (6.5%) |
| 35 to 44 Years | 661 (90.2%) | 0 (0.0%) |
| 45 to 54 Years | 868 (92.0%) | 26 (3.0%) |
| 55 to 59 Years | 187 (46.9%) | 0 (0.0%) |
| 60 to 64 Years | 285 (55.4%) | 9 (3.2%) |
| 65 to 74 Years | 35 (7.1%) | 0 (0.0%) |
| 75 Years and over | 0 (0.0%) | 0 (0.0%) |
| Total | 2,975 (66.9%) | 205 (6.9%) |
Employment Status by Educational Attainment in Chackbay
According to labor force statistics for Chackbay, 79.9% of individuals (2,372) out of the total population between 25 and 64 years of age (2,969) are in the labor force, with 2.3% or 55 of them being unemployed. The group with the highest labor force participation rate are those with the educational attainment of bachelor's degree or higher, with 95.0% or 667 individuals in the labor force. Within the labor force, individuals with less than high school education have the highest percentage of unemployment, with 16.1% or 29 of them being unemployed.
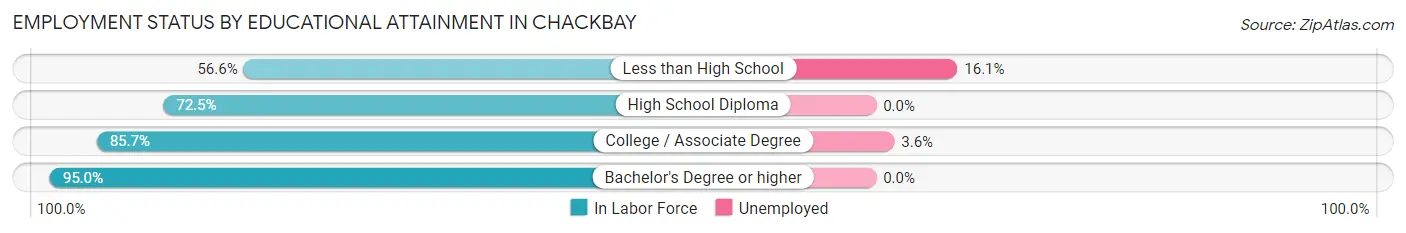
| Educational Attainment | In Labor Force | Unemployed |
| Less than High School | 180 (56.6%) | 51 (16.1%) |
| High School Diploma | 805 (72.5%) | 0 (0.0%) |
| College / Associate Degree | 718 (85.7%) | 30 (3.6%) |
| Bachelor's Degree or higher | 667 (95.0%) | 0 (0.0%) |
| Total | 2,372 (79.9%) | 68 (2.3%) |
Employment Occupations by Sex in Chackbay
Management, Business, Science and Arts Occupations
The most common Management, Business, Science and Arts occupations in Chackbay are Health Diagnosing & Treating (309 | 11.2%), Health Technologists (285 | 10.3%), Management (250 | 9.0%), Community & Social Service (213 | 7.7%), and Education Instruction & Library (170 | 6.1%).
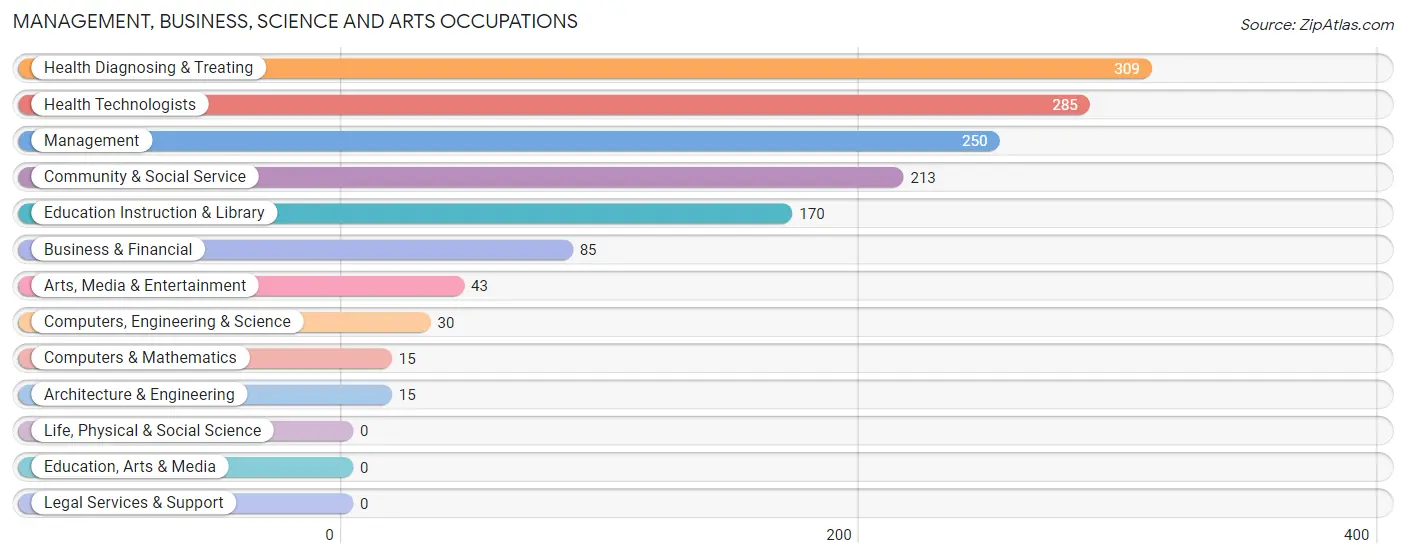
Management, Business, Science and Arts Occupations by Sex
Within the Management, Business, Science and Arts occupations in Chackbay, the most male-oriented occupations are Architecture & Engineering (100.0%), Business & Financial (71.8%), and Computers, Engineering & Science (50.0%), while the most female-oriented occupations are Computers & Mathematics (100.0%), Arts, Media & Entertainment (100.0%), and Health Technologists (81.0%).
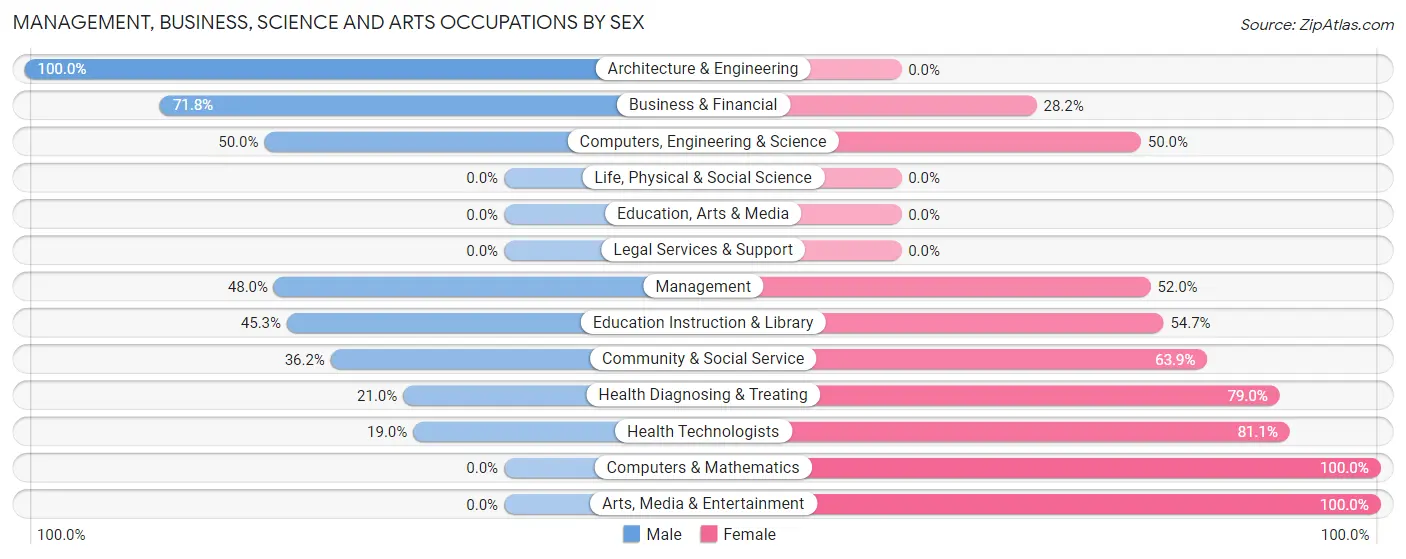
| Occupation | Male | Female |
| Management | 120 (48.0%) | 130 (52.0%) |
| Business & Financial | 61 (71.8%) | 24 (28.2%) |
| Computers, Engineering & Science | 15 (50.0%) | 15 (50.0%) |
| Computers & Mathematics | 0 (0.0%) | 15 (100.0%) |
| Architecture & Engineering | 15 (100.0%) | 0 (0.0%) |
| Life, Physical & Social Science | 0 (0.0%) | 0 (0.0%) |
| Community & Social Service | 77 (36.1%) | 136 (63.8%) |
| Education, Arts & Media | 0 (0.0%) | 0 (0.0%) |
| Legal Services & Support | 0 (0.0%) | 0 (0.0%) |
| Education Instruction & Library | 77 (45.3%) | 93 (54.7%) |
| Arts, Media & Entertainment | 0 (0.0%) | 43 (100.0%) |
| Health Diagnosing & Treating | 65 (21.0%) | 244 (79.0%) |
| Health Technologists | 54 (19.0%) | 231 (81.0%) |
| Total (Category) | 338 (38.1%) | 549 (61.9%) |
| Total (Overall) | 1,474 (53.2%) | 1,296 (46.8%) |
Services Occupations
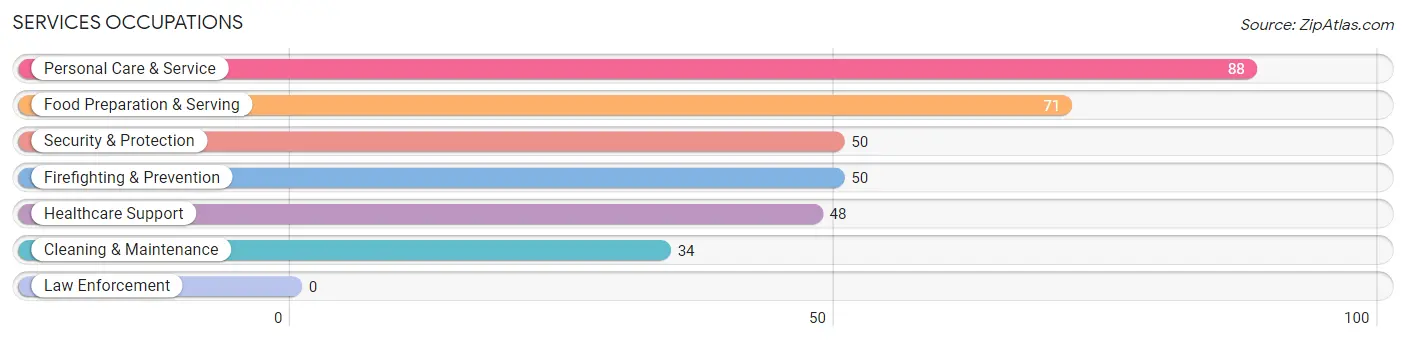
The most common Services occupations in Chackbay are Personal Care & Service (88 | 3.2%), Food Preparation & Serving (71 | 2.6%), Security & Protection (50 | 1.8%), Firefighting & Prevention (50 | 1.8%), and Healthcare Support (48 | 1.7%).
Services Occupations by Sex
Within the Services occupations in Chackbay, the most male-oriented occupations are Security & Protection (100.0%), Firefighting & Prevention (100.0%), and Cleaning & Maintenance (100.0%), while the most female-oriented occupations are Healthcare Support (100.0%), Personal Care & Service (94.3%), and Food Preparation & Serving (23.9%).
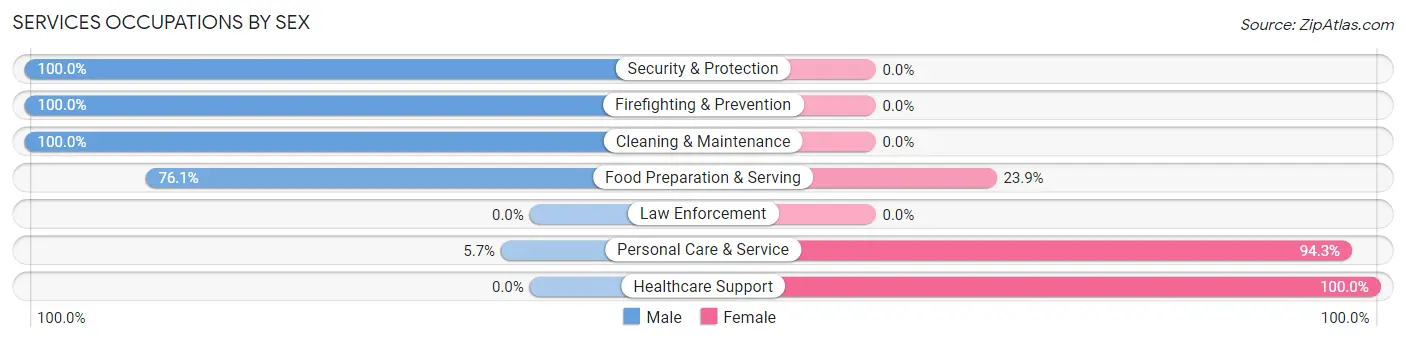
| Occupation | Male | Female |
| Healthcare Support | 0 (0.0%) | 48 (100.0%) |
| Security & Protection | 50 (100.0%) | 0 (0.0%) |
| Firefighting & Prevention | 50 (100.0%) | 0 (0.0%) |
| Law Enforcement | 0 (0.0%) | 0 (0.0%) |
| Food Preparation & Serving | 54 (76.1%) | 17 (23.9%) |
| Cleaning & Maintenance | 34 (100.0%) | 0 (0.0%) |
| Personal Care & Service | 5 (5.7%) | 83 (94.3%) |
| Total (Category) | 143 (49.1%) | 148 (50.9%) |
| Total (Overall) | 1,474 (53.2%) | 1,296 (46.8%) |
Sales and Office Occupations
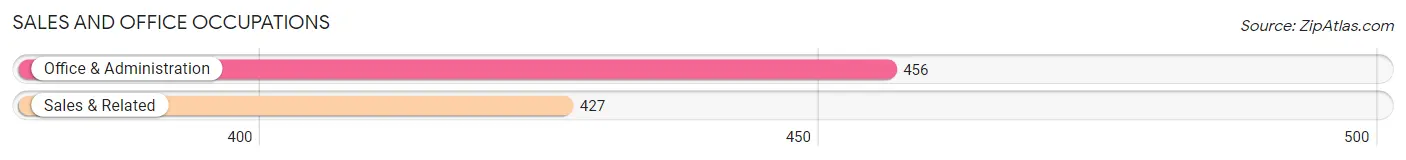
The most common Sales and Office occupations in Chackbay are Office & Administration (456 | 16.5%), and Sales & Related (427 | 15.4%).
Sales and Office Occupations by Sex
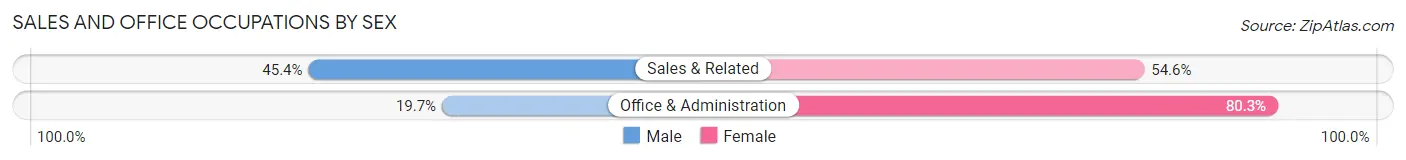
| Occupation | Male | Female |
| Sales & Related | 194 (45.4%) | 233 (54.6%) |
| Office & Administration | 90 (19.7%) | 366 (80.3%) |
| Total (Category) | 284 (32.2%) | 599 (67.8%) |
| Total (Overall) | 1,474 (53.2%) | 1,296 (46.8%) |
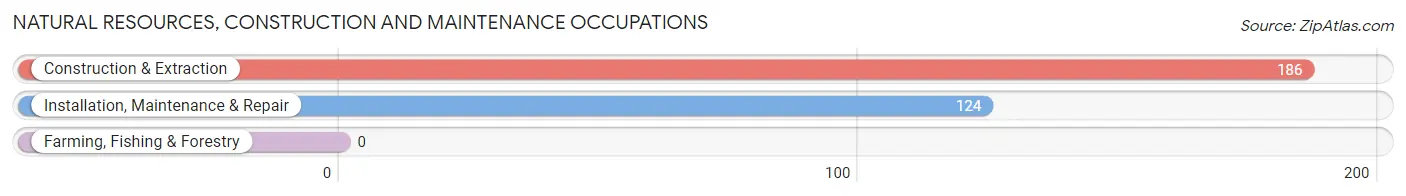
Natural Resources, Construction and Maintenance Occupations
The most common Natural Resources, Construction and Maintenance occupations in Chackbay are Construction & Extraction (186 | 6.7%), and Installation, Maintenance & Repair (124 | 4.5%).
Natural Resources, Construction and Maintenance Occupations by Sex
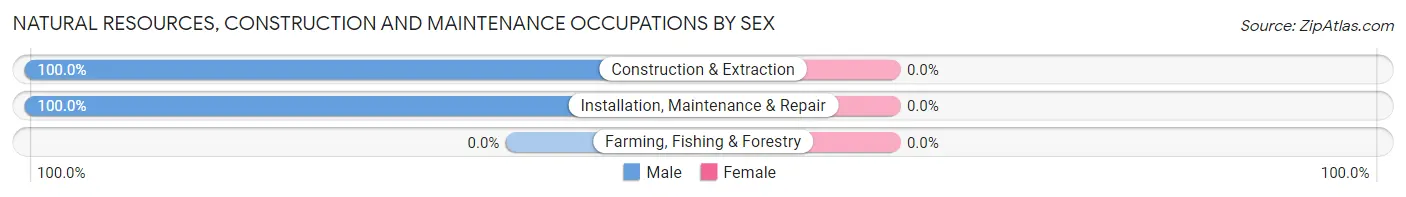
| Occupation | Male | Female |
| Farming, Fishing & Forestry | 0 (0.0%) | 0 (0.0%) |
| Construction & Extraction | 186 (100.0%) | 0 (0.0%) |
| Installation, Maintenance & Repair | 124 (100.0%) | 0 (0.0%) |
| Total (Category) | 310 (100.0%) | 0 (0.0%) |
| Total (Overall) | 1,474 (53.2%) | 1,296 (46.8%) |
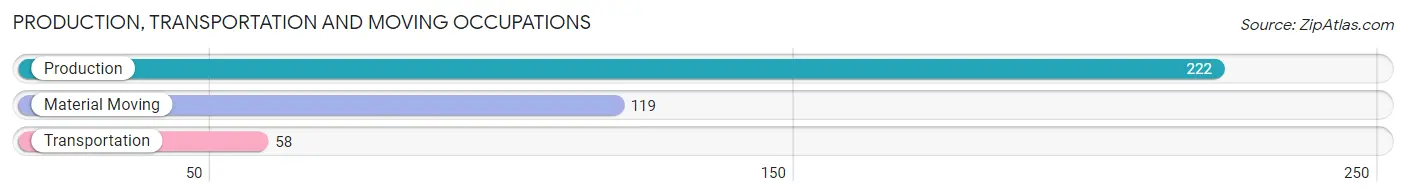
Production, Transportation and Moving Occupations
The most common Production, Transportation and Moving occupations in Chackbay are Production (222 | 8.0%), Material Moving (119 | 4.3%), and Transportation (58 | 2.1%).
Production, Transportation and Moving Occupations by Sex
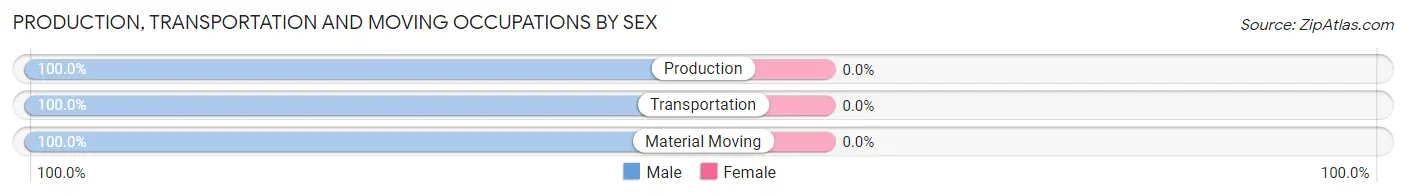
| Occupation | Male | Female |
| Production | 222 (100.0%) | 0 (0.0%) |
| Transportation | 58 (100.0%) | 0 (0.0%) |
| Material Moving | 119 (100.0%) | 0 (0.0%) |
| Total (Category) | 399 (100.0%) | 0 (0.0%) |
| Total (Overall) | 1,474 (53.2%) | 1,296 (46.8%) |
Employment Industries by Sex in Chackbay
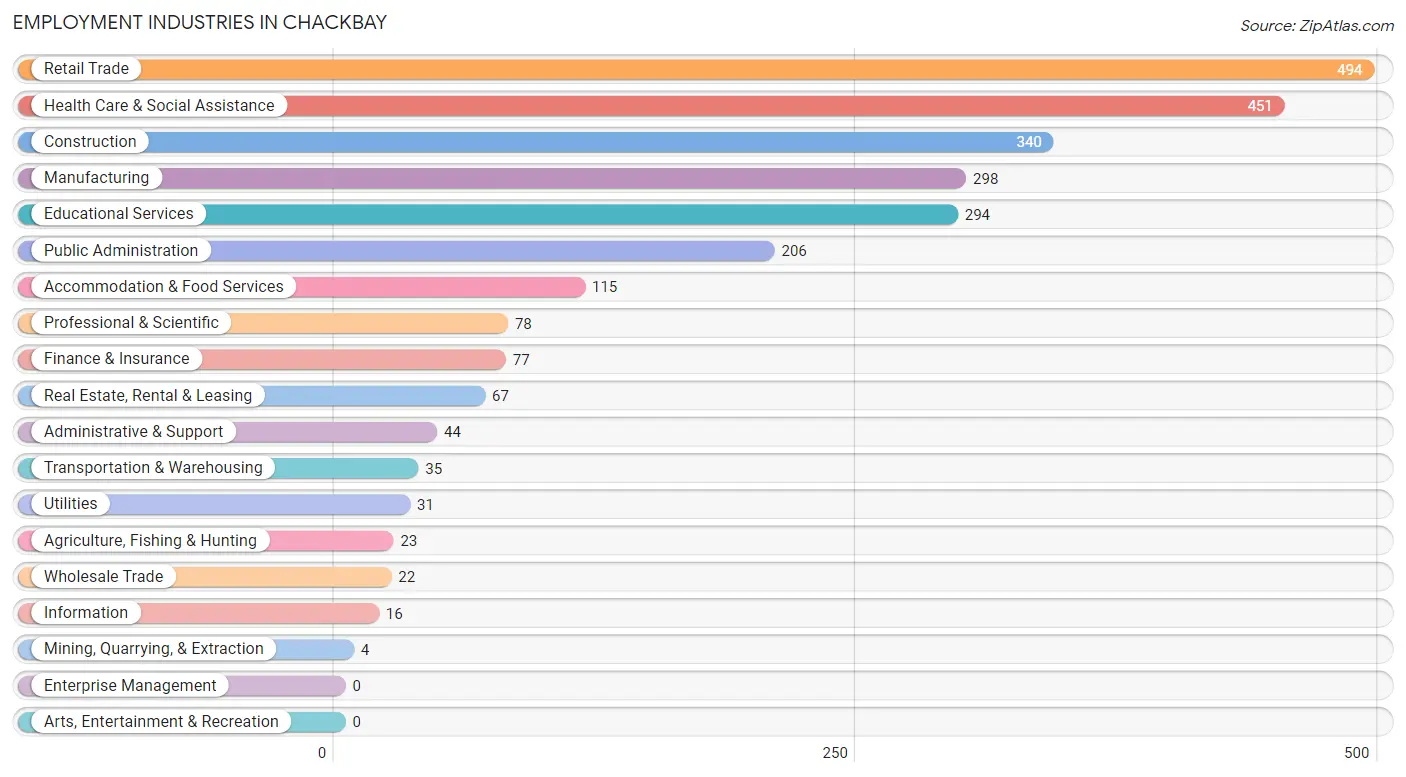
Employment Industries in Chackbay
The major employment industries in Chackbay include Retail Trade (494 | 17.8%), Health Care & Social Assistance (451 | 16.3%), Construction (340 | 12.3%), Manufacturing (298 | 10.8%), and Educational Services (294 | 10.6%).
Employment Industries by Sex in Chackbay
The Chackbay industries that see more men than women are Agriculture, Fishing & Hunting (100.0%), Mining, Quarrying, & Extraction (100.0%), and Transportation & Warehousing (100.0%), whereas the industries that tend to have a higher number of women are Wholesale Trade (100.0%), Professional & Scientific (100.0%), and Health Care & Social Assistance (76.9%).
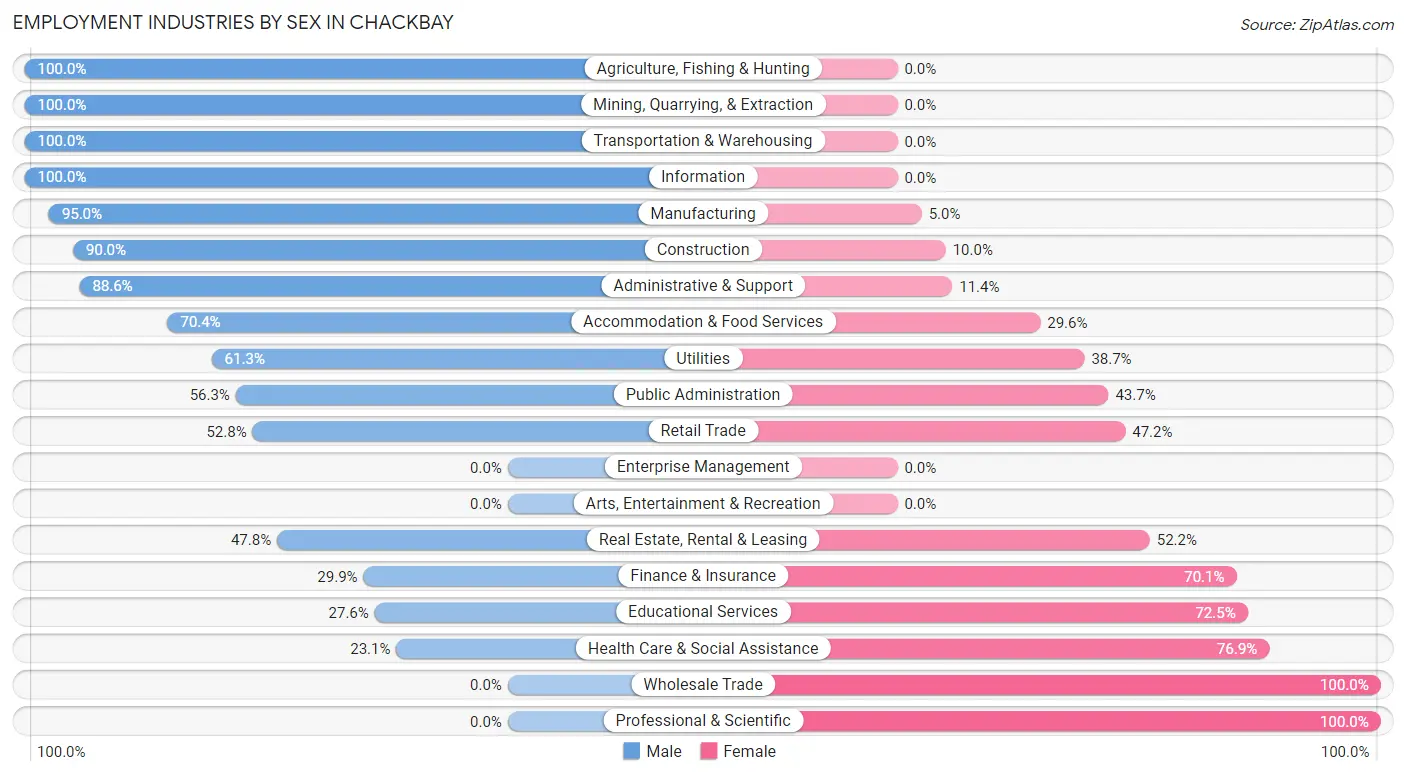
| Industry | Male | Female |
| Agriculture, Fishing & Hunting | 23 (100.0%) | 0 (0.0%) |
| Mining, Quarrying, & Extraction | 4 (100.0%) | 0 (0.0%) |
| Construction | 306 (90.0%) | 34 (10.0%) |
| Manufacturing | 283 (95.0%) | 15 (5.0%) |
| Wholesale Trade | 0 (0.0%) | 22 (100.0%) |
| Retail Trade | 261 (52.8%) | 233 (47.2%) |
| Transportation & Warehousing | 35 (100.0%) | 0 (0.0%) |
| Utilities | 19 (61.3%) | 12 (38.7%) |
| Information | 16 (100.0%) | 0 (0.0%) |
| Finance & Insurance | 23 (29.9%) | 54 (70.1%) |
| Real Estate, Rental & Leasing | 32 (47.8%) | 35 (52.2%) |
| Professional & Scientific | 0 (0.0%) | 78 (100.0%) |
| Enterprise Management | 0 (0.0%) | 0 (0.0%) |
| Administrative & Support | 39 (88.6%) | 5 (11.4%) |
| Educational Services | 81 (27.6%) | 213 (72.5%) |
| Health Care & Social Assistance | 104 (23.1%) | 347 (76.9%) |
| Arts, Entertainment & Recreation | 0 (0.0%) | 0 (0.0%) |
| Accommodation & Food Services | 81 (70.4%) | 34 (29.6%) |
| Public Administration | 116 (56.3%) | 90 (43.7%) |
| Total | 1,474 (53.2%) | 1,296 (46.8%) |
Education in Chackbay
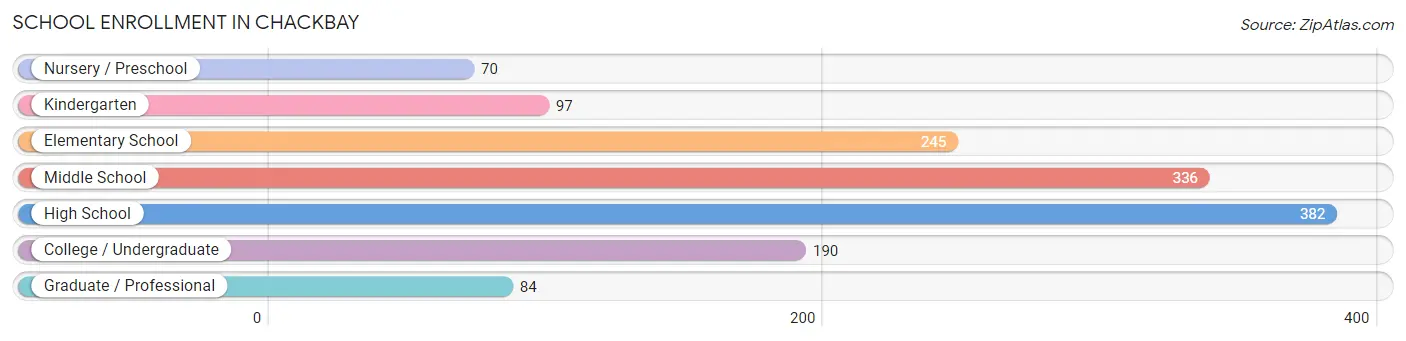
School Enrollment in Chackbay
The most common levels of schooling among the 1,404 students in Chackbay are high school (382 | 27.2%), middle school (336 | 23.9%), and elementary school (245 | 17.4%).
| School Level | # Students | % Students |
| Nursery / Preschool | 70 | 5.0% |
| Kindergarten | 97 | 6.9% |
| Elementary School | 245 | 17.4% |
| Middle School | 336 | 23.9% |
| High School | 382 | 27.2% |
| College / Undergraduate | 190 | 13.5% |
| Graduate / Professional | 84 | 6.0% |
| Total | 1,404 | 100.0% |
School Enrollment by Age by Funding Source in Chackbay
Out of a total of 1,404 students who are enrolled in schools in Chackbay, 112 (8.0%) attend a private institution, while the remaining 1,292 (92.0%) are enrolled in public schools. The age group of 3 to 4 year olds has the highest likelihood of being enrolled in private schools, with 19 (27.1% in the age bracket) enrolled. Conversely, the age group of 20 to 24 year olds has the lowest likelihood of being enrolled in a private school, with 132 (100.0% in the age bracket) attending a public institution.
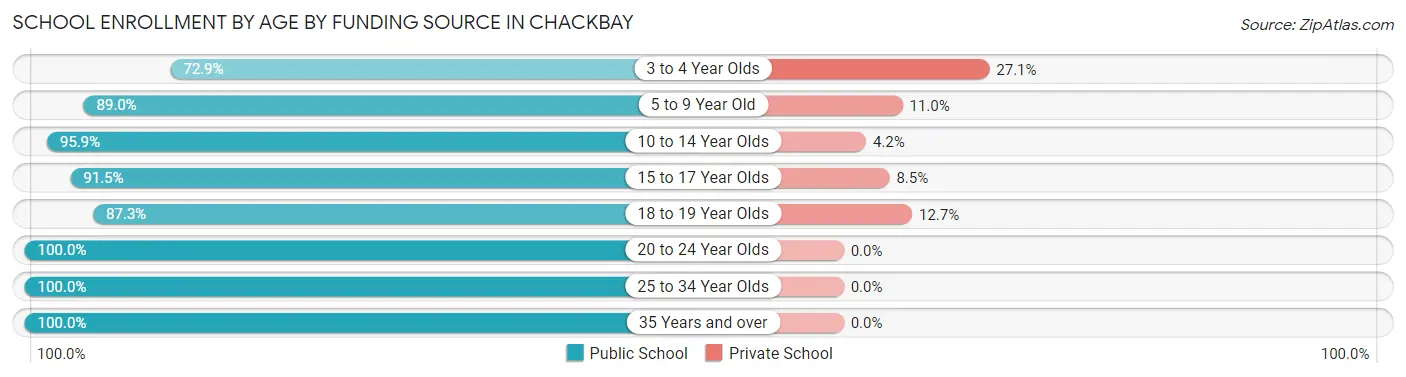
| Age Bracket | Public School | Private School |
| 3 to 4 Year Olds | 51 (72.9%) | 19 (27.1%) |
| 5 to 9 Year Old | 284 (89.0%) | 35 (11.0%) |
| 10 to 14 Year Olds | 393 (95.9%) | 17 (4.2%) |
| 15 to 17 Year Olds | 236 (91.5%) | 22 (8.5%) |
| 18 to 19 Year Olds | 137 (87.3%) | 20 (12.7%) |
| 20 to 24 Year Olds | 132 (100.0%) | 0 (0.0%) |
| 25 to 34 Year Olds | 28 (100.0%) | 0 (0.0%) |
| 35 Years and over | 30 (100.0%) | 0 (0.0%) |
| Total | 1,292 (92.0%) | 112 (8.0%) |
Educational Attainment by Field of Study in Chackbay
Science & technology (244 | 30.0%), education (190 | 23.3%), business (98 | 12.0%), engineering (73 | 9.0%), and arts & humanities (71 | 8.7%) are the most common fields of study among 814 individuals in Chackbay who have obtained a bachelor's degree or higher.
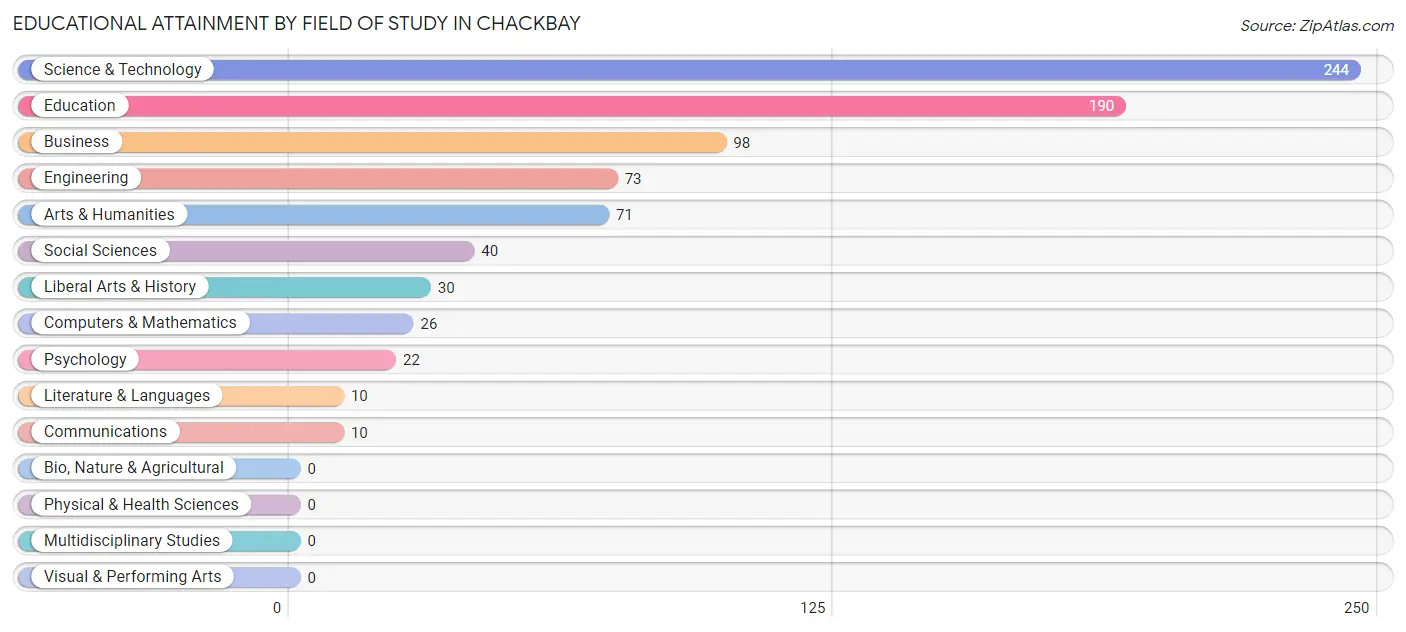
| Field of Study | # Graduates | % Graduates |
| Computers & Mathematics | 26 | 3.2% |
| Bio, Nature & Agricultural | 0 | 0.0% |
| Physical & Health Sciences | 0 | 0.0% |
| Psychology | 22 | 2.7% |
| Social Sciences | 40 | 4.9% |
| Engineering | 73 | 9.0% |
| Multidisciplinary Studies | 0 | 0.0% |
| Science & Technology | 244 | 30.0% |
| Business | 98 | 12.0% |
| Education | 190 | 23.3% |
| Literature & Languages | 10 | 1.2% |
| Liberal Arts & History | 30 | 3.7% |
| Visual & Performing Arts | 0 | 0.0% |
| Communications | 10 | 1.2% |
| Arts & Humanities | 71 | 8.7% |
| Total | 814 | 100.0% |
Transportation & Commute in Chackbay
Vehicle Availability by Sex in Chackbay
The most prevalent vehicle ownership categories in Chackbay are males with 3 vehicles (522, accounting for 35.5%) and females with 3 vehicles (584, making up 40.6%).
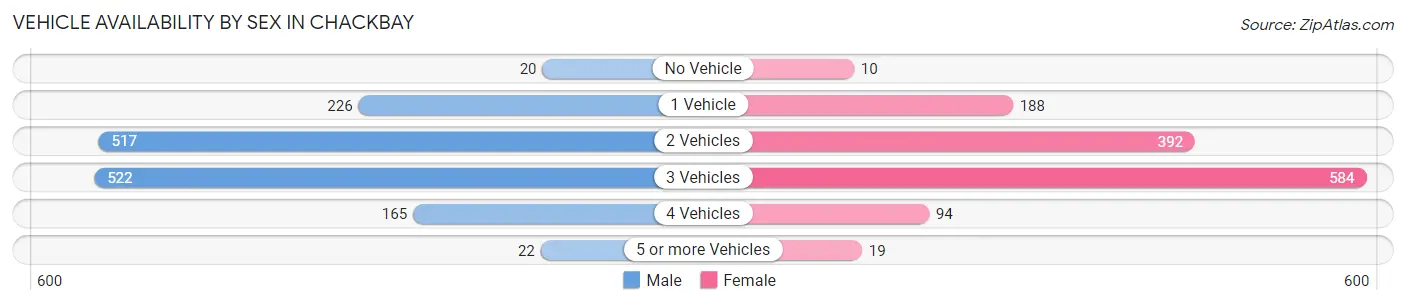
| Vehicles Available | Male | Female |
| No Vehicle | 20 (1.4%) | 10 (0.8%) |
| 1 Vehicle | 226 (15.3%) | 188 (14.6%) |
| 2 Vehicles | 517 (35.1%) | 392 (30.5%) |
| 3 Vehicles | 522 (35.5%) | 584 (45.4%) |
| 4 Vehicles | 165 (11.2%) | 94 (7.3%) |
| 5 or more Vehicles | 22 (1.5%) | 19 (1.5%) |
| Total | 1,472 (100.0%) | 1,287 (100.0%) |
Commute Time in Chackbay
The most frequently occuring commute durations in Chackbay are 15 to 19 minutes (511 commuters, 19.3%), 10 to 14 minutes (490 commuters, 18.5%), and 60 to 89 minutes (300 commuters, 11.3%).
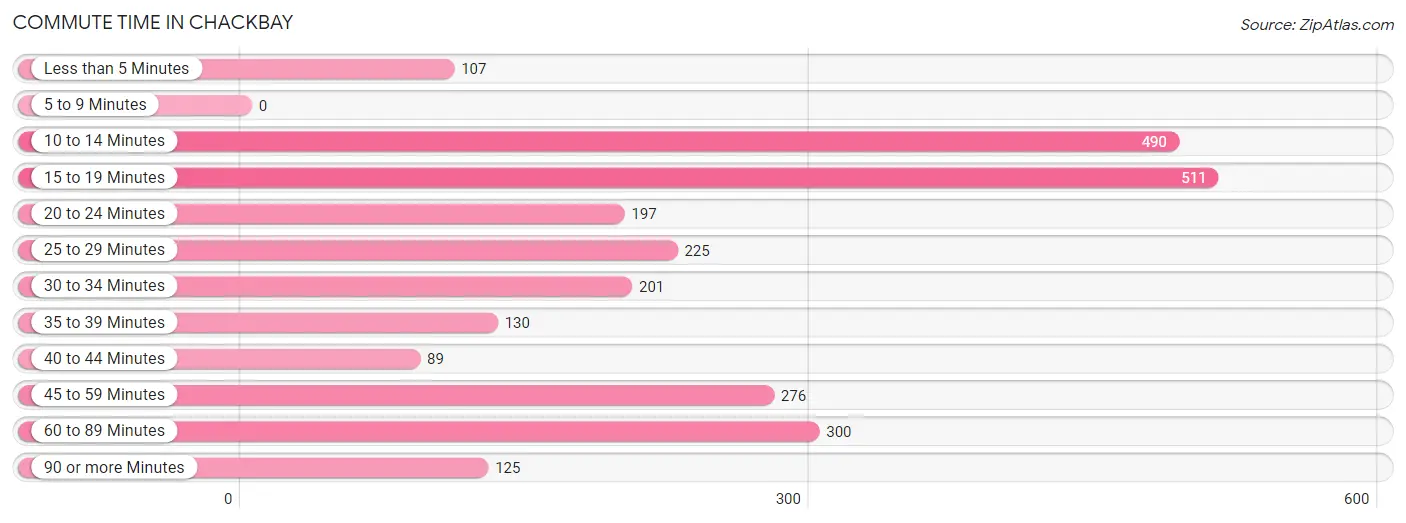
| Commute Time | # Commuters | % Commuters |
| Less than 5 Minutes | 107 | 4.0% |
| 5 to 9 Minutes | 0 | 0.0% |
| 10 to 14 Minutes | 490 | 18.5% |
| 15 to 19 Minutes | 511 | 19.3% |
| 20 to 24 Minutes | 197 | 7.4% |
| 25 to 29 Minutes | 225 | 8.5% |
| 30 to 34 Minutes | 201 | 7.6% |
| 35 to 39 Minutes | 130 | 4.9% |
| 40 to 44 Minutes | 89 | 3.4% |
| 45 to 59 Minutes | 276 | 10.4% |
| 60 to 89 Minutes | 300 | 11.3% |
| 90 or more Minutes | 125 | 4.7% |
Commute Time by Sex in Chackbay
The most common commute times in Chackbay are 10 to 14 minutes (277 commuters, 18.9%) for males and 15 to 19 minutes (335 commuters, 28.2%) for females.
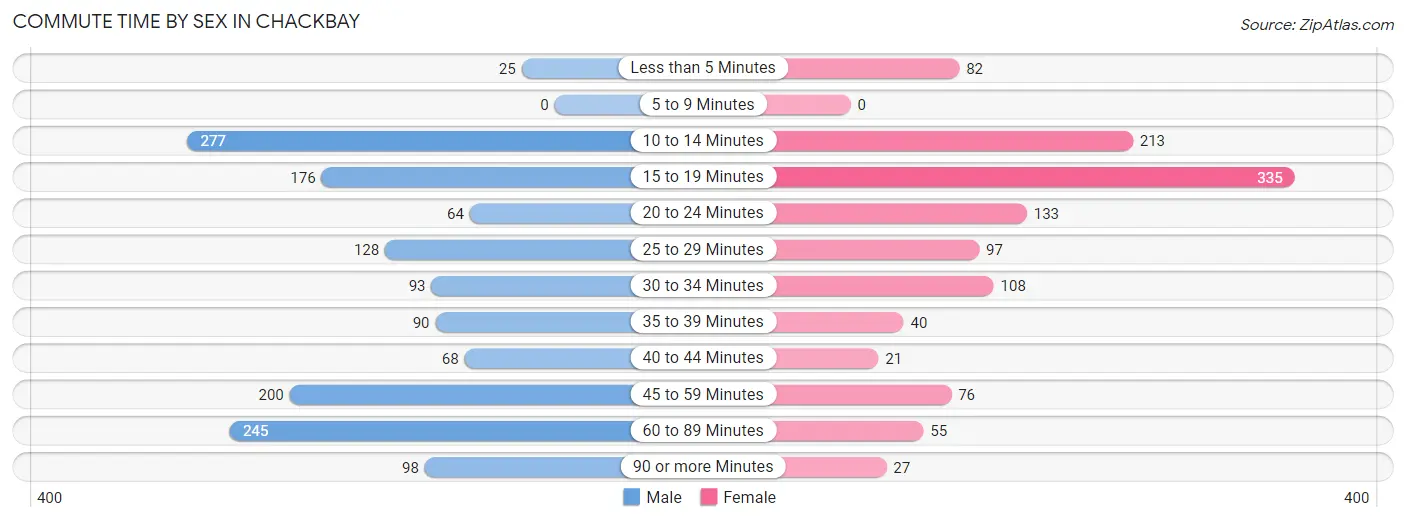
| Commute Time | Male | Female |
| Less than 5 Minutes | 25 (1.7%) | 82 (6.9%) |
| 5 to 9 Minutes | 0 (0.0%) | 0 (0.0%) |
| 10 to 14 Minutes | 277 (18.9%) | 213 (17.9%) |
| 15 to 19 Minutes | 176 (12.0%) | 335 (28.2%) |
| 20 to 24 Minutes | 64 (4.4%) | 133 (11.2%) |
| 25 to 29 Minutes | 128 (8.7%) | 97 (8.2%) |
| 30 to 34 Minutes | 93 (6.4%) | 108 (9.1%) |
| 35 to 39 Minutes | 90 (6.1%) | 40 (3.4%) |
| 40 to 44 Minutes | 68 (4.6%) | 21 (1.8%) |
| 45 to 59 Minutes | 200 (13.7%) | 76 (6.4%) |
| 60 to 89 Minutes | 245 (16.7%) | 55 (4.6%) |
| 90 or more Minutes | 98 (6.7%) | 27 (2.3%) |
Time of Departure to Work by Sex in Chackbay
The most frequent times of departure to work in Chackbay are 6:30 AM to 6:59 AM (339, 23.2%) for males and 7:30 AM to 7:59 AM (329, 27.7%) for females.
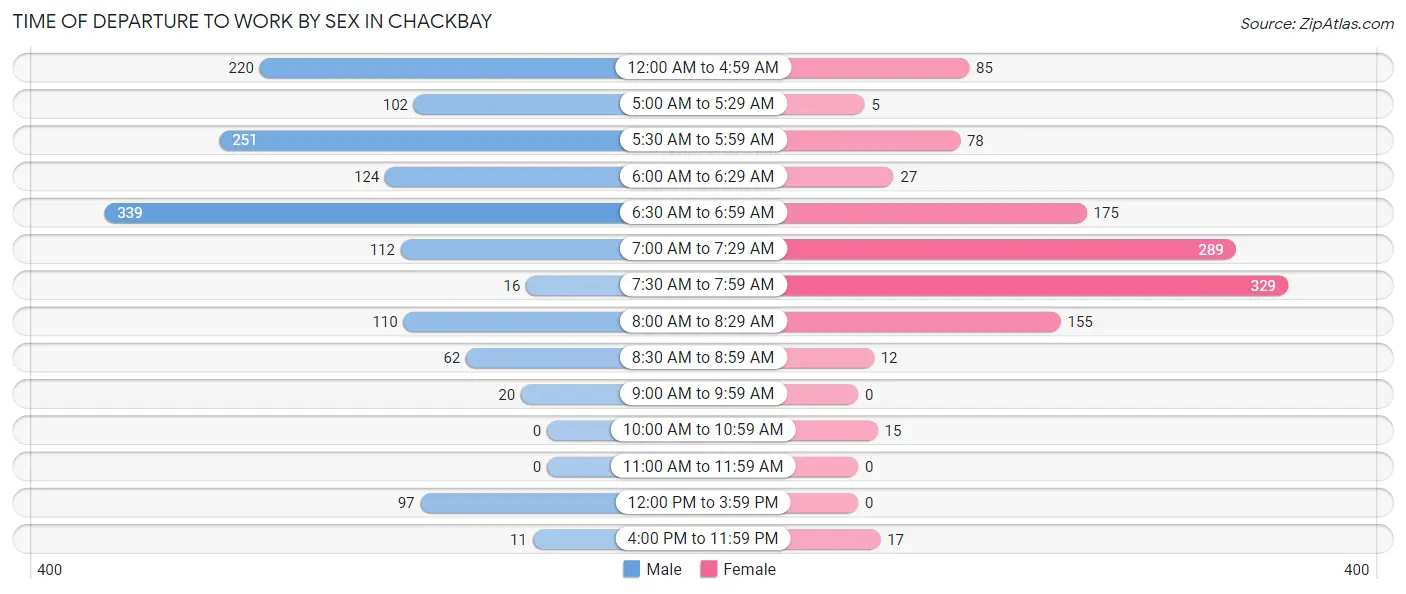
| Time of Departure | Male | Female |
| 12:00 AM to 4:59 AM | 220 (15.0%) | 85 (7.2%) |
| 5:00 AM to 5:29 AM | 102 (7.0%) | 5 (0.4%) |
| 5:30 AM to 5:59 AM | 251 (17.1%) | 78 (6.6%) |
| 6:00 AM to 6:29 AM | 124 (8.5%) | 27 (2.3%) |
| 6:30 AM to 6:59 AM | 339 (23.2%) | 175 (14.7%) |
| 7:00 AM to 7:29 AM | 112 (7.6%) | 289 (24.3%) |
| 7:30 AM to 7:59 AM | 16 (1.1%) | 329 (27.7%) |
| 8:00 AM to 8:29 AM | 110 (7.5%) | 155 (13.1%) |
| 8:30 AM to 8:59 AM | 62 (4.2%) | 12 (1.0%) |
| 9:00 AM to 9:59 AM | 20 (1.4%) | 0 (0.0%) |
| 10:00 AM to 10:59 AM | 0 (0.0%) | 15 (1.3%) |
| 11:00 AM to 11:59 AM | 0 (0.0%) | 0 (0.0%) |
| 12:00 PM to 3:59 PM | 97 (6.6%) | 0 (0.0%) |
| 4:00 PM to 11:59 PM | 11 (0.7%) | 17 (1.4%) |
| Total | 1,464 (100.0%) | 1,187 (100.0%) |
Housing Occupancy in Chackbay
Occupancy by Ownership in Chackbay
Of the total 2,219 dwellings in Chackbay, owner-occupied units account for 2,088 (94.1%), while renter-occupied units make up 131 (5.9%).
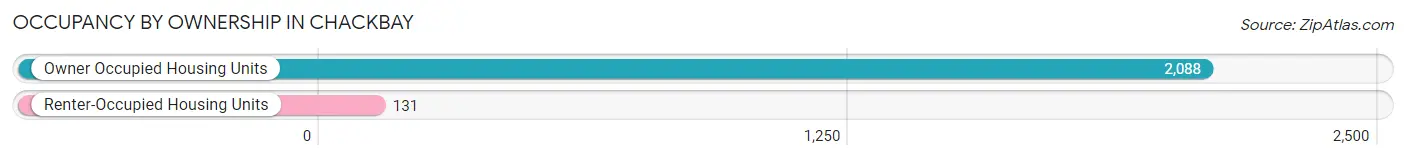
| Occupancy | # Housing Units | % Housing Units |
| Owner Occupied Housing Units | 2,088 | 94.1% |
| Renter-Occupied Housing Units | 131 | 5.9% |
| Total Occupied Housing Units | 2,219 | 100.0% |
Occupancy by Household Size in Chackbay
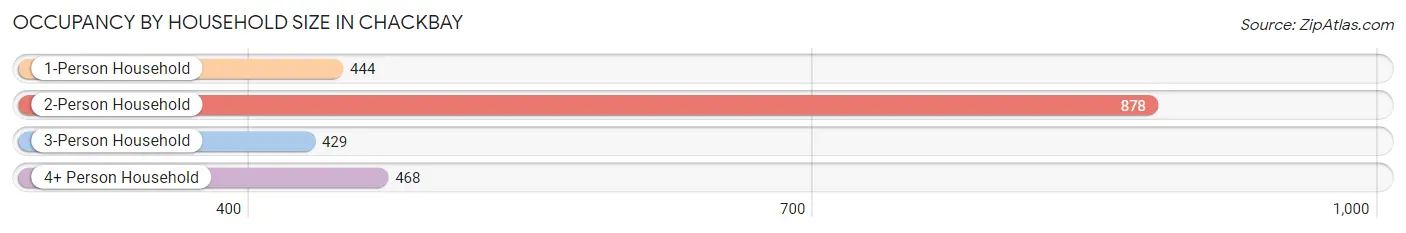
| Household Size | # Housing Units | % Housing Units |
| 1-Person Household | 444 | 20.0% |
| 2-Person Household | 878 | 39.6% |
| 3-Person Household | 429 | 19.3% |
| 4+ Person Household | 468 | 21.1% |
| Total Housing Units | 2,219 | 100.0% |
Occupancy by Ownership by Household Size in Chackbay
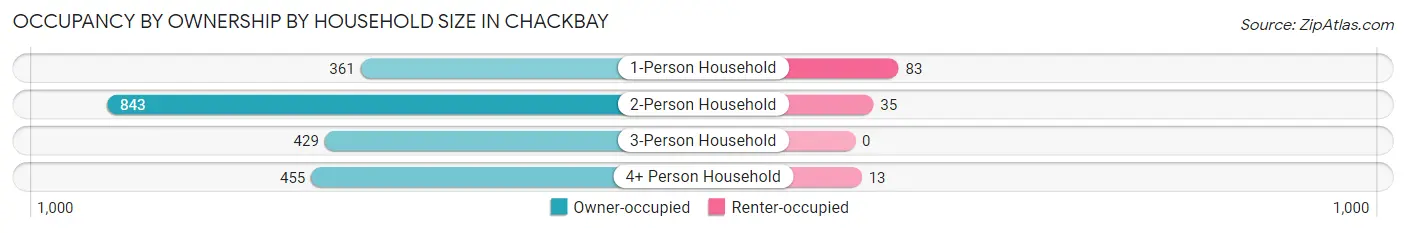
| Household Size | Owner-occupied | Renter-occupied |
| 1-Person Household | 361 (81.3%) | 83 (18.7%) |
| 2-Person Household | 843 (96.0%) | 35 (4.0%) |
| 3-Person Household | 429 (100.0%) | 0 (0.0%) |
| 4+ Person Household | 455 (97.2%) | 13 (2.8%) |
| Total Housing Units | 2,088 (94.1%) | 131 (5.9%) |
Occupancy by Educational Attainment in Chackbay
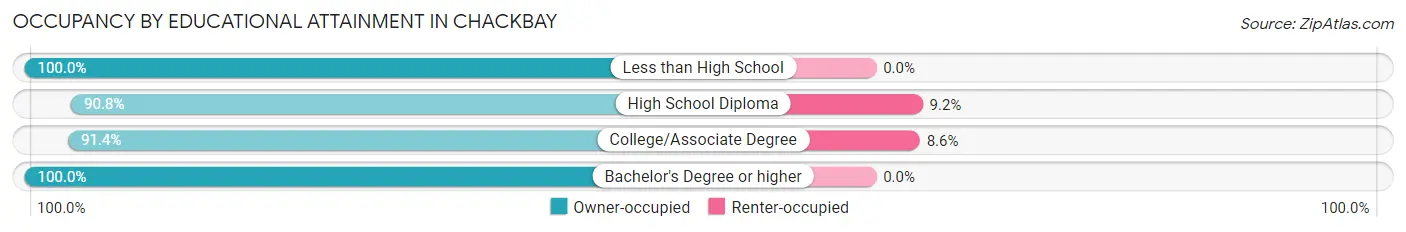
| Household Size | Owner-occupied | Renter-occupied |
| Less than High School | 220 (100.0%) | 0 (0.0%) |
| High School Diploma | 818 (90.8%) | 83 (9.2%) |
| College/Associate Degree | 508 (91.4%) | 48 (8.6%) |
| Bachelor's Degree or higher | 542 (100.0%) | 0 (0.0%) |
Occupancy by Age of Householder in Chackbay
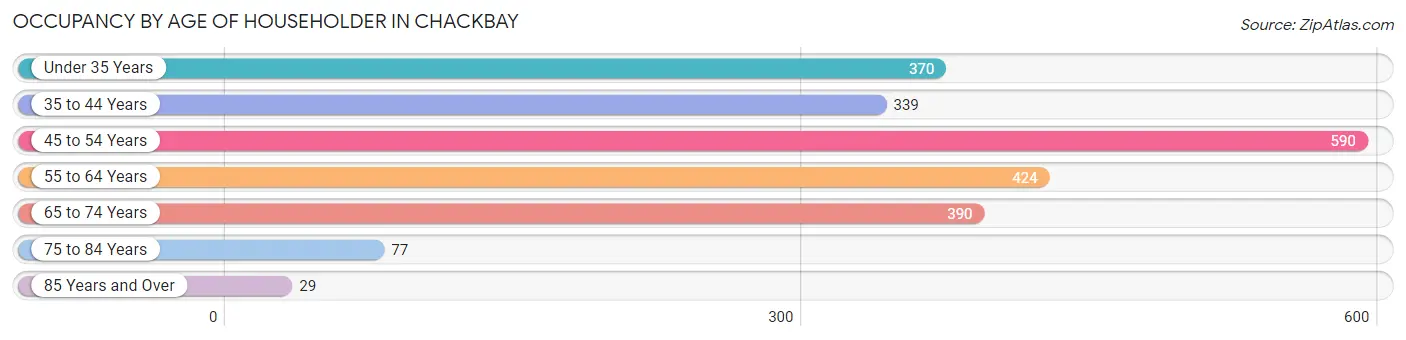
| Age Bracket | # Households | % Households |
| Under 35 Years | 370 | 16.7% |
| 35 to 44 Years | 339 | 15.3% |
| 45 to 54 Years | 590 | 26.6% |
| 55 to 64 Years | 424 | 19.1% |
| 65 to 74 Years | 390 | 17.6% |
| 75 to 84 Years | 77 | 3.5% |
| 85 Years and Over | 29 | 1.3% |
| Total | 2,219 | 100.0% |
Housing Finances in Chackbay
Median Income by Occupancy in Chackbay
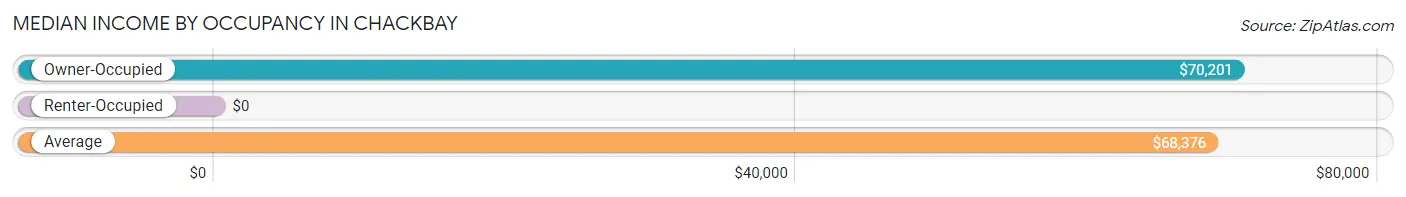
| Occupancy Type | # Households | Median Income |
| Owner-Occupied | 2,088 (94.1%) | $70,201 |
| Renter-Occupied | 131 (5.9%) | $0 |
| Average | 2,219 (100.0%) | $68,376 |
Occupancy by Householder Income Bracket in Chackbay
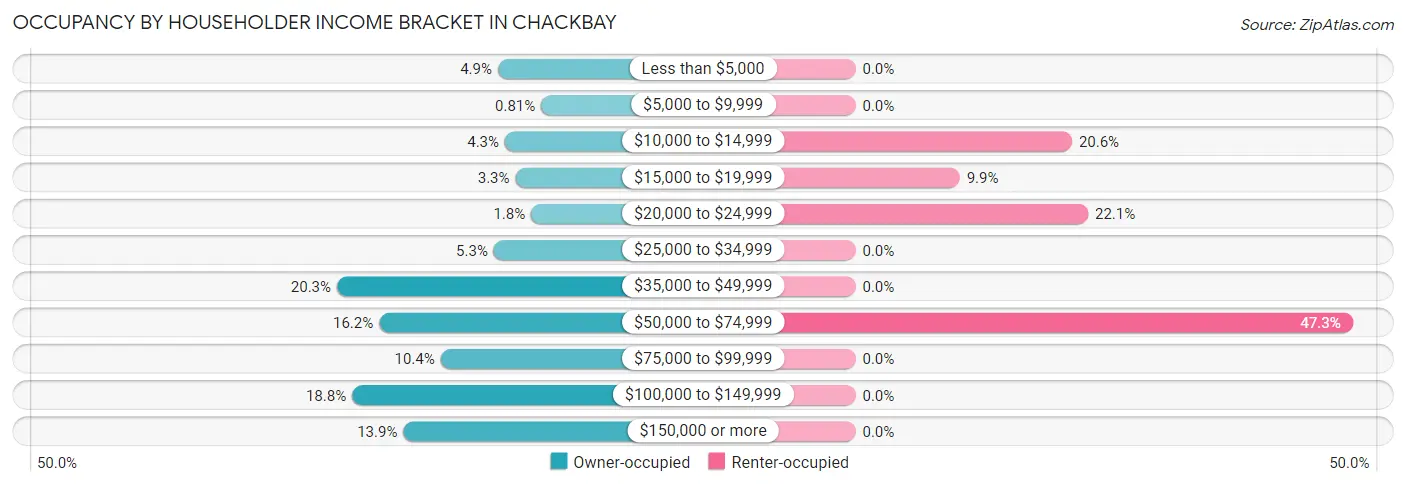
| Income Bracket | Owner-occupied | Renter-occupied |
| Less than $5,000 | 103 (4.9%) | 0 (0.0%) |
| $5,000 to $9,999 | 17 (0.8%) | 0 (0.0%) |
| $10,000 to $14,999 | 89 (4.3%) | 27 (20.6%) |
| $15,000 to $19,999 | 68 (3.3%) | 13 (9.9%) |
| $20,000 to $24,999 | 37 (1.8%) | 29 (22.1%) |
| $25,000 to $34,999 | 111 (5.3%) | 0 (0.0%) |
| $35,000 to $49,999 | 423 (20.3%) | 0 (0.0%) |
| $50,000 to $74,999 | 339 (16.2%) | 62 (47.3%) |
| $75,000 to $99,999 | 217 (10.4%) | 0 (0.0%) |
| $100,000 to $149,999 | 393 (18.8%) | 0 (0.0%) |
| $150,000 or more | 291 (13.9%) | 0 (0.0%) |
| Total | 2,088 (100.0%) | 131 (100.0%) |
Monthly Housing Cost Tiers in Chackbay
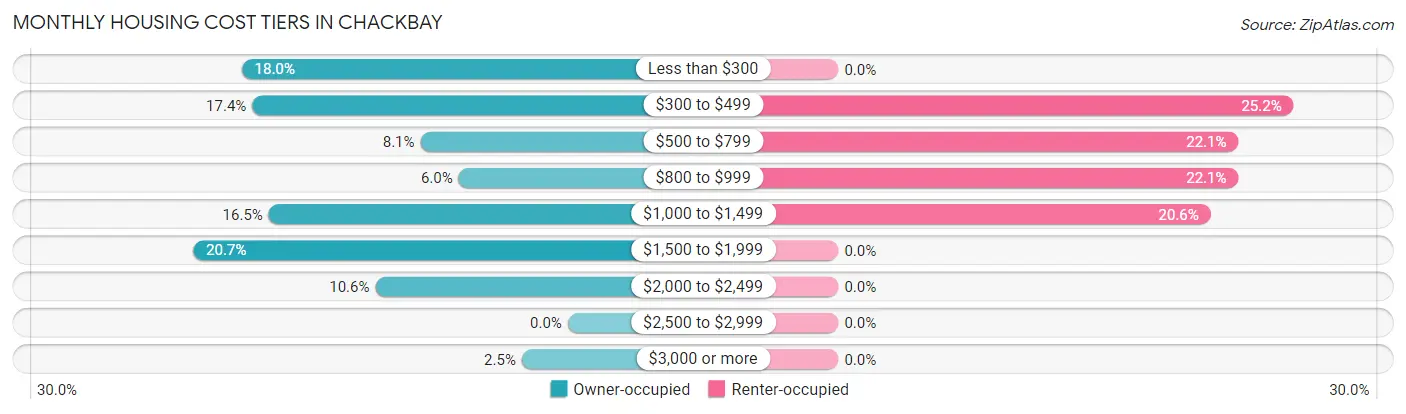
| Monthly Cost | Owner-occupied | Renter-occupied |
| Less than $300 | 376 (18.0%) | 0 (0.0%) |
| $300 to $499 | 364 (17.4%) | 33 (25.2%) |
| $500 to $799 | 170 (8.1%) | 29 (22.1%) |
| $800 to $999 | 126 (6.0%) | 29 (22.1%) |
| $1,000 to $1,499 | 345 (16.5%) | 27 (20.6%) |
| $1,500 to $1,999 | 432 (20.7%) | 0 (0.0%) |
| $2,000 to $2,499 | 222 (10.6%) | 0 (0.0%) |
| $2,500 to $2,999 | 0 (0.0%) | 0 (0.0%) |
| $3,000 or more | 53 (2.5%) | 0 (0.0%) |
| Total | 2,088 (100.0%) | 131 (100.0%) |
Physical Housing Characteristics in Chackbay
Housing Structures in Chackbay
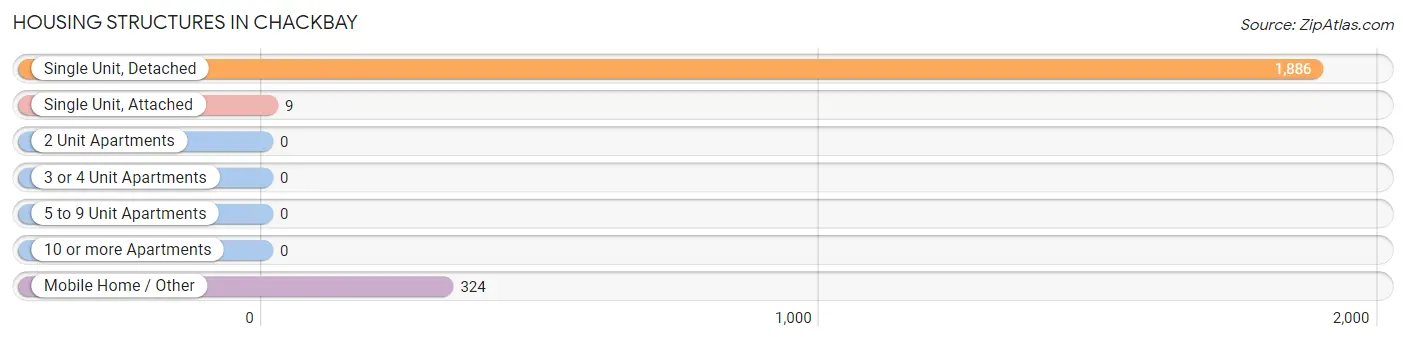
| Structure Type | # Housing Units | % Housing Units |
| Single Unit, Detached | 1,886 | 85.0% |
| Single Unit, Attached | 9 | 0.4% |
| 2 Unit Apartments | 0 | 0.0% |
| 3 or 4 Unit Apartments | 0 | 0.0% |
| 5 to 9 Unit Apartments | 0 | 0.0% |
| 10 or more Apartments | 0 | 0.0% |
| Mobile Home / Other | 324 | 14.6% |
| Total | 2,219 | 100.0% |
Housing Structures by Occupancy in Chackbay
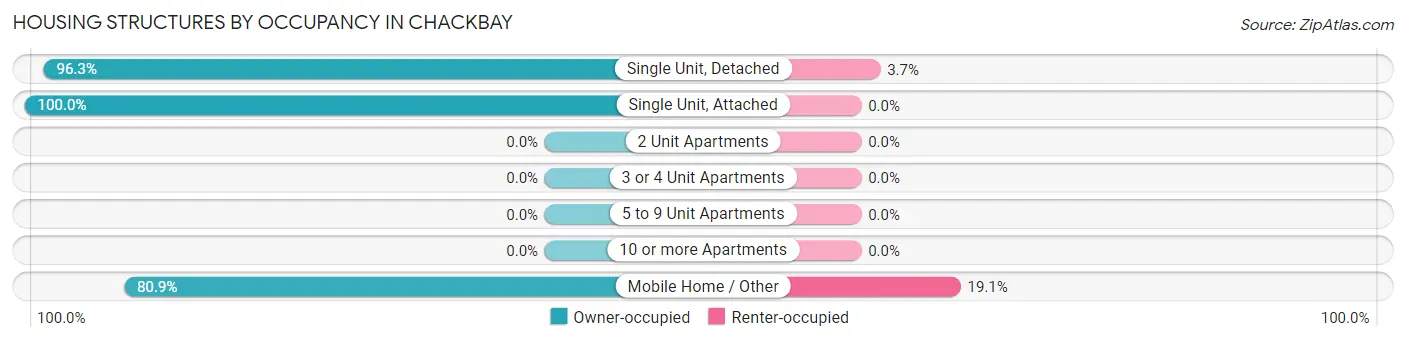
| Structure Type | Owner-occupied | Renter-occupied |
| Single Unit, Detached | 1,817 (96.3%) | 69 (3.7%) |
| Single Unit, Attached | 9 (100.0%) | 0 (0.0%) |
| 2 Unit Apartments | 0 (0.0%) | 0 (0.0%) |
| 3 or 4 Unit Apartments | 0 (0.0%) | 0 (0.0%) |
| 5 to 9 Unit Apartments | 0 (0.0%) | 0 (0.0%) |
| 10 or more Apartments | 0 (0.0%) | 0 (0.0%) |
| Mobile Home / Other | 262 (80.9%) | 62 (19.1%) |
| Total | 2,088 (94.1%) | 131 (5.9%) |
Housing Structures by Number of Rooms in Chackbay
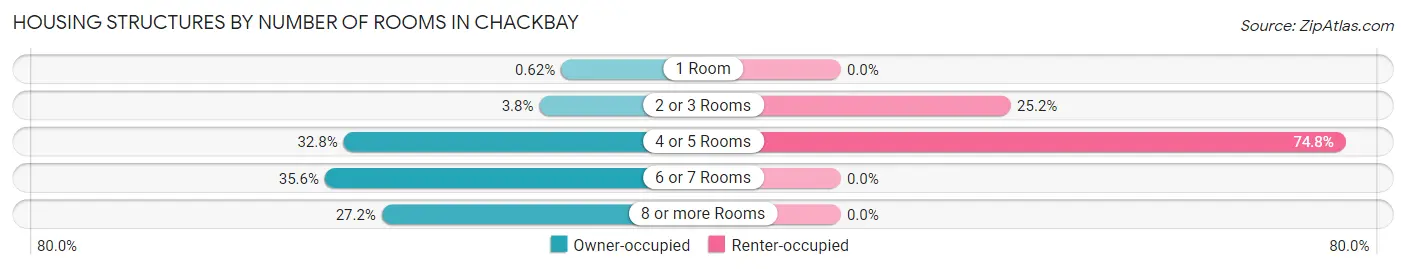
| Number of Rooms | Owner-occupied | Renter-occupied |
| 1 Room | 13 (0.6%) | 0 (0.0%) |
| 2 or 3 Rooms | 80 (3.8%) | 33 (25.2%) |
| 4 or 5 Rooms | 685 (32.8%) | 98 (74.8%) |
| 6 or 7 Rooms | 743 (35.6%) | 0 (0.0%) |
| 8 or more Rooms | 567 (27.2%) | 0 (0.0%) |
| Total | 2,088 (100.0%) | 131 (100.0%) |
Housing Structure by Heating Type in Chackbay
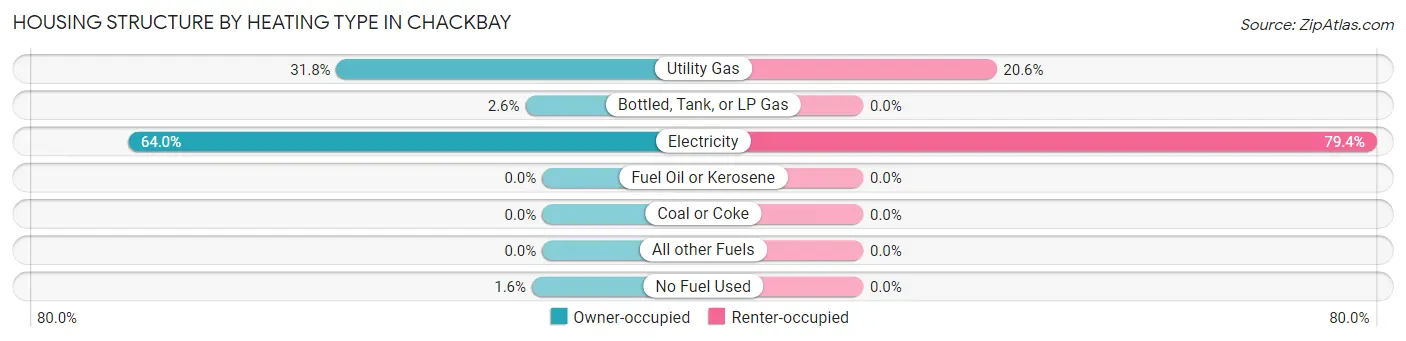
| Heating Type | Owner-occupied | Renter-occupied |
| Utility Gas | 664 (31.8%) | 27 (20.6%) |
| Bottled, Tank, or LP Gas | 54 (2.6%) | 0 (0.0%) |
| Electricity | 1,337 (64.0%) | 104 (79.4%) |
| Fuel Oil or Kerosene | 0 (0.0%) | 0 (0.0%) |
| Coal or Coke | 0 (0.0%) | 0 (0.0%) |
| All other Fuels | 0 (0.0%) | 0 (0.0%) |
| No Fuel Used | 33 (1.6%) | 0 (0.0%) |
| Total | 2,088 (100.0%) | 131 (100.0%) |
Household Vehicle Usage in Chackbay
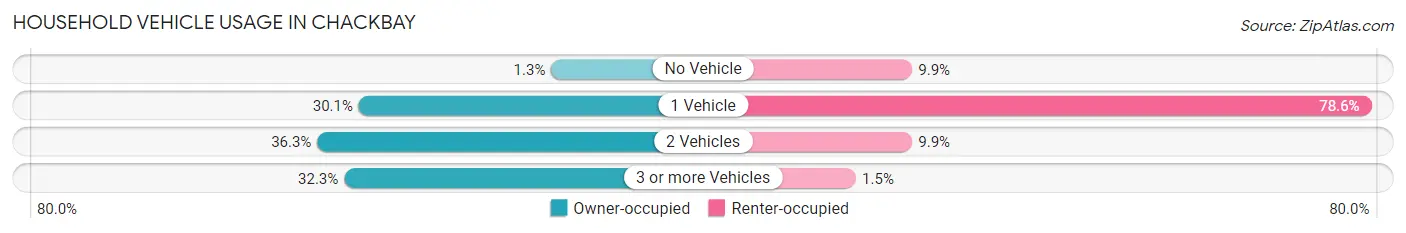
| Vehicles per Household | Owner-occupied | Renter-occupied |
| No Vehicle | 28 (1.3%) | 13 (9.9%) |
| 1 Vehicle | 628 (30.1%) | 103 (78.6%) |
| 2 Vehicles | 758 (36.3%) | 13 (9.9%) |
| 3 or more Vehicles | 674 (32.3%) | 2 (1.5%) |
| Total | 2,088 (100.0%) | 131 (100.0%) |
Real Estate & Mortgages in Chackbay
Real Estate and Mortgage Overview in Chackbay
| Characteristic | Without Mortgage | With Mortgage |
| Housing Units | 872 | 1,216 |
| Median Property Value | $107,000 | $271,600 |
| Median Household Income | $46,974 | $218 |
| Monthly Housing Costs | $335 | $53 |
| Real Estate Taxes | $405 | $227 |
Property Value by Mortgage Status in Chackbay
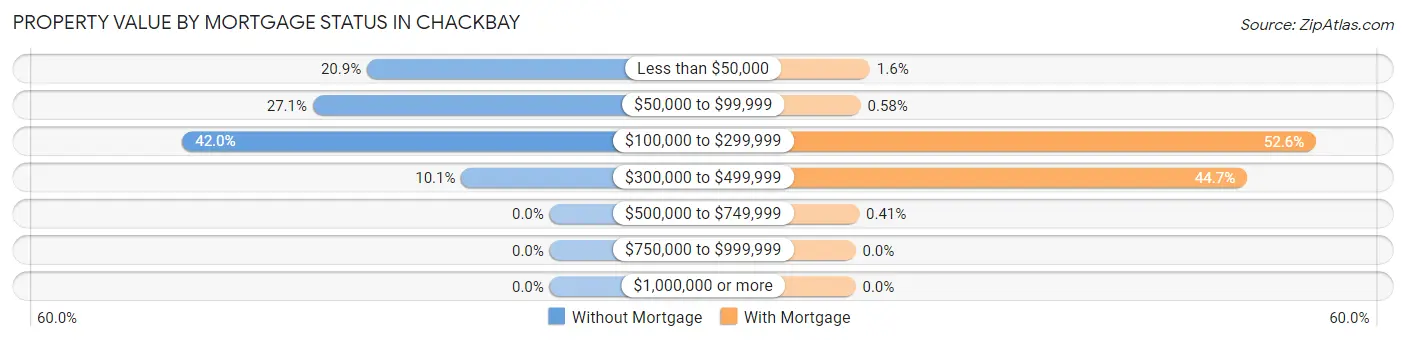
| Property Value | Without Mortgage | With Mortgage |
| Less than $50,000 | 182 (20.9%) | 20 (1.6%) |
| $50,000 to $99,999 | 236 (27.1%) | 7 (0.6%) |
| $100,000 to $299,999 | 366 (42.0%) | 640 (52.6%) |
| $300,000 to $499,999 | 88 (10.1%) | 544 (44.7%) |
| $500,000 to $749,999 | 0 (0.0%) | 5 (0.4%) |
| $750,000 to $999,999 | 0 (0.0%) | 0 (0.0%) |
| $1,000,000 or more | 0 (0.0%) | 0 (0.0%) |
| Total | 872 (100.0%) | 1,216 (100.0%) |
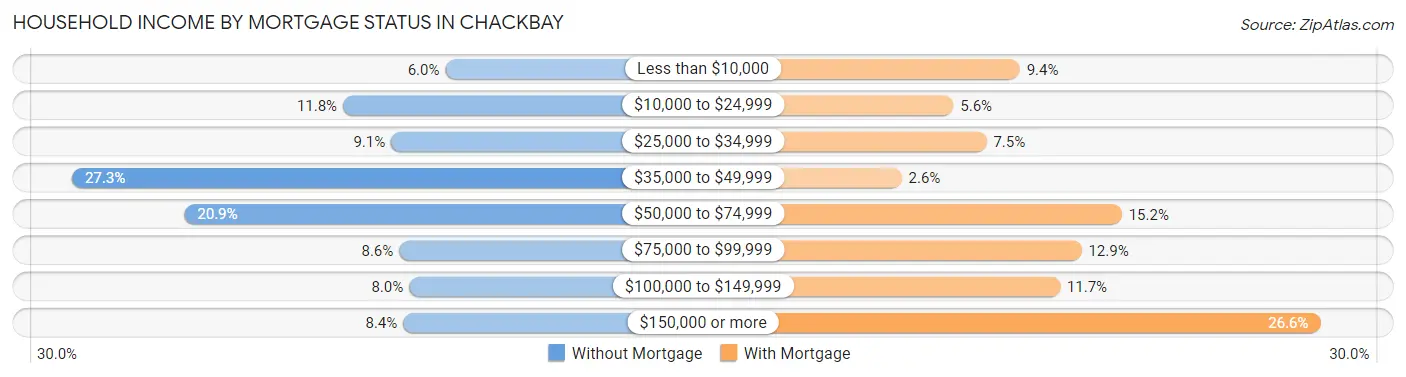
Household Income by Mortgage Status in Chackbay
| Household Income | Without Mortgage | With Mortgage |
| Less than $10,000 | 52 (6.0%) | 114 (9.4%) |
| $10,000 to $24,999 | 103 (11.8%) | 68 (5.6%) |
| $25,000 to $34,999 | 79 (9.1%) | 91 (7.5%) |
| $35,000 to $49,999 | 238 (27.3%) | 32 (2.6%) |
| $50,000 to $74,999 | 182 (20.9%) | 185 (15.2%) |
| $75,000 to $99,999 | 75 (8.6%) | 157 (12.9%) |
| $100,000 to $149,999 | 70 (8.0%) | 142 (11.7%) |
| $150,000 or more | 73 (8.4%) | 323 (26.6%) |
| Total | 872 (100.0%) | 1,216 (100.0%) |
Property Value to Household Income Ratio in Chackbay
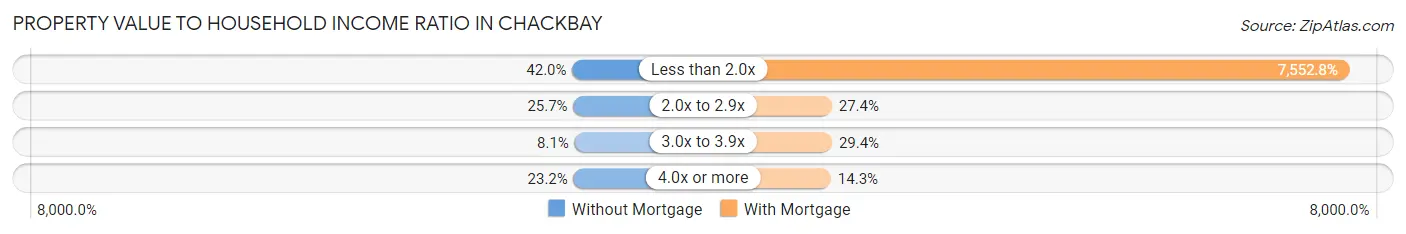
| Value-to-Income Ratio | Without Mortgage | With Mortgage |
| Less than 2.0x | 366 (42.0%) | 91,842 (7,552.8%) |
| 2.0x to 2.9x | 224 (25.7%) | 333 (27.4%) |
| 3.0x to 3.9x | 71 (8.1%) | 358 (29.4%) |
| 4.0x or more | 202 (23.2%) | 174 (14.3%) |
| Total | 872 (100.0%) | 1,216 (100.0%) |
Real Estate Taxes by Mortgage Status in Chackbay
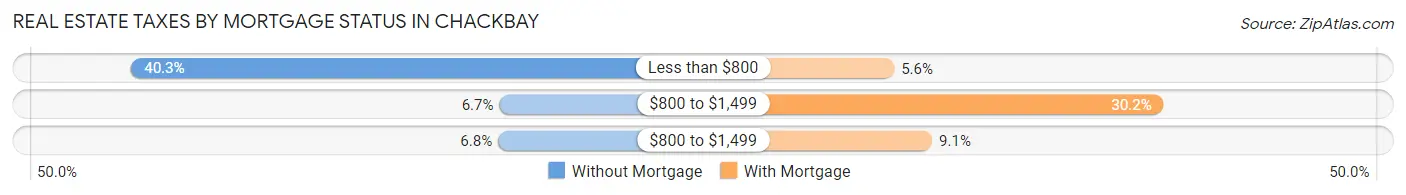
| Property Taxes | Without Mortgage | With Mortgage |
| Less than $800 | 351 (40.3%) | 68 (5.6%) |
| $800 to $1,499 | 58 (6.7%) | 367 (30.2%) |
| $800 to $1,499 | 59 (6.8%) | 110 (9.0%) |
| Total | 872 (100.0%) | 1,216 (100.0%) |
Health & Disability in Chackbay
Health Insurance Coverage by Age in Chackbay
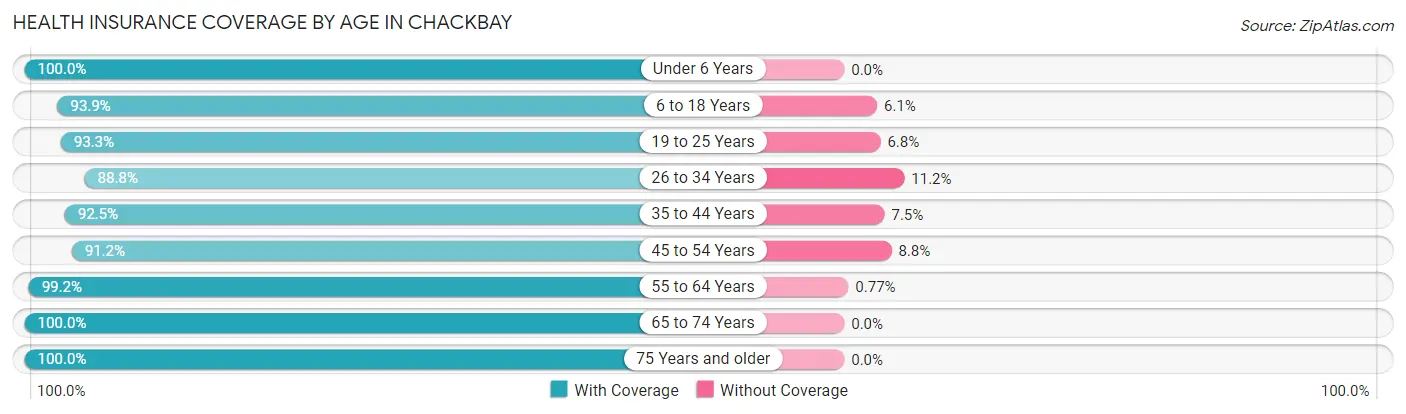
| Age Bracket | With Coverage | Without Coverage |
| Under 6 Years | 466 (100.0%) | 0 (0.0%) |
| 6 to 18 Years | 935 (93.9%) | 61 (6.1%) |
| 19 to 25 Years | 456 (93.2%) | 33 (6.8%) |
| 26 to 34 Years | 317 (88.8%) | 40 (11.2%) |
| 35 to 44 Years | 678 (92.5%) | 55 (7.5%) |
| 45 to 54 Years | 860 (91.2%) | 83 (8.8%) |
| 55 to 64 Years | 906 (99.2%) | 7 (0.8%) |
| 65 to 74 Years | 494 (100.0%) | 0 (0.0%) |
| 75 Years and older | 250 (100.0%) | 0 (0.0%) |
| Total | 5,362 (95.1%) | 279 (5.0%) |
Health Insurance Coverage by Citizenship Status in Chackbay
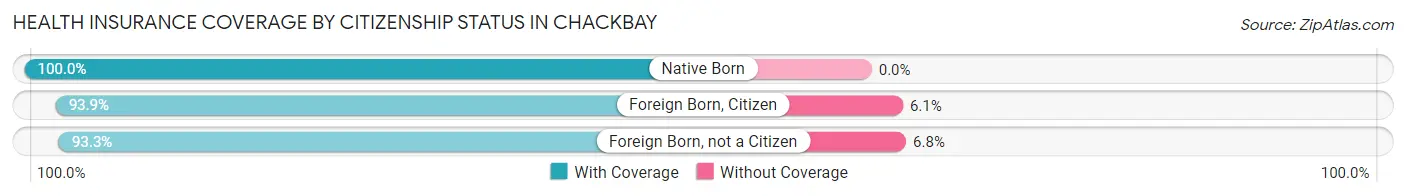
| Citizenship Status | With Coverage | Without Coverage |
| Native Born | 466 (100.0%) | 0 (0.0%) |
| Foreign Born, Citizen | 935 (93.9%) | 61 (6.1%) |
| Foreign Born, not a Citizen | 456 (93.2%) | 33 (6.8%) |
Health Insurance Coverage by Household Income in Chackbay
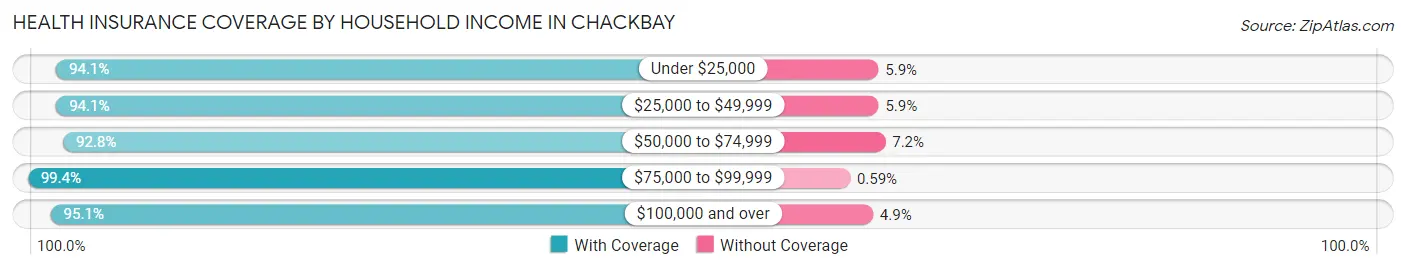
| Household Income | With Coverage | Without Coverage |
| Under $25,000 | 732 (94.1%) | 46 (5.9%) |
| $25,000 to $49,999 | 951 (94.1%) | 60 (5.9%) |
| $50,000 to $74,999 | 837 (92.8%) | 65 (7.2%) |
| $75,000 to $99,999 | 837 (99.4%) | 5 (0.6%) |
| $100,000 and over | 2,005 (95.1%) | 103 (4.9%) |
Public vs Private Health Insurance Coverage by Age in Chackbay
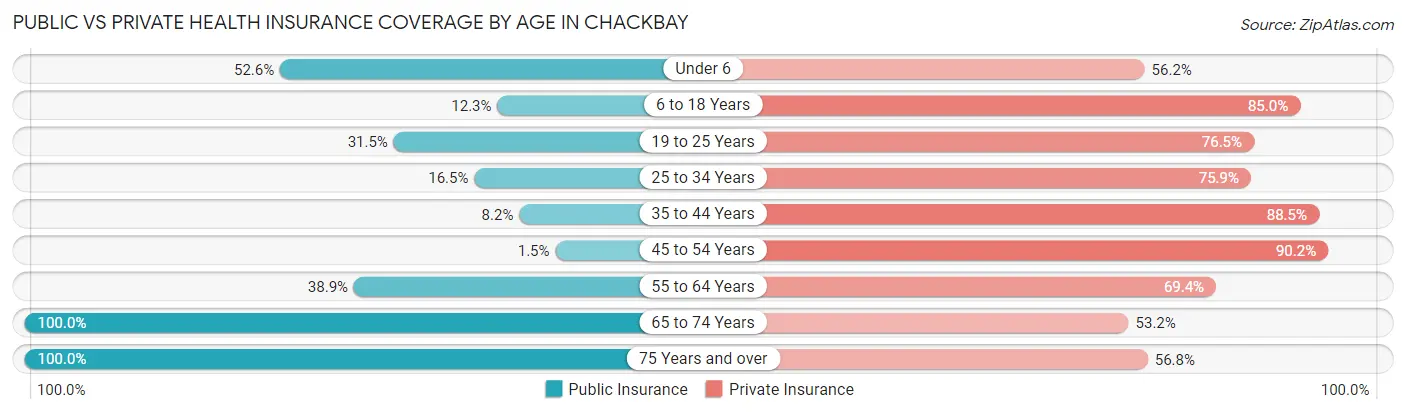
| Age Bracket | Public Insurance | Private Insurance |
| Under 6 | 245 (52.6%) | 262 (56.2%) |
| 6 to 18 Years | 122 (12.2%) | 847 (85.0%) |
| 19 to 25 Years | 154 (31.5%) | 374 (76.5%) |
| 25 to 34 Years | 59 (16.5%) | 271 (75.9%) |
| 35 to 44 Years | 60 (8.2%) | 649 (88.5%) |
| 45 to 54 Years | 14 (1.5%) | 851 (90.2%) |
| 55 to 64 Years | 355 (38.9%) | 634 (69.4%) |
| 65 to 74 Years | 494 (100.0%) | 263 (53.2%) |
| 75 Years and over | 250 (100.0%) | 142 (56.8%) |
| Total | 1,753 (31.1%) | 4,293 (76.1%) |
Disability Status by Sex by Age in Chackbay
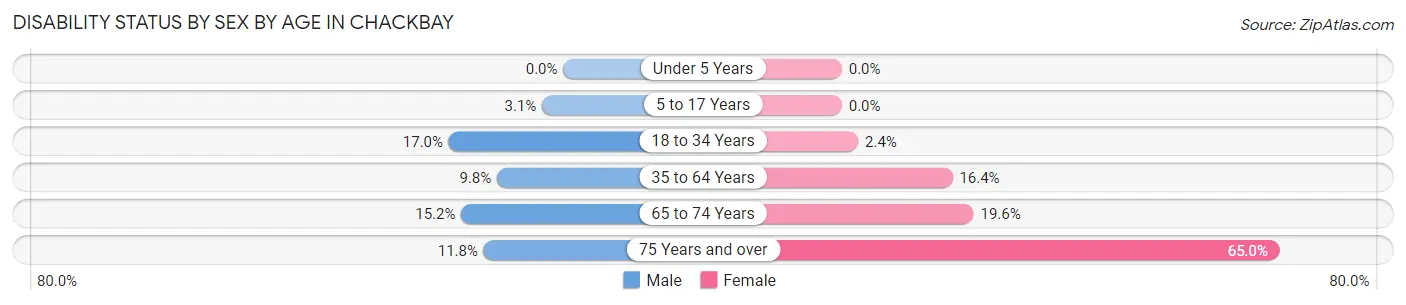
| Age Bracket | Male | Female |
| Under 5 Years | 0 (0.0%) | 0 (0.0%) |
| 5 to 17 Years | 18 (3.1%) | 0 (0.0%) |
| 18 to 34 Years | 69 (17.0%) | 13 (2.4%) |
| 35 to 64 Years | 132 (9.8%) | 205 (16.4%) |
| 65 to 74 Years | 40 (15.1%) | 45 (19.6%) |
| 75 Years and over | 15 (11.8%) | 80 (65.0%) |
Disability Class by Sex by Age in Chackbay
Disability Class: Hearing Difficulty
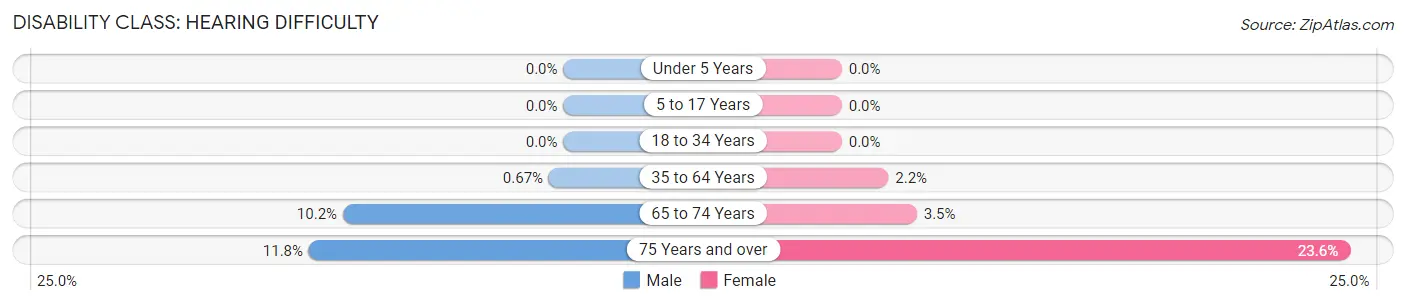
| Age Bracket | Male | Female |
| Under 5 Years | 0 (0.0%) | 0 (0.0%) |
| 5 to 17 Years | 0 (0.0%) | 0 (0.0%) |
| 18 to 34 Years | 0 (0.0%) | 0 (0.0%) |
| 35 to 64 Years | 9 (0.7%) | 27 (2.2%) |
| 65 to 74 Years | 27 (10.2%) | 8 (3.5%) |
| 75 Years and over | 15 (11.8%) | 29 (23.6%) |
Disability Class: Vision Difficulty
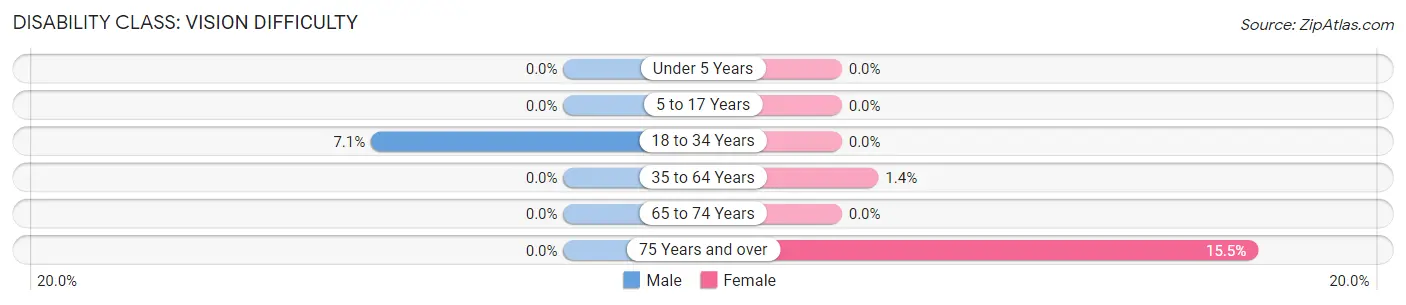
| Age Bracket | Male | Female |
| Under 5 Years | 0 (0.0%) | 0 (0.0%) |
| 5 to 17 Years | 0 (0.0%) | 0 (0.0%) |
| 18 to 34 Years | 29 (7.1%) | 0 (0.0%) |
| 35 to 64 Years | 0 (0.0%) | 17 (1.4%) |
| 65 to 74 Years | 0 (0.0%) | 0 (0.0%) |
| 75 Years and over | 0 (0.0%) | 19 (15.4%) |
Disability Class: Cognitive Difficulty
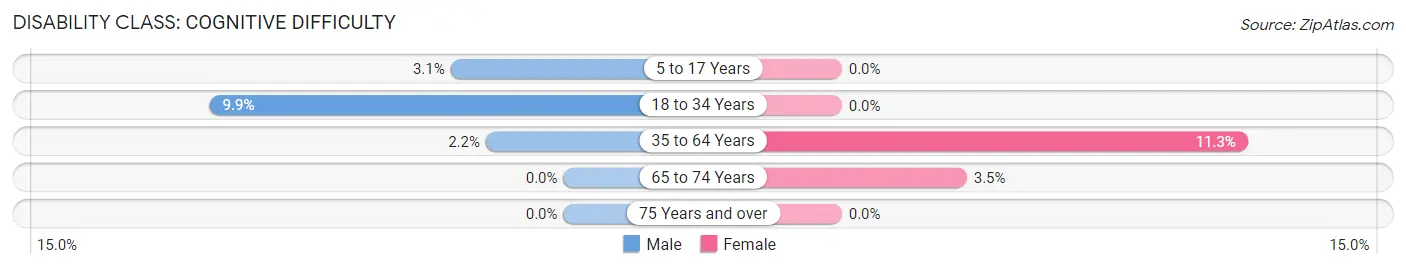
| Age Bracket | Male | Female |
| 5 to 17 Years | 18 (3.1%) | 0 (0.0%) |
| 18 to 34 Years | 40 (9.9%) | 0 (0.0%) |
| 35 to 64 Years | 29 (2.2%) | 141 (11.3%) |
| 65 to 74 Years | 0 (0.0%) | 8 (3.5%) |
| 75 Years and over | 0 (0.0%) | 0 (0.0%) |
Disability Class: Ambulatory Difficulty
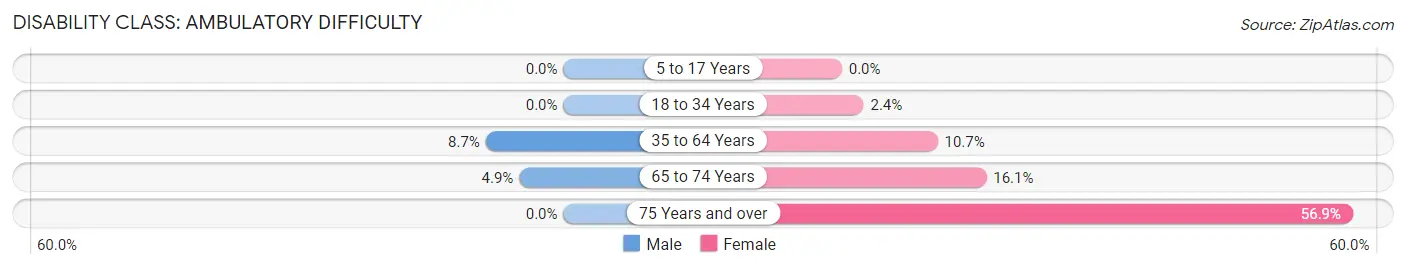
| Age Bracket | Male | Female |
| 5 to 17 Years | 0 (0.0%) | 0 (0.0%) |
| 18 to 34 Years | 0 (0.0%) | 13 (2.4%) |
| 35 to 64 Years | 116 (8.6%) | 133 (10.7%) |
| 65 to 74 Years | 13 (4.9%) | 37 (16.1%) |
| 75 Years and over | 0 (0.0%) | 70 (56.9%) |
Disability Class: Self-Care Difficulty
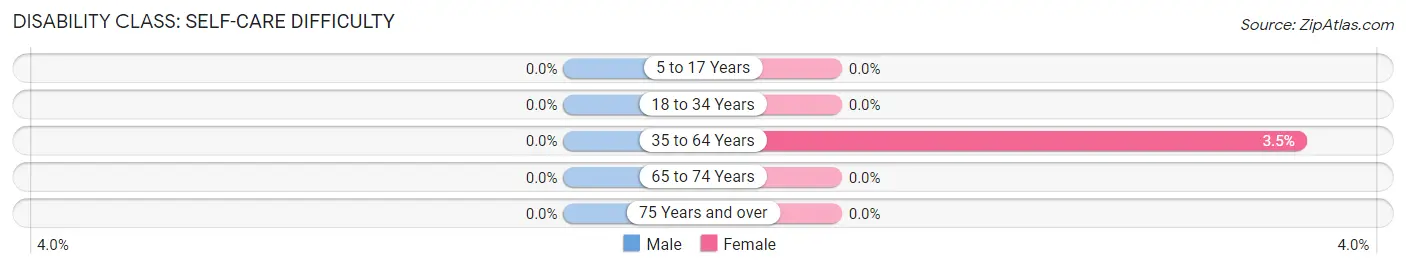
| Age Bracket | Male | Female |
| 5 to 17 Years | 0 (0.0%) | 0 (0.0%) |
| 18 to 34 Years | 0 (0.0%) | 0 (0.0%) |
| 35 to 64 Years | 0 (0.0%) | 43 (3.5%) |
| 65 to 74 Years | 0 (0.0%) | 0 (0.0%) |
| 75 Years and over | 0 (0.0%) | 0 (0.0%) |
Technology Access in Chackbay
Computing Device Access in Chackbay
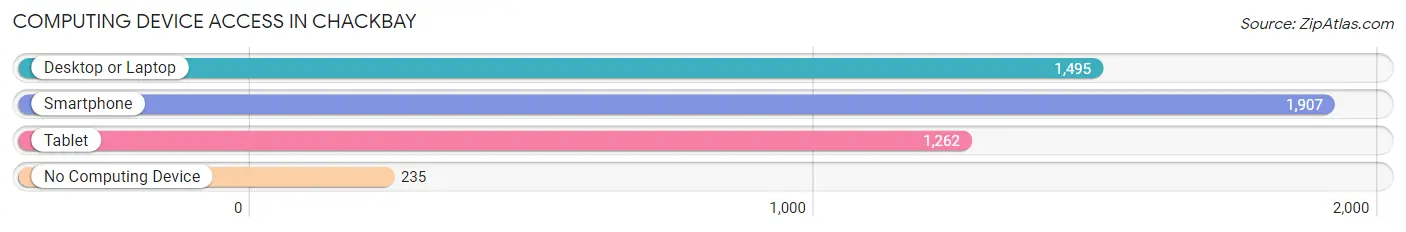
| Device Type | # Households | % Households |
| Desktop or Laptop | 1,495 | 67.4% |
| Smartphone | 1,907 | 85.9% |
| Tablet | 1,262 | 56.9% |
| No Computing Device | 235 | 10.6% |
| Total | 2,219 | 100.0% |
Internet Access in Chackbay
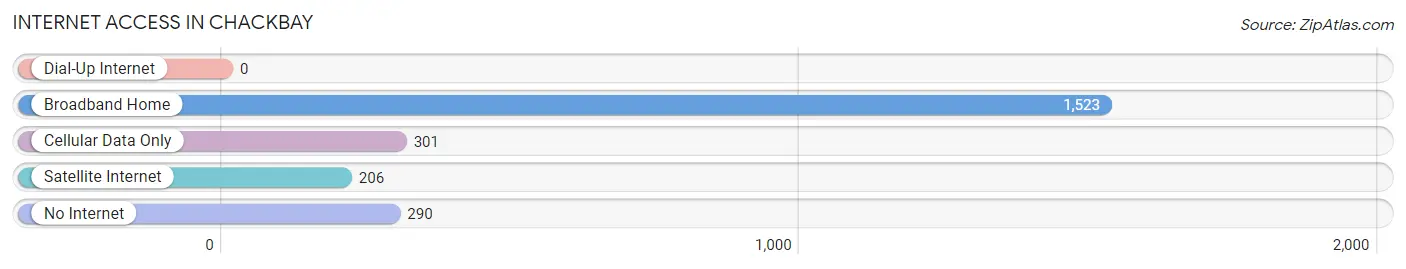
| Internet Type | # Households | % Households |
| Dial-Up Internet | 0 | 0.0% |
| Broadband Home | 1,523 | 68.6% |
| Cellular Data Only | 301 | 13.6% |
| Satellite Internet | 206 | 9.3% |
| No Internet | 290 | 13.1% |
| Total | 2,219 | 100.0% |
Chackbay Summary
Chackbay is a small unincorporated community located in Lafourche Parish, Louisiana. It is situated about 25 miles south of Thibodaux and about 40 miles southwest of New Orleans. The population of Chackbay was estimated to be 1,845 in 2019.
History
Chackbay was founded in the early 1800s by French settlers. The name of the town is derived from the French phrase “chacun bay” which means “each bay”. The town was originally a small fishing village and was home to a few hundred people.
In the late 1800s, the town began to grow as the sugar industry began to expand in the area. The town was home to several sugar plantations and the population began to grow. By the early 1900s, the population had grown to over 1,000 people.
In the mid-1900s, the town began to decline as the sugar industry began to decline. The population began to decline as well and by the late 1900s, the population had dropped to around 500 people.
Geography
Chackbay is located in the southeastern part of Lafourche Parish. It is situated about 25 miles south of Thibodaux and about 40 miles southwest of New Orleans. The town is located on the banks of Bayou Lafourche and is surrounded by marshland and swamps.
The climate in Chackbay is humid subtropical with hot and humid summers and mild winters. The average annual temperature is around 70 degrees Fahrenheit. The average annual precipitation is around 60 inches.
Economy
The economy of Chackbay is largely based on agriculture and fishing. The town is home to several sugar plantations and is also home to a number of seafood processing plants. The town is also home to a few small businesses such as restaurants, convenience stores, and gas stations.
Demographics
As of 2019, the population of Chackbay was estimated to be 1,845. The racial makeup of the town was 79.3% White, 17.2% African American, 0.7% Native American, 0.3% Asian, and 2.5% from other races. The median household income was $37,917 and the median home value was $117,400.
Conclusion
Chackbay is a small unincorporated community located in Lafourche Parish, Louisiana. It is situated about 25 miles south of Thibodaux and about 40 miles southwest of New Orleans. The population of Chackbay was estimated to be 1,845 in 2019. The town is largely based on agriculture and fishing and is home to several sugar plantations and seafood processing plants. The racial makeup of the town was 79.3% White, 17.2% African American, 0.7% Native American, 0.3% Asian, and 2.5% from other races. The median household income was $37,917 and the median home value was $117,400.
Common Questions
What is the Total Population of Chackbay?
Total Population of Chackbay is 5,641.
What is the Total Male Population of Chackbay?
Total Male Population of Chackbay is 2,805.
What is the Total Female Population of Chackbay?
Total Female Population of Chackbay is 2,836.
What is the Ratio of Males per 100 Females in Chackbay?
There are 98.91 Males per 100 Females in Chackbay.
What is the Ratio of Females per 100 Males in Chackbay?
There are 101.11 Females per 100 Males in Chackbay.
What is the Median Population Age in Chackbay?
Median Population Age in Chackbay is 41.0 Years.
What is the Average Family Size in Chackbay
Average Family Size in Chackbay is 2.9 People.
What is the Average Household Size in Chackbay
Average Household Size in Chackbay is 2.5 People.
What is Per Capita Income in Chackbay?
Per Capita income in Chackbay is $32,785.
What is the Median Family Income in Chackbay?
Median Family Income in Chackbay is $74,563.
What is the Median Household income in Chackbay?
Median Household Income in Chackbay is $68,376.
What is Income or Wage Gap in Chackbay?
Income or Wage Gap in Chackbay is 43.8%.
Women in Chackbay earn 56.2 cents for every dollar earned by a man.
What is Family Income Deficit in Chackbay?
Family Income Deficit in Chackbay is $9,537.
Families that are below poverty line in Chackbay earn $9,537 less on average than the poverty threshold level.
What is Inequality or Gini Index in Chackbay?
Inequality or Gini Index in Chackbay is 0.43.
How Large is the Labor Force in Chackbay?
There are 2,975 People in the Labor Forcein in Chackbay.
What is the Percentage of People in the Labor Force in Chackbay?
66.9% of People are in the Labor Force in Chackbay.
What is the Unemployment Rate in Chackbay?
Unemployment Rate in Chackbay is 6.9%.