Catahoula, LA
Catahoula Map
Catahoula Overview
1,042
TOTAL POPULATION
647
MALE POPULATION
395
FEMALE POPULATION
163.80
MALES / 100 FEMALES
61.05
FEMALES / 100 MALES
49.0
MEDIAN AGE
3.1
AVG FAMILY SIZE
2.8
AVG HOUSEHOLD SIZE
$28,620
PER CAPITA INCOME
$108,571
AVG FAMILY INCOME
$87,772
AVG HOUSEHOLD INCOME
56.9%
WAGE / INCOME GAP [ % ]
43.1¢/ $1
WAGE / INCOME GAP [ $ ]
0.37
INEQUALITY / GINI INDEX
472
LABOR FORCE [ PEOPLE ]
58.5%
PERCENT IN LABOR FORCE
1.3%
UNEMPLOYMENT RATE
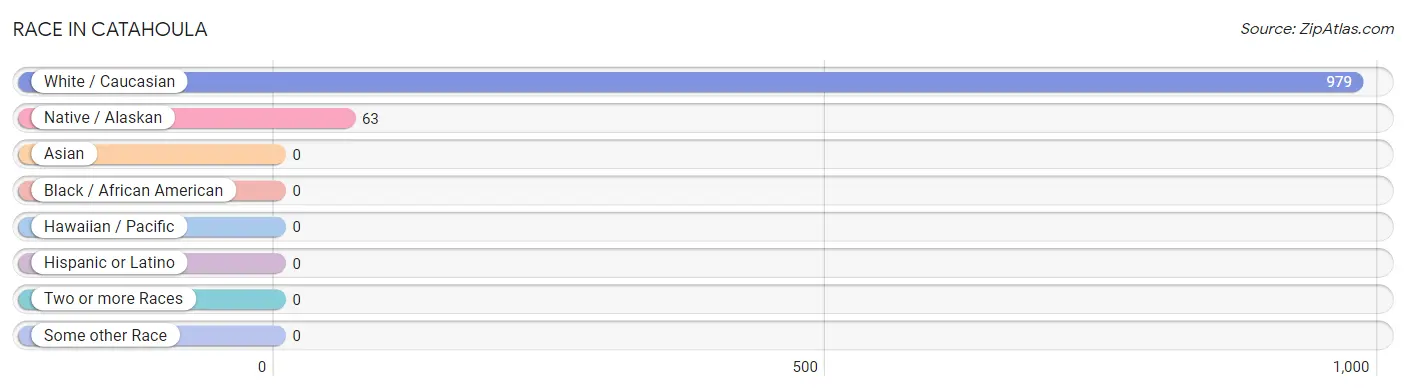
Race in Catahoula
The most populous races in Catahoula are White / Caucasian (979 | 94.0%), and Native / Alaskan (63 | 6.0%).
| Race | # Population | % Population |
| Asian | 0 | 0.0% |
| Black / African American | 0 | 0.0% |
| Hawaiian / Pacific | 0 | 0.0% |
| Hispanic or Latino | 0 | 0.0% |
| Native / Alaskan | 63 | 6.0% |
| White / Caucasian | 979 | 94.0% |
| Two or more Races | 0 | 0.0% |
| Some other Race | 0 | 0.0% |
| Total | 1,042 | 100.0% |
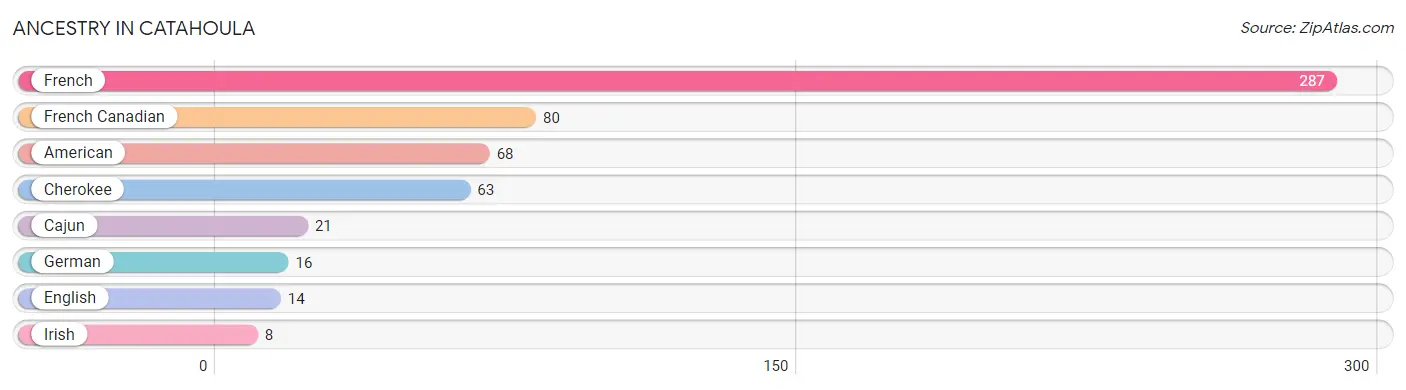
Ancestry in Catahoula
The most populous ancestries reported in Catahoula are French (287 | 27.5%), French Canadian (80 | 7.7%), American (68 | 6.5%), Cherokee (63 | 6.0%), and Cajun (21 | 2.0%), together accounting for 49.8% of all Catahoula residents.
| Ancestry | # Population | % Population |
| American | 68 | 6.5% |
| Cajun | 21 | 2.0% |
| Cherokee | 63 | 6.0% |
| English | 14 | 1.3% |
| French | 287 | 27.5% |
| French Canadian | 80 | 7.7% |
| German | 16 | 1.5% |
| Irish | 8 | 0.8% | View All 8 Rows |
Immigrants in Catahoula

| Immigration Origin | # Population | % Population | View All 0 Rows |
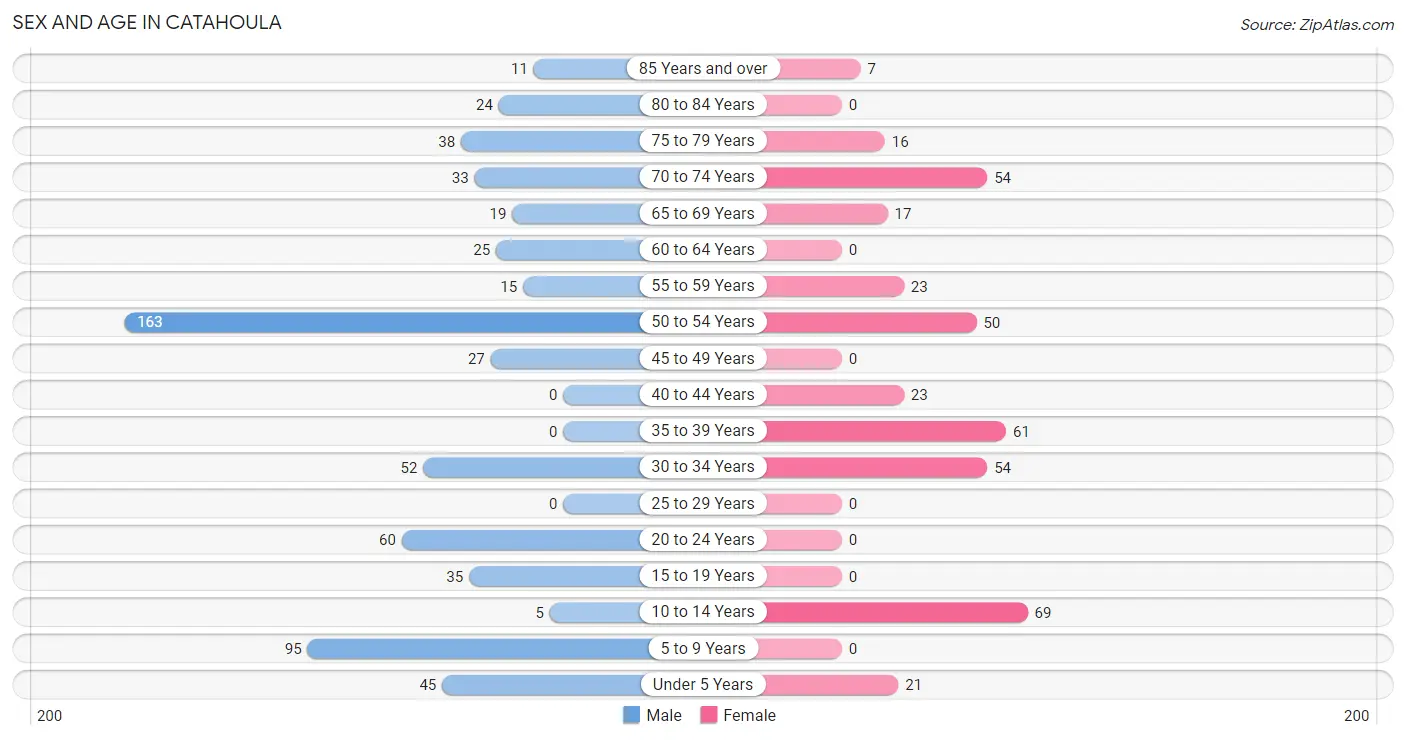
Sex and Age in Catahoula
Sex and Age in Catahoula
The most populous age groups in Catahoula are 50 to 54 Years (163 | 25.2%) for men and 10 to 14 Years (69 | 17.5%) for women.
| Age Bracket | Male | Female |
| Under 5 Years | 45 (7.0%) | 21 (5.3%) |
| 5 to 9 Years | 95 (14.7%) | 0 (0.0%) |
| 10 to 14 Years | 5 (0.8%) | 69 (17.5%) |
| 15 to 19 Years | 35 (5.4%) | 0 (0.0%) |
| 20 to 24 Years | 60 (9.3%) | 0 (0.0%) |
| 25 to 29 Years | 0 (0.0%) | 0 (0.0%) |
| 30 to 34 Years | 52 (8.0%) | 54 (13.7%) |
| 35 to 39 Years | 0 (0.0%) | 61 (15.4%) |
| 40 to 44 Years | 0 (0.0%) | 23 (5.8%) |
| 45 to 49 Years | 27 (4.2%) | 0 (0.0%) |
| 50 to 54 Years | 163 (25.2%) | 50 (12.7%) |
| 55 to 59 Years | 15 (2.3%) | 23 (5.8%) |
| 60 to 64 Years | 25 (3.9%) | 0 (0.0%) |
| 65 to 69 Years | 19 (2.9%) | 17 (4.3%) |
| 70 to 74 Years | 33 (5.1%) | 54 (13.7%) |
| 75 to 79 Years | 38 (5.9%) | 16 (4.1%) |
| 80 to 84 Years | 24 (3.7%) | 0 (0.0%) |
| 85 Years and over | 11 (1.7%) | 7 (1.8%) |
| Total | 647 (100.0%) | 395 (100.0%) |
Families and Households in Catahoula
Median Family Size in Catahoula
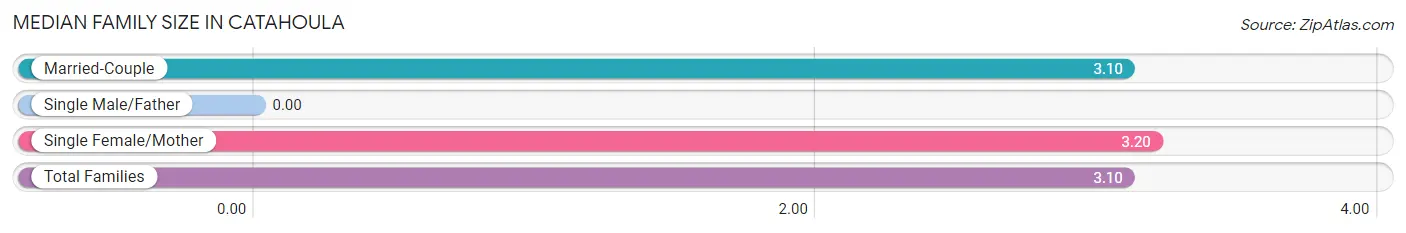
| Family Type | # Families | Family Size |
| Married-Couple | 291 (98.3%) | 3.10 |
| Single Male/Father | 0 (0.0%) | - |
| Single Female/Mother | 5 (1.7%) | 3.20 |
| Total Families | 296 (100.0%) | 3.10 |
Median Household Size in Catahoula
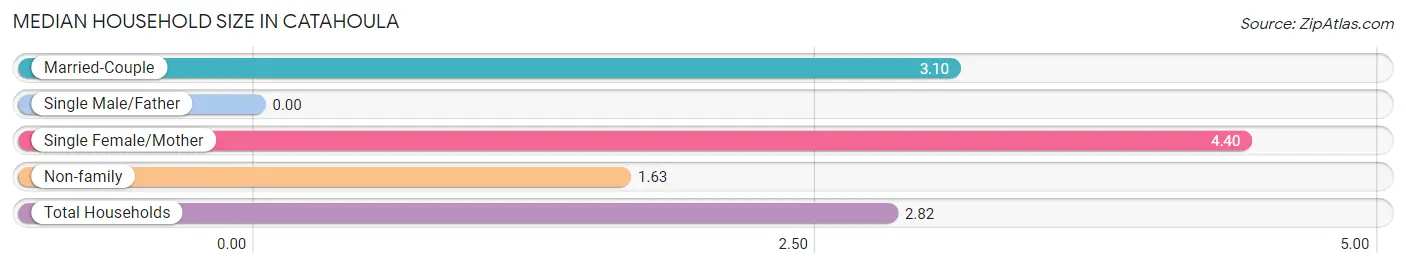
| Household Type | # Households | Household Size |
| Married-Couple | 291 (78.9%) | 3.10 |
| Single Male/Father | 0 (0.0%) | - |
| Single Female/Mother | 5 (1.4%) | 4.40 |
| Non-family | 73 (19.8%) | 1.63 |
| Total Households | 369 (100.0%) | 2.82 |
Household Size by Marriage Status in Catahoula
Out of a total of 369 households in Catahoula, 296 (80.2%) are family households, while 73 (19.8%) are nonfamily households. The most numerous type of family households are 4-person households, comprising 135, and the most common type of nonfamily households are 2-person households, comprising 54.
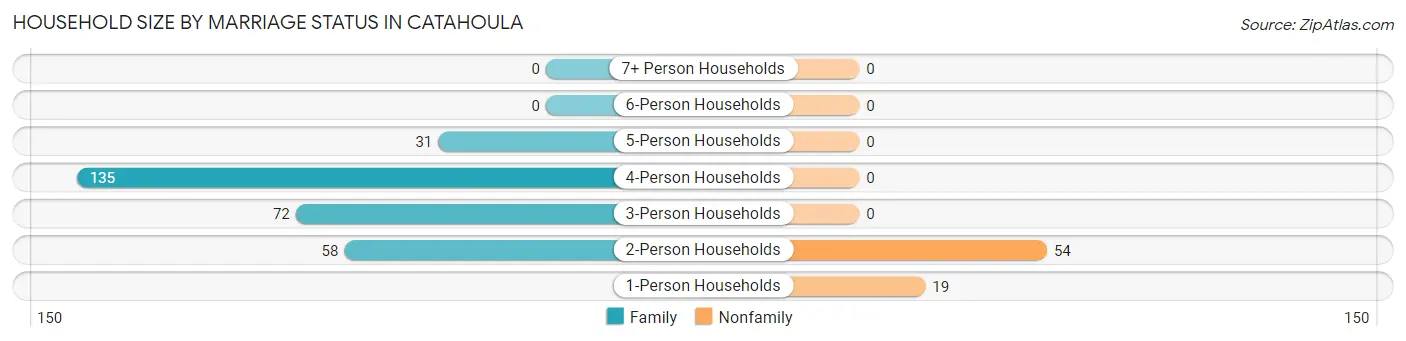
| Household Size | Family Households | Nonfamily Households |
| 1-Person Households | - | 19 (5.1%) |
| 2-Person Households | 58 (15.7%) | 54 (14.6%) |
| 3-Person Households | 72 (19.5%) | 0 (0.0%) |
| 4-Person Households | 135 (36.6%) | 0 (0.0%) |
| 5-Person Households | 31 (8.4%) | 0 (0.0%) |
| 6-Person Households | 0 (0.0%) | 0 (0.0%) |
| 7+ Person Households | 0 (0.0%) | 0 (0.0%) |
| Total | 296 (80.2%) | 73 (19.8%) |
Female Fertility in Catahoula
Fertility by Age in Catahoula
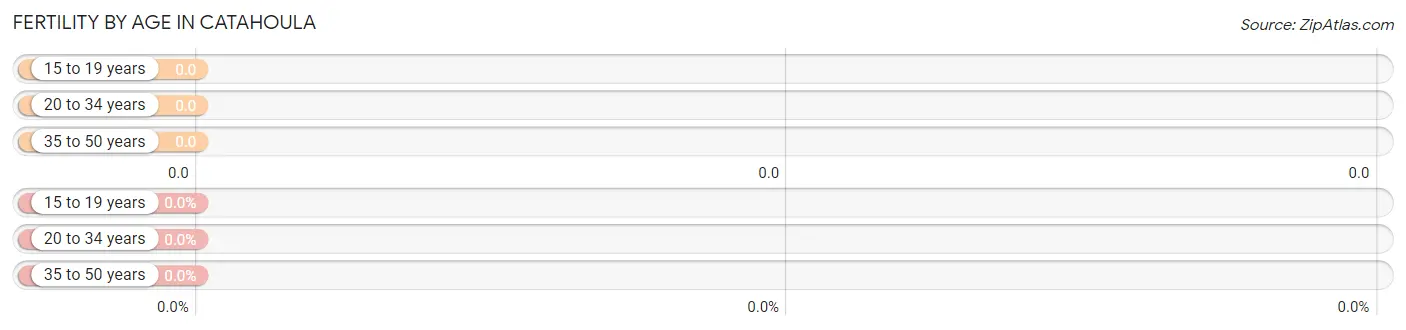
| Age Bracket | Women with Births | Births / 1,000 Women |
| 15 to 19 years | 0 (0.0%) | 0.0 |
| 20 to 34 years | 0 (0.0%) | 0.0 |
| 35 to 50 years | 0 (0.0%) | 0.0 |
| Total | 0 (0.0%) | 0.0 |
Fertility by Age by Marriage Status in Catahoula
| Age Bracket | Married | Unmarried |
| 15 to 19 years | 0 (0.0%) | 0 (0.0%) |
| 20 to 34 years | 0 (0.0%) | 0 (0.0%) |
| 35 to 50 years | 0 (0.0%) | 0 (0.0%) |
| Total | 0 (0.0%) | 0 (0.0%) |
Fertility by Education in Catahoula
| Educational Attainment | Women with Births | Births / 1,000 Women |
| Less than High School | 0 (0.0%) | 0.0 |
| High School Diploma | 0 (0.0%) | 0.0 |
| College or Associate's Degree | 0 (0.0%) | 0.0 |
| Bachelor's Degree | 0 (0.0%) | 0.0 |
| Graduate Degree | 0 (0.0%) | 0.0 |
| Total | 0 (0.0%) | 0.0 |
Fertility by Education by Marriage Status in Catahoula
| Educational Attainment | Married | Unmarried |
| Less than High School | 0 (0.0%) | 0 (0.0%) |
| High School Diploma | 0 (0.0%) | 0 (0.0%) |
| College or Associate's Degree | 0 (0.0%) | 0 (0.0%) |
| Bachelor's Degree | 0 (0.0%) | 0 (0.0%) |
| Graduate Degree | 0 (0.0%) | 0 (0.0%) |
| Total | 0 (0.0%) | 0 (0.0%) |
Income in Catahoula
Income Overview in Catahoula
Per Capita Income in Catahoula is $28,620, while median incomes of families and households are $108,571 and $87,772 respectively.
| Characteristic | Number | Measure |
| Per Capita Income | 1,042 | $28,620 |
| Median Family Income | 296 | $108,571 |
| Mean Family Income | 296 | $95,874 |
| Median Household Income | 369 | $87,772 |
| Mean Household Income | 369 | $85,383 |
| Income Deficit | 296 | $0 |
| Wage / Income Gap (%) | 1,042 | 56.94% |
| Wage / Income Gap ($) | 1,042 | 43.06¢ per $1 |
| Gini / Inequality Index | 1,042 | 0.37 |
Earnings by Sex in Catahoula
Average Earnings in Catahoula are $47,775, $66,713 for men and $28,727 for women, a difference of 56.9%.
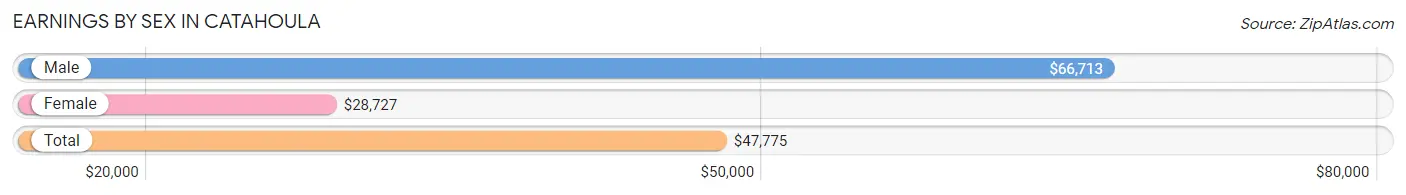
| Sex | Number | Average Earnings |
| Male | 349 (69.1%) | $66,713 |
| Female | 156 (30.9%) | $28,727 |
| Total | 505 (100.0%) | $47,775 |
Earnings by Sex by Income Bracket in Catahoula
The most common earnings brackets in Catahoula are $65,000 to $74,999 for men (146 | 41.8%) and $25,000 to $29,999 for women (55 | 35.3%).
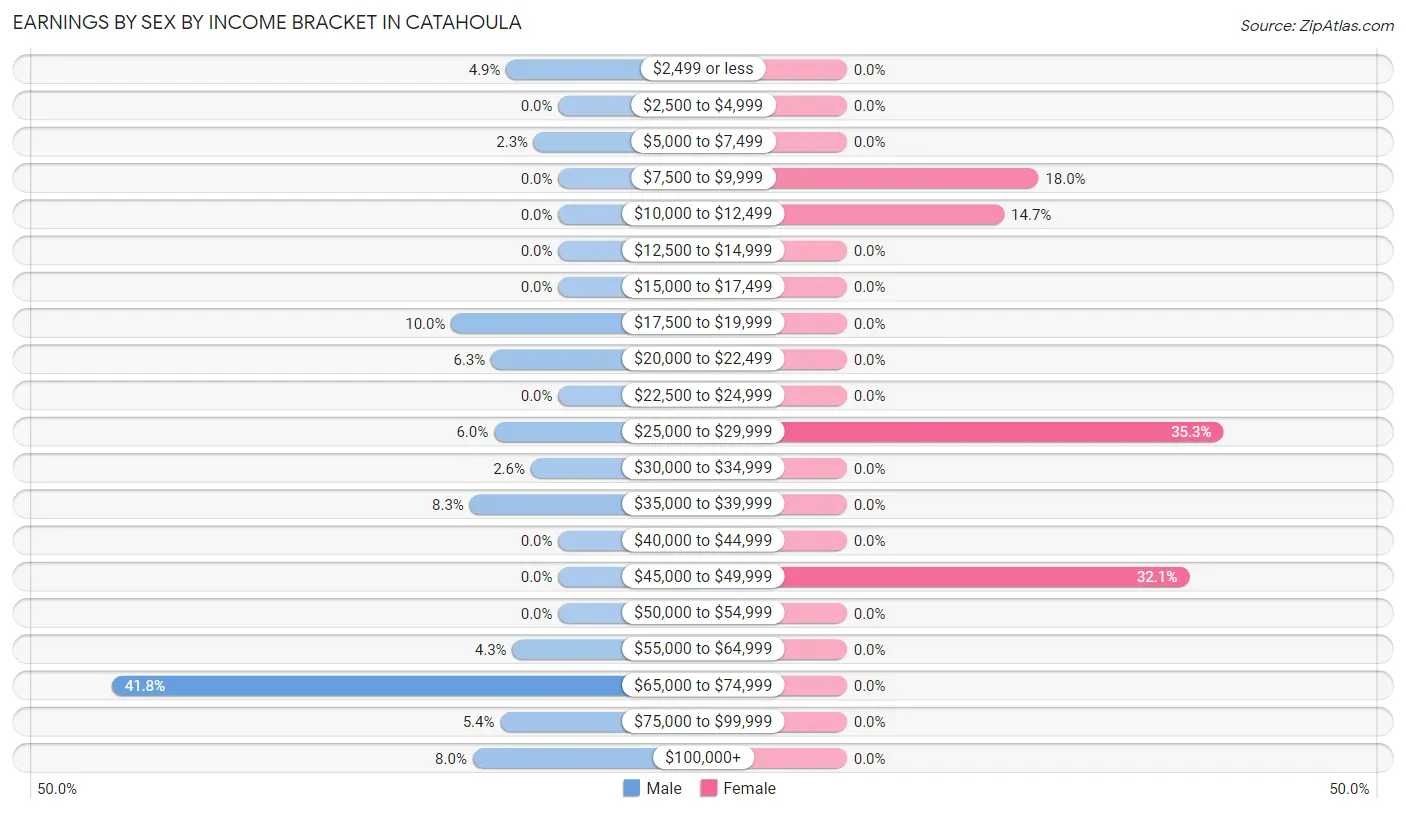
| Income | Male | Female |
| $2,499 or less | 17 (4.9%) | 0 (0.0%) |
| $2,500 to $4,999 | 0 (0.0%) | 0 (0.0%) |
| $5,000 to $7,499 | 8 (2.3%) | 0 (0.0%) |
| $7,500 to $9,999 | 0 (0.0%) | 28 (17.9%) |
| $10,000 to $12,499 | 0 (0.0%) | 23 (14.7%) |
| $12,500 to $14,999 | 0 (0.0%) | 0 (0.0%) |
| $15,000 to $17,499 | 0 (0.0%) | 0 (0.0%) |
| $17,500 to $19,999 | 35 (10.0%) | 0 (0.0%) |
| $20,000 to $22,499 | 22 (6.3%) | 0 (0.0%) |
| $22,500 to $24,999 | 0 (0.0%) | 0 (0.0%) |
| $25,000 to $29,999 | 21 (6.0%) | 55 (35.3%) |
| $30,000 to $34,999 | 9 (2.6%) | 0 (0.0%) |
| $35,000 to $39,999 | 29 (8.3%) | 0 (0.0%) |
| $40,000 to $44,999 | 0 (0.0%) | 0 (0.0%) |
| $45,000 to $49,999 | 0 (0.0%) | 50 (32.1%) |
| $50,000 to $54,999 | 0 (0.0%) | 0 (0.0%) |
| $55,000 to $64,999 | 15 (4.3%) | 0 (0.0%) |
| $65,000 to $74,999 | 146 (41.8%) | 0 (0.0%) |
| $75,000 to $99,999 | 19 (5.4%) | 0 (0.0%) |
| $100,000+ | 28 (8.0%) | 0 (0.0%) |
| Total | 349 (100.0%) | 156 (100.0%) |
Earnings by Sex by Educational Attainment in Catahoula
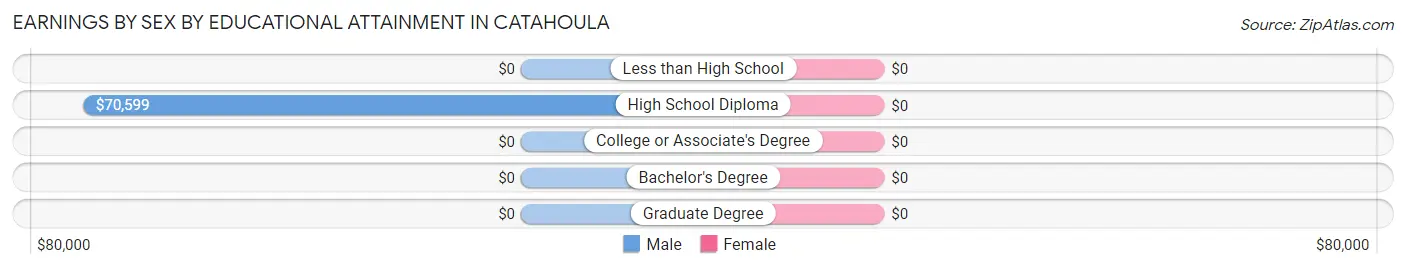
| Educational Attainment | Male Income | Female Income |
| Less than High School | - | - |
| High School Diploma | $70,599 | $0 |
| College or Associate's Degree | - | - |
| Bachelor's Degree | - | - |
| Graduate Degree | - | - |
| Total | $70,819 | $28,727 |
Family Income in Catahoula
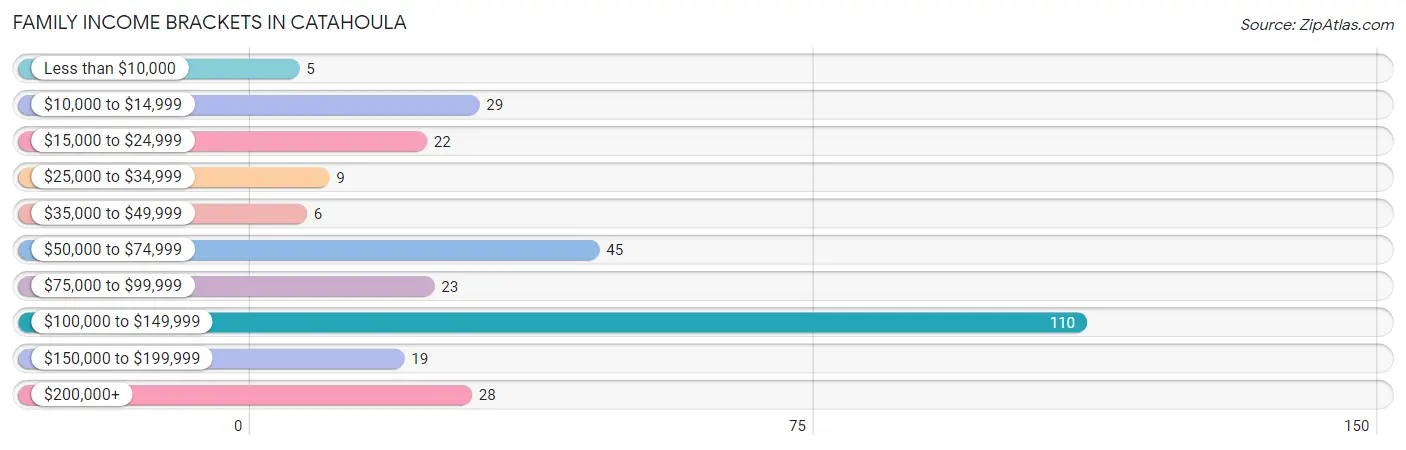
Family Income Brackets in Catahoula
According to the Catahoula family income data, there are 110 families falling into the $100,000 to $149,999 income range, which is the most common income bracket and makes up 37.2% of all families. Conversely, the less than $10,000 income bracket is the least frequent group with only 5 families (1.7%) belonging to this category.
| Income Bracket | # Families | % Families |
| Less than $10,000 | 5 | 1.7% |
| $10,000 to $14,999 | 29 | 9.8% |
| $15,000 to $24,999 | 22 | 7.4% |
| $25,000 to $34,999 | 9 | 3.0% |
| $35,000 to $49,999 | 6 | 2.0% |
| $50,000 to $74,999 | 45 | 15.2% |
| $75,000 to $99,999 | 23 | 7.8% |
| $100,000 to $149,999 | 110 | 37.2% |
| $150,000 to $199,999 | 19 | 6.4% |
| $200,000+ | 28 | 9.5% |
Family Income by Famaliy Size in Catahoula
4-person families (130 | 43.9%) account for the highest median family income in Catahoula with $121,208 per family, while 3-person families (77 | 26.0%) have the highest median income of $36,250 per family member.
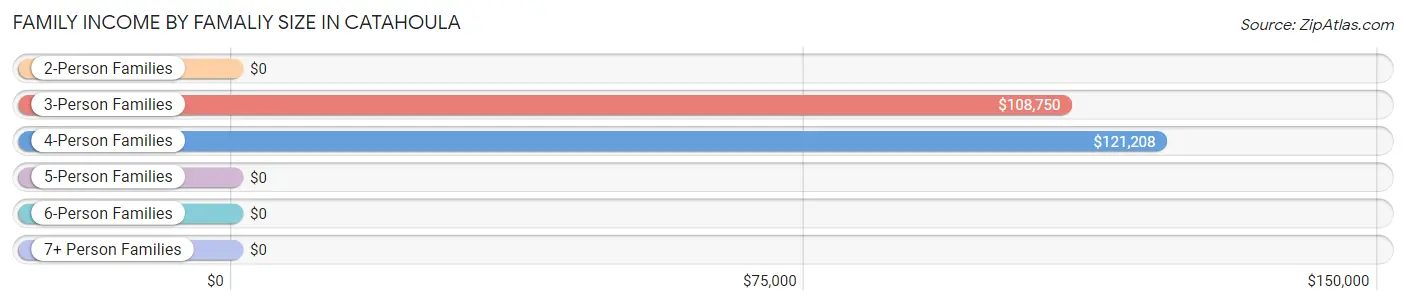
| Income Bracket | # Families | Median Income |
| 2-Person Families | 58 (19.6%) | $0 |
| 3-Person Families | 77 (26.0%) | $108,750 |
| 4-Person Families | 130 (43.9%) | $121,208 |
| 5-Person Families | 31 (10.5%) | $0 |
| 6-Person Families | 0 (0.0%) | $0 |
| 7+ Person Families | 0 (0.0%) | $0 |
| Total | 296 (100.0%) | $108,571 |
Family Income by Number of Earners in Catahoula
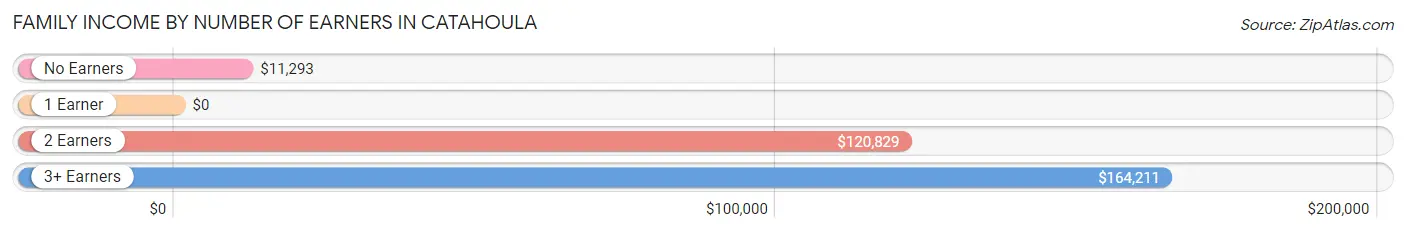
| Number of Earners | # Families | Median Income |
| No Earners | 40 (13.5%) | $11,293 |
| 1 Earner | 69 (23.3%) | $0 |
| 2 Earners | 119 (40.2%) | $120,829 |
| 3+ Earners | 68 (23.0%) | $164,211 |
| Total | 296 (100.0%) | $108,571 |
Household Income in Catahoula
Household Income Brackets in Catahoula
With 117 households falling in the category, the $100,000 to $149,999 income range is the most frequent in Catahoula, accounting for 31.7% of all households.
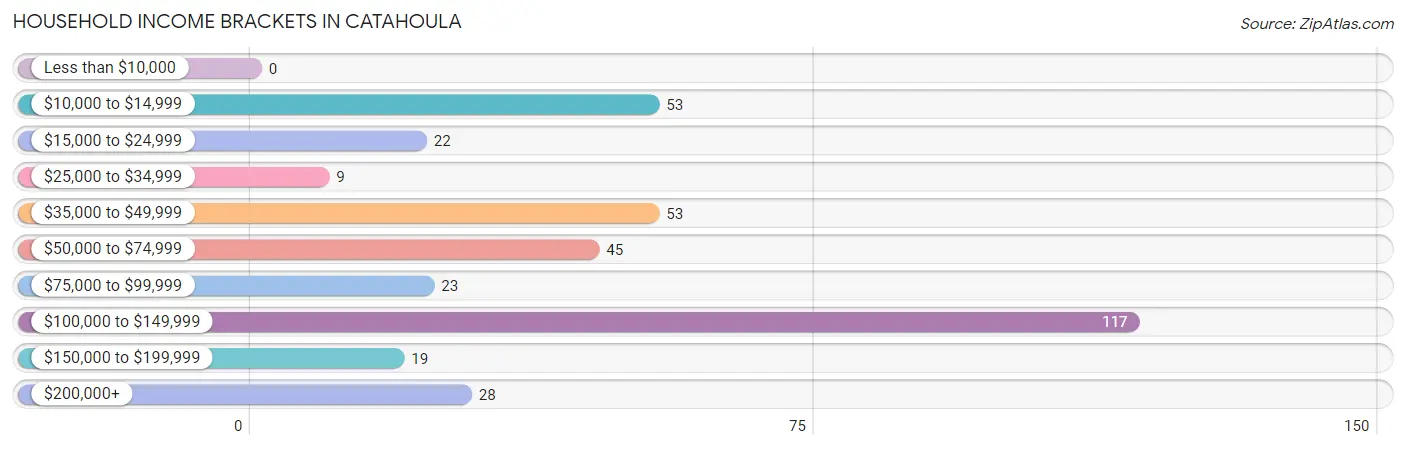
| Income Bracket | # Households | % Households |
| Less than $10,000 | 0 | 0.0% |
| $10,000 to $14,999 | 53 | 14.4% |
| $15,000 to $24,999 | 22 | 6.0% |
| $25,000 to $34,999 | 9 | 2.4% |
| $35,000 to $49,999 | 53 | 14.4% |
| $50,000 to $74,999 | 45 | 12.2% |
| $75,000 to $99,999 | 23 | 6.2% |
| $100,000 to $149,999 | 117 | 31.7% |
| $150,000 to $199,999 | 19 | 5.1% |
| $200,000+ | 28 | 7.6% |
Household Income by Householder Age in Catahoula
The median household income in Catahoula is $87,772, with the highest median household income of $121,615 found in the 45 to 64 years age bracket for the primary householder. A total of 157 households (42.5%) fall into this category.
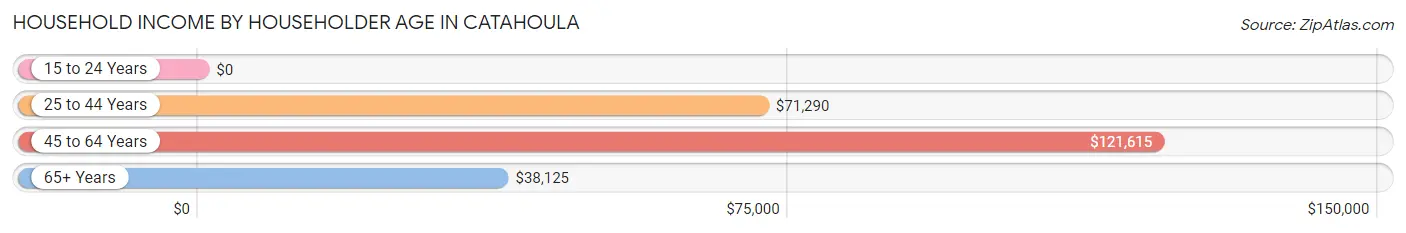
| Income Bracket | # Households | Median Income |
| 15 to 24 Years | 0 (0.0%) | $0 |
| 25 to 44 Years | 76 (20.6%) | $71,290 |
| 45 to 64 Years | 157 (42.5%) | $121,615 |
| 65+ Years | 136 (36.9%) | $38,125 |
| Total | 369 (100.0%) | $87,772 |
Poverty in Catahoula
Income Below Poverty by Sex and Age in Catahoula
With 14.1% poverty level for males and 20.0% for females among the residents of Catahoula, 25 to 34 year old males and under 5 year old females are the most vulnerable to poverty, with 22 males (42.3%) and 21 females (100.0%) in their respective age groups living below the poverty level.
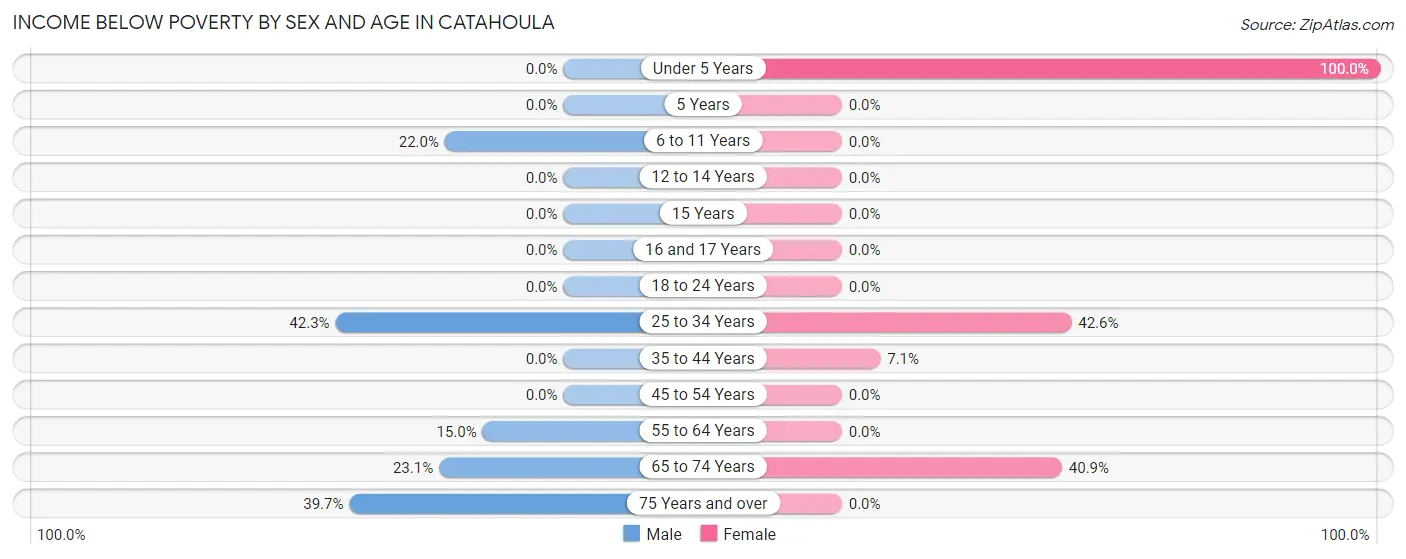
| Age Bracket | Male | Female |
| Under 5 Years | 0 (0.0%) | 21 (100.0%) |
| 5 Years | 0 (0.0%) | 0 (0.0%) |
| 6 to 11 Years | 22 (22.0%) | 0 (0.0%) |
| 12 to 14 Years | 0 (0.0%) | 0 (0.0%) |
| 15 Years | 0 (0.0%) | 0 (0.0%) |
| 16 and 17 Years | 0 (0.0%) | 0 (0.0%) |
| 18 to 24 Years | 0 (0.0%) | 0 (0.0%) |
| 25 to 34 Years | 22 (42.3%) | 23 (42.6%) |
| 35 to 44 Years | 0 (0.0%) | 6 (7.1%) |
| 45 to 54 Years | 0 (0.0%) | 0 (0.0%) |
| 55 to 64 Years | 6 (15.0%) | 0 (0.0%) |
| 65 to 74 Years | 12 (23.1%) | 29 (40.8%) |
| 75 Years and over | 29 (39.7%) | 0 (0.0%) |
| Total | 91 (14.1%) | 79 (20.0%) |
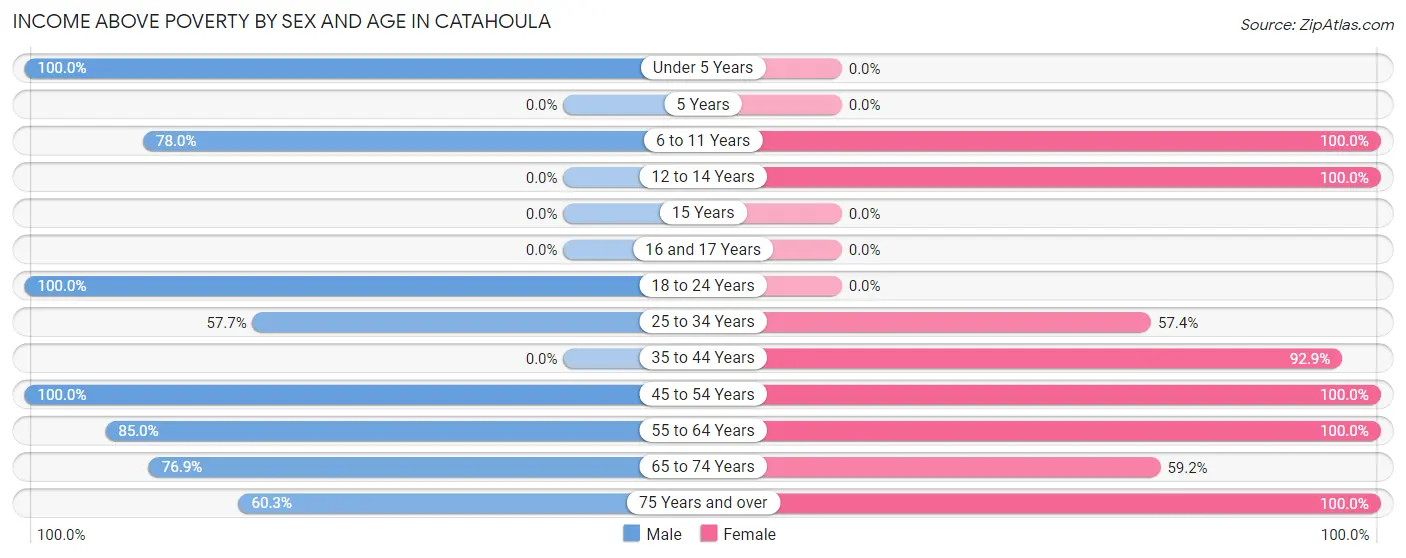
Income Above Poverty by Sex and Age in Catahoula
According to the poverty statistics in Catahoula, males aged under 5 years and females aged 6 to 11 years are the age groups that are most secure financially, with 100.0% of males and 100.0% of females in these age groups living above the poverty line.
| Age Bracket | Male | Female |
| Under 5 Years | 45 (100.0%) | 0 (0.0%) |
| 5 Years | 0 (0.0%) | 0 (0.0%) |
| 6 to 11 Years | 78 (78.0%) | 49 (100.0%) |
| 12 to 14 Years | 0 (0.0%) | 20 (100.0%) |
| 15 Years | 0 (0.0%) | 0 (0.0%) |
| 16 and 17 Years | 0 (0.0%) | 0 (0.0%) |
| 18 to 24 Years | 95 (100.0%) | 0 (0.0%) |
| 25 to 34 Years | 30 (57.7%) | 31 (57.4%) |
| 35 to 44 Years | 0 (0.0%) | 78 (92.9%) |
| 45 to 54 Years | 190 (100.0%) | 50 (100.0%) |
| 55 to 64 Years | 34 (85.0%) | 23 (100.0%) |
| 65 to 74 Years | 40 (76.9%) | 42 (59.2%) |
| 75 Years and over | 44 (60.3%) | 23 (100.0%) |
| Total | 556 (85.9%) | 316 (80.0%) |
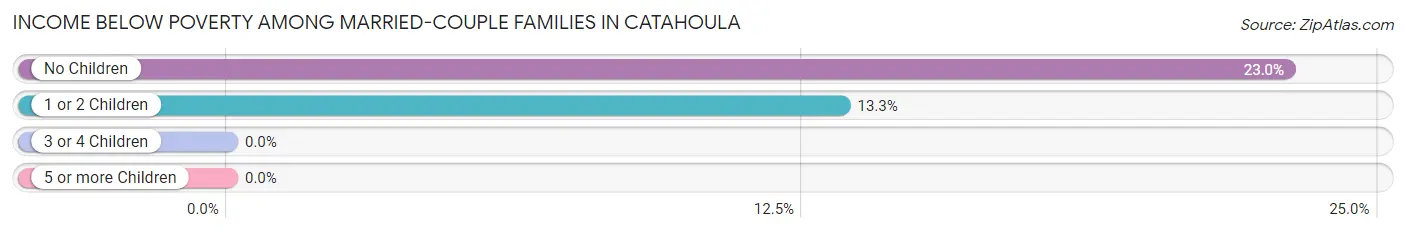
Income Below Poverty Among Married-Couple Families in Catahoula
The poverty statistics for married-couple families in Catahoula show that 17.5% or 51 of the total 291 families live below the poverty line. Families with no children have the highest poverty rate of 23.0%, comprising of 29 families. On the other hand, families with 1 or 2 children have the lowest poverty rate of 13.3%, which includes 22 families.
| Children | Above Poverty | Below Poverty |
| No Children | 97 (77.0%) | 29 (23.0%) |
| 1 or 2 Children | 143 (86.7%) | 22 (13.3%) |
| 3 or 4 Children | 0 (0.0%) | 0 (0.0%) |
| 5 or more Children | 0 (0.0%) | 0 (0.0%) |
| Total | 240 (82.5%) | 51 (17.5%) |
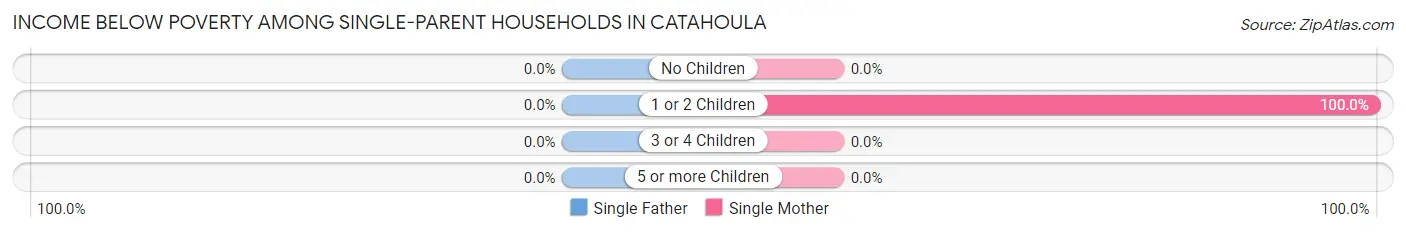
Income Below Poverty Among Single-Parent Households in Catahoula
| Children | Single Father | Single Mother |
| No Children | 0 (0.0%) | 0 (0.0%) |
| 1 or 2 Children | 0 (0.0%) | 5 (100.0%) |
| 3 or 4 Children | 0 (0.0%) | 0 (0.0%) |
| 5 or more Children | 0 (0.0%) | 0 (0.0%) |
| Total | 0 (0.0%) | 5 (100.0%) |
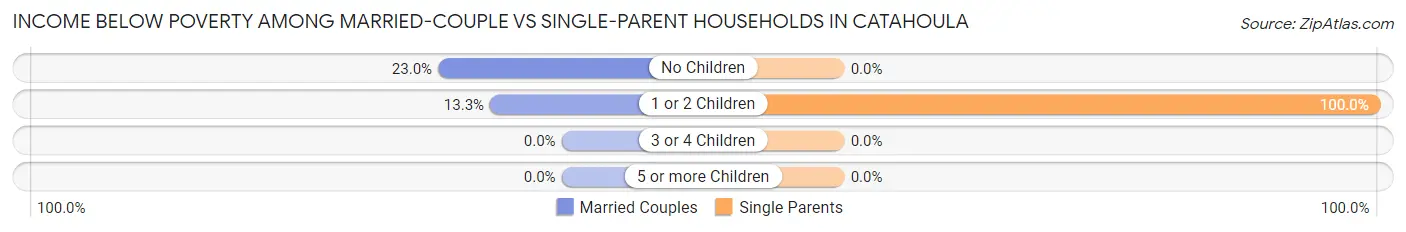
Income Below Poverty Among Married-Couple vs Single-Parent Households in Catahoula
The poverty data for Catahoula shows that 51 of the married-couple family households (17.5%) and 5 of the single-parent households (100.0%) are living below the poverty level. Within the married-couple family households, those with no children have the highest poverty rate, with 29 households (23.0%) falling below the poverty line. Among the single-parent households, those with 1 or 2 children have the highest poverty rate, with 5 household (100.0%) living below poverty.
| Children | Married-Couple Families | Single-Parent Households |
| No Children | 29 (23.0%) | 0 (0.0%) |
| 1 or 2 Children | 22 (13.3%) | 5 (100.0%) |
| 3 or 4 Children | 0 (0.0%) | 0 (0.0%) |
| 5 or more Children | 0 (0.0%) | 0 (0.0%) |
| Total | 51 (17.5%) | 5 (100.0%) |
Employment Characteristics in Catahoula
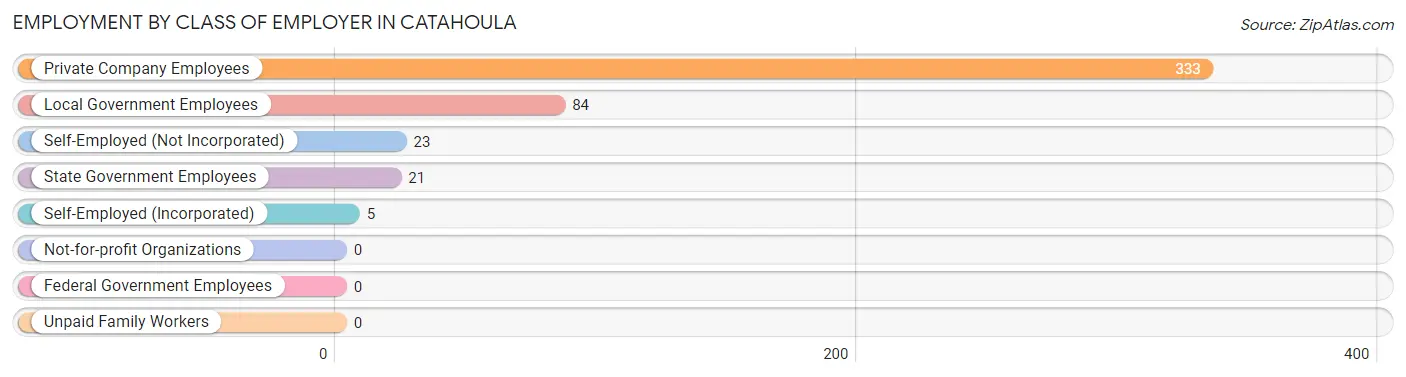
Employment by Class of Employer in Catahoula
Among the 466 employed individuals in Catahoula, private company employees (333 | 71.5%), local government employees (84 | 18.0%), and self-employed (not incorporated) (23 | 4.9%) make up the most common classes of employment.
| Employer Class | # Employees | % Employees |
| Private Company Employees | 333 | 71.5% |
| Self-Employed (Incorporated) | 5 | 1.1% |
| Self-Employed (Not Incorporated) | 23 | 4.9% |
| Not-for-profit Organizations | 0 | 0.0% |
| Local Government Employees | 84 | 18.0% |
| State Government Employees | 21 | 4.5% |
| Federal Government Employees | 0 | 0.0% |
| Unpaid Family Workers | 0 | 0.0% |
| Total | 466 | 100.0% |
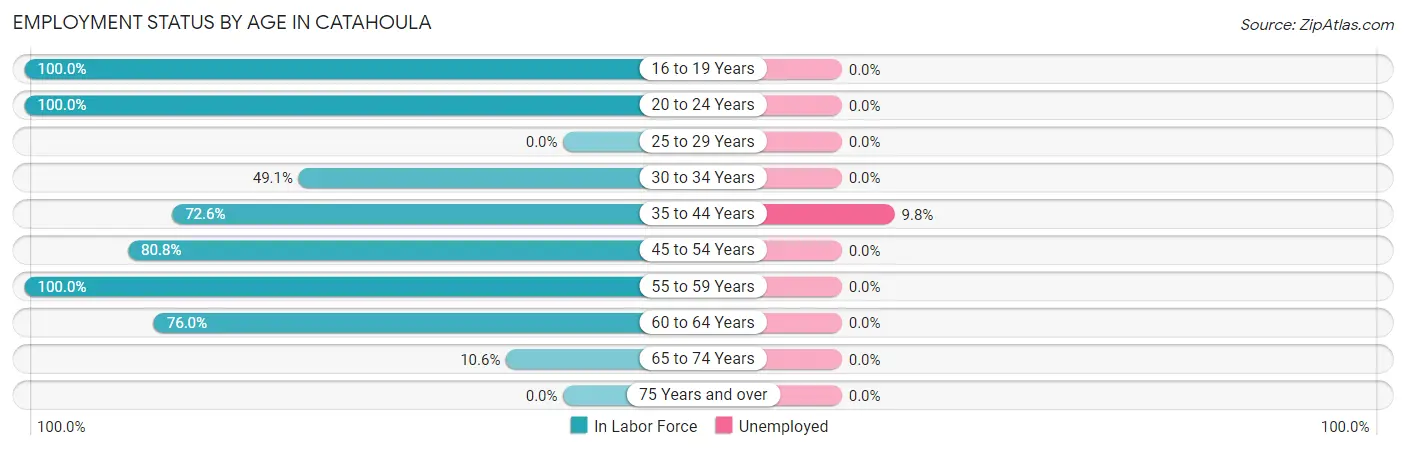
Employment Status by Age in Catahoula
According to the labor force statistics for Catahoula, out of the total population over 16 years of age (807), 58.5% or 472 individuals are in the labor force, with 1.3% or 6 of them unemployed. The age group with the highest labor force participation rate is 16 to 19 years, with 100.0% or 35 individuals in the labor force. Within the labor force, the 35 to 44 years age range has the highest percentage of unemployed individuals, with 9.8% or 6 of them being unemployed.
| Age Bracket | In Labor Force | Unemployed |
| 16 to 19 Years | 35 (100.0%) | 0 (0.0%) |
| 20 to 24 Years | 60 (100.0%) | 0 (0.0%) |
| 25 to 29 Years | 0 (0.0%) | 0 (0.0%) |
| 30 to 34 Years | 52 (49.1%) | 0 (0.0%) |
| 35 to 44 Years | 61 (72.6%) | 6 (9.8%) |
| 45 to 54 Years | 194 (80.8%) | 0 (0.0%) |
| 55 to 59 Years | 38 (100.0%) | 0 (0.0%) |
| 60 to 64 Years | 19 (76.0%) | 0 (0.0%) |
| 65 to 74 Years | 13 (10.6%) | 0 (0.0%) |
| 75 Years and over | 0 (0.0%) | 0 (0.0%) |
| Total | 472 (58.5%) | 6 (1.3%) |
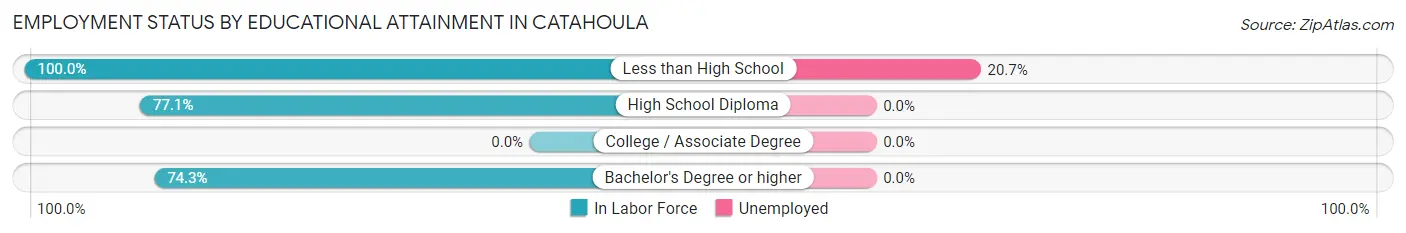
Employment Status by Educational Attainment in Catahoula
According to labor force statistics for Catahoula, 73.8% of individuals (364) out of the total population between 25 and 64 years of age (493) are in the labor force, with 1.6% or 6 of them being unemployed. The group with the highest labor force participation rate are those with the educational attainment of less than high school, with 100.0% or 29 individuals in the labor force. Within the labor force, individuals with less than high school education have the highest percentage of unemployment, with 20.7% or 6 of them being unemployed.
| Educational Attainment | In Labor Force | Unemployed |
| Less than High School | 29 (100.0%) | 6 (20.7%) |
| High School Diploma | 202 (77.1%) | 0 (0.0%) |
| College / Associate Degree | 0 (0.0%) | 0 (0.0%) |
| Bachelor's Degree or higher | 133 (74.3%) | 0 (0.0%) |
| Total | 364 (73.8%) | 8 (1.6%) |
Employment Occupations by Sex in Catahoula
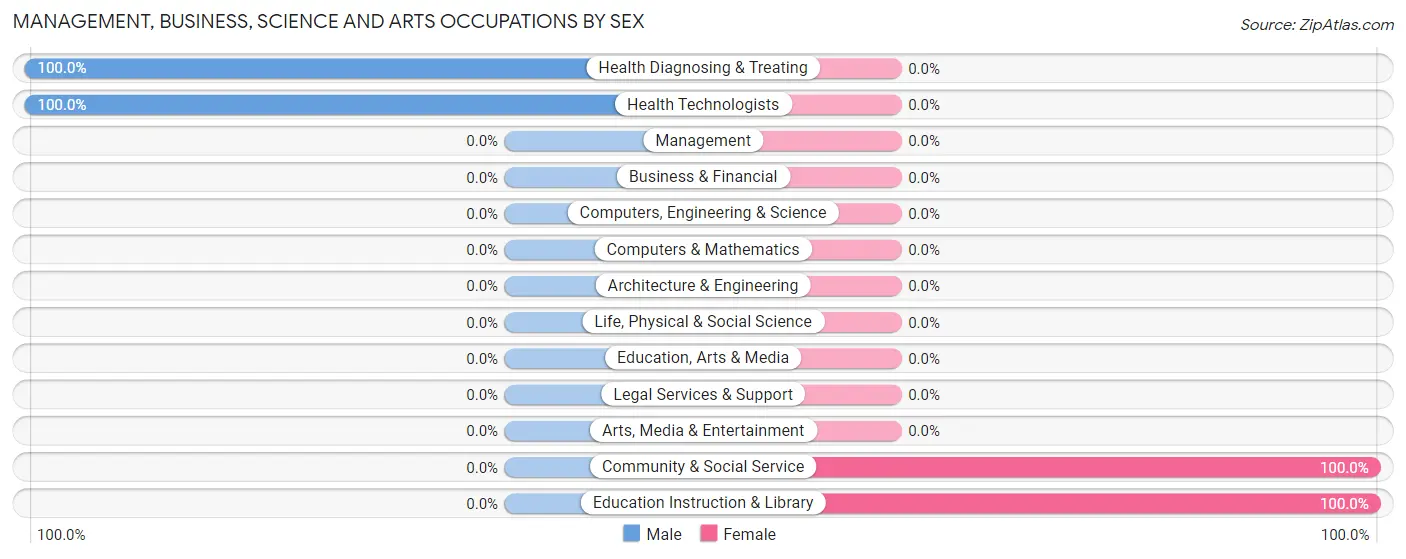
Management, Business, Science and Arts Occupations
The most common Management, Business, Science and Arts occupations in Catahoula are Community & Social Service (50 | 10.7%), Education Instruction & Library (50 | 10.7%), Health Diagnosing & Treating (28 | 6.0%), and Health Technologists (28 | 6.0%).
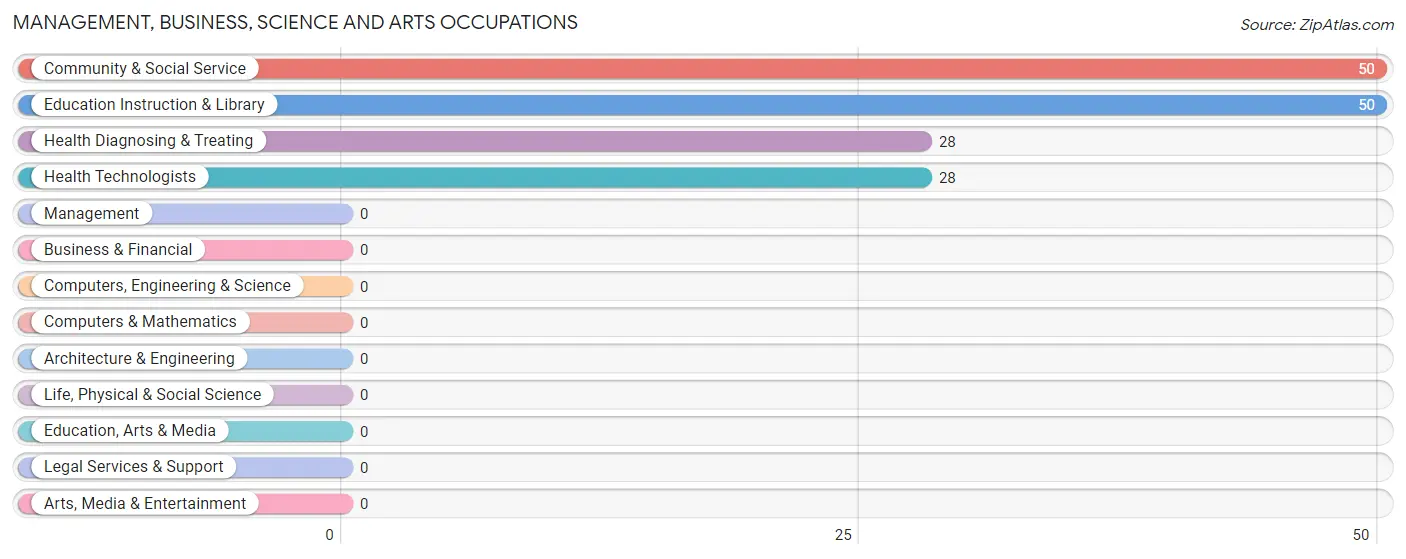
Management, Business, Science and Arts Occupations by Sex
Within the Management, Business, Science and Arts occupations in Catahoula, the most male-oriented occupations are Health Diagnosing & Treating (100.0%), and Health Technologists (100.0%), while the most female-oriented occupations are Community & Social Service (100.0%), and Education Instruction & Library (100.0%).
| Occupation | Male | Female |
| Management | 0 (0.0%) | 0 (0.0%) |
| Business & Financial | 0 (0.0%) | 0 (0.0%) |
| Computers, Engineering & Science | 0 (0.0%) | 0 (0.0%) |
| Computers & Mathematics | 0 (0.0%) | 0 (0.0%) |
| Architecture & Engineering | 0 (0.0%) | 0 (0.0%) |
| Life, Physical & Social Science | 0 (0.0%) | 0 (0.0%) |
| Community & Social Service | 0 (0.0%) | 50 (100.0%) |
| Education, Arts & Media | 0 (0.0%) | 0 (0.0%) |
| Legal Services & Support | 0 (0.0%) | 0 (0.0%) |
| Education Instruction & Library | 0 (0.0%) | 50 (100.0%) |
| Arts, Media & Entertainment | 0 (0.0%) | 0 (0.0%) |
| Health Diagnosing & Treating | 28 (100.0%) | 0 (0.0%) |
| Health Technologists | 28 (100.0%) | 0 (0.0%) |
| Total (Category) | 28 (35.9%) | 50 (64.1%) |
| Total (Overall) | 333 (71.5%) | 133 (28.5%) |
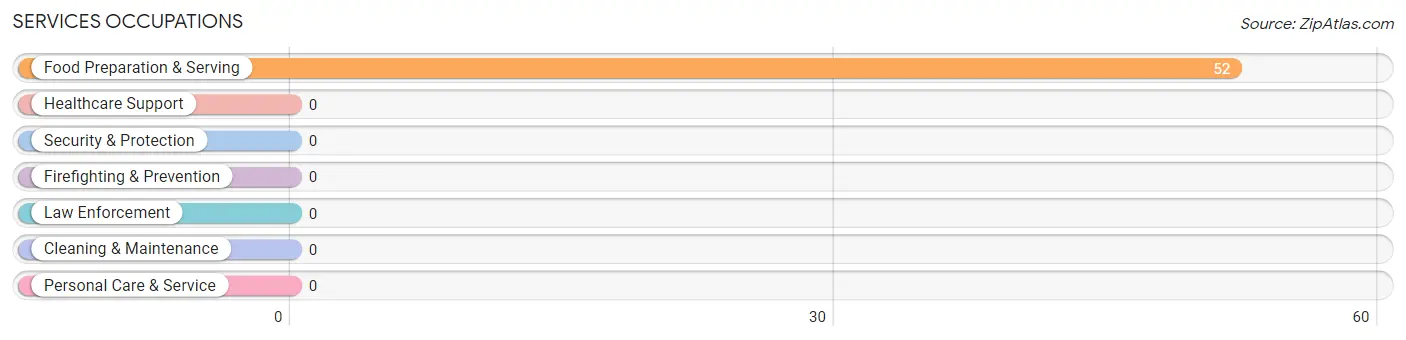
Services Occupations
The most common Services occupations in Catahoula are , and Food Preparation & Serving (52 | 11.2%).
Services Occupations by Sex
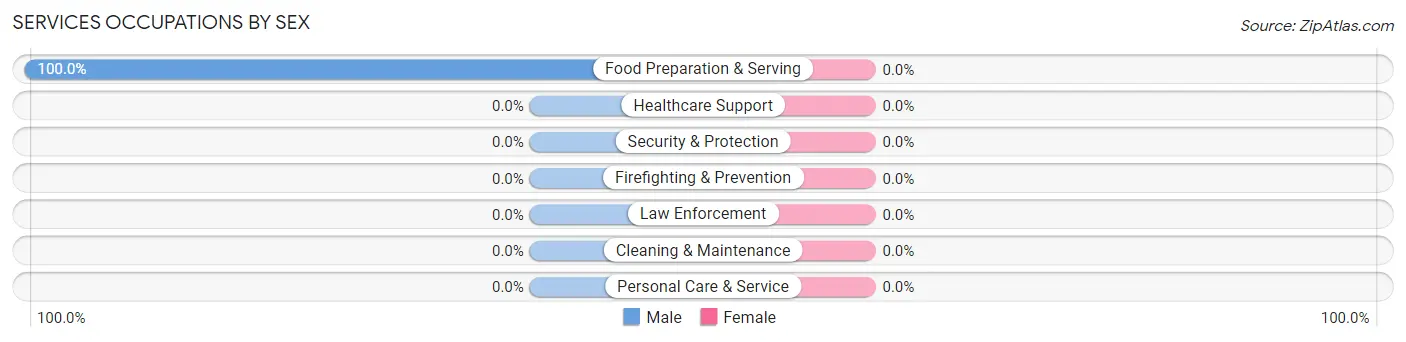
| Occupation | Male | Female |
| Healthcare Support | 0 (0.0%) | 0 (0.0%) |
| Security & Protection | 0 (0.0%) | 0 (0.0%) |
| Firefighting & Prevention | 0 (0.0%) | 0 (0.0%) |
| Law Enforcement | 0 (0.0%) | 0 (0.0%) |
| Food Preparation & Serving | 52 (100.0%) | 0 (0.0%) |
| Cleaning & Maintenance | 0 (0.0%) | 0 (0.0%) |
| Personal Care & Service | 0 (0.0%) | 0 (0.0%) |
| Total (Category) | 52 (100.0%) | 0 (0.0%) |
| Total (Overall) | 333 (71.5%) | 133 (28.5%) |
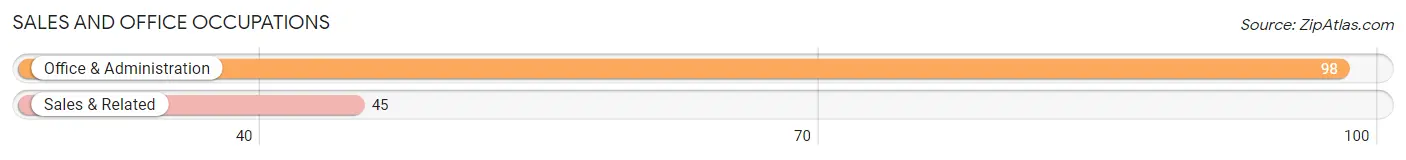
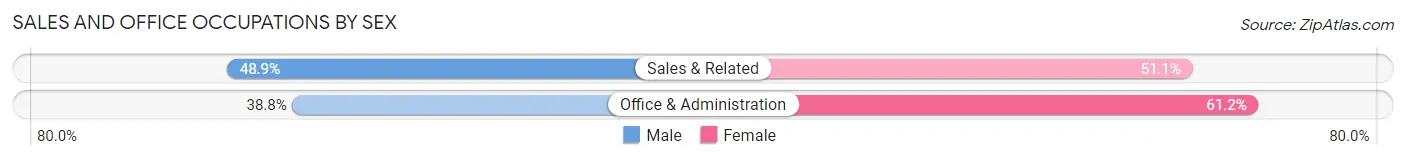
Sales and Office Occupations
The most common Sales and Office occupations in Catahoula are Office & Administration (98 | 21.0%), and Sales & Related (45 | 9.7%).
Sales and Office Occupations by Sex
| Occupation | Male | Female |
| Sales & Related | 22 (48.9%) | 23 (51.1%) |
| Office & Administration | 38 (38.8%) | 60 (61.2%) |
| Total (Category) | 60 (42.0%) | 83 (58.0%) |
| Total (Overall) | 333 (71.5%) | 133 (28.5%) |
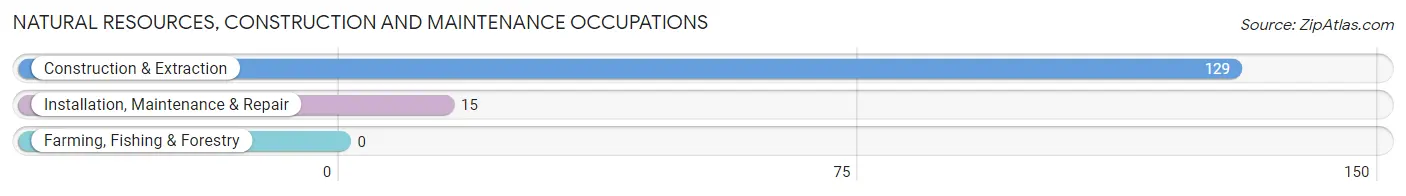
Natural Resources, Construction and Maintenance Occupations
The most common Natural Resources, Construction and Maintenance occupations in Catahoula are Construction & Extraction (129 | 27.7%), and Installation, Maintenance & Repair (15 | 3.2%).
Natural Resources, Construction and Maintenance Occupations by Sex
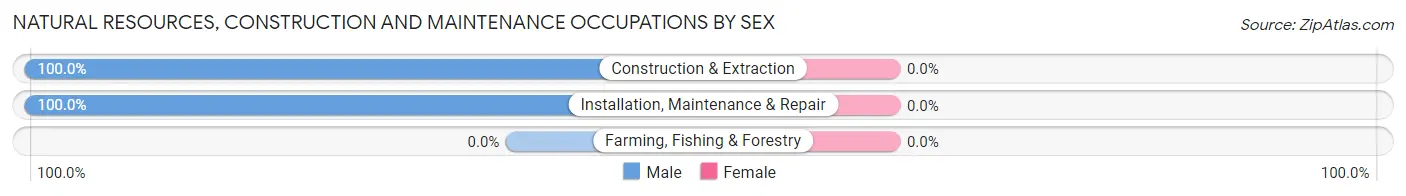
| Occupation | Male | Female |
| Farming, Fishing & Forestry | 0 (0.0%) | 0 (0.0%) |
| Construction & Extraction | 129 (100.0%) | 0 (0.0%) |
| Installation, Maintenance & Repair | 15 (100.0%) | 0 (0.0%) |
| Total (Category) | 144 (100.0%) | 0 (0.0%) |
| Total (Overall) | 333 (71.5%) | 133 (28.5%) |
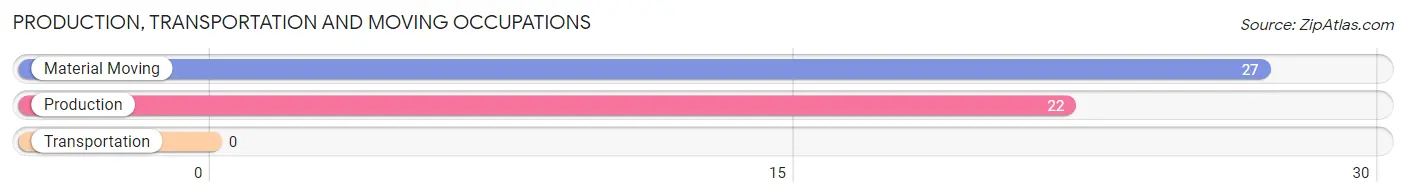
Production, Transportation and Moving Occupations
The most common Production, Transportation and Moving occupations in Catahoula are Material Moving (27 | 5.8%), and Production (22 | 4.7%).
Production, Transportation and Moving Occupations by Sex
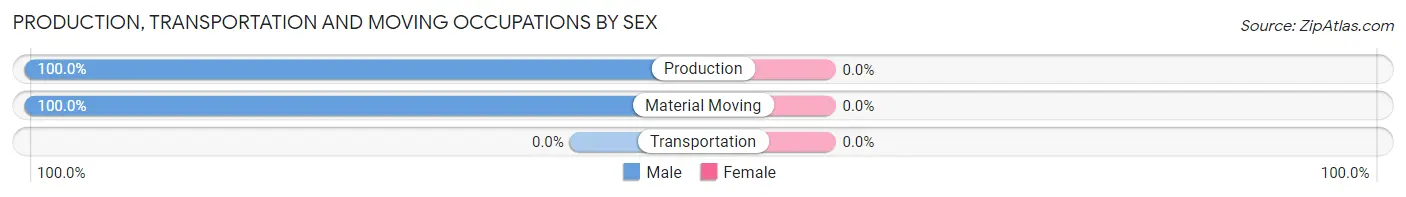
| Occupation | Male | Female |
| Production | 22 (100.0%) | 0 (0.0%) |
| Transportation | 0 (0.0%) | 0 (0.0%) |
| Material Moving | 27 (100.0%) | 0 (0.0%) |
| Total (Category) | 49 (100.0%) | 0 (0.0%) |
| Total (Overall) | 333 (71.5%) | 133 (28.5%) |
Employment Industries by Sex in Catahoula
Employment Industries in Catahoula
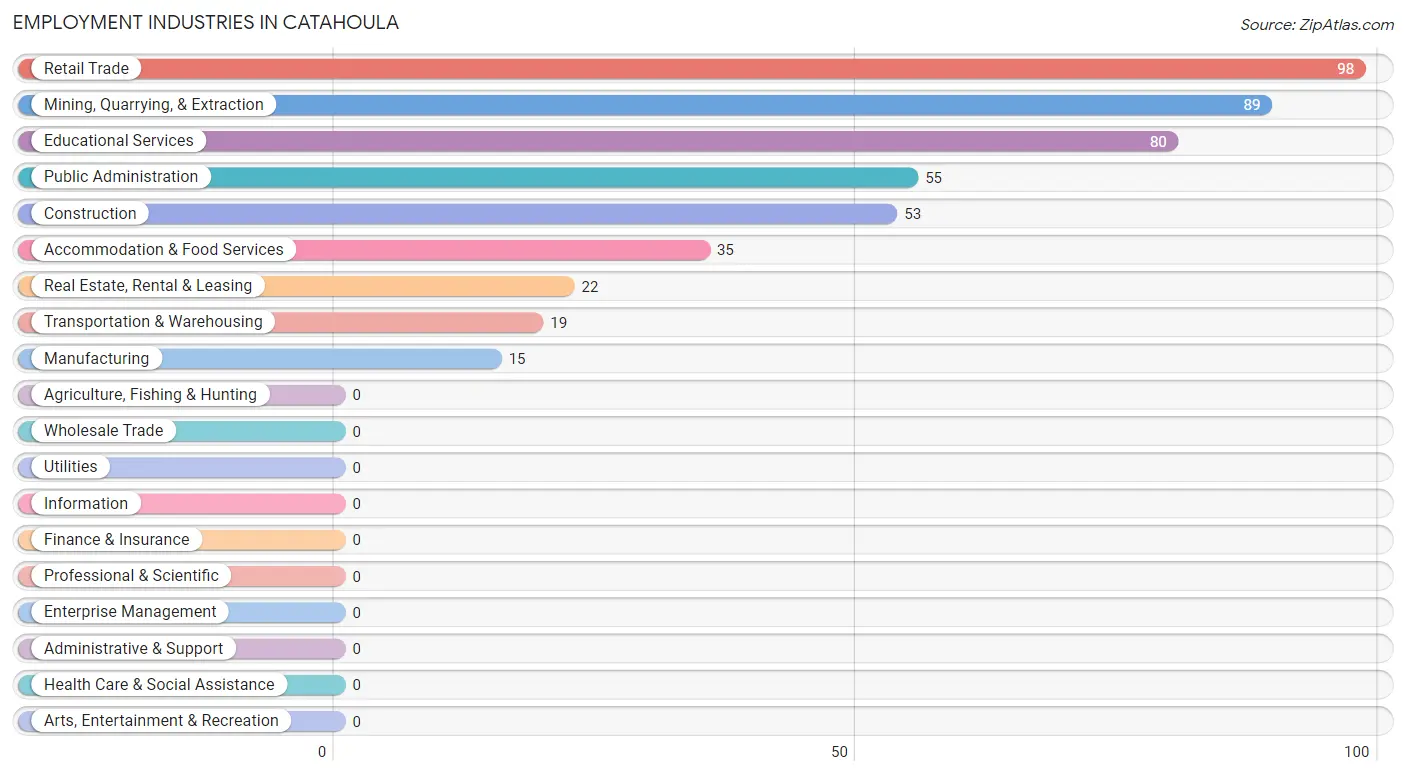
The major employment industries in Catahoula include Retail Trade (98 | 21.0%), Mining, Quarrying, & Extraction (89 | 19.1%), Educational Services (80 | 17.2%), Public Administration (55 | 11.8%), and Construction (53 | 11.4%).
Employment Industries by Sex in Catahoula
The Catahoula industries that see more men than women are Mining, Quarrying, & Extraction (100.0%), Manufacturing (100.0%), and Transportation & Warehousing (100.0%), whereas the industries that tend to have a higher number of women are Public Administration (100.0%), Educational Services (62.5%), and Retail Trade (23.5%).
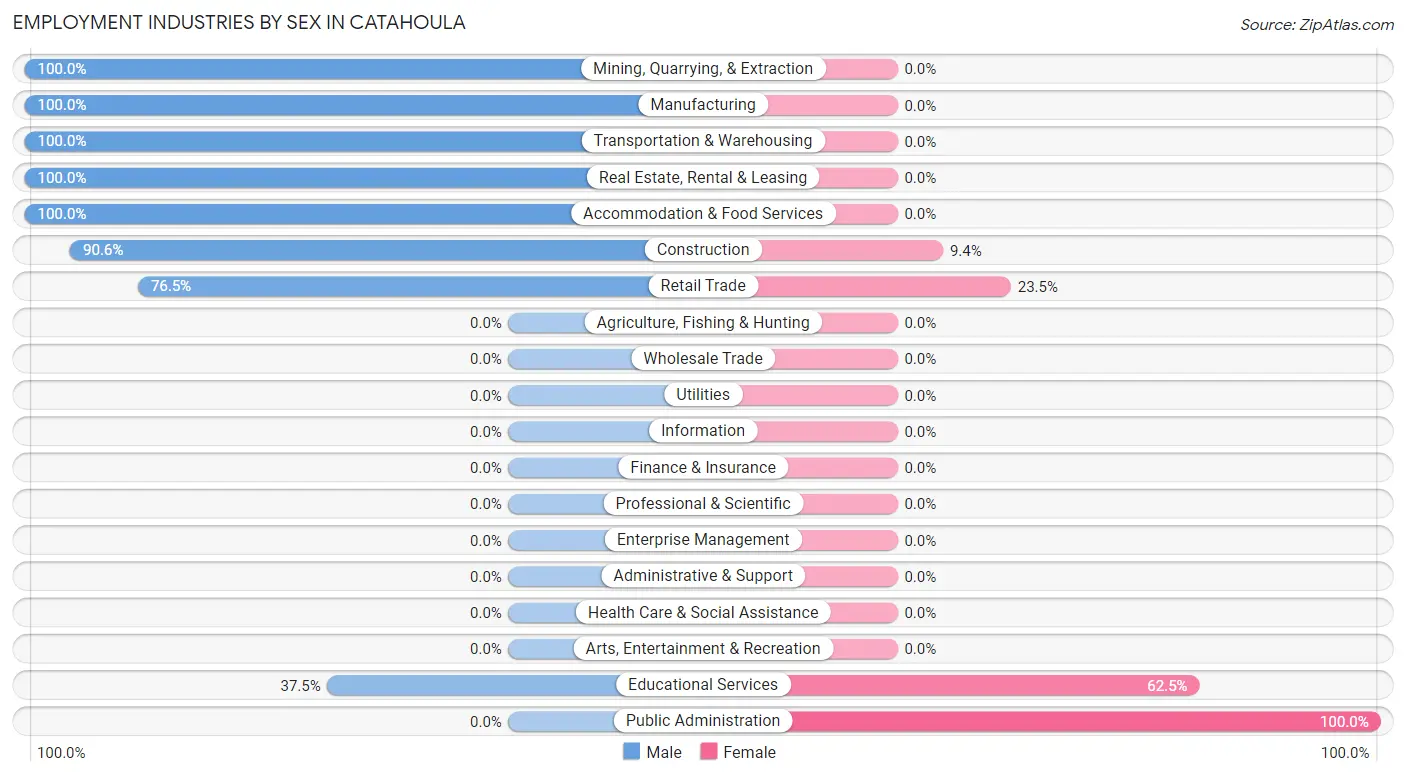
| Industry | Male | Female |
| Agriculture, Fishing & Hunting | 0 (0.0%) | 0 (0.0%) |
| Mining, Quarrying, & Extraction | 89 (100.0%) | 0 (0.0%) |
| Construction | 48 (90.6%) | 5 (9.4%) |
| Manufacturing | 15 (100.0%) | 0 (0.0%) |
| Wholesale Trade | 0 (0.0%) | 0 (0.0%) |
| Retail Trade | 75 (76.5%) | 23 (23.5%) |
| Transportation & Warehousing | 19 (100.0%) | 0 (0.0%) |
| Utilities | 0 (0.0%) | 0 (0.0%) |
| Information | 0 (0.0%) | 0 (0.0%) |
| Finance & Insurance | 0 (0.0%) | 0 (0.0%) |
| Real Estate, Rental & Leasing | 22 (100.0%) | 0 (0.0%) |
| Professional & Scientific | 0 (0.0%) | 0 (0.0%) |
| Enterprise Management | 0 (0.0%) | 0 (0.0%) |
| Administrative & Support | 0 (0.0%) | 0 (0.0%) |
| Educational Services | 30 (37.5%) | 50 (62.5%) |
| Health Care & Social Assistance | 0 (0.0%) | 0 (0.0%) |
| Arts, Entertainment & Recreation | 0 (0.0%) | 0 (0.0%) |
| Accommodation & Food Services | 35 (100.0%) | 0 (0.0%) |
| Public Administration | 0 (0.0%) | 55 (100.0%) |
| Total | 333 (71.5%) | 133 (28.5%) |
Education in Catahoula
School Enrollment in Catahoula
The most common levels of schooling among the 250 students in Catahoula are elementary school (95 | 38.0%), middle school (74 | 29.6%), and graduate / professional (46 | 18.4%).
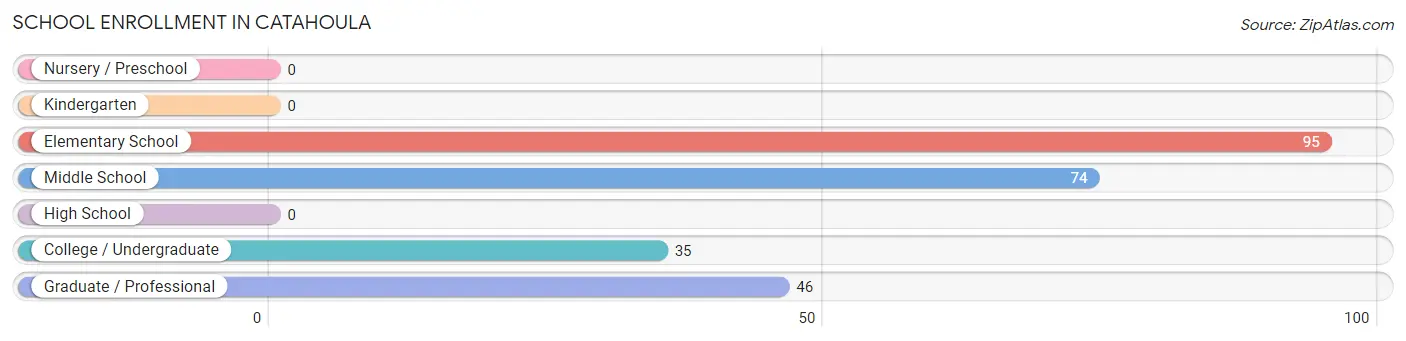
| School Level | # Students | % Students |
| Nursery / Preschool | 0 | 0.0% |
| Kindergarten | 0 | 0.0% |
| Elementary School | 95 | 38.0% |
| Middle School | 74 | 29.6% |
| High School | 0 | 0.0% |
| College / Undergraduate | 35 | 14.0% |
| Graduate / Professional | 46 | 18.4% |
| Total | 250 | 100.0% |
School Enrollment by Age by Funding Source in Catahoula
Out of a total of 250 students who are enrolled in schools in Catahoula, 35 (14.0%) attend a private institution, while the remaining 215 (86.0%) are enrolled in public schools. The age group of 18 to 19 year olds has the highest likelihood of being enrolled in private schools, with 35 (100.0% in the age bracket) enrolled. Conversely, the age group of 5 to 9 year old has the lowest likelihood of being enrolled in a private school, with 95 (100.0% in the age bracket) attending a public institution.
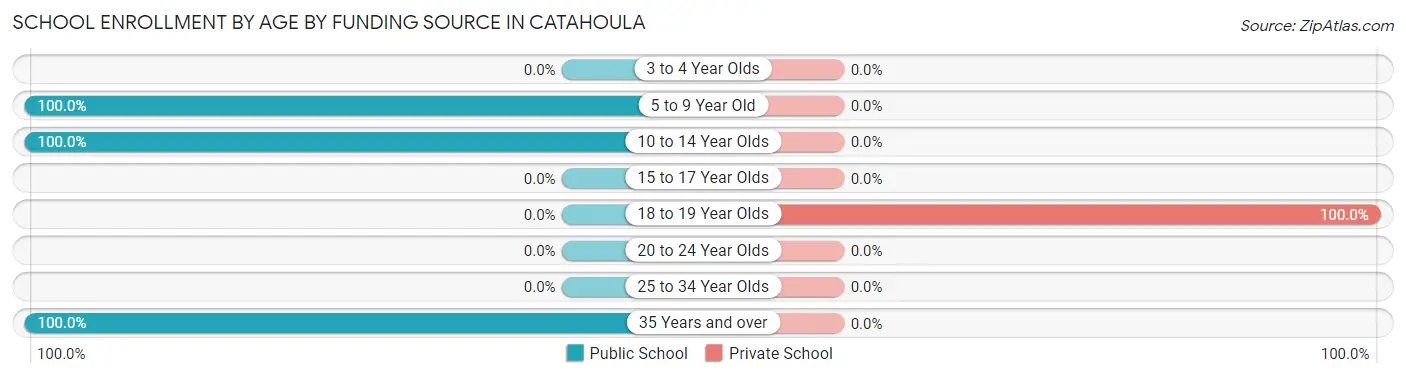
| Age Bracket | Public School | Private School |
| 3 to 4 Year Olds | 0 (0.0%) | 0 (0.0%) |
| 5 to 9 Year Old | 95 (100.0%) | 0 (0.0%) |
| 10 to 14 Year Olds | 74 (100.0%) | 0 (0.0%) |
| 15 to 17 Year Olds | 0 (0.0%) | 0 (0.0%) |
| 18 to 19 Year Olds | 0 (0.0%) | 35 (100.0%) |
| 20 to 24 Year Olds | 0 (0.0%) | 0 (0.0%) |
| 25 to 34 Year Olds | 0 (0.0%) | 0 (0.0%) |
| 35 Years and over | 46 (100.0%) | 0 (0.0%) |
| Total | 215 (86.0%) | 35 (14.0%) |
Educational Attainment by Field of Study in Catahoula
Education (57 | 30.6%), science & technology (55 | 29.6%), engineering (46 | 24.7%), and social sciences (28 | 15.0%) are the most common fields of study among 186 individuals in Catahoula who have obtained a bachelor's degree or higher.
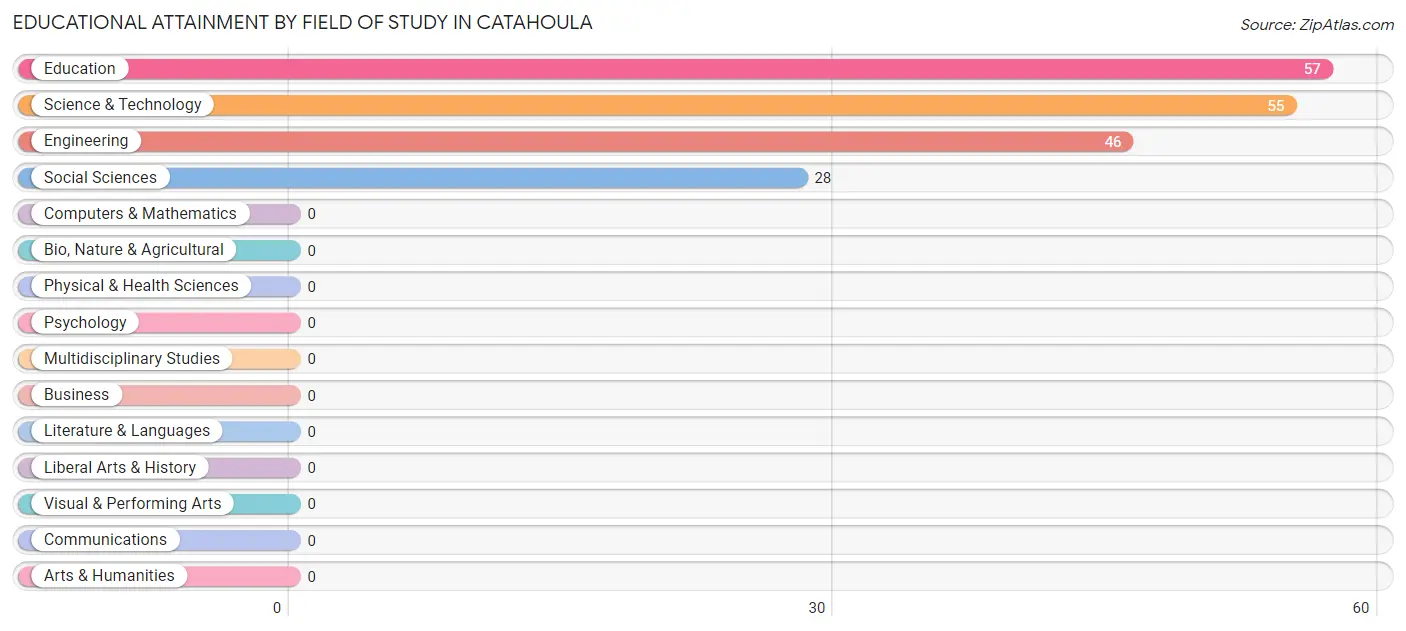
| Field of Study | # Graduates | % Graduates |
| Computers & Mathematics | 0 | 0.0% |
| Bio, Nature & Agricultural | 0 | 0.0% |
| Physical & Health Sciences | 0 | 0.0% |
| Psychology | 0 | 0.0% |
| Social Sciences | 28 | 15.0% |
| Engineering | 46 | 24.7% |
| Multidisciplinary Studies | 0 | 0.0% |
| Science & Technology | 55 | 29.6% |
| Business | 0 | 0.0% |
| Education | 57 | 30.6% |
| Literature & Languages | 0 | 0.0% |
| Liberal Arts & History | 0 | 0.0% |
| Visual & Performing Arts | 0 | 0.0% |
| Communications | 0 | 0.0% |
| Arts & Humanities | 0 | 0.0% |
| Total | 186 | 100.0% |
Transportation & Commute in Catahoula
Vehicle Availability by Sex in Catahoula
The most prevalent vehicle ownership categories in Catahoula are males with 2 vehicles (154, accounting for 46.3%) and females with 2 vehicles (55, making up 115.8%).
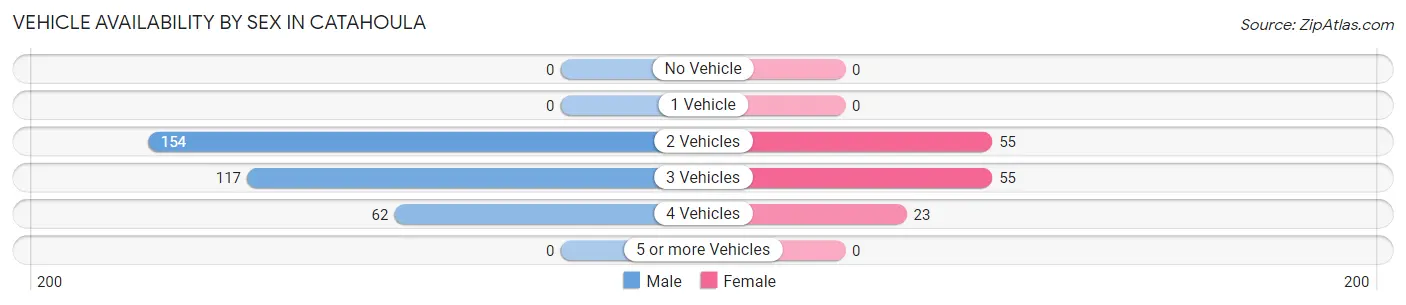
| Vehicles Available | Male | Female |
| No Vehicle | 0 (0.0%) | 0 (0.0%) |
| 1 Vehicle | 0 (0.0%) | 0 (0.0%) |
| 2 Vehicles | 154 (46.3%) | 55 (41.3%) |
| 3 Vehicles | 117 (35.1%) | 55 (41.3%) |
| 4 Vehicles | 62 (18.6%) | 23 (17.3%) |
| 5 or more Vehicles | 0 (0.0%) | 0 (0.0%) |
| Total | 333 (100.0%) | 133 (100.0%) |
Commute Time in Catahoula
The most frequently occuring commute durations in Catahoula are 15 to 19 minutes (77 commuters, 20.7%), 45 to 59 minutes (77 commuters, 20.7%), and 20 to 24 minutes (49 commuters, 13.2%).
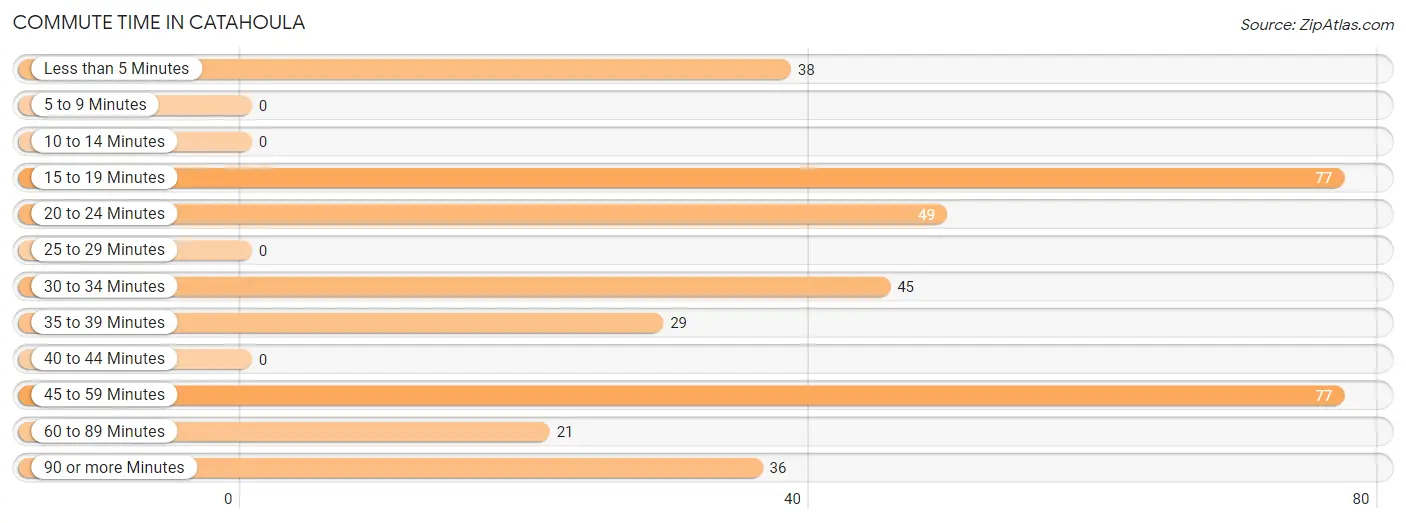
| Commute Time | # Commuters | % Commuters |
| Less than 5 Minutes | 38 | 10.2% |
| 5 to 9 Minutes | 0 | 0.0% |
| 10 to 14 Minutes | 0 | 0.0% |
| 15 to 19 Minutes | 77 | 20.7% |
| 20 to 24 Minutes | 49 | 13.2% |
| 25 to 29 Minutes | 0 | 0.0% |
| 30 to 34 Minutes | 45 | 12.1% |
| 35 to 39 Minutes | 29 | 7.8% |
| 40 to 44 Minutes | 0 | 0.0% |
| 45 to 59 Minutes | 77 | 20.7% |
| 60 to 89 Minutes | 21 | 5.7% |
| 90 or more Minutes | 36 | 9.7% |
Commute Time by Sex in Catahoula
The most common commute times in Catahoula are 45 to 59 minutes (77 commuters, 31.6%) for males and 15 to 19 minutes (55 commuters, 43.0%) for females.
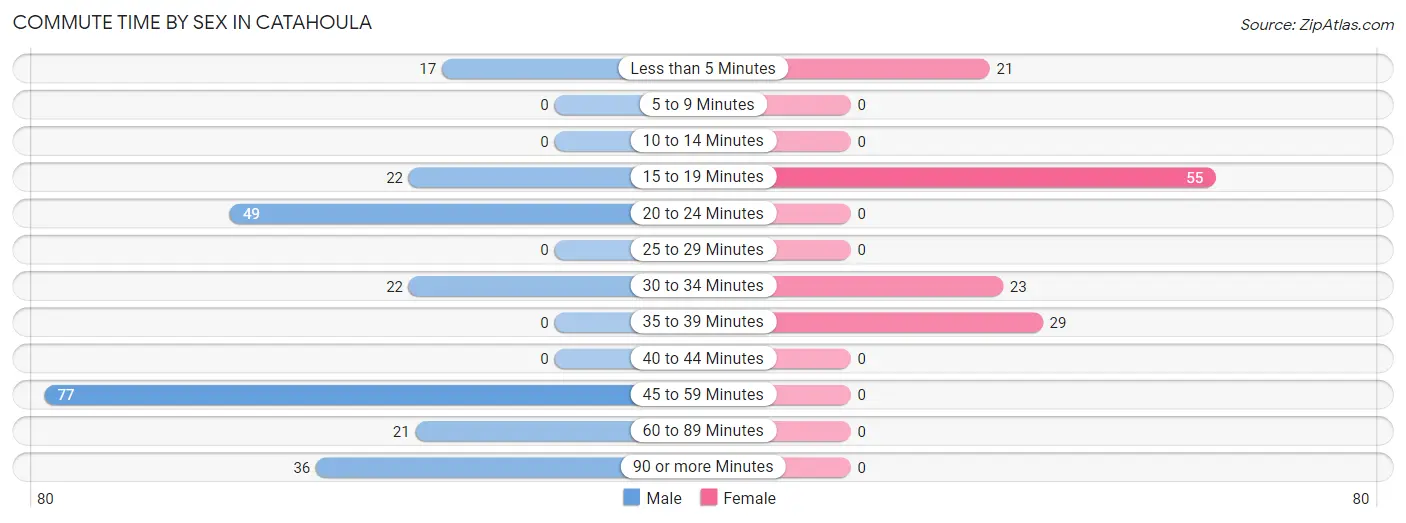
| Commute Time | Male | Female |
| Less than 5 Minutes | 17 (7.0%) | 21 (16.4%) |
| 5 to 9 Minutes | 0 (0.0%) | 0 (0.0%) |
| 10 to 14 Minutes | 0 (0.0%) | 0 (0.0%) |
| 15 to 19 Minutes | 22 (9.0%) | 55 (43.0%) |
| 20 to 24 Minutes | 49 (20.1%) | 0 (0.0%) |
| 25 to 29 Minutes | 0 (0.0%) | 0 (0.0%) |
| 30 to 34 Minutes | 22 (9.0%) | 23 (18.0%) |
| 35 to 39 Minutes | 0 (0.0%) | 29 (22.7%) |
| 40 to 44 Minutes | 0 (0.0%) | 0 (0.0%) |
| 45 to 59 Minutes | 77 (31.6%) | 0 (0.0%) |
| 60 to 89 Minutes | 21 (8.6%) | 0 (0.0%) |
| 90 or more Minutes | 36 (14.7%) | 0 (0.0%) |
Time of Departure to Work by Sex in Catahoula
The most frequent times of departure to work in Catahoula are 5:30 AM to 5:59 AM (133, 54.5%) for males and 7:30 AM to 7:59 AM (55, 43.0%) for females.
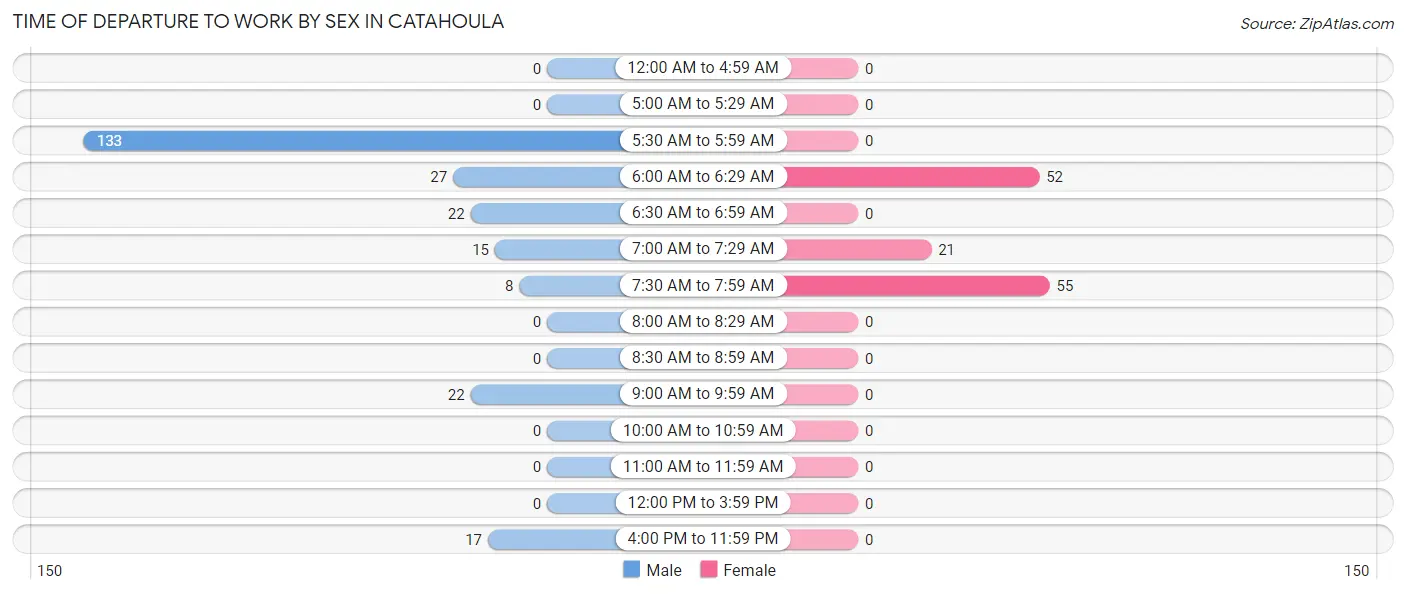
| Time of Departure | Male | Female |
| 12:00 AM to 4:59 AM | 0 (0.0%) | 0 (0.0%) |
| 5:00 AM to 5:29 AM | 0 (0.0%) | 0 (0.0%) |
| 5:30 AM to 5:59 AM | 133 (54.5%) | 0 (0.0%) |
| 6:00 AM to 6:29 AM | 27 (11.1%) | 52 (40.6%) |
| 6:30 AM to 6:59 AM | 22 (9.0%) | 0 (0.0%) |
| 7:00 AM to 7:29 AM | 15 (6.1%) | 21 (16.4%) |
| 7:30 AM to 7:59 AM | 8 (3.3%) | 55 (43.0%) |
| 8:00 AM to 8:29 AM | 0 (0.0%) | 0 (0.0%) |
| 8:30 AM to 8:59 AM | 0 (0.0%) | 0 (0.0%) |
| 9:00 AM to 9:59 AM | 22 (9.0%) | 0 (0.0%) |
| 10:00 AM to 10:59 AM | 0 (0.0%) | 0 (0.0%) |
| 11:00 AM to 11:59 AM | 0 (0.0%) | 0 (0.0%) |
| 12:00 PM to 3:59 PM | 0 (0.0%) | 0 (0.0%) |
| 4:00 PM to 11:59 PM | 17 (7.0%) | 0 (0.0%) |
| Total | 244 (100.0%) | 128 (100.0%) |
Housing Occupancy in Catahoula
Occupancy by Ownership in Catahoula
Of the total 369 dwellings in Catahoula, owner-occupied units account for 347 (94.0%), while renter-occupied units make up 22 (6.0%).
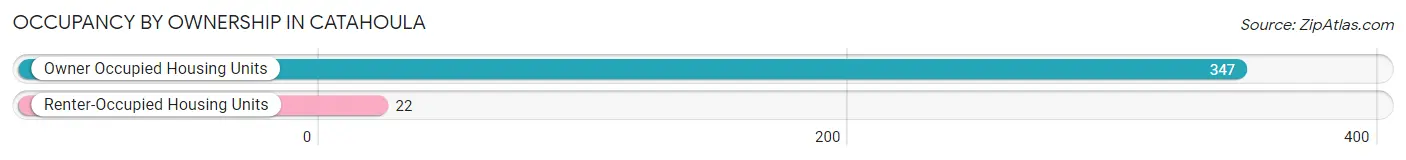
| Occupancy | # Housing Units | % Housing Units |
| Owner Occupied Housing Units | 347 | 94.0% |
| Renter-Occupied Housing Units | 22 | 6.0% |
| Total Occupied Housing Units | 369 | 100.0% |
Occupancy by Household Size in Catahoula
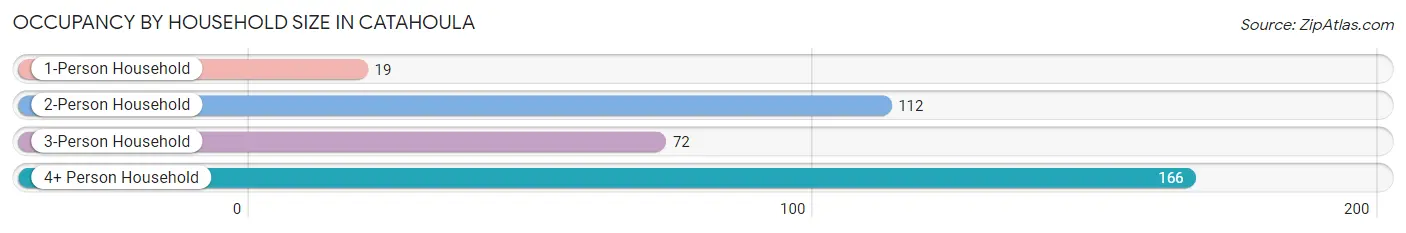
| Household Size | # Housing Units | % Housing Units |
| 1-Person Household | 19 | 5.1% |
| 2-Person Household | 112 | 30.3% |
| 3-Person Household | 72 | 19.5% |
| 4+ Person Household | 166 | 45.0% |
| Total Housing Units | 369 | 100.0% |
Occupancy by Ownership by Household Size in Catahoula
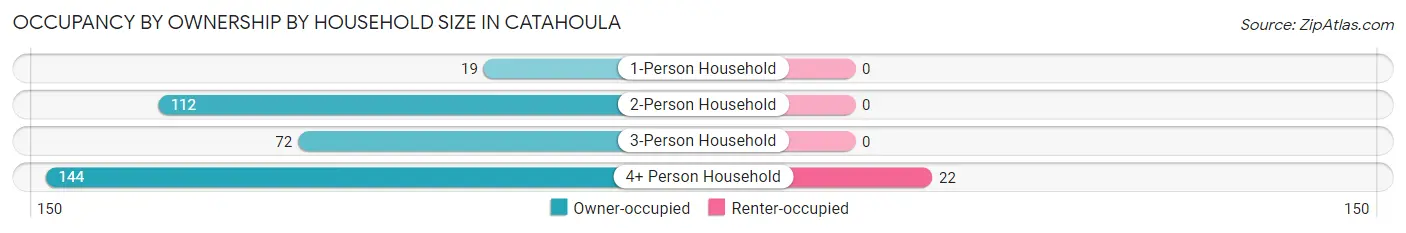
| Household Size | Owner-occupied | Renter-occupied |
| 1-Person Household | 19 (100.0%) | 0 (0.0%) |
| 2-Person Household | 112 (100.0%) | 0 (0.0%) |
| 3-Person Household | 72 (100.0%) | 0 (0.0%) |
| 4+ Person Household | 144 (86.8%) | 22 (13.3%) |
| Total Housing Units | 347 (94.0%) | 22 (6.0%) |
Occupancy by Educational Attainment in Catahoula
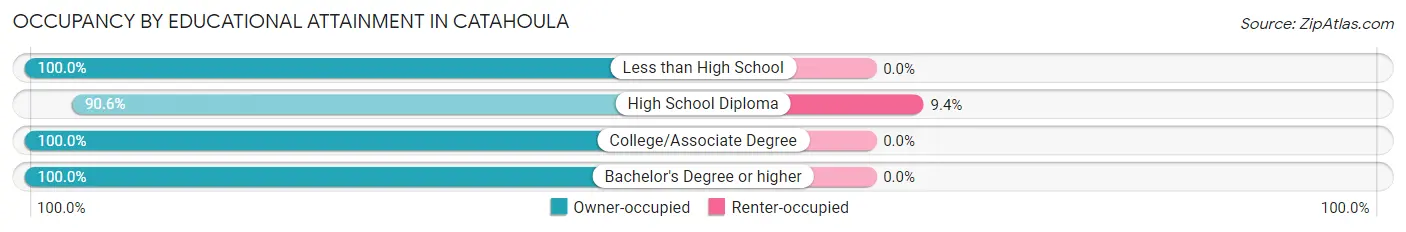
| Household Size | Owner-occupied | Renter-occupied |
| Less than High School | 41 (100.0%) | 0 (0.0%) |
| High School Diploma | 212 (90.6%) | 22 (9.4%) |
| College/Associate Degree | 38 (100.0%) | 0 (0.0%) |
| Bachelor's Degree or higher | 56 (100.0%) | 0 (0.0%) |
Occupancy by Age of Householder in Catahoula
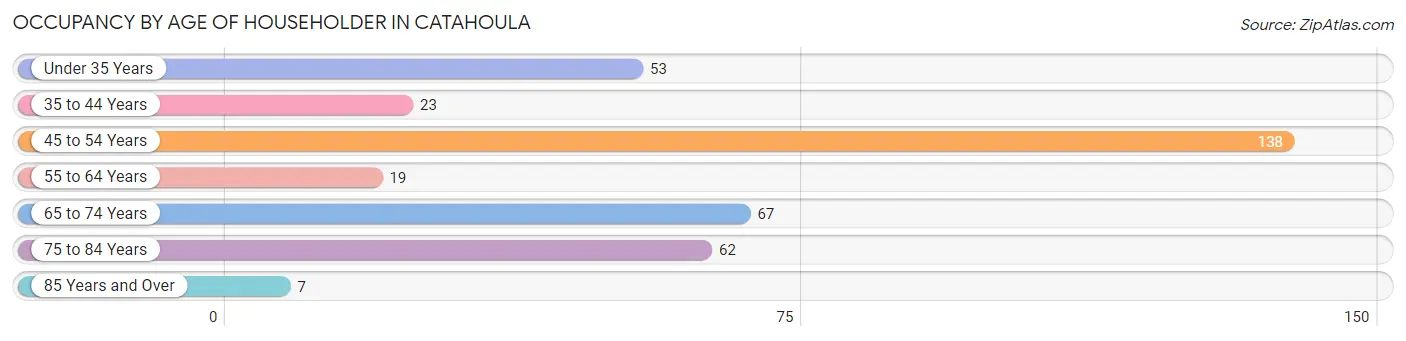
| Age Bracket | # Households | % Households |
| Under 35 Years | 53 | 14.4% |
| 35 to 44 Years | 23 | 6.2% |
| 45 to 54 Years | 138 | 37.4% |
| 55 to 64 Years | 19 | 5.1% |
| 65 to 74 Years | 67 | 18.2% |
| 75 to 84 Years | 62 | 16.8% |
| 85 Years and Over | 7 | 1.9% |
| Total | 369 | 100.0% |
Housing Finances in Catahoula
Median Income by Occupancy in Catahoula
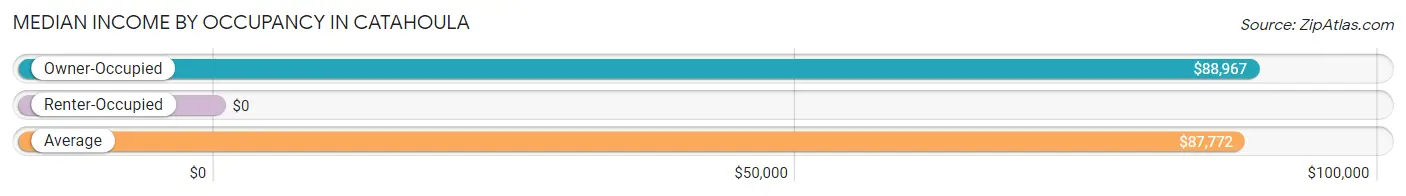
| Occupancy Type | # Households | Median Income |
| Owner-Occupied | 347 (94.0%) | $88,967 |
| Renter-Occupied | 22 (6.0%) | $0 |
| Average | 369 (100.0%) | $87,772 |
Occupancy by Householder Income Bracket in Catahoula
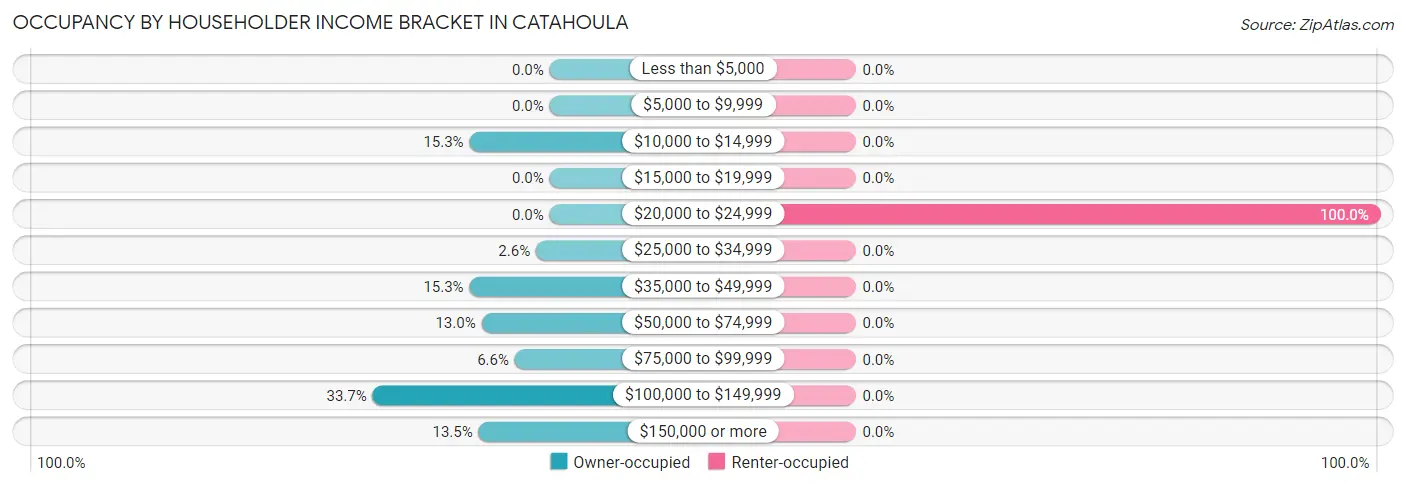
| Income Bracket | Owner-occupied | Renter-occupied |
| Less than $5,000 | 0 (0.0%) | 0 (0.0%) |
| $5,000 to $9,999 | 0 (0.0%) | 0 (0.0%) |
| $10,000 to $14,999 | 53 (15.3%) | 0 (0.0%) |
| $15,000 to $19,999 | 0 (0.0%) | 0 (0.0%) |
| $20,000 to $24,999 | 0 (0.0%) | 22 (100.0%) |
| $25,000 to $34,999 | 9 (2.6%) | 0 (0.0%) |
| $35,000 to $49,999 | 53 (15.3%) | 0 (0.0%) |
| $50,000 to $74,999 | 45 (13.0%) | 0 (0.0%) |
| $75,000 to $99,999 | 23 (6.6%) | 0 (0.0%) |
| $100,000 to $149,999 | 117 (33.7%) | 0 (0.0%) |
| $150,000 or more | 47 (13.5%) | 0 (0.0%) |
| Total | 347 (100.0%) | 22 (100.0%) |
Monthly Housing Cost Tiers in Catahoula
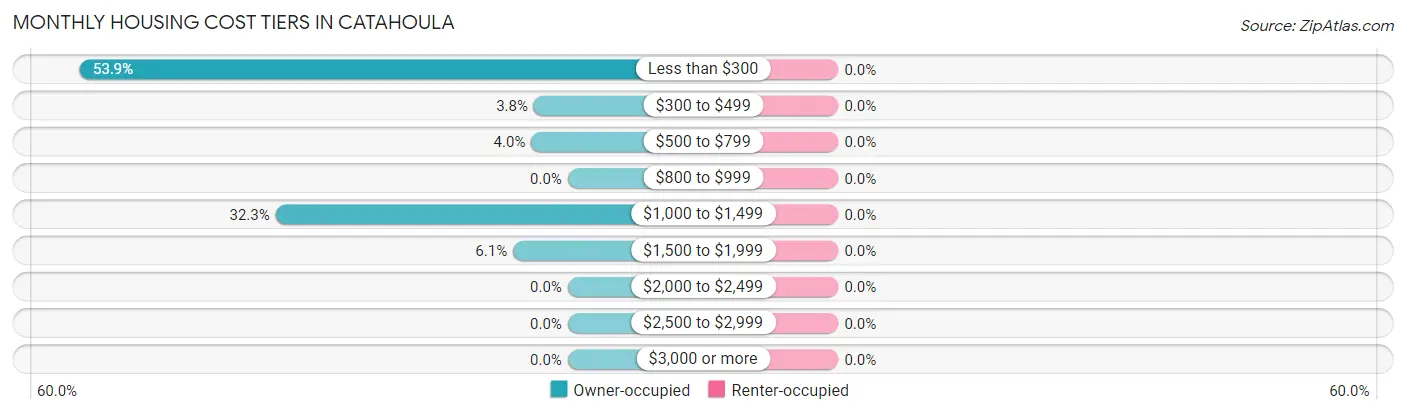
| Monthly Cost | Owner-occupied | Renter-occupied |
| Less than $300 | 187 (53.9%) | 0 (0.0%) |
| $300 to $499 | 13 (3.7%) | 0 (0.0%) |
| $500 to $799 | 14 (4.0%) | 0 (0.0%) |
| $800 to $999 | 0 (0.0%) | 0 (0.0%) |
| $1,000 to $1,499 | 112 (32.3%) | 0 (0.0%) |
| $1,500 to $1,999 | 21 (6.0%) | 0 (0.0%) |
| $2,000 to $2,499 | 0 (0.0%) | 0 (0.0%) |
| $2,500 to $2,999 | 0 (0.0%) | 0 (0.0%) |
| $3,000 or more | 0 (0.0%) | 0 (0.0%) |
| Total | 347 (100.0%) | 22 (100.0%) |
Physical Housing Characteristics in Catahoula
Housing Structures in Catahoula
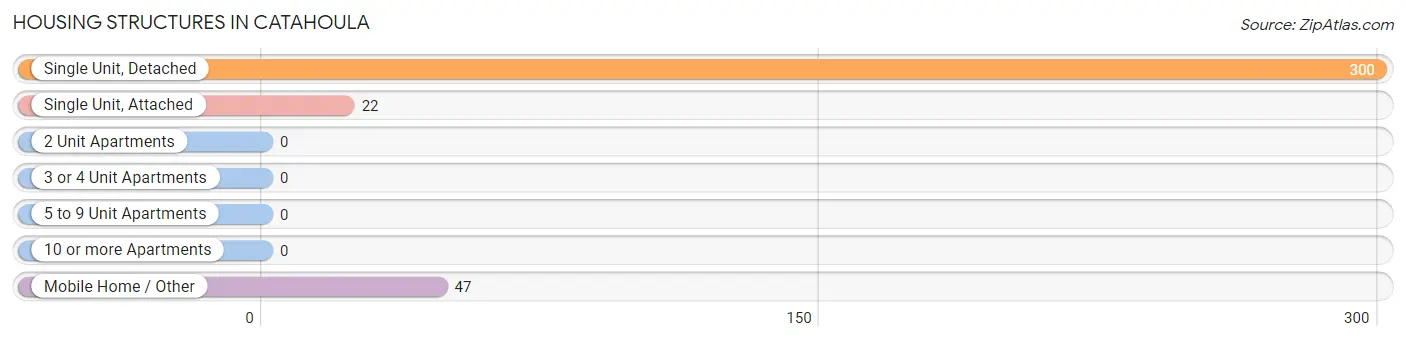
| Structure Type | # Housing Units | % Housing Units |
| Single Unit, Detached | 300 | 81.3% |
| Single Unit, Attached | 22 | 6.0% |
| 2 Unit Apartments | 0 | 0.0% |
| 3 or 4 Unit Apartments | 0 | 0.0% |
| 5 to 9 Unit Apartments | 0 | 0.0% |
| 10 or more Apartments | 0 | 0.0% |
| Mobile Home / Other | 47 | 12.7% |
| Total | 369 | 100.0% |
Housing Structures by Occupancy in Catahoula
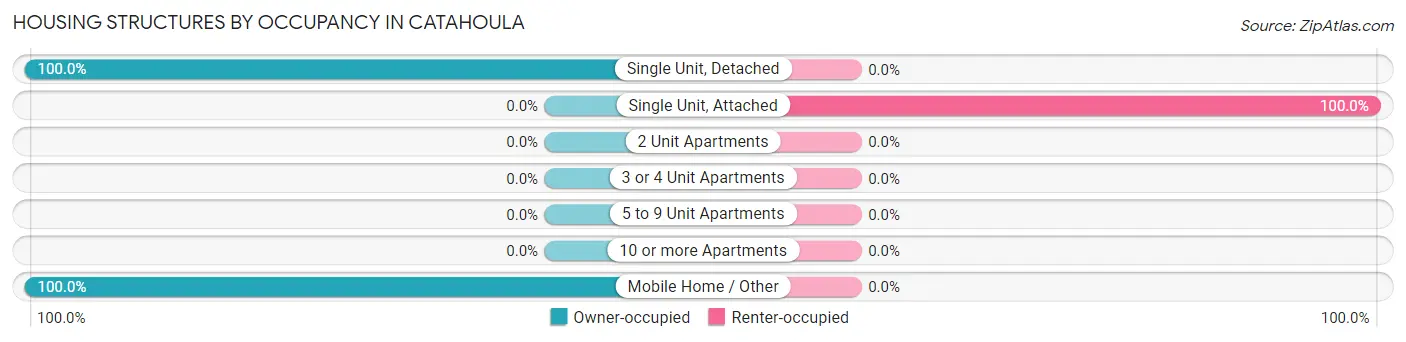
| Structure Type | Owner-occupied | Renter-occupied |
| Single Unit, Detached | 300 (100.0%) | 0 (0.0%) |
| Single Unit, Attached | 0 (0.0%) | 22 (100.0%) |
| 2 Unit Apartments | 0 (0.0%) | 0 (0.0%) |
| 3 or 4 Unit Apartments | 0 (0.0%) | 0 (0.0%) |
| 5 to 9 Unit Apartments | 0 (0.0%) | 0 (0.0%) |
| 10 or more Apartments | 0 (0.0%) | 0 (0.0%) |
| Mobile Home / Other | 47 (100.0%) | 0 (0.0%) |
| Total | 347 (94.0%) | 22 (6.0%) |
Housing Structures by Number of Rooms in Catahoula
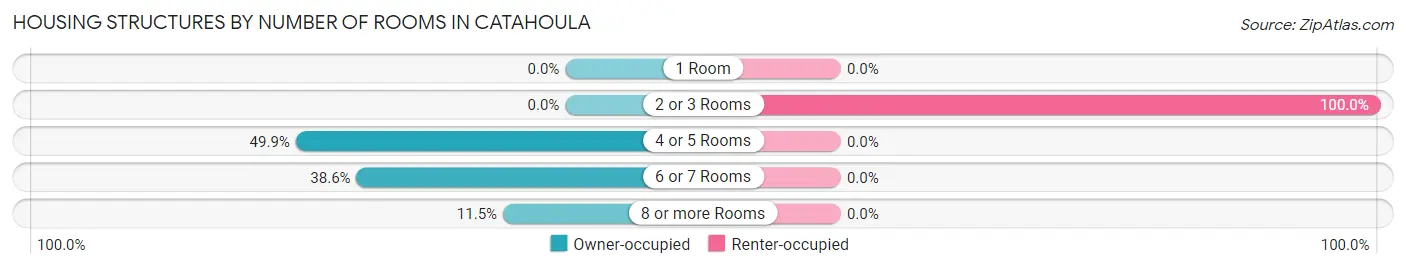
| Number of Rooms | Owner-occupied | Renter-occupied |
| 1 Room | 0 (0.0%) | 0 (0.0%) |
| 2 or 3 Rooms | 0 (0.0%) | 22 (100.0%) |
| 4 or 5 Rooms | 173 (49.9%) | 0 (0.0%) |
| 6 or 7 Rooms | 134 (38.6%) | 0 (0.0%) |
| 8 or more Rooms | 40 (11.5%) | 0 (0.0%) |
| Total | 347 (100.0%) | 22 (100.0%) |
Housing Structure by Heating Type in Catahoula
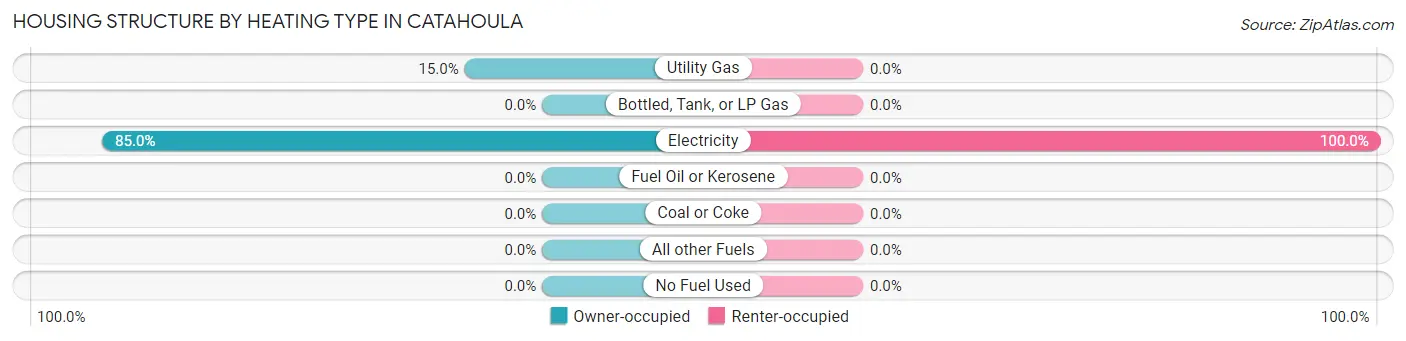
| Heating Type | Owner-occupied | Renter-occupied |
| Utility Gas | 52 (15.0%) | 0 (0.0%) |
| Bottled, Tank, or LP Gas | 0 (0.0%) | 0 (0.0%) |
| Electricity | 295 (85.0%) | 22 (100.0%) |
| Fuel Oil or Kerosene | 0 (0.0%) | 0 (0.0%) |
| Coal or Coke | 0 (0.0%) | 0 (0.0%) |
| All other Fuels | 0 (0.0%) | 0 (0.0%) |
| No Fuel Used | 0 (0.0%) | 0 (0.0%) |
| Total | 347 (100.0%) | 22 (100.0%) |
Household Vehicle Usage in Catahoula
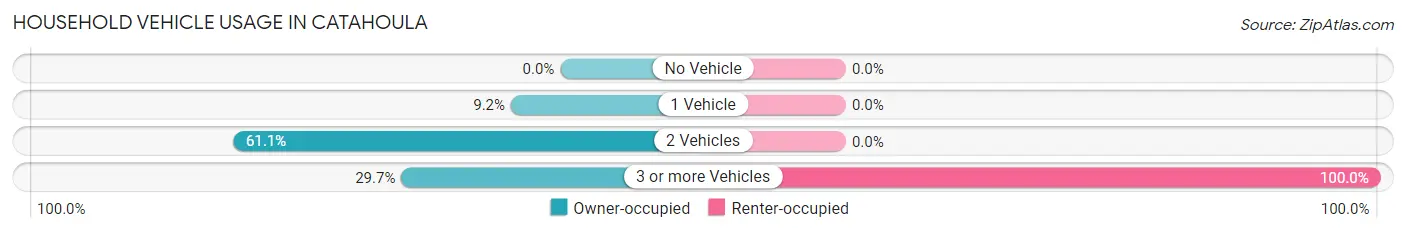
| Vehicles per Household | Owner-occupied | Renter-occupied |
| No Vehicle | 0 (0.0%) | 0 (0.0%) |
| 1 Vehicle | 32 (9.2%) | 0 (0.0%) |
| 2 Vehicles | 212 (61.1%) | 0 (0.0%) |
| 3 or more Vehicles | 103 (29.7%) | 22 (100.0%) |
| Total | 347 (100.0%) | 22 (100.0%) |
Real Estate & Mortgages in Catahoula
Real Estate and Mortgage Overview in Catahoula
| Characteristic | Without Mortgage | With Mortgage |
| Housing Units | 207 | 140 |
| Median Property Value | $62,800 | $180,300 |
| Median Household Income | $49,511 | $0 |
| Monthly Housing Costs | $191 | $0 |
| Real Estate Taxes | $199 | $0 |
Property Value by Mortgage Status in Catahoula
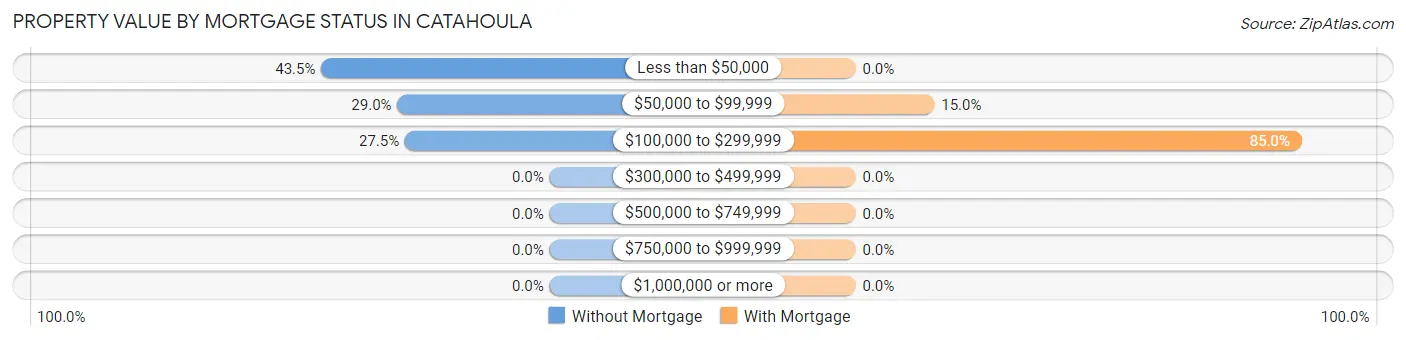
| Property Value | Without Mortgage | With Mortgage |
| Less than $50,000 | 90 (43.5%) | 0 (0.0%) |
| $50,000 to $99,999 | 60 (29.0%) | 21 (15.0%) |
| $100,000 to $299,999 | 57 (27.5%) | 119 (85.0%) |
| $300,000 to $499,999 | 0 (0.0%) | 0 (0.0%) |
| $500,000 to $749,999 | 0 (0.0%) | 0 (0.0%) |
| $750,000 to $999,999 | 0 (0.0%) | 0 (0.0%) |
| $1,000,000 or more | 0 (0.0%) | 0 (0.0%) |
| Total | 207 (100.0%) | 140 (100.0%) |
Household Income by Mortgage Status in Catahoula
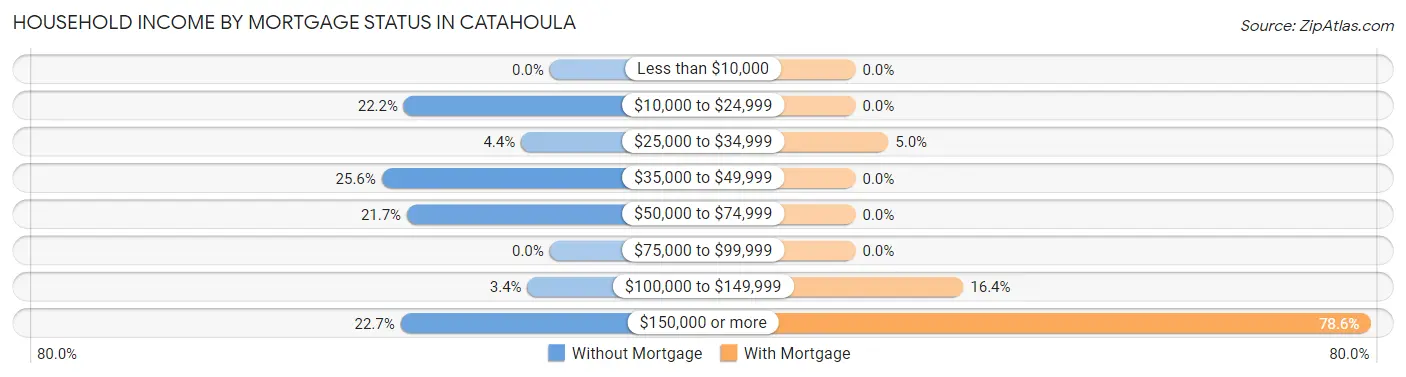
| Household Income | Without Mortgage | With Mortgage |
| Less than $10,000 | 0 (0.0%) | 0 (0.0%) |
| $10,000 to $24,999 | 46 (22.2%) | 0 (0.0%) |
| $25,000 to $34,999 | 9 (4.3%) | 7 (5.0%) |
| $35,000 to $49,999 | 53 (25.6%) | 0 (0.0%) |
| $50,000 to $74,999 | 45 (21.7%) | 0 (0.0%) |
| $75,000 to $99,999 | 0 (0.0%) | 0 (0.0%) |
| $100,000 to $149,999 | 7 (3.4%) | 23 (16.4%) |
| $150,000 or more | 47 (22.7%) | 110 (78.6%) |
| Total | 207 (100.0%) | 140 (100.0%) |
Property Value to Household Income Ratio in Catahoula
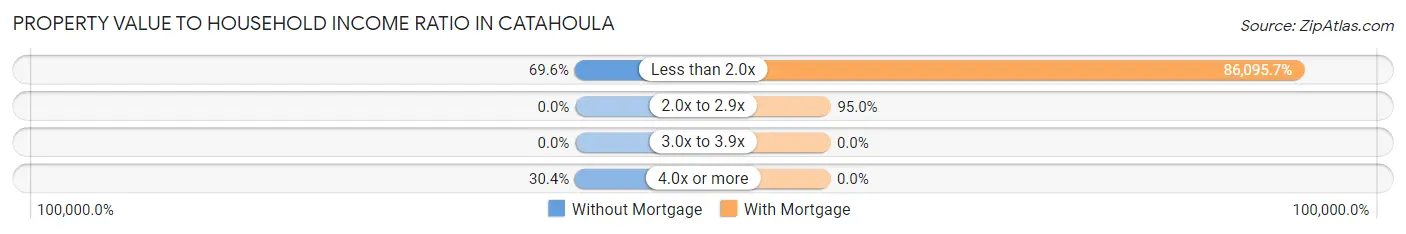
| Value-to-Income Ratio | Without Mortgage | With Mortgage |
| Less than 2.0x | 144 (69.6%) | 120,534 (86,095.7%) |
| 2.0x to 2.9x | 0 (0.0%) | 133 (95.0%) |
| 3.0x to 3.9x | 0 (0.0%) | 0 (0.0%) |
| 4.0x or more | 63 (30.4%) | 0 (0.0%) |
| Total | 207 (100.0%) | 140 (100.0%) |
Real Estate Taxes by Mortgage Status in Catahoula
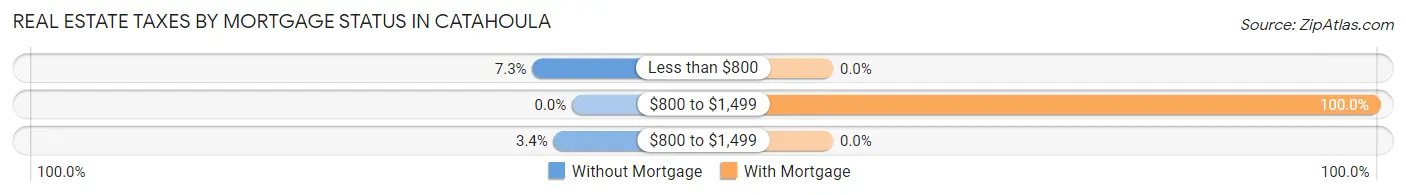
| Property Taxes | Without Mortgage | With Mortgage |
| Less than $800 | 15 (7.2%) | 0 (0.0%) |
| $800 to $1,499 | 0 (0.0%) | 140 (100.0%) |
| $800 to $1,499 | 7 (3.4%) | 0 (0.0%) |
| Total | 207 (100.0%) | 140 (100.0%) |
Health & Disability in Catahoula
Health Insurance Coverage by Age in Catahoula
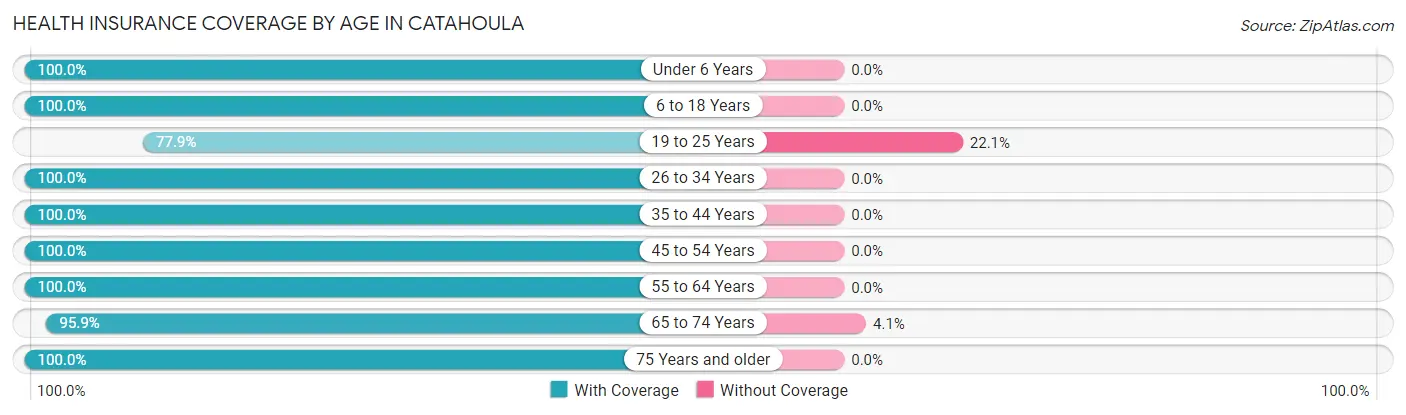
| Age Bracket | With Coverage | Without Coverage |
| Under 6 Years | 66 (100.0%) | 0 (0.0%) |
| 6 to 18 Years | 169 (100.0%) | 0 (0.0%) |
| 19 to 25 Years | 74 (77.9%) | 21 (22.1%) |
| 26 to 34 Years | 106 (100.0%) | 0 (0.0%) |
| 35 to 44 Years | 84 (100.0%) | 0 (0.0%) |
| 45 to 54 Years | 240 (100.0%) | 0 (0.0%) |
| 55 to 64 Years | 63 (100.0%) | 0 (0.0%) |
| 65 to 74 Years | 118 (95.9%) | 5 (4.1%) |
| 75 Years and older | 96 (100.0%) | 0 (0.0%) |
| Total | 1,016 (97.5%) | 26 (2.5%) |
Health Insurance Coverage by Citizenship Status in Catahoula
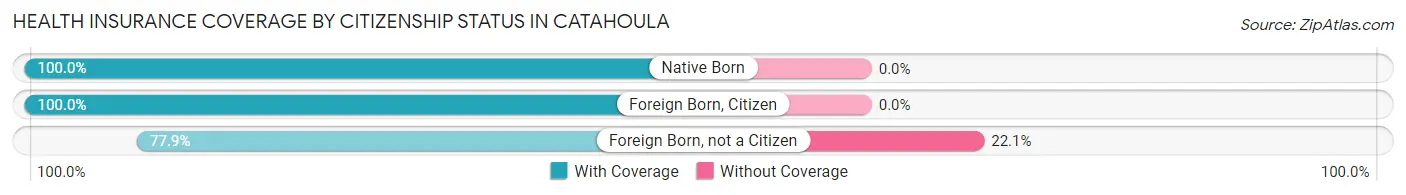
| Citizenship Status | With Coverage | Without Coverage |
| Native Born | 66 (100.0%) | 0 (0.0%) |
| Foreign Born, Citizen | 169 (100.0%) | 0 (0.0%) |
| Foreign Born, not a Citizen | 74 (77.9%) | 21 (22.1%) |
Health Insurance Coverage by Household Income in Catahoula
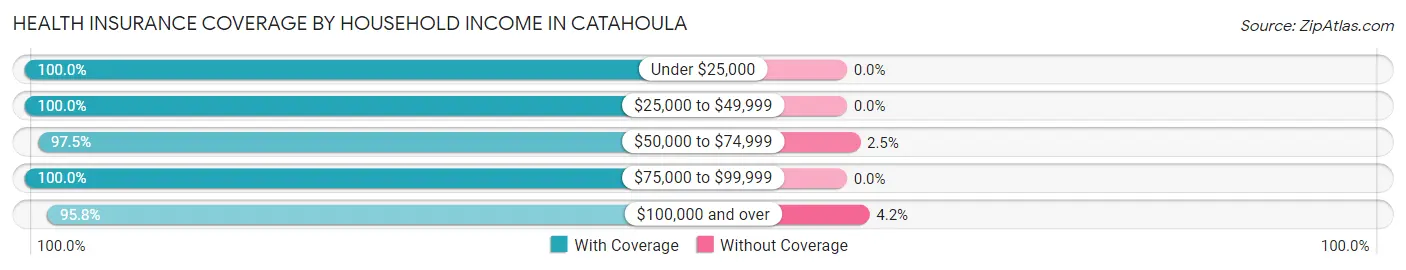
| Household Income | With Coverage | Without Coverage |
| Under $25,000 | 170 (100.0%) | 0 (0.0%) |
| $25,000 to $49,999 | 104 (100.0%) | 0 (0.0%) |
| $50,000 to $74,999 | 197 (97.5%) | 5 (2.5%) |
| $75,000 to $99,999 | 70 (100.0%) | 0 (0.0%) |
| $100,000 and over | 475 (95.8%) | 21 (4.2%) |
Public vs Private Health Insurance Coverage by Age in Catahoula
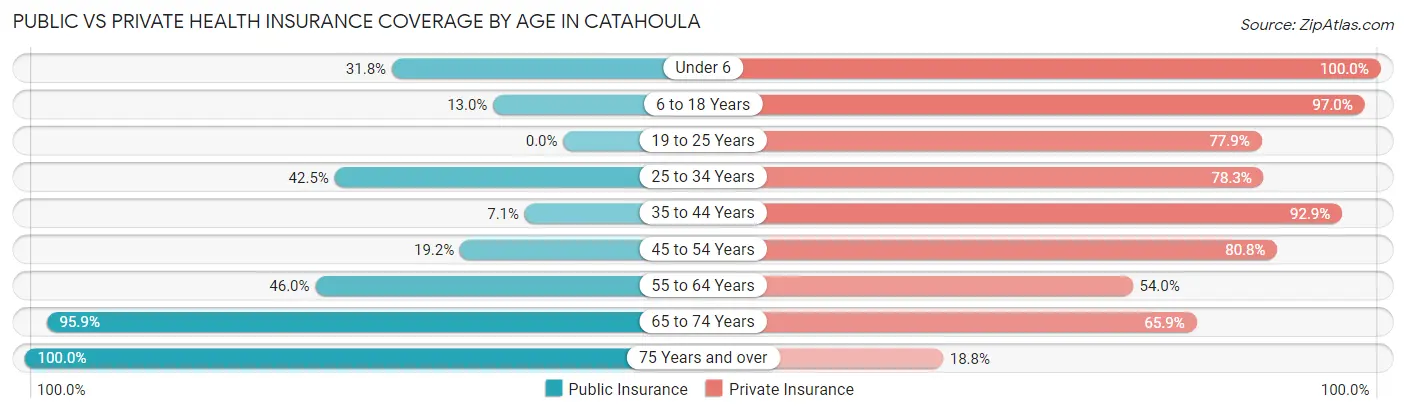
| Age Bracket | Public Insurance | Private Insurance |
| Under 6 | 21 (31.8%) | 66 (100.0%) |
| 6 to 18 Years | 22 (13.0%) | 164 (97.0%) |
| 19 to 25 Years | 0 (0.0%) | 74 (77.9%) |
| 25 to 34 Years | 45 (42.4%) | 83 (78.3%) |
| 35 to 44 Years | 6 (7.1%) | 78 (92.9%) |
| 45 to 54 Years | 46 (19.2%) | 194 (80.8%) |
| 55 to 64 Years | 29 (46.0%) | 34 (54.0%) |
| 65 to 74 Years | 118 (95.9%) | 81 (65.8%) |
| 75 Years and over | 96 (100.0%) | 18 (18.8%) |
| Total | 383 (36.8%) | 792 (76.0%) |
Disability Status by Sex by Age in Catahoula
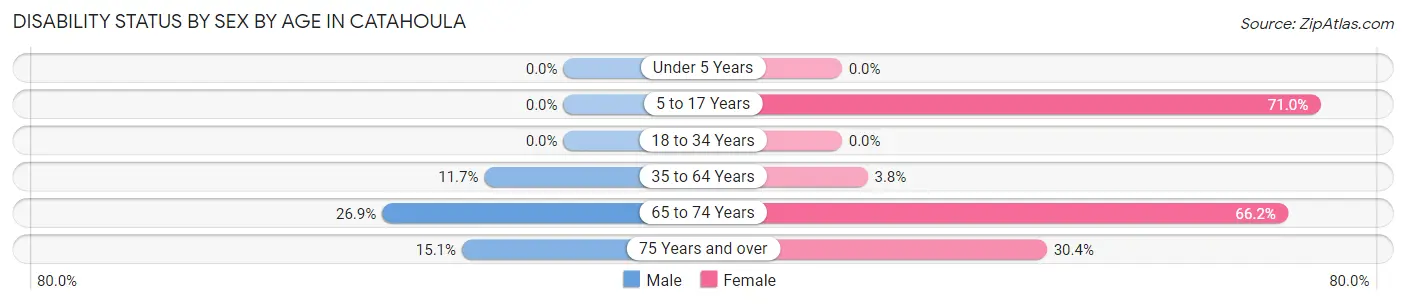
| Age Bracket | Male | Female |
| Under 5 Years | 0 (0.0%) | 0 (0.0%) |
| 5 to 17 Years | 0 (0.0%) | 49 (71.0%) |
| 18 to 34 Years | 0 (0.0%) | 0 (0.0%) |
| 35 to 64 Years | 27 (11.7%) | 6 (3.8%) |
| 65 to 74 Years | 14 (26.9%) | 47 (66.2%) |
| 75 Years and over | 11 (15.1%) | 7 (30.4%) |
Disability Class by Sex by Age in Catahoula
Disability Class: Hearing Difficulty
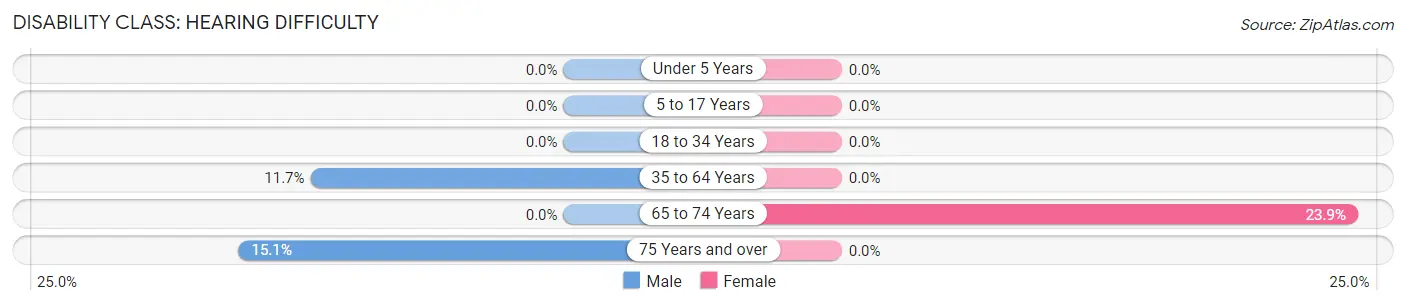
| Age Bracket | Male | Female |
| Under 5 Years | 0 (0.0%) | 0 (0.0%) |
| 5 to 17 Years | 0 (0.0%) | 0 (0.0%) |
| 18 to 34 Years | 0 (0.0%) | 0 (0.0%) |
| 35 to 64 Years | 27 (11.7%) | 0 (0.0%) |
| 65 to 74 Years | 0 (0.0%) | 17 (23.9%) |
| 75 Years and over | 11 (15.1%) | 0 (0.0%) |
Disability Class: Vision Difficulty
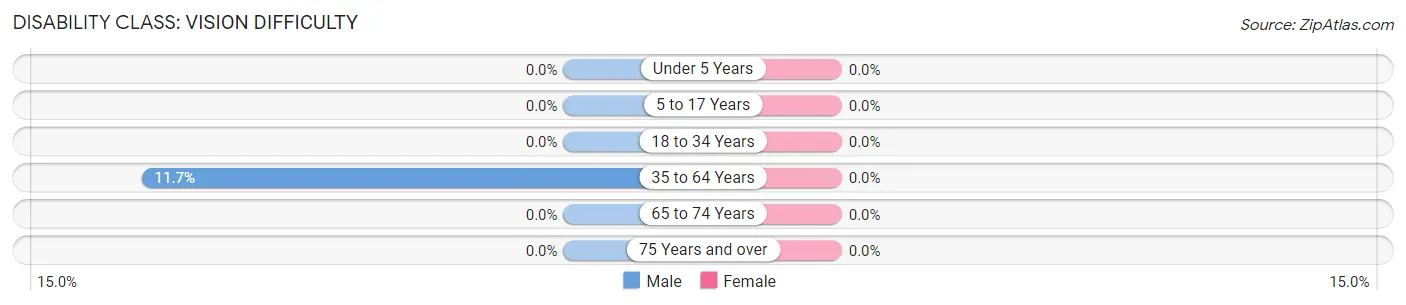
| Age Bracket | Male | Female |
| Under 5 Years | 0 (0.0%) | 0 (0.0%) |
| 5 to 17 Years | 0 (0.0%) | 0 (0.0%) |
| 18 to 34 Years | 0 (0.0%) | 0 (0.0%) |
| 35 to 64 Years | 27 (11.7%) | 0 (0.0%) |
| 65 to 74 Years | 0 (0.0%) | 0 (0.0%) |
| 75 Years and over | 0 (0.0%) | 0 (0.0%) |
Disability Class: Cognitive Difficulty
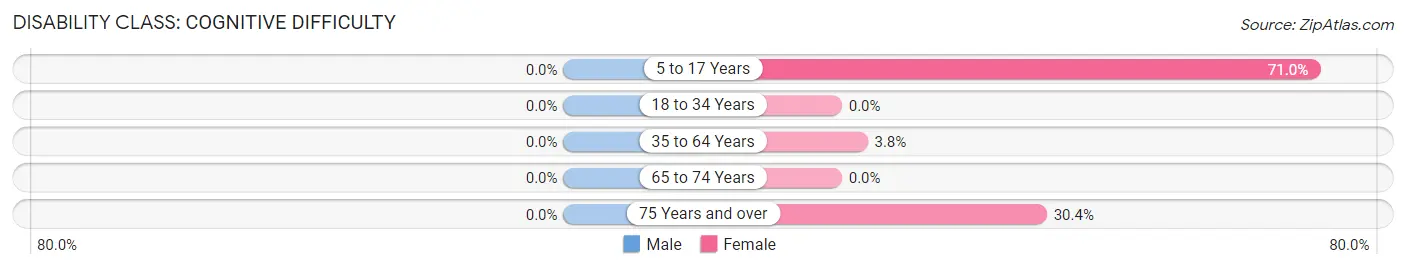
| Age Bracket | Male | Female |
| 5 to 17 Years | 0 (0.0%) | 49 (71.0%) |
| 18 to 34 Years | 0 (0.0%) | 0 (0.0%) |
| 35 to 64 Years | 0 (0.0%) | 6 (3.8%) |
| 65 to 74 Years | 0 (0.0%) | 0 (0.0%) |
| 75 Years and over | 0 (0.0%) | 7 (30.4%) |
Disability Class: Ambulatory Difficulty
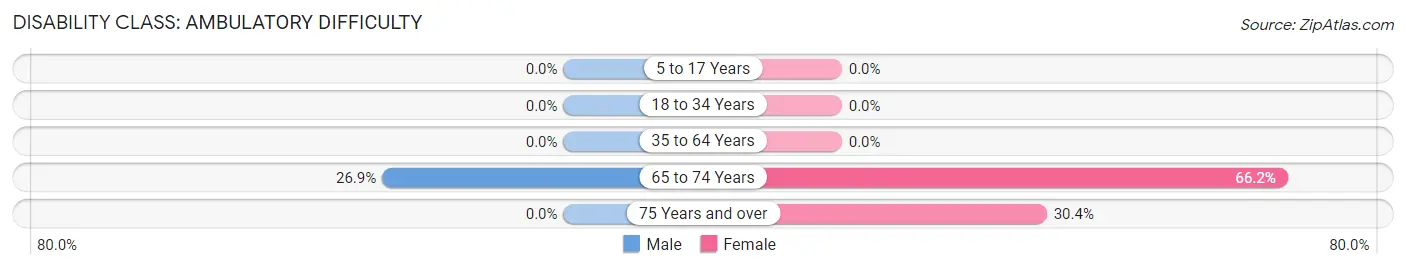
| Age Bracket | Male | Female |
| 5 to 17 Years | 0 (0.0%) | 0 (0.0%) |
| 18 to 34 Years | 0 (0.0%) | 0 (0.0%) |
| 35 to 64 Years | 0 (0.0%) | 0 (0.0%) |
| 65 to 74 Years | 14 (26.9%) | 47 (66.2%) |
| 75 Years and over | 0 (0.0%) | 7 (30.4%) |
Disability Class: Self-Care Difficulty
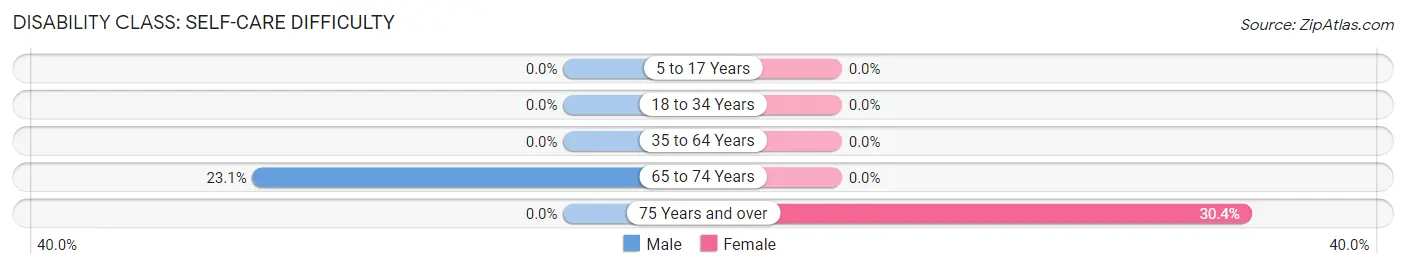
| Age Bracket | Male | Female |
| 5 to 17 Years | 0 (0.0%) | 0 (0.0%) |
| 18 to 34 Years | 0 (0.0%) | 0 (0.0%) |
| 35 to 64 Years | 0 (0.0%) | 0 (0.0%) |
| 65 to 74 Years | 12 (23.1%) | 0 (0.0%) |
| 75 Years and over | 0 (0.0%) | 7 (30.4%) |
Technology Access in Catahoula
Computing Device Access in Catahoula
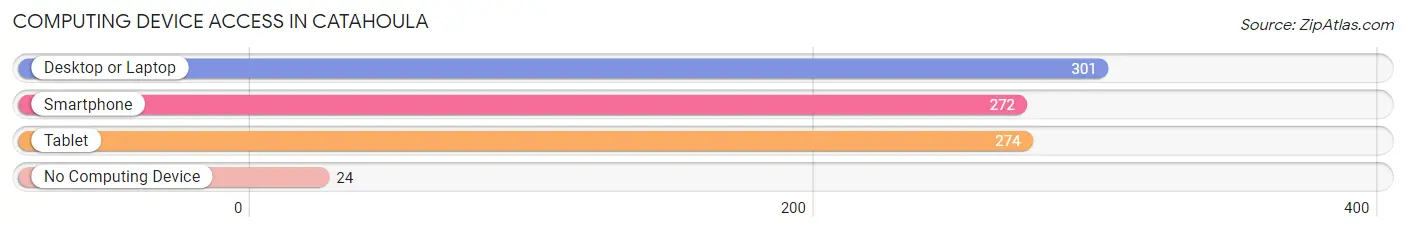
| Device Type | # Households | % Households |
| Desktop or Laptop | 301 | 81.6% |
| Smartphone | 272 | 73.7% |
| Tablet | 274 | 74.3% |
| No Computing Device | 24 | 6.5% |
| Total | 369 | 100.0% |
Internet Access in Catahoula
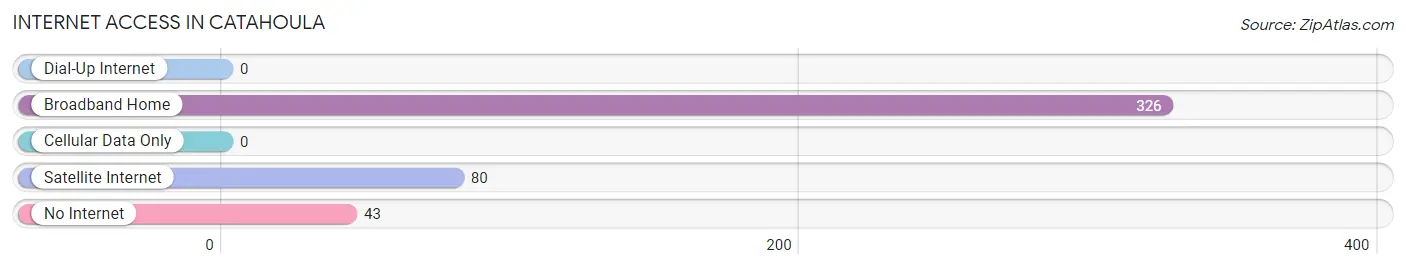
| Internet Type | # Households | % Households |
| Dial-Up Internet | 0 | 0.0% |
| Broadband Home | 326 | 88.3% |
| Cellular Data Only | 0 | 0.0% |
| Satellite Internet | 80 | 21.7% |
| No Internet | 43 | 11.7% |
| Total | 369 | 100.0% |
Catahoula Summary
Catahoula, Louisiana is a small town located in the northeastern corner of the state, near the Mississippi border. It is part of the larger Catahoula Parish, which is home to a population of just over 10,000 people. The town of Catahoula is the parish seat, and is home to a population of just over 1,000 people.
History
Catahoula was founded in 1808 by French settlers, who named the town after the nearby Catahoula Lake. The lake was named after the Native American tribe of the same name, who had inhabited the area for centuries prior to the arrival of the French. The town was originally a trading post, and quickly grew into a small but prosperous community.
In the early 19th century, Catahoula was a major center of the cotton industry, and the town was home to several large plantations. The town was also a major stop on the Mississippi River, and was a popular destination for steamboats.
In the late 19th century, Catahoula was a major center of the lumber industry, and the town was home to several large sawmills. The town was also a major stop on the railroad, and was a popular destination for freight trains.
In the early 20th century, Catahoula was a major center of the oil industry, and the town was home to several large oil refineries. The town was also a major stop on the railroad, and was a popular destination for freight trains.
Geography
Catahoula is located in the northeastern corner of Louisiana, near the Mississippi border. The town is situated on the banks of the Catahoula Lake, which is the largest natural lake in the state. The lake is fed by the nearby Ouachita River, and is a popular destination for fishing and boating.
The town is surrounded by rolling hills and forests, and is home to several small lakes and streams. The climate in Catahoula is humid subtropical, with hot summers and mild winters.
Economy
The economy of Catahoula is largely based on agriculture and forestry. The town is home to several large farms, and the surrounding area is home to several large timber companies. The town is also home to several small businesses, including restaurants, shops, and other services.
The town is also home to several manufacturing companies, including a paper mill and a furniture factory. The town is also home to several oil refineries, and is a major center of the oil industry in the region.
Demographics
As of the 2010 census, the population of Catahoula was 1,039. The racial makeup of the town was 79.3% White, 17.2% African American, 0.3% Native American, 0.2% Asian, 0.1% Pacific Islander, and 2.9% from other races. Hispanic or Latino of any race were 2.2% of the population.
The median income for a household in Catahoula was $30,938, and the median income for a family was $37,813. The per capita income for the town was $15,945. About 17.2% of families and 20.3% of the population were below the poverty line, including 28.3% of those under age 18 and 15.2% of those age 65 or over.
Catahoula is a small town with a rich history and a diverse population. The town is home to several large industries, and is a major center of the oil industry in the region. The town is also home to several small businesses, and is a popular destination for fishing and boating. The town is surrounded by rolling hills and forests, and is a great place to live and work.
Common Questions
What is the Total Population of Catahoula?
Total Population of Catahoula is 1,042.
What is the Total Male Population of Catahoula?
Total Male Population of Catahoula is 647.
What is the Total Female Population of Catahoula?
Total Female Population of Catahoula is 395.
What is the Ratio of Males per 100 Females in Catahoula?
There are 163.80 Males per 100 Females in Catahoula.
What is the Ratio of Females per 100 Males in Catahoula?
There are 61.05 Females per 100 Males in Catahoula.
What is the Median Population Age in Catahoula?
Median Population Age in Catahoula is 49.0 Years.
What is the Average Family Size in Catahoula
Average Family Size in Catahoula is 3.1 People.
What is the Average Household Size in Catahoula
Average Household Size in Catahoula is 2.8 People.
What is Per Capita Income in Catahoula?
Per Capita income in Catahoula is $28,620.
What is the Median Family Income in Catahoula?
Median Family Income in Catahoula is $108,571.
What is the Median Household income in Catahoula?
Median Household Income in Catahoula is $87,772.
What is Income or Wage Gap in Catahoula?
Income or Wage Gap in Catahoula is 56.9%.
Women in Catahoula earn 43.1 cents for every dollar earned by a man.
What is Inequality or Gini Index in Catahoula?
Inequality or Gini Index in Catahoula is 0.37.
How Large is the Labor Force in Catahoula?
There are 472 People in the Labor Forcein in Catahoula.
What is the Percentage of People in the Labor Force in Catahoula?
58.5% of People are in the Labor Force in Catahoula.
What is the Unemployment Rate in Catahoula?
Unemployment Rate in Catahoula is 1.3%.