Stacyville, IA
Stacyville Map
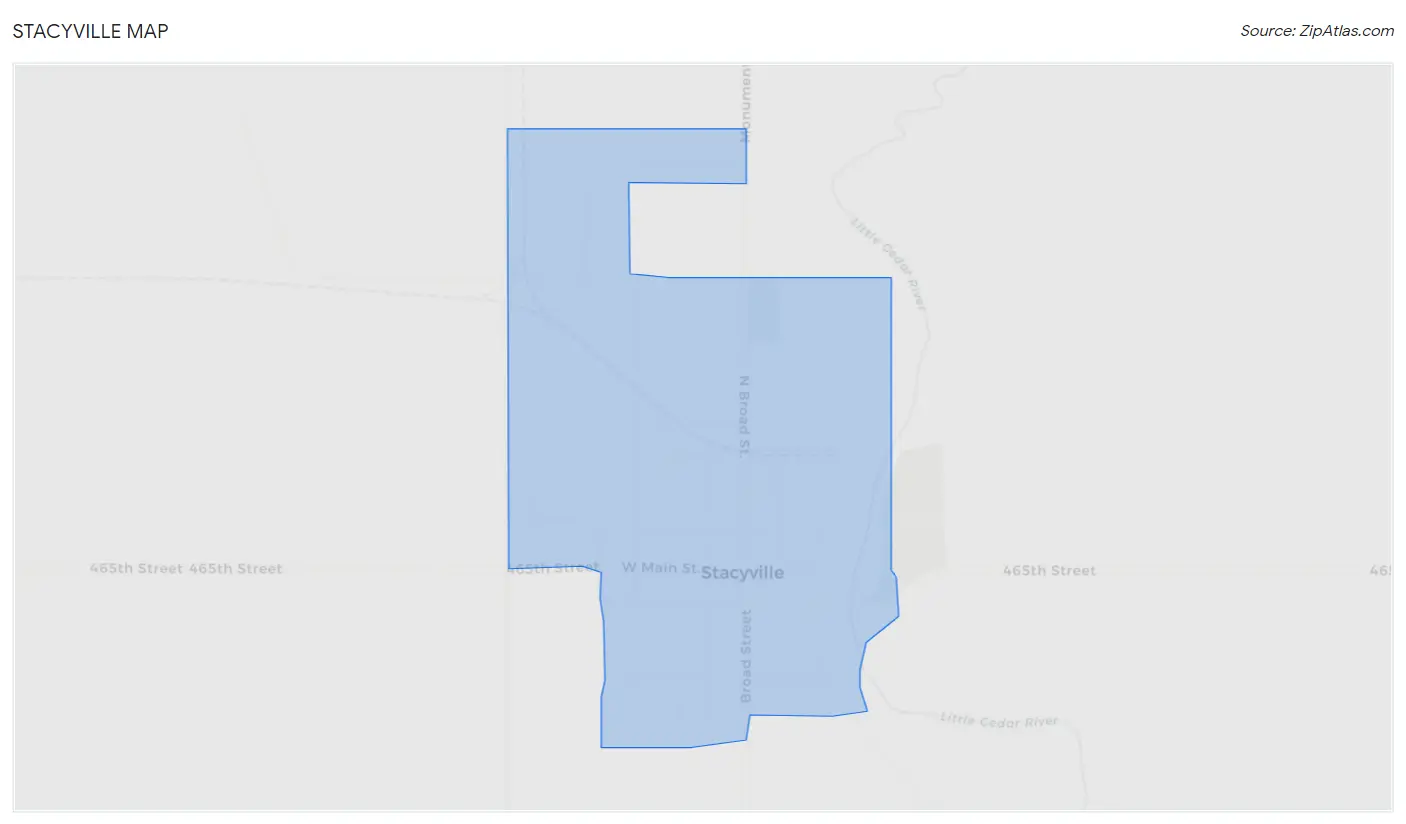
Stacyville Overview
488
TOTAL POPULATION
254
MALE POPULATION
234
FEMALE POPULATION
108.55
MALES / 100 FEMALES
92.13
FEMALES / 100 MALES
42.0
MEDIAN AGE
2.4
AVG FAMILY SIZE
2.0
AVG HOUSEHOLD SIZE
$29,333
PER CAPITA INCOME
$65,469
AVG FAMILY INCOME
$57,188
AVG HOUSEHOLD INCOME
33.6%
WAGE / INCOME GAP [ % ]
66.4¢/ $1
WAGE / INCOME GAP [ $ ]
0.34
INEQUALITY / GINI INDEX
238
LABOR FORCE [ PEOPLE ]
62.3%
PERCENT IN LABOR FORCE
Stacyville Zip Codes
Stacyville Area Codes
Race in Stacyville
The most populous races in Stacyville are White / Caucasian (486 | 99.6%), and Asian (2 | 0.4%).
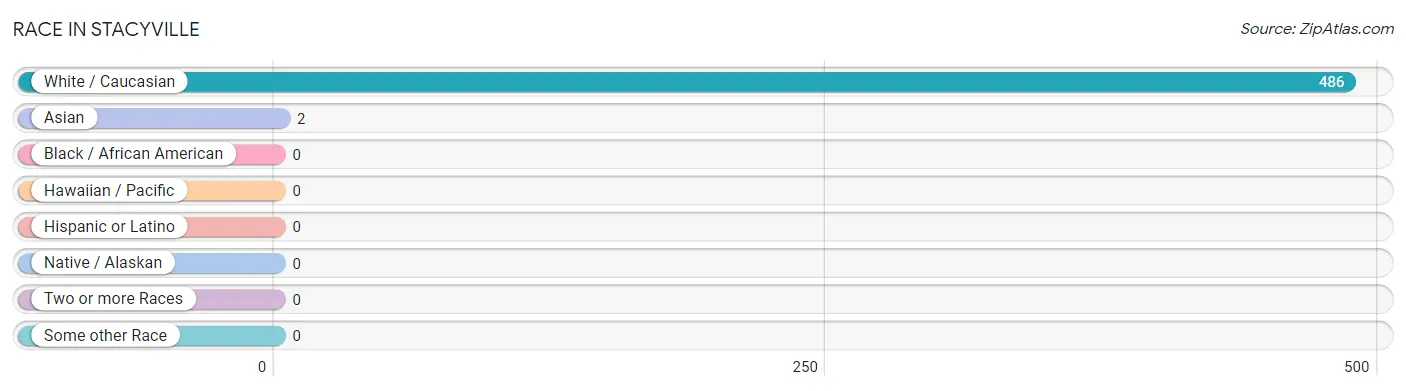
| Race | # Population | % Population |
| Asian | 2 | 0.4% |
| Black / African American | 0 | 0.0% |
| Hawaiian / Pacific | 0 | 0.0% |
| Hispanic or Latino | 0 | 0.0% |
| Native / Alaskan | 0 | 0.0% |
| White / Caucasian | 486 | 99.6% |
| Two or more Races | 0 | 0.0% |
| Some other Race | 0 | 0.0% |
| Total | 488 | 100.0% |
Ancestry in Stacyville
The most populous ancestries reported in Stacyville are German (258 | 52.9%), Norwegian (82 | 16.8%), American (52 | 10.7%), Irish (47 | 9.6%), and English (22 | 4.5%), together accounting for 94.5% of all Stacyville residents.
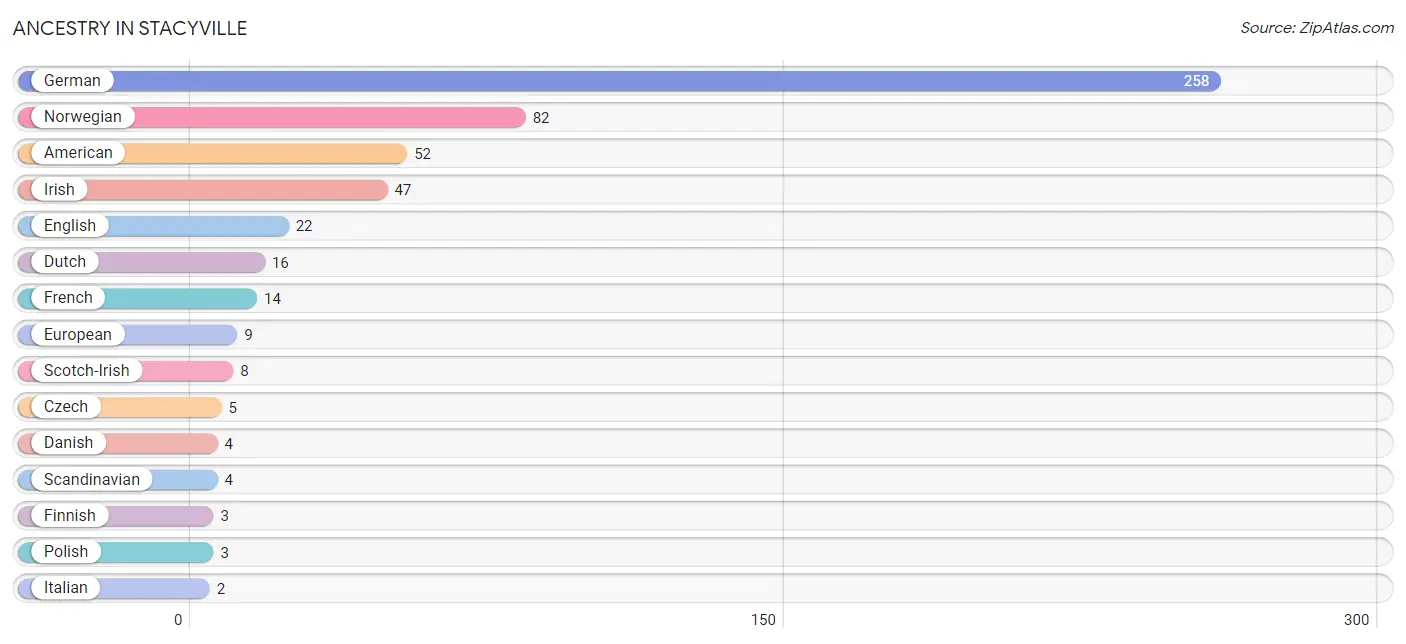
| Ancestry | # Population | % Population |
| American | 52 | 10.7% |
| Belgian | 1 | 0.2% |
| Czech | 5 | 1.0% |
| Danish | 4 | 0.8% |
| Dutch | 16 | 3.3% |
| English | 22 | 4.5% |
| European | 9 | 1.8% |
| Finnish | 3 | 0.6% |
| French | 14 | 2.9% |
| German | 258 | 52.9% |
| Irish | 47 | 9.6% |
| Italian | 2 | 0.4% |
| Malaysian | 1 | 0.2% |
| Norwegian | 82 | 16.8% |
| Polish | 3 | 0.6% |
| Scandinavian | 4 | 0.8% |
| Scotch-Irish | 8 | 1.6% |
| Scottish | 1 | 0.2% |
| Swedish | 2 | 0.4% |
| Welsh | 1 | 0.2% | View All 20 Rows |
Immigrants in Stacyville
The most numerous immigrant groups reported in Stacyville came from Europe (2 | 0.4%), Germany (2 | 0.4%), Western Europe (2 | 0.4%), Asia (1 | 0.2%), and Laos (1 | 0.2%), together accounting for 1.6% of all Stacyville residents.
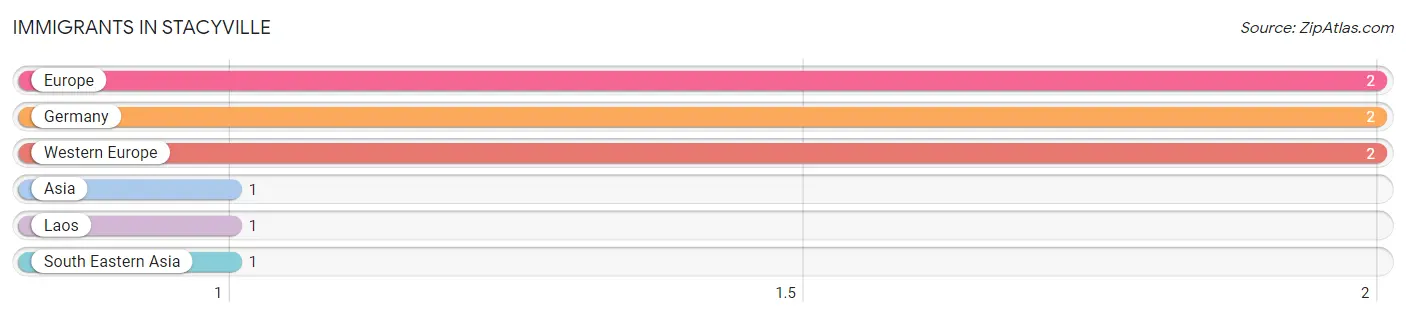
| Immigration Origin | # Population | % Population |
| Asia | 1 | 0.2% |
| Europe | 2 | 0.4% |
| Germany | 2 | 0.4% |
| Laos | 1 | 0.2% |
| South Eastern Asia | 1 | 0.2% |
| Western Europe | 2 | 0.4% | View All 6 Rows |
Sex and Age in Stacyville
Sex and Age in Stacyville
The most populous age groups in Stacyville are 65 to 69 Years (36 | 14.2%) for men and 20 to 24 Years (32 | 13.7%) for women.
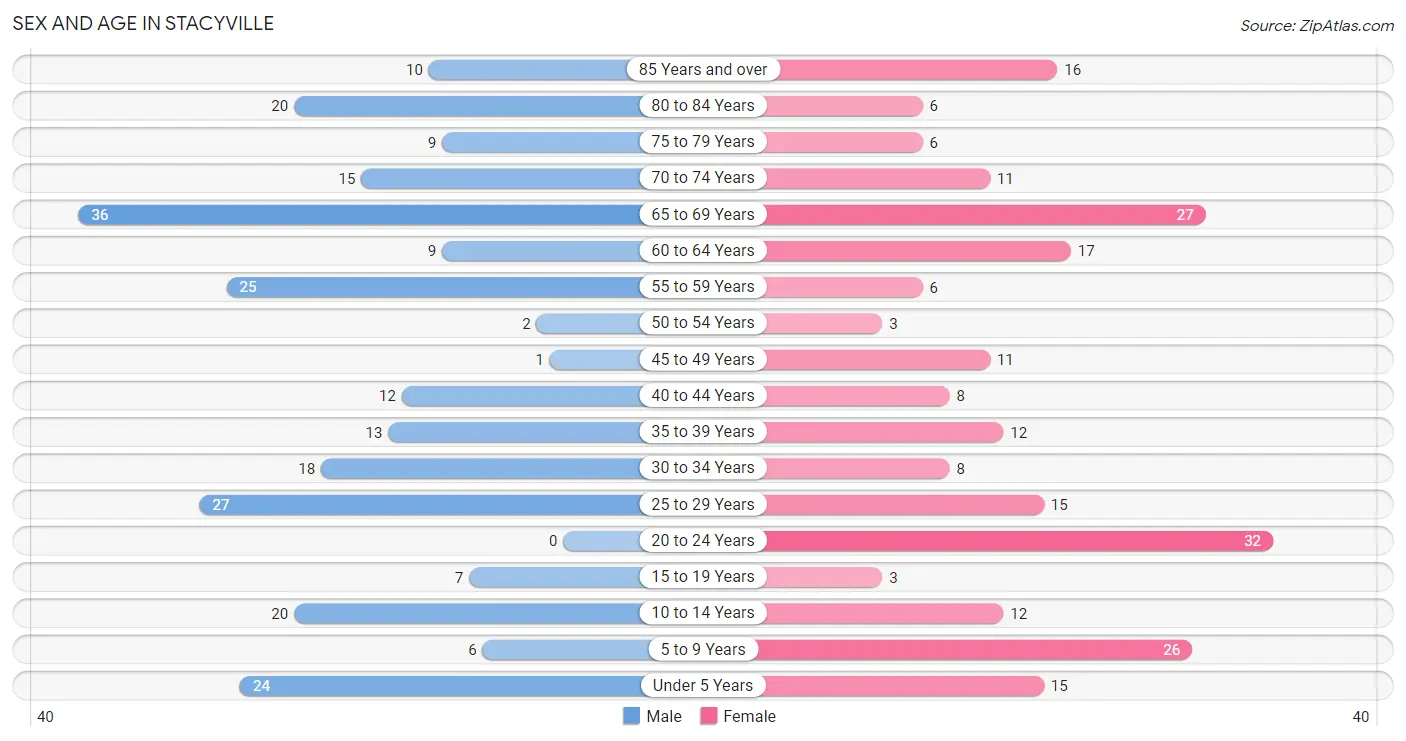
| Age Bracket | Male | Female |
| Under 5 Years | 24 (9.5%) | 15 (6.4%) |
| 5 to 9 Years | 6 (2.4%) | 26 (11.1%) |
| 10 to 14 Years | 20 (7.9%) | 12 (5.1%) |
| 15 to 19 Years | 7 (2.8%) | 3 (1.3%) |
| 20 to 24 Years | 0 (0.0%) | 32 (13.7%) |
| 25 to 29 Years | 27 (10.6%) | 15 (6.4%) |
| 30 to 34 Years | 18 (7.1%) | 8 (3.4%) |
| 35 to 39 Years | 13 (5.1%) | 12 (5.1%) |
| 40 to 44 Years | 12 (4.7%) | 8 (3.4%) |
| 45 to 49 Years | 1 (0.4%) | 11 (4.7%) |
| 50 to 54 Years | 2 (0.8%) | 3 (1.3%) |
| 55 to 59 Years | 25 (9.8%) | 6 (2.6%) |
| 60 to 64 Years | 9 (3.5%) | 17 (7.3%) |
| 65 to 69 Years | 36 (14.2%) | 27 (11.5%) |
| 70 to 74 Years | 15 (5.9%) | 11 (4.7%) |
| 75 to 79 Years | 9 (3.5%) | 6 (2.6%) |
| 80 to 84 Years | 20 (7.9%) | 6 (2.6%) |
| 85 Years and over | 10 (3.9%) | 16 (6.8%) |
| Total | 254 (100.0%) | 234 (100.0%) |
Families and Households in Stacyville
Median Family Size in Stacyville
The median family size in Stacyville is 2.38 persons per family, with single male/father families (17 | 10.7%) accounting for the largest median family size of 2.59 persons per family. On the other hand, married-couple families (106 | 66.7%) represent the smallest median family size with 2.34 persons per family.
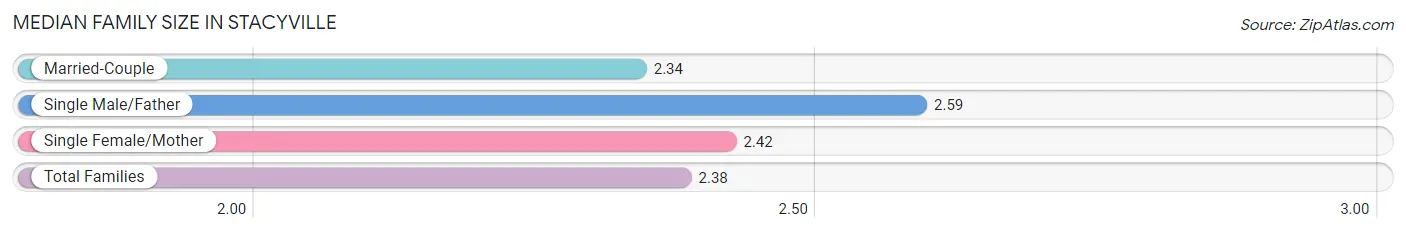
| Family Type | # Families | Family Size |
| Married-Couple | 106 (66.7%) | 2.34 |
| Single Male/Father | 17 (10.7%) | 2.59 |
| Single Female/Mother | 36 (22.6%) | 2.42 |
| Total Families | 159 (100.0%) | 2.38 |
Median Household Size in Stacyville
The median household size in Stacyville is 2.03 persons per household, with single male/father households (17 | 7.1%) accounting for the largest median household size of 3.47 persons per household. non-family households (81 | 33.8%) represent the smallest median household size with 1.01 persons per household.
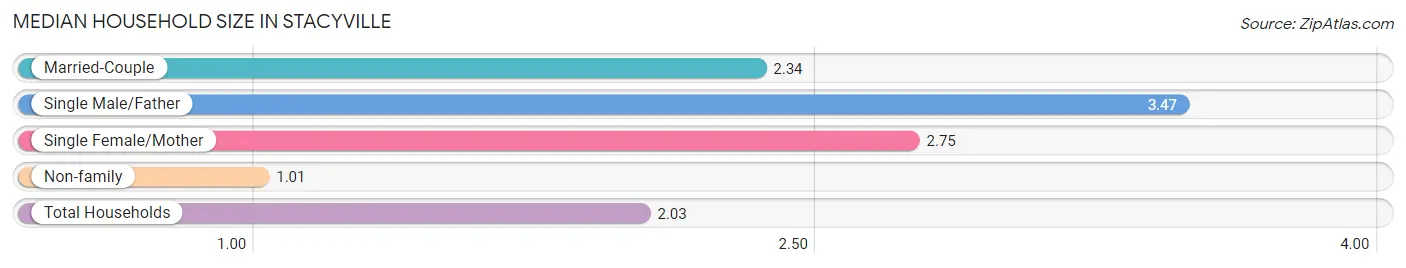
| Household Type | # Households | Household Size |
| Married-Couple | 106 (44.2%) | 2.34 |
| Single Male/Father | 17 (7.1%) | 3.47 |
| Single Female/Mother | 36 (15.0%) | 2.75 |
| Non-family | 81 (33.8%) | 1.01 |
| Total Households | 240 (100.0%) | 2.03 |
Household Size by Marriage Status in Stacyville
Out of a total of 240 households in Stacyville, 159 (66.2%) are family households, while 81 (33.8%) are nonfamily households. The most numerous type of family households are 2-person households, comprising 81, and the most common type of nonfamily households are 1-person households, comprising 79.
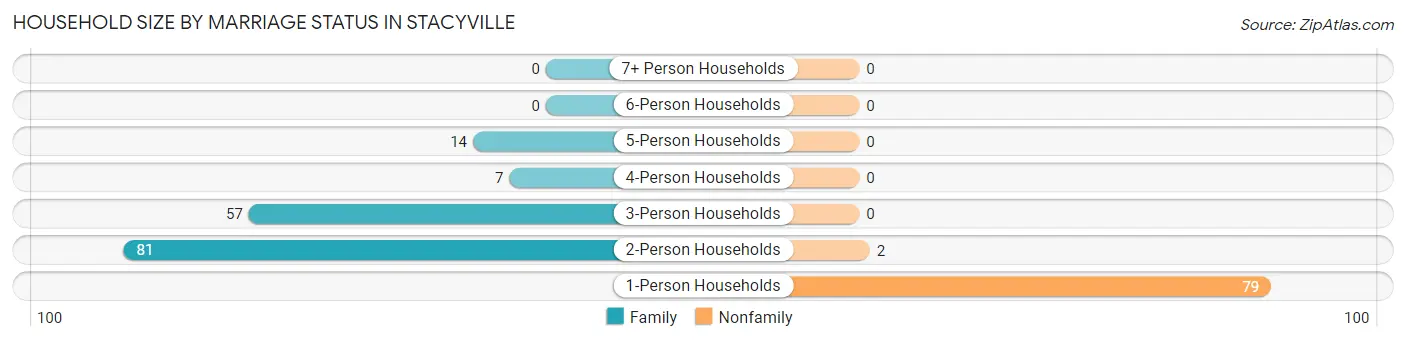
| Household Size | Family Households | Nonfamily Households |
| 1-Person Households | - | 79 (32.9%) |
| 2-Person Households | 81 (33.8%) | 2 (0.8%) |
| 3-Person Households | 57 (23.7%) | 0 (0.0%) |
| 4-Person Households | 7 (2.9%) | 0 (0.0%) |
| 5-Person Households | 14 (5.8%) | 0 (0.0%) |
| 6-Person Households | 0 (0.0%) | 0 (0.0%) |
| 7+ Person Households | 0 (0.0%) | 0 (0.0%) |
| Total | 159 (66.2%) | 81 (33.8%) |
Female Fertility in Stacyville
Fertility by Age in Stacyville
Average fertility rate in Stacyville is 202.0 births per 1,000 women. Women in the age bracket of 20 to 34 years have the highest fertility rate with 327.0 births per 1,000 women. Women in the age bracket of 20 to 34 years acount for 100.0% of all women with births.
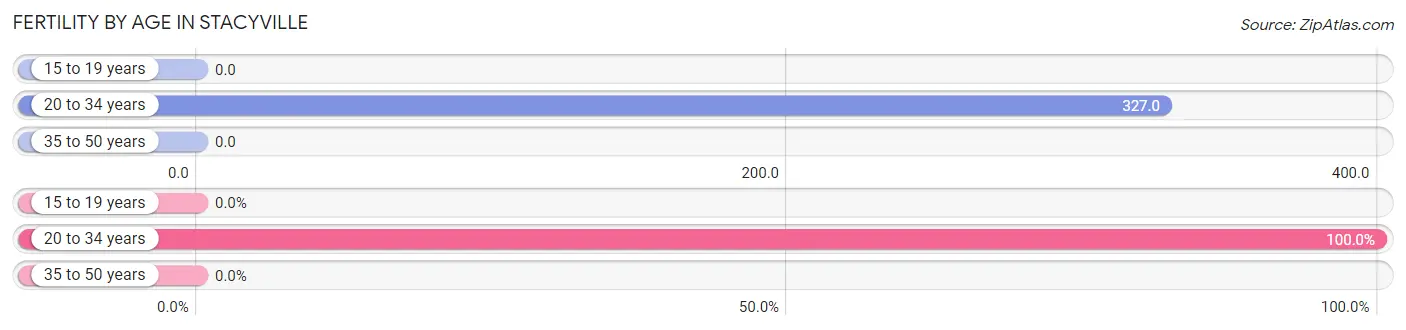
| Age Bracket | Women with Births | Births / 1,000 Women |
| 15 to 19 years | 0 (0.0%) | 0.0 |
| 20 to 34 years | 18 (100.0%) | 327.0 |
| 35 to 50 years | 0 (0.0%) | 0.0 |
| Total | 18 (100.0%) | 202.0 |
Fertility by Age by Marriage Status in Stacyville

| Age Bracket | Married | Unmarried |
| 15 to 19 years | 0 (0.0%) | 0 (0.0%) |
| 20 to 34 years | 0 (0.0%) | 18 (100.0%) |
| 35 to 50 years | 0 (0.0%) | 0 (0.0%) |
| Total | 0 (0.0%) | 18 (100.0%) |
Fertility by Education in Stacyville
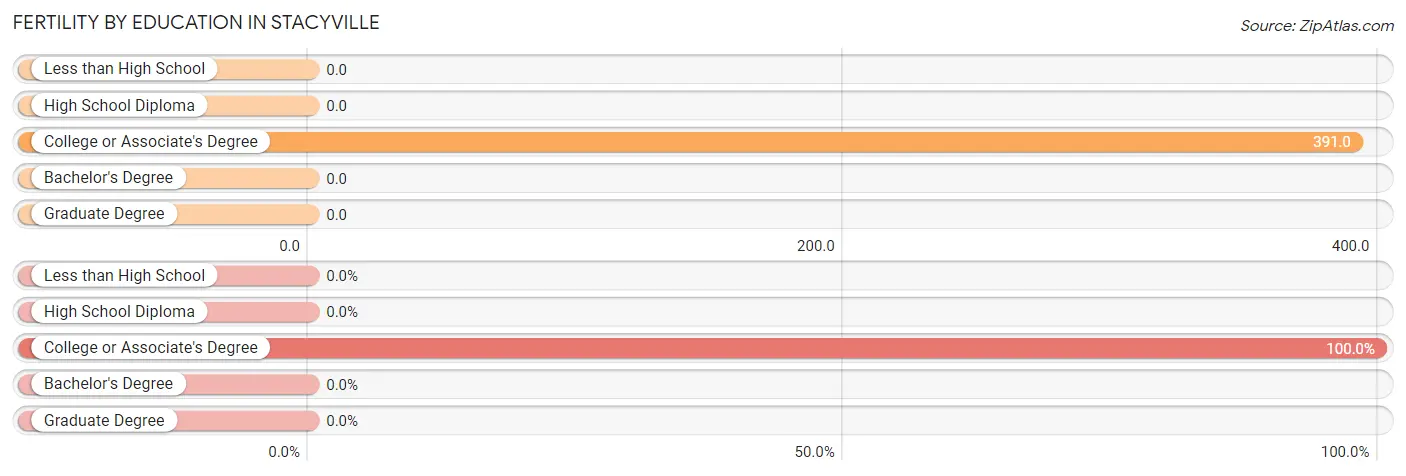
| Educational Attainment | Women with Births | Births / 1,000 Women |
| Less than High School | 0 (0.0%) | 0.0 |
| High School Diploma | 0 (0.0%) | 0.0 |
| College or Associate's Degree | 18 (100.0%) | 391.0 |
| Bachelor's Degree | 0 (0.0%) | 0.0 |
| Graduate Degree | 0 (0.0%) | 0.0 |
| Total | 18 (100.0%) | 202.0 |
Fertility by Education by Marriage Status in Stacyville
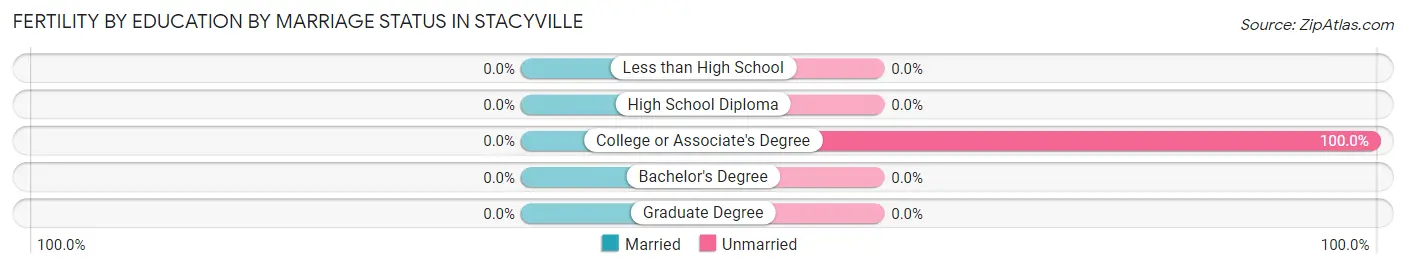
| Educational Attainment | Married | Unmarried |
| Less than High School | 0 (0.0%) | 0 (0.0%) |
| High School Diploma | 0 (0.0%) | 0 (0.0%) |
| College or Associate's Degree | 0 (0.0%) | 18 (100.0%) |
| Bachelor's Degree | 0 (0.0%) | 0 (0.0%) |
| Graduate Degree | 0 (0.0%) | 0 (0.0%) |
| Total | 0 (0.0%) | 18 (100.0%) |
Income in Stacyville
Income Overview in Stacyville
Per Capita Income in Stacyville is $29,333, while median incomes of families and households are $65,469 and $57,188 respectively.
| Characteristic | Number | Measure |
| Per Capita Income | 488 | $29,333 |
| Median Family Income | 159 | $65,469 |
| Mean Family Income | 159 | $67,676 |
| Median Household Income | 240 | $57,188 |
| Mean Household Income | 240 | $60,519 |
| Income Deficit | 159 | $0 |
| Wage / Income Gap (%) | 488 | 33.60% |
| Wage / Income Gap ($) | 488 | 66.40¢ per $1 |
| Gini / Inequality Index | 488 | 0.34 |
Earnings by Sex in Stacyville
Average Earnings in Stacyville are $39,896, $47,250 for men and $31,375 for women, a difference of 33.6%.
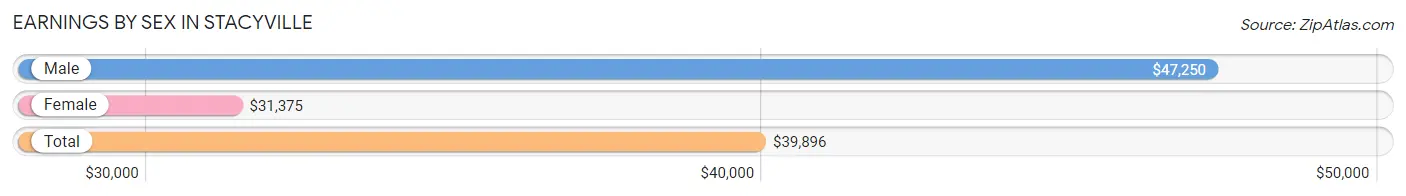
| Sex | Number | Average Earnings |
| Male | 121 (48.2%) | $47,250 |
| Female | 130 (51.8%) | $31,375 |
| Total | 251 (100.0%) | $39,896 |
Earnings by Sex by Income Bracket in Stacyville
The most common earnings brackets in Stacyville are $65,000 to $74,999 for men (20 | 16.5%) and $30,000 to $34,999 for women (20 | 15.4%).
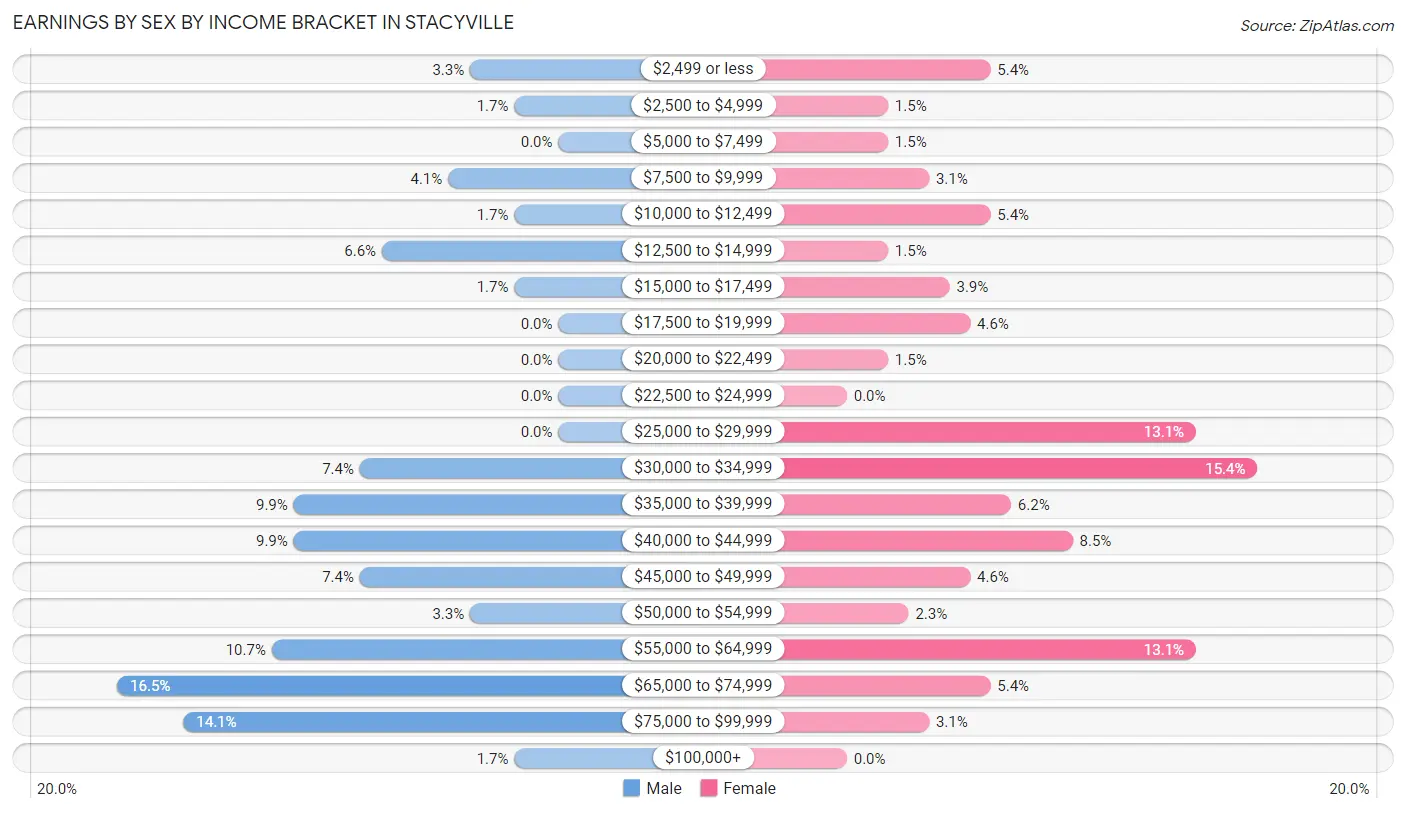
| Income | Male | Female |
| $2,499 or less | 4 (3.3%) | 7 (5.4%) |
| $2,500 to $4,999 | 2 (1.7%) | 2 (1.5%) |
| $5,000 to $7,499 | 0 (0.0%) | 2 (1.5%) |
| $7,500 to $9,999 | 5 (4.1%) | 4 (3.1%) |
| $10,000 to $12,499 | 2 (1.7%) | 7 (5.4%) |
| $12,500 to $14,999 | 8 (6.6%) | 2 (1.5%) |
| $15,000 to $17,499 | 2 (1.7%) | 5 (3.8%) |
| $17,500 to $19,999 | 0 (0.0%) | 6 (4.6%) |
| $20,000 to $22,499 | 0 (0.0%) | 2 (1.5%) |
| $22,500 to $24,999 | 0 (0.0%) | 0 (0.0%) |
| $25,000 to $29,999 | 0 (0.0%) | 17 (13.1%) |
| $30,000 to $34,999 | 9 (7.4%) | 20 (15.4%) |
| $35,000 to $39,999 | 12 (9.9%) | 8 (6.1%) |
| $40,000 to $44,999 | 12 (9.9%) | 11 (8.5%) |
| $45,000 to $49,999 | 9 (7.4%) | 6 (4.6%) |
| $50,000 to $54,999 | 4 (3.3%) | 3 (2.3%) |
| $55,000 to $64,999 | 13 (10.7%) | 17 (13.1%) |
| $65,000 to $74,999 | 20 (16.5%) | 7 (5.4%) |
| $75,000 to $99,999 | 17 (14.1%) | 4 (3.1%) |
| $100,000+ | 2 (1.7%) | 0 (0.0%) |
| Total | 121 (100.0%) | 130 (100.0%) |
Earnings by Sex by Educational Attainment in Stacyville
Average earnings in Stacyville are $48,750 for men and $39,375 for women, a difference of 19.2%. Men with an educational attainment of college or associate's degree enjoy the highest average annual earnings of $55,625, while those with less than high school education earn the least with $41,250. Women with an educational attainment of bachelor's degree earn the most with the average annual earnings of $51,250, while those with high school diploma education have the smallest earnings of $23,750.
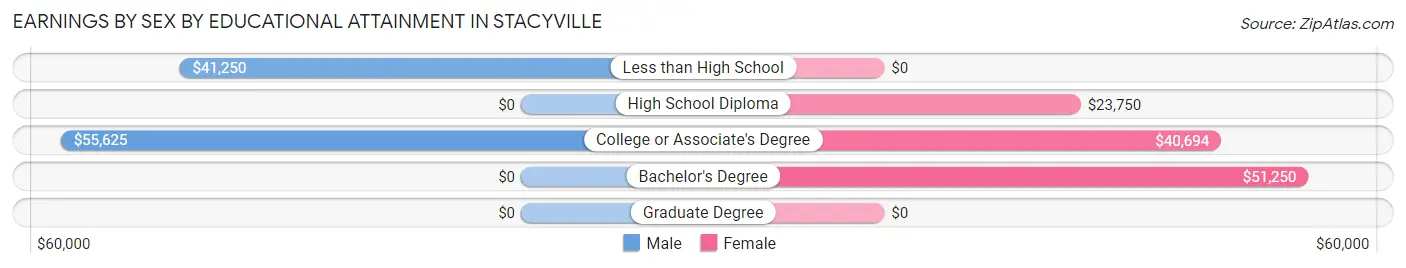
| Educational Attainment | Male Income | Female Income |
| Less than High School | $41,250 | $0 |
| High School Diploma | - | - |
| College or Associate's Degree | $55,625 | $40,694 |
| Bachelor's Degree | - | - |
| Graduate Degree | - | - |
| Total | $48,750 | $39,375 |
Family Income in Stacyville
Family Income Brackets in Stacyville
According to the Stacyville family income data, there are 32 families falling into the $50,000 to $74,999 income range, which is the most common income bracket and makes up 20.1% of all families. Conversely, the $200,000+ income bracket is the least frequent group with only 1 families (0.6%) belonging to this category.
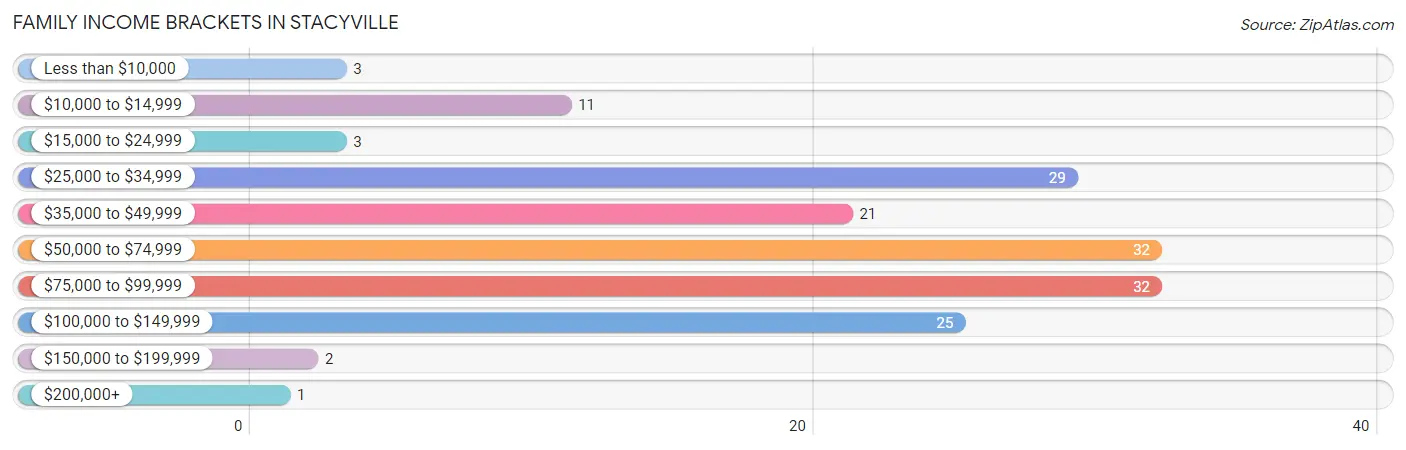
| Income Bracket | # Families | % Families |
| Less than $10,000 | 3 | 1.9% |
| $10,000 to $14,999 | 11 | 6.9% |
| $15,000 to $24,999 | 3 | 1.9% |
| $25,000 to $34,999 | 29 | 18.2% |
| $35,000 to $49,999 | 21 | 13.2% |
| $50,000 to $74,999 | 32 | 20.1% |
| $75,000 to $99,999 | 32 | 20.1% |
| $100,000 to $149,999 | 25 | 15.7% |
| $150,000 to $199,999 | 2 | 1.3% |
| $200,000+ | 1 | 0.6% |
Family Income by Famaliy Size in Stacyville
5-person families (6 | 3.8%) account for the highest median family income in Stacyville with $113,750 per family, while 2-person families (99 | 62.3%) have the highest median income of $33,438 per family member.
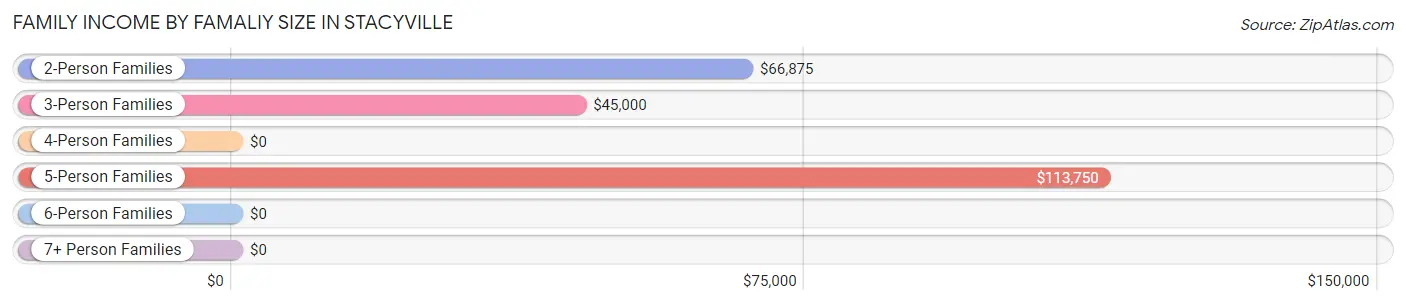
| Income Bracket | # Families | Median Income |
| 2-Person Families | 99 (62.3%) | $66,875 |
| 3-Person Families | 50 (31.5%) | $45,000 |
| 4-Person Families | 4 (2.5%) | $0 |
| 5-Person Families | 6 (3.8%) | $113,750 |
| 6-Person Families | 0 (0.0%) | $0 |
| 7+ Person Families | 0 (0.0%) | $0 |
| Total | 159 (100.0%) | $65,469 |
Family Income by Number of Earners in Stacyville
The median family income in Stacyville is $65,469, with families comprising 2 earners (55) having the highest median family income of $94,063, while families with no earners (30) have the lowest median family income of $37,500, accounting for 34.6% and 18.9% of families, respectively.
| Number of Earners | # Families | Median Income |
| No Earners | 30 (18.9%) | $37,500 |
| 1 Earner | 66 (41.5%) | $40,000 |
| 2 Earners | 55 (34.6%) | $94,063 |
| 3+ Earners | 8 (5.0%) | $93,750 |
| Total | 159 (100.0%) | $65,469 |
Household Income in Stacyville
Household Income Brackets in Stacyville
With 71 households falling in the category, the $50,000 to $74,999 income range is the most frequent in Stacyville, accounting for 29.6% of all households. In contrast, only 1 households (0.4%) fall into the $200,000+ income bracket, making it the least populous group.
| Income Bracket | # Households | % Households |
| Less than $10,000 | 7 | 2.9% |
| $10,000 to $14,999 | 16 | 6.7% |
| $15,000 to $24,999 | 28 | 11.7% |
| $25,000 to $34,999 | 17 | 7.1% |
| $35,000 to $49,999 | 34 | 14.2% |
| $50,000 to $74,999 | 71 | 29.6% |
| $75,000 to $99,999 | 36 | 15.0% |
| $100,000 to $149,999 | 28 | 11.7% |
| $150,000 to $199,999 | 2 | 0.8% |
| $200,000+ | 1 | 0.4% |
Household Income by Householder Age in Stacyville
The median household income in Stacyville is $57,188, with the highest median household income of $60,000 found in the 25 to 44 years age bracket for the primary householder. A total of 68 households (28.3%) fall into this category. Meanwhile, the 15 to 24 years age bracket for the primary householder has the lowest median household income of $0, with 18 households (7.5%) in this group.
| Income Bracket | # Households | Median Income |
| 15 to 24 Years | 18 (7.5%) | $0 |
| 25 to 44 Years | 68 (28.3%) | $60,000 |
| 45 to 64 Years | 46 (19.2%) | $55,000 |
| 65+ Years | 108 (45.0%) | $48,750 |
| Total | 240 (100.0%) | $57,188 |
Poverty in Stacyville
Income Below Poverty by Sex and Age in Stacyville
With 10.6% poverty level for males and 11.0% for females among the residents of Stacyville, under 5 year old males and 12 to 14 year old females are the most vulnerable to poverty, with 9 males (37.5%) and 3 females (100.0%) in their respective age groups living below the poverty level.
| Age Bracket | Male | Female |
| Under 5 Years | 9 (37.5%) | 0 (0.0%) |
| 5 Years | 0 (0.0%) | 0 (0.0%) |
| 6 to 11 Years | 3 (15.0%) | 7 (35.0%) |
| 12 to 14 Years | 0 (0.0%) | 3 (100.0%) |
| 15 Years | 0 (0.0%) | 0 (0.0%) |
| 16 and 17 Years | 0 (0.0%) | 0 (0.0%) |
| 18 to 24 Years | 0 (0.0%) | 0 (0.0%) |
| 25 to 34 Years | 10 (22.2%) | 0 (0.0%) |
| 35 to 44 Years | 0 (0.0%) | 3 (15.0%) |
| 45 to 54 Years | 0 (0.0%) | 0 (0.0%) |
| 55 to 64 Years | 0 (0.0%) | 0 (0.0%) |
| 65 to 74 Years | 2 (3.9%) | 2 (5.3%) |
| 75 Years and over | 3 (7.7%) | 9 (32.1%) |
| Total | 27 (10.6%) | 24 (11.0%) |
Income Above Poverty by Sex and Age in Stacyville
According to the poverty statistics in Stacyville, males aged 5 years and females aged under 5 years are the age groups that are most secure financially, with 100.0% of males and 100.0% of females in these age groups living above the poverty line.
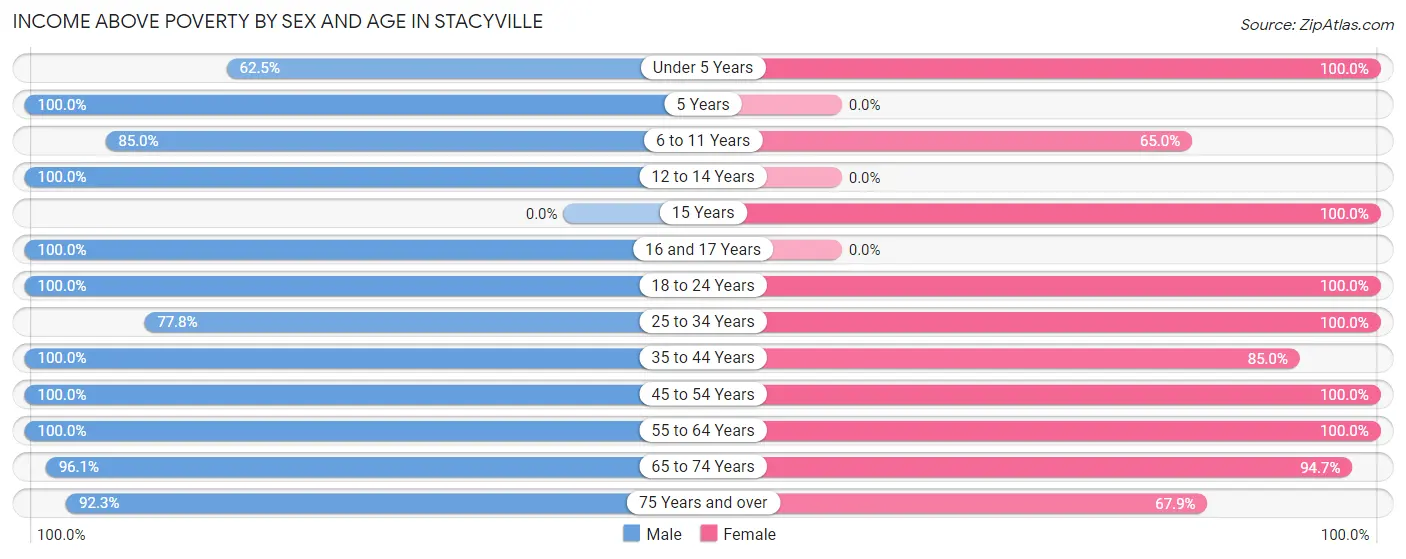
| Age Bracket | Male | Female |
| Under 5 Years | 15 (62.5%) | 15 (100.0%) |
| 5 Years | 1 (100.0%) | 0 (0.0%) |
| 6 to 11 Years | 17 (85.0%) | 13 (65.0%) |
| 12 to 14 Years | 5 (100.0%) | 0 (0.0%) |
| 15 Years | 0 (0.0%) | 3 (100.0%) |
| 16 and 17 Years | 2 (100.0%) | 0 (0.0%) |
| 18 to 24 Years | 5 (100.0%) | 32 (100.0%) |
| 25 to 34 Years | 35 (77.8%) | 23 (100.0%) |
| 35 to 44 Years | 25 (100.0%) | 17 (85.0%) |
| 45 to 54 Years | 3 (100.0%) | 14 (100.0%) |
| 55 to 64 Years | 34 (100.0%) | 23 (100.0%) |
| 65 to 74 Years | 49 (96.1%) | 36 (94.7%) |
| 75 Years and over | 36 (92.3%) | 19 (67.9%) |
| Total | 227 (89.4%) | 195 (89.0%) |
Income Below Poverty Among Married-Couple Families in Stacyville
The poverty statistics for married-couple families in Stacyville show that 2.8% or 3 of the total 106 families live below the poverty line. Families with no children have the highest poverty rate of 3.6%, comprising of 3 families. On the other hand, families with 1 or 2 children have the lowest poverty rate of 0.0%, which includes 0 families.
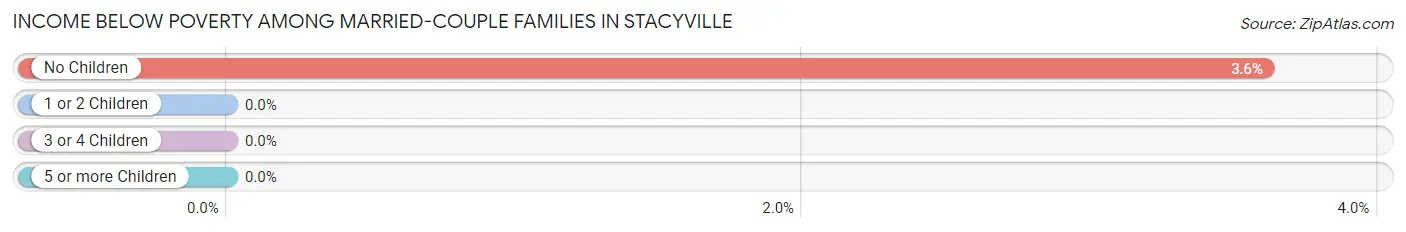
| Children | Above Poverty | Below Poverty |
| No Children | 80 (96.4%) | 3 (3.6%) |
| 1 or 2 Children | 19 (100.0%) | 0 (0.0%) |
| 3 or 4 Children | 4 (100.0%) | 0 (0.0%) |
| 5 or more Children | 0 (0.0%) | 0 (0.0%) |
| Total | 103 (97.2%) | 3 (2.8%) |
Income Below Poverty Among Single-Parent Households in Stacyville
According to the poverty data in Stacyville, 47.1% or 8 single-father households and 8.3% or 3 single-mother households are living below the poverty line. Among single-father households, those with 1 or 2 children have the highest poverty rate, with 8 households (47.1%) experiencing poverty. Likewise, among single-mother households, those with 1 or 2 children have the highest poverty rate, with 3 households (10.3%) falling below the poverty line.
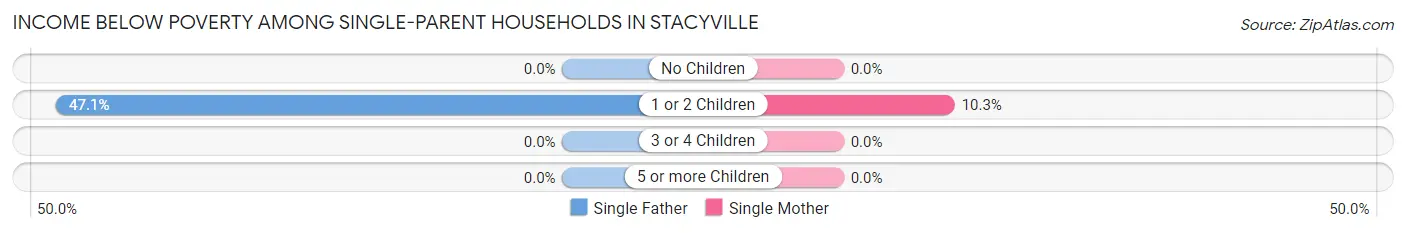
| Children | Single Father | Single Mother |
| No Children | 0 (0.0%) | 0 (0.0%) |
| 1 or 2 Children | 8 (47.1%) | 3 (10.3%) |
| 3 or 4 Children | 0 (0.0%) | 0 (0.0%) |
| 5 or more Children | 0 (0.0%) | 0 (0.0%) |
| Total | 8 (47.1%) | 3 (8.3%) |
Income Below Poverty Among Married-Couple vs Single-Parent Households in Stacyville
The poverty data for Stacyville shows that 3 of the married-couple family households (2.8%) and 11 of the single-parent households (20.7%) are living below the poverty level. Within the married-couple family households, those with no children have the highest poverty rate, with 3 households (3.6%) falling below the poverty line. Among the single-parent households, those with 1 or 2 children have the highest poverty rate, with 11 household (23.9%) living below poverty.
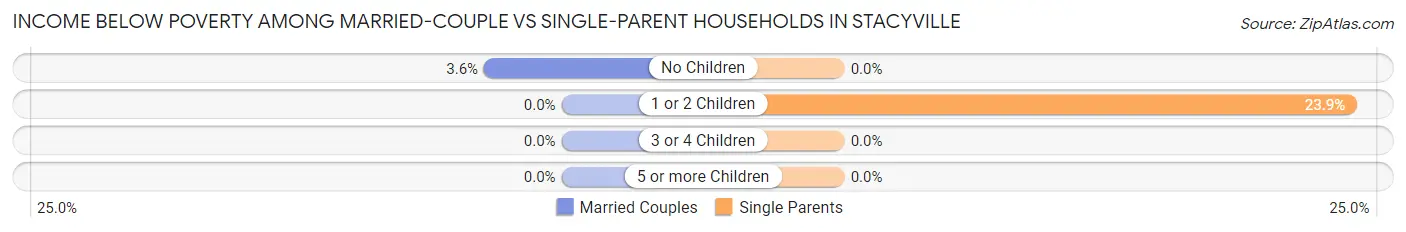
| Children | Married-Couple Families | Single-Parent Households |
| No Children | 3 (3.6%) | 0 (0.0%) |
| 1 or 2 Children | 0 (0.0%) | 11 (23.9%) |
| 3 or 4 Children | 0 (0.0%) | 0 (0.0%) |
| 5 or more Children | 0 (0.0%) | 0 (0.0%) |
| Total | 3 (2.8%) | 11 (20.7%) |
Employment Characteristics in Stacyville
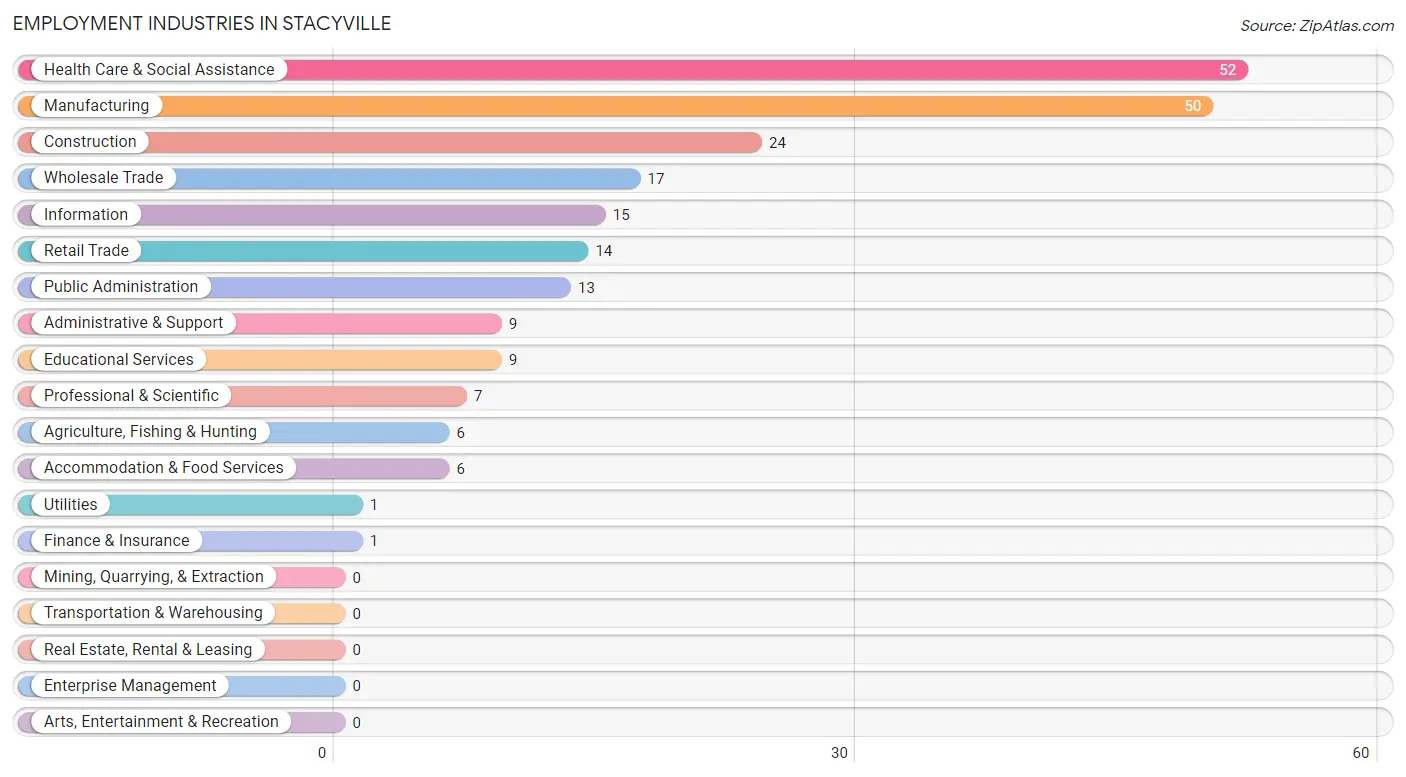
Employment by Class of Employer in Stacyville
Among the 238 employed individuals in Stacyville, private company employees (151 | 63.4%), local government employees (34 | 14.3%), and not-for-profit organizations (25 | 10.5%) make up the most common classes of employment.
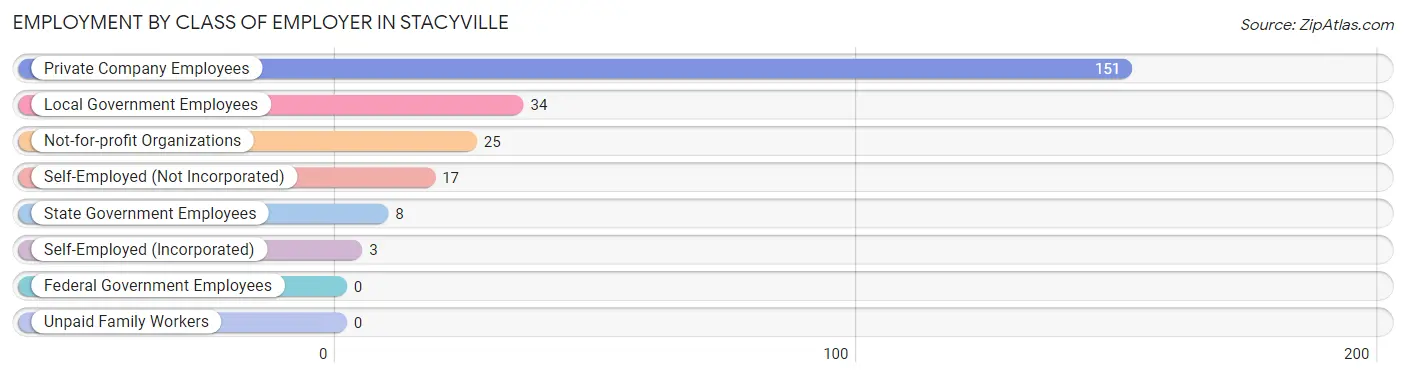
| Employer Class | # Employees | % Employees |
| Private Company Employees | 151 | 63.4% |
| Self-Employed (Incorporated) | 3 | 1.3% |
| Self-Employed (Not Incorporated) | 17 | 7.1% |
| Not-for-profit Organizations | 25 | 10.5% |
| Local Government Employees | 34 | 14.3% |
| State Government Employees | 8 | 3.4% |
| Federal Government Employees | 0 | 0.0% |
| Unpaid Family Workers | 0 | 0.0% |
| Total | 238 | 100.0% |
Employment Status by Age in Stacyville
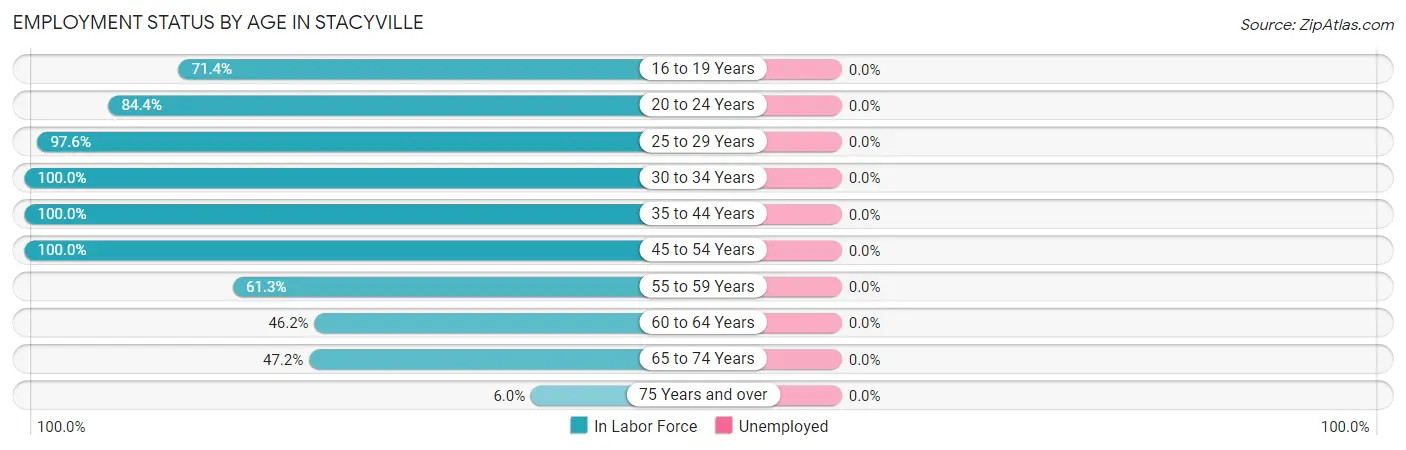
| Age Bracket | In Labor Force | Unemployed |
| 16 to 19 Years | 5 (71.4%) | 0 (0.0%) |
| 20 to 24 Years | 27 (84.4%) | 0 (0.0%) |
| 25 to 29 Years | 41 (97.6%) | 0 (0.0%) |
| 30 to 34 Years | 26 (100.0%) | 0 (0.0%) |
| 35 to 44 Years | 45 (100.0%) | 0 (0.0%) |
| 45 to 54 Years | 17 (100.0%) | 0 (0.0%) |
| 55 to 59 Years | 19 (61.3%) | 0 (0.0%) |
| 60 to 64 Years | 12 (46.2%) | 0 (0.0%) |
| 65 to 74 Years | 42 (47.2%) | 0 (0.0%) |
| 75 Years and over | 4 (6.0%) | 0 (0.0%) |
| Total | 238 (62.3%) | 0 (0.0%) |
Employment Status by Educational Attainment in Stacyville
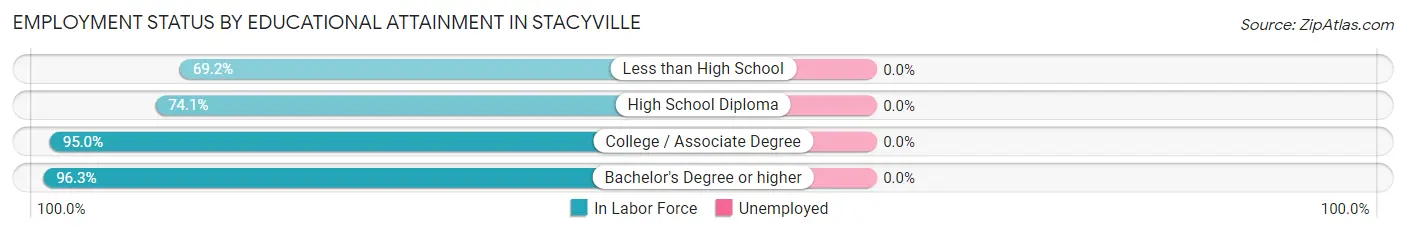
| Educational Attainment | In Labor Force | Unemployed |
| Less than High School | 18 (69.2%) | 0 (0.0%) |
| High School Diploma | 40 (74.1%) | 0 (0.0%) |
| College / Associate Degree | 76 (95.0%) | 0 (0.0%) |
| Bachelor's Degree or higher | 26 (96.3%) | 0 (0.0%) |
| Total | 160 (85.6%) | 0 (0.0%) |
Employment Occupations by Sex in Stacyville
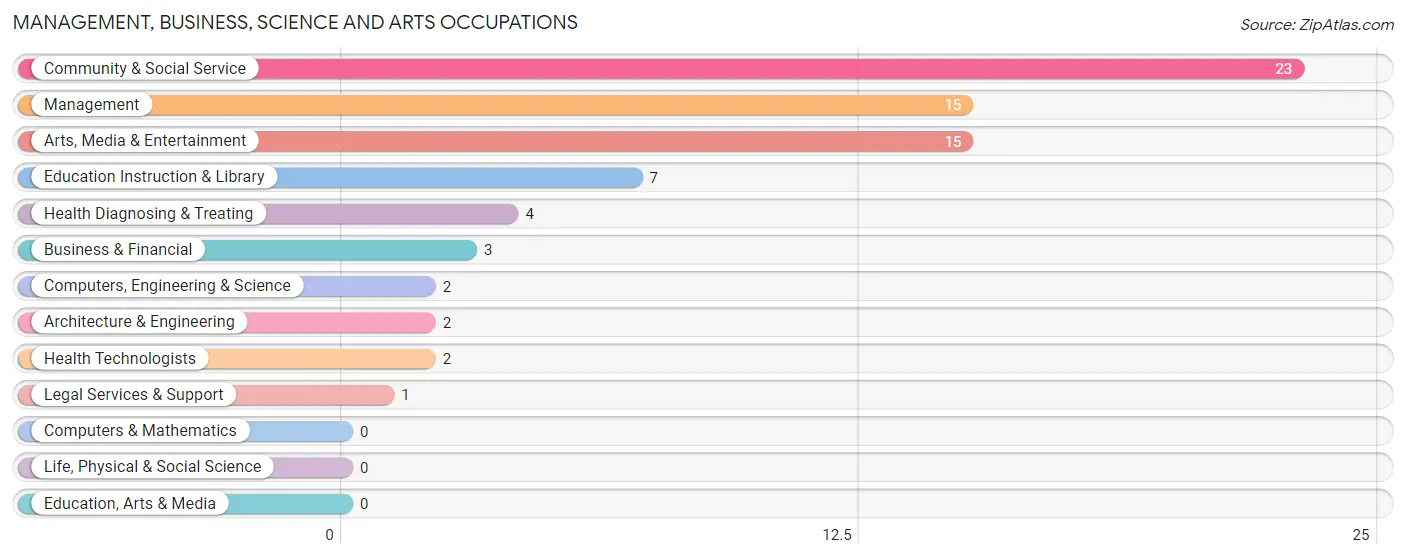
Management, Business, Science and Arts Occupations
The most common Management, Business, Science and Arts occupations in Stacyville are Community & Social Service (23 | 9.7%), Management (15 | 6.3%), Arts, Media & Entertainment (15 | 6.3%), Education Instruction & Library (7 | 2.9%), and Health Diagnosing & Treating (4 | 1.7%).
Management, Business, Science and Arts Occupations by Sex
Within the Management, Business, Science and Arts occupations in Stacyville, the most male-oriented occupations are Computers, Engineering & Science (100.0%), Architecture & Engineering (100.0%), and Arts, Media & Entertainment (100.0%), while the most female-oriented occupations are Business & Financial (100.0%), Legal Services & Support (100.0%), and Education Instruction & Library (100.0%).
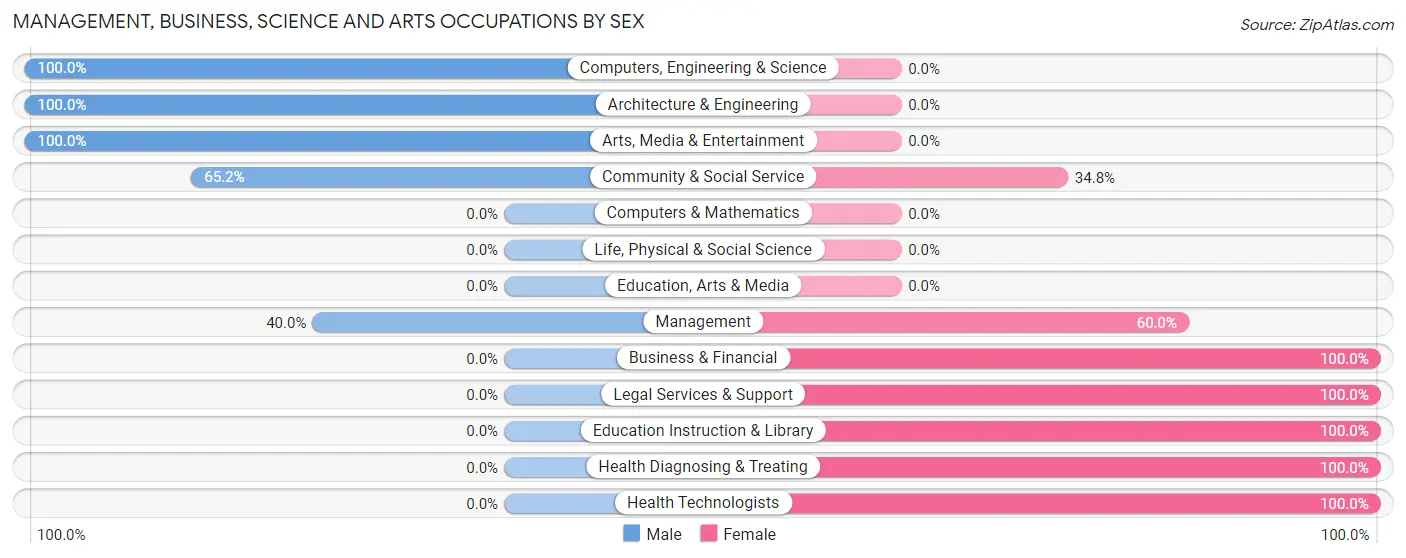
| Occupation | Male | Female |
| Management | 6 (40.0%) | 9 (60.0%) |
| Business & Financial | 0 (0.0%) | 3 (100.0%) |
| Computers, Engineering & Science | 2 (100.0%) | 0 (0.0%) |
| Computers & Mathematics | 0 (0.0%) | 0 (0.0%) |
| Architecture & Engineering | 2 (100.0%) | 0 (0.0%) |
| Life, Physical & Social Science | 0 (0.0%) | 0 (0.0%) |
| Community & Social Service | 15 (65.2%) | 8 (34.8%) |
| Education, Arts & Media | 0 (0.0%) | 0 (0.0%) |
| Legal Services & Support | 0 (0.0%) | 1 (100.0%) |
| Education Instruction & Library | 0 (0.0%) | 7 (100.0%) |
| Arts, Media & Entertainment | 15 (100.0%) | 0 (0.0%) |
| Health Diagnosing & Treating | 0 (0.0%) | 4 (100.0%) |
| Health Technologists | 0 (0.0%) | 2 (100.0%) |
| Total (Category) | 23 (48.9%) | 24 (51.1%) |
| Total (Overall) | 115 (48.3%) | 123 (51.7%) |
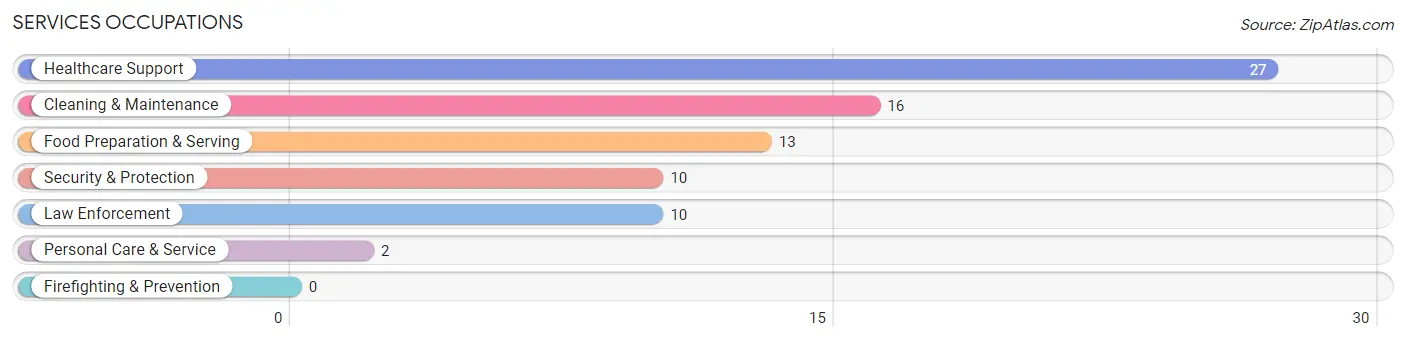
Services Occupations
The most common Services occupations in Stacyville are Healthcare Support (27 | 11.3%), Cleaning & Maintenance (16 | 6.7%), Food Preparation & Serving (13 | 5.5%), Security & Protection (10 | 4.2%), and Law Enforcement (10 | 4.2%).
Services Occupations by Sex
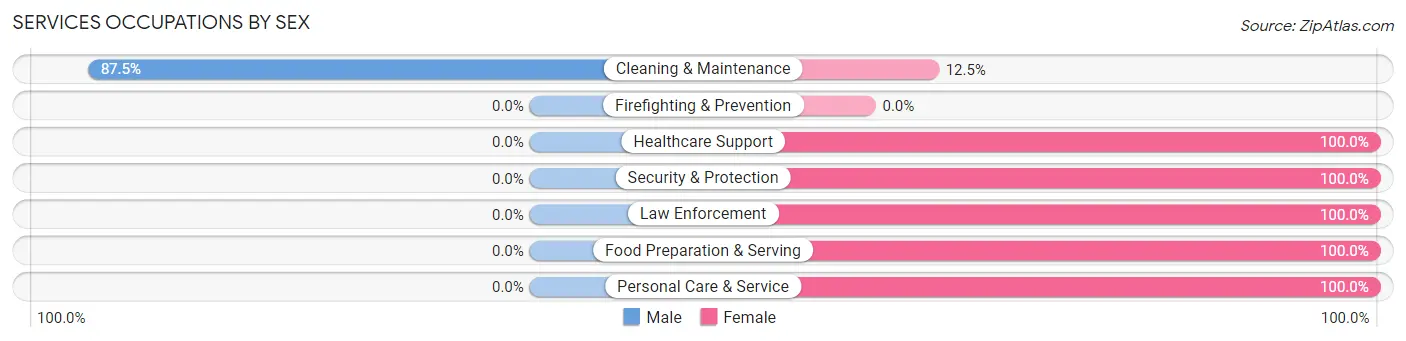
| Occupation | Male | Female |
| Healthcare Support | 0 (0.0%) | 27 (100.0%) |
| Security & Protection | 0 (0.0%) | 10 (100.0%) |
| Firefighting & Prevention | 0 (0.0%) | 0 (0.0%) |
| Law Enforcement | 0 (0.0%) | 10 (100.0%) |
| Food Preparation & Serving | 0 (0.0%) | 13 (100.0%) |
| Cleaning & Maintenance | 14 (87.5%) | 2 (12.5%) |
| Personal Care & Service | 0 (0.0%) | 2 (100.0%) |
| Total (Category) | 14 (20.6%) | 54 (79.4%) |
| Total (Overall) | 115 (48.3%) | 123 (51.7%) |
Sales and Office Occupations
The most common Sales and Office occupations in Stacyville are Office & Administration (34 | 14.3%), and Sales & Related (19 | 8.0%).

Sales and Office Occupations by Sex

| Occupation | Male | Female |
| Sales & Related | 12 (63.2%) | 7 (36.8%) |
| Office & Administration | 5 (14.7%) | 29 (85.3%) |
| Total (Category) | 17 (32.1%) | 36 (67.9%) |
| Total (Overall) | 115 (48.3%) | 123 (51.7%) |
Natural Resources, Construction and Maintenance Occupations
The most common Natural Resources, Construction and Maintenance occupations in Stacyville are Construction & Extraction (21 | 8.8%), Installation, Maintenance & Repair (9 | 3.8%), and Farming, Fishing & Forestry (2 | 0.8%).

Natural Resources, Construction and Maintenance Occupations by Sex

| Occupation | Male | Female |
| Farming, Fishing & Forestry | 0 (0.0%) | 2 (100.0%) |
| Construction & Extraction | 21 (100.0%) | 0 (0.0%) |
| Installation, Maintenance & Repair | 9 (100.0%) | 0 (0.0%) |
| Total (Category) | 30 (93.8%) | 2 (6.2%) |
| Total (Overall) | 115 (48.3%) | 123 (51.7%) |
Production, Transportation and Moving Occupations
The most common Production, Transportation and Moving occupations in Stacyville are Production (30 | 12.6%), and Material Moving (8 | 3.4%).
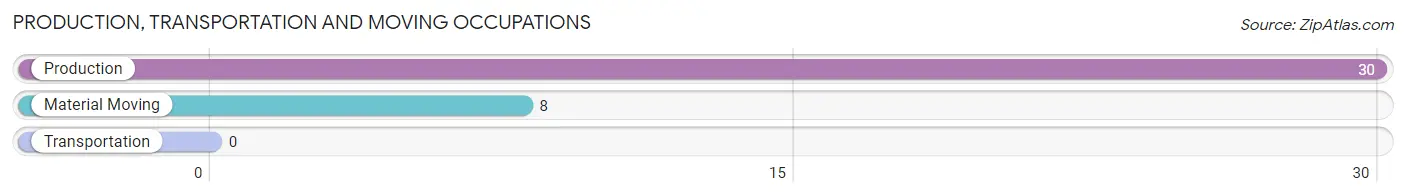
Production, Transportation and Moving Occupations by Sex
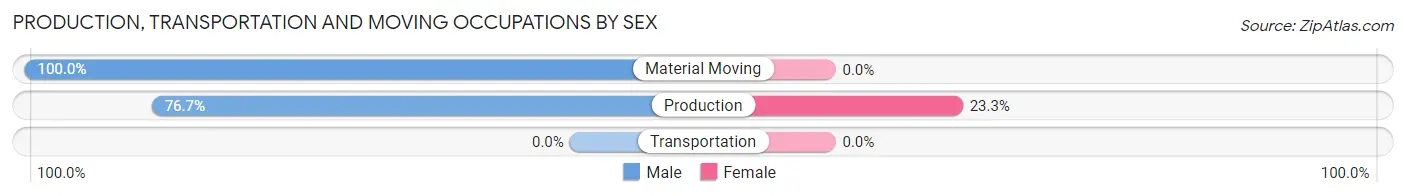
| Occupation | Male | Female |
| Production | 23 (76.7%) | 7 (23.3%) |
| Transportation | 0 (0.0%) | 0 (0.0%) |
| Material Moving | 8 (100.0%) | 0 (0.0%) |
| Total (Category) | 31 (81.6%) | 7 (18.4%) |
| Total (Overall) | 115 (48.3%) | 123 (51.7%) |
Employment Industries by Sex in Stacyville
Employment Industries in Stacyville
The major employment industries in Stacyville include Health Care & Social Assistance (52 | 21.8%), Manufacturing (50 | 21.0%), Construction (24 | 10.1%), Wholesale Trade (17 | 7.1%), and Information (15 | 6.3%).
Employment Industries by Sex in Stacyville
The Stacyville industries that see more men than women are Utilities (100.0%), Information (100.0%), and Construction (95.8%), whereas the industries that tend to have a higher number of women are Finance & Insurance (100.0%), Professional & Scientific (100.0%), and Accommodation & Food Services (100.0%).
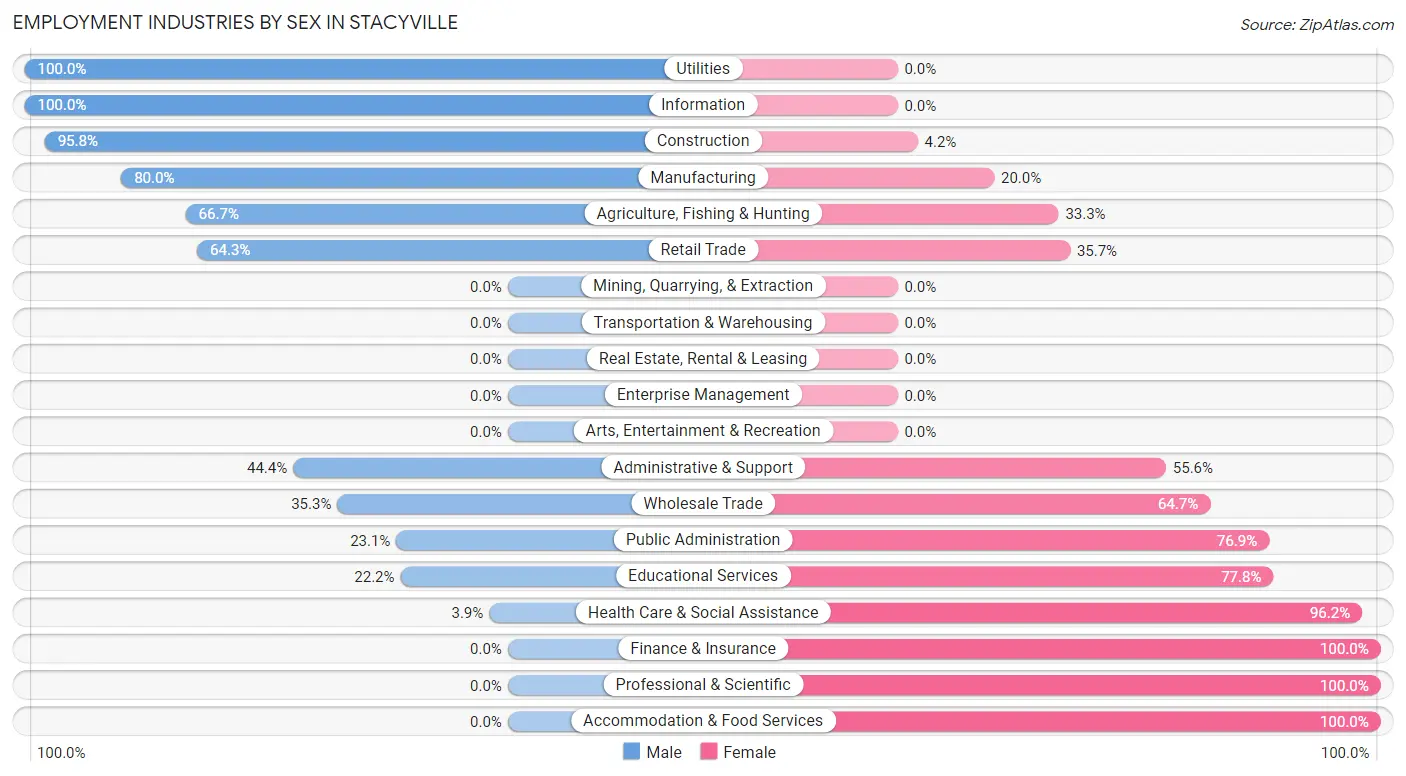
| Industry | Male | Female |
| Agriculture, Fishing & Hunting | 4 (66.7%) | 2 (33.3%) |
| Mining, Quarrying, & Extraction | 0 (0.0%) | 0 (0.0%) |
| Construction | 23 (95.8%) | 1 (4.2%) |
| Manufacturing | 40 (80.0%) | 10 (20.0%) |
| Wholesale Trade | 6 (35.3%) | 11 (64.7%) |
| Retail Trade | 9 (64.3%) | 5 (35.7%) |
| Transportation & Warehousing | 0 (0.0%) | 0 (0.0%) |
| Utilities | 1 (100.0%) | 0 (0.0%) |
| Information | 15 (100.0%) | 0 (0.0%) |
| Finance & Insurance | 0 (0.0%) | 1 (100.0%) |
| Real Estate, Rental & Leasing | 0 (0.0%) | 0 (0.0%) |
| Professional & Scientific | 0 (0.0%) | 7 (100.0%) |
| Enterprise Management | 0 (0.0%) | 0 (0.0%) |
| Administrative & Support | 4 (44.4%) | 5 (55.6%) |
| Educational Services | 2 (22.2%) | 7 (77.8%) |
| Health Care & Social Assistance | 2 (3.8%) | 50 (96.2%) |
| Arts, Entertainment & Recreation | 0 (0.0%) | 0 (0.0%) |
| Accommodation & Food Services | 0 (0.0%) | 6 (100.0%) |
| Public Administration | 3 (23.1%) | 10 (76.9%) |
| Total | 115 (48.3%) | 123 (51.7%) |
Education in Stacyville
School Enrollment in Stacyville
The most common levels of schooling among the 79 students in Stacyville are elementary school (33 | 41.8%), middle school (24 | 30.4%), and high school (7 | 8.9%).
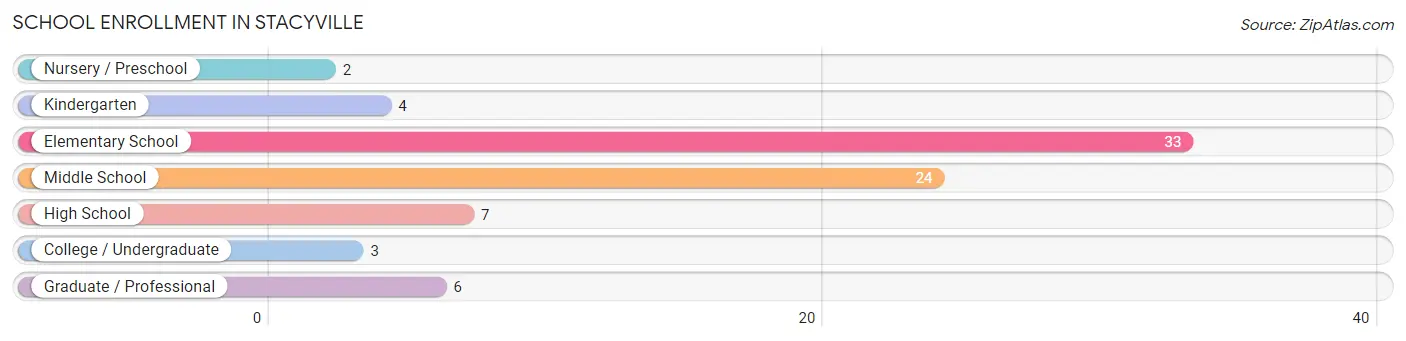
| School Level | # Students | % Students |
| Nursery / Preschool | 2 | 2.5% |
| Kindergarten | 4 | 5.1% |
| Elementary School | 33 | 41.8% |
| Middle School | 24 | 30.4% |
| High School | 7 | 8.9% |
| College / Undergraduate | 3 | 3.8% |
| Graduate / Professional | 6 | 7.6% |
| Total | 79 | 100.0% |
School Enrollment by Age by Funding Source in Stacyville
Out of a total of 79 students who are enrolled in schools in Stacyville, 5 (6.3%) attend a private institution, while the remaining 74 (93.7%) are enrolled in public schools. The age group of 35 years and over has the highest likelihood of being enrolled in private schools, with 2 (100.0% in the age bracket) enrolled. Conversely, the age group of 5 to 9 year old has the lowest likelihood of being enrolled in a private school, with 31 (100.0% in the age bracket) attending a public institution.
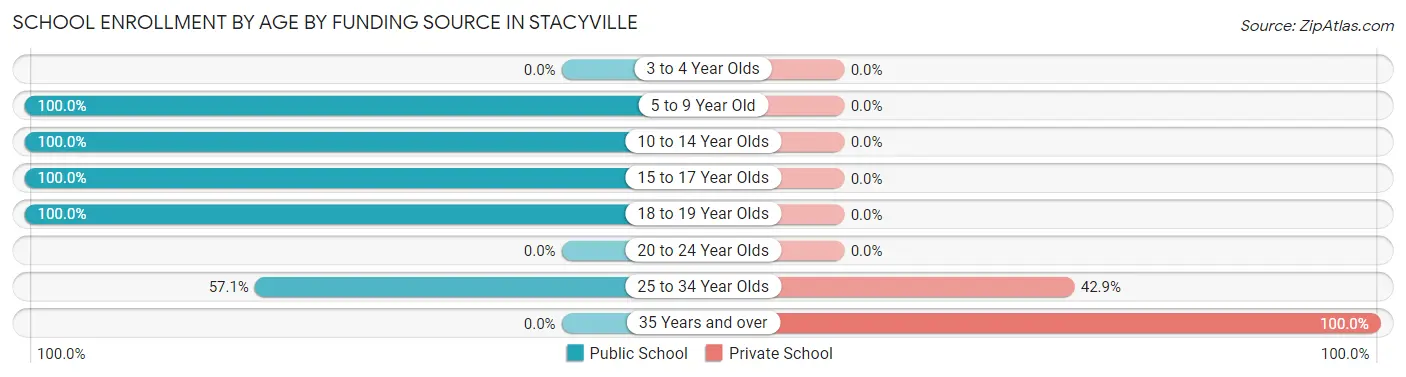
| Age Bracket | Public School | Private School |
| 3 to 4 Year Olds | 0 (0.0%) | 0 (0.0%) |
| 5 to 9 Year Old | 31 (100.0%) | 0 (0.0%) |
| 10 to 14 Year Olds | 32 (100.0%) | 0 (0.0%) |
| 15 to 17 Year Olds | 5 (100.0%) | 0 (0.0%) |
| 18 to 19 Year Olds | 2 (100.0%) | 0 (0.0%) |
| 20 to 24 Year Olds | 0 (0.0%) | 0 (0.0%) |
| 25 to 34 Year Olds | 4 (57.1%) | 3 (42.9%) |
| 35 Years and over | 0 (0.0%) | 2 (100.0%) |
| Total | 74 (93.7%) | 5 (6.3%) |
Educational Attainment by Field of Study in Stacyville
Business (13 | 35.1%), engineering (6 | 16.2%), education (6 | 16.2%), visual & performing arts (4 | 10.8%), and science & technology (3 | 8.1%) are the most common fields of study among 37 individuals in Stacyville who have obtained a bachelor's degree or higher.
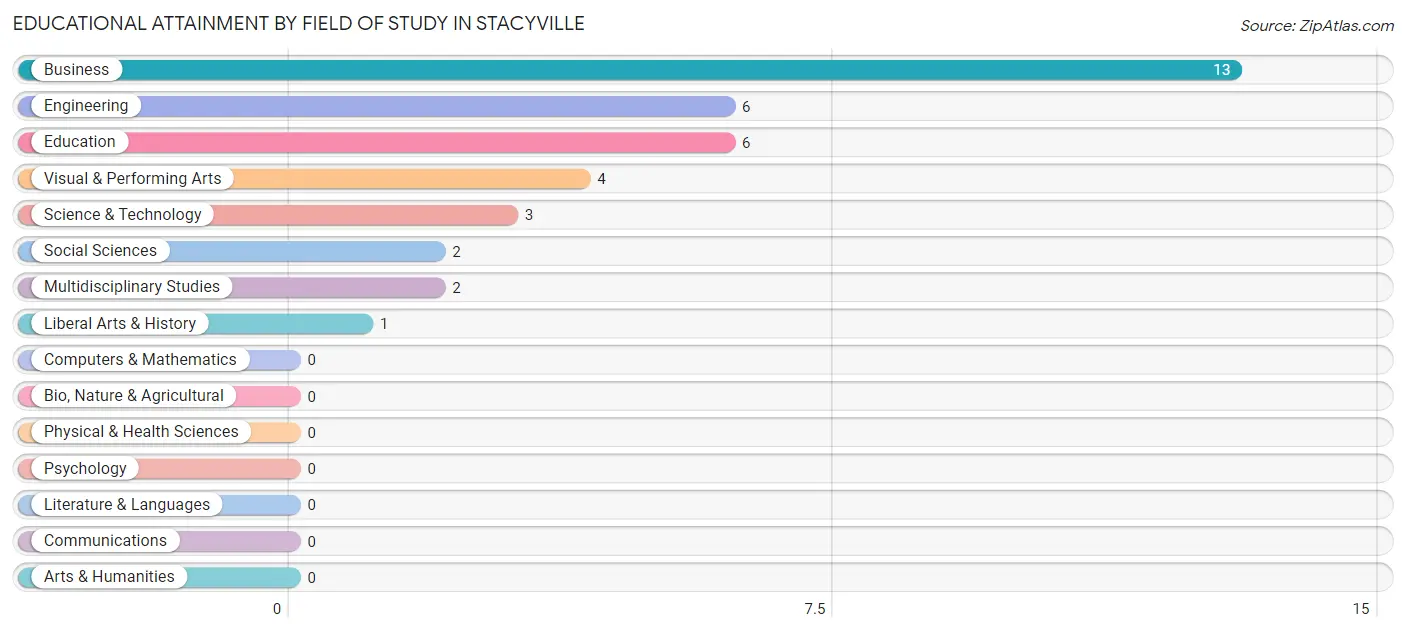
| Field of Study | # Graduates | % Graduates |
| Computers & Mathematics | 0 | 0.0% |
| Bio, Nature & Agricultural | 0 | 0.0% |
| Physical & Health Sciences | 0 | 0.0% |
| Psychology | 0 | 0.0% |
| Social Sciences | 2 | 5.4% |
| Engineering | 6 | 16.2% |
| Multidisciplinary Studies | 2 | 5.4% |
| Science & Technology | 3 | 8.1% |
| Business | 13 | 35.1% |
| Education | 6 | 16.2% |
| Literature & Languages | 0 | 0.0% |
| Liberal Arts & History | 1 | 2.7% |
| Visual & Performing Arts | 4 | 10.8% |
| Communications | 0 | 0.0% |
| Arts & Humanities | 0 | 0.0% |
| Total | 37 | 100.0% |
Transportation & Commute in Stacyville
Vehicle Availability by Sex in Stacyville
The most prevalent vehicle ownership categories in Stacyville are males with 2 vehicles (44, accounting for 38.3%) and females with 2 vehicles (32, making up 35.8%).
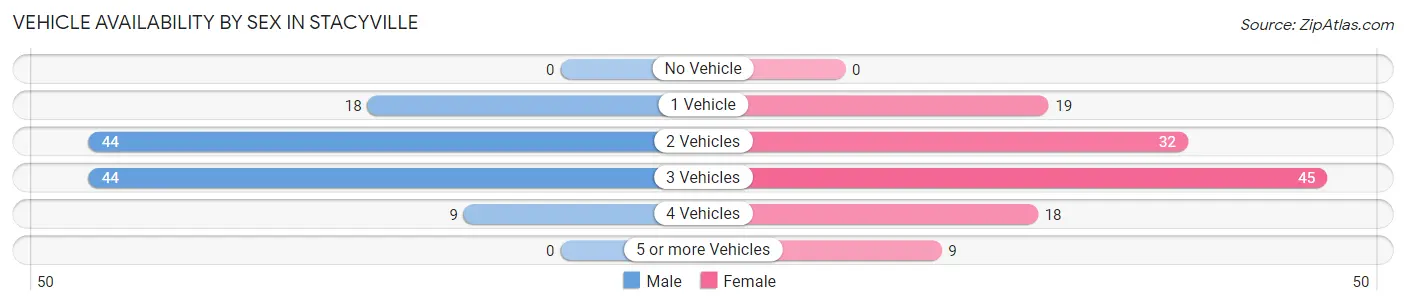
| Vehicles Available | Male | Female |
| No Vehicle | 0 (0.0%) | 0 (0.0%) |
| 1 Vehicle | 18 (15.7%) | 19 (15.4%) |
| 2 Vehicles | 44 (38.3%) | 32 (26.0%) |
| 3 Vehicles | 44 (38.3%) | 45 (36.6%) |
| 4 Vehicles | 9 (7.8%) | 18 (14.6%) |
| 5 or more Vehicles | 0 (0.0%) | 9 (7.3%) |
| Total | 115 (100.0%) | 123 (100.0%) |
Commute Time in Stacyville
The most frequently occuring commute durations in Stacyville are 15 to 19 minutes (52 commuters, 23.6%), 20 to 24 minutes (42 commuters, 19.1%), and 5 to 9 minutes (41 commuters, 18.6%).
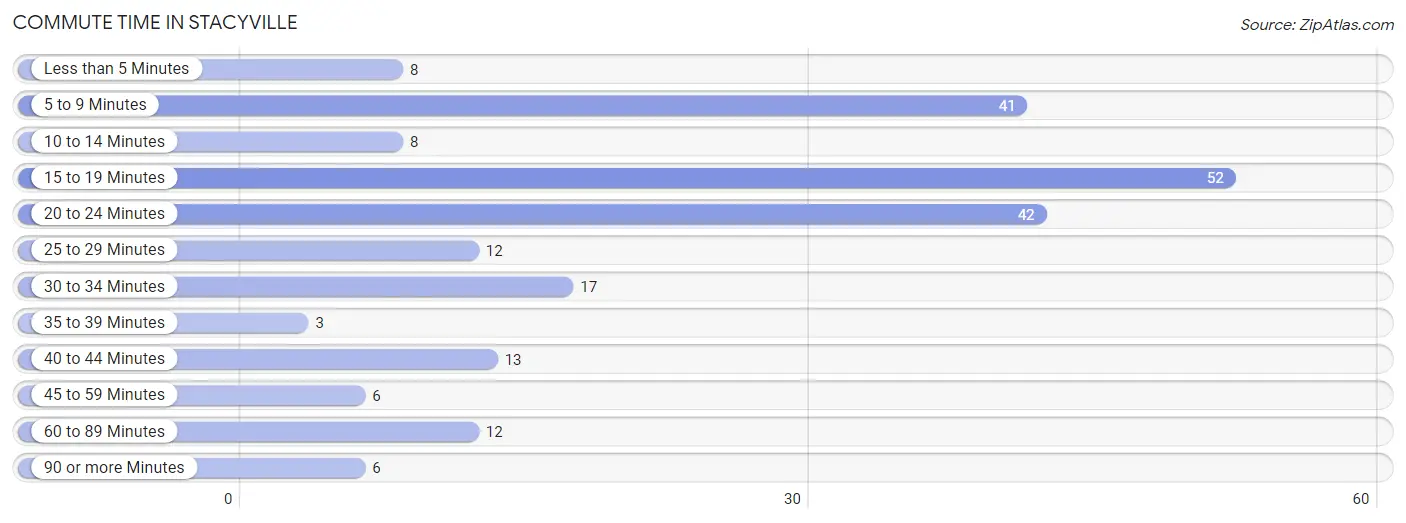
| Commute Time | # Commuters | % Commuters |
| Less than 5 Minutes | 8 | 3.6% |
| 5 to 9 Minutes | 41 | 18.6% |
| 10 to 14 Minutes | 8 | 3.6% |
| 15 to 19 Minutes | 52 | 23.6% |
| 20 to 24 Minutes | 42 | 19.1% |
| 25 to 29 Minutes | 12 | 5.4% |
| 30 to 34 Minutes | 17 | 7.7% |
| 35 to 39 Minutes | 3 | 1.4% |
| 40 to 44 Minutes | 13 | 5.9% |
| 45 to 59 Minutes | 6 | 2.7% |
| 60 to 89 Minutes | 12 | 5.4% |
| 90 or more Minutes | 6 | 2.7% |
Commute Time by Sex in Stacyville
The most common commute times in Stacyville are 15 to 19 minutes (38 commuters, 38.4%) for males and 5 to 9 minutes (29 commuters, 24.0%) for females.
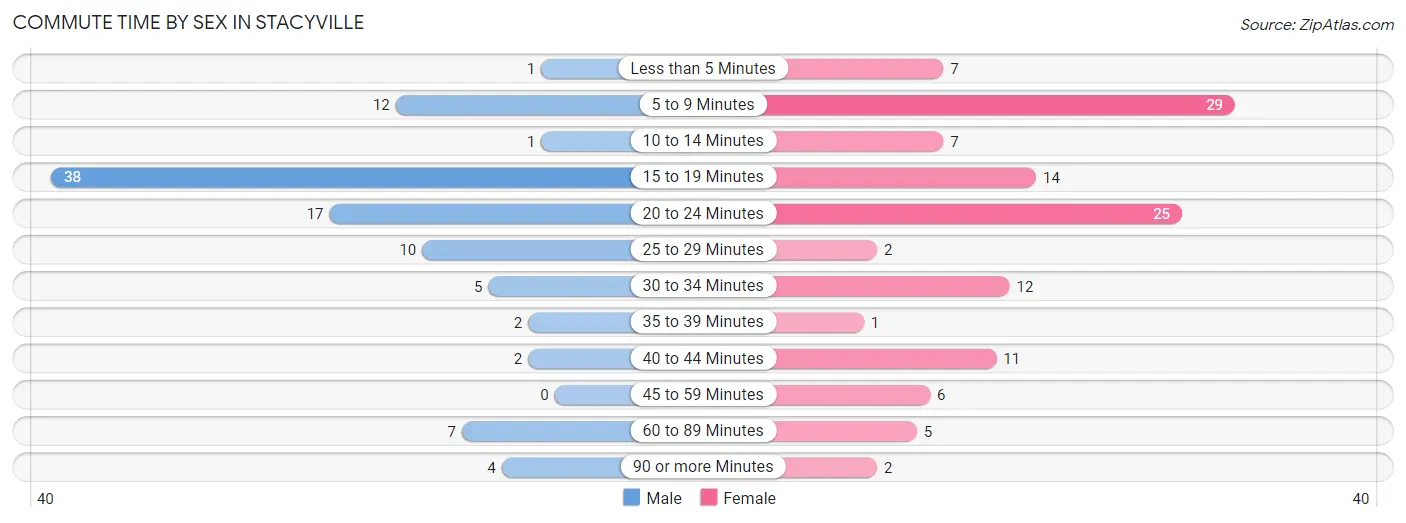
| Commute Time | Male | Female |
| Less than 5 Minutes | 1 (1.0%) | 7 (5.8%) |
| 5 to 9 Minutes | 12 (12.1%) | 29 (24.0%) |
| 10 to 14 Minutes | 1 (1.0%) | 7 (5.8%) |
| 15 to 19 Minutes | 38 (38.4%) | 14 (11.6%) |
| 20 to 24 Minutes | 17 (17.2%) | 25 (20.7%) |
| 25 to 29 Minutes | 10 (10.1%) | 2 (1.7%) |
| 30 to 34 Minutes | 5 (5.1%) | 12 (9.9%) |
| 35 to 39 Minutes | 2 (2.0%) | 1 (0.8%) |
| 40 to 44 Minutes | 2 (2.0%) | 11 (9.1%) |
| 45 to 59 Minutes | 0 (0.0%) | 6 (5.0%) |
| 60 to 89 Minutes | 7 (7.1%) | 5 (4.1%) |
| 90 or more Minutes | 4 (4.0%) | 2 (1.7%) |
Time of Departure to Work by Sex in Stacyville
The most frequent times of departure to work in Stacyville are 6:00 AM to 6:29 AM (24, 24.2%) for males and 5:30 AM to 5:59 AM (23, 19.0%) for females.
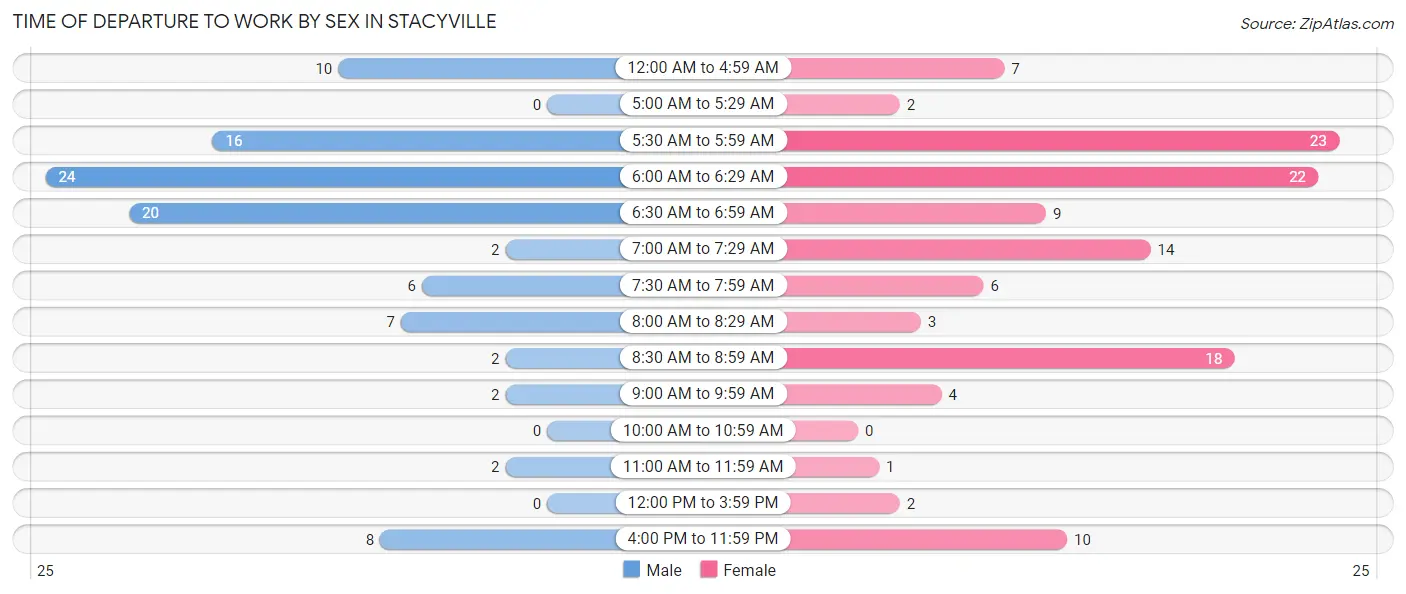
| Time of Departure | Male | Female |
| 12:00 AM to 4:59 AM | 10 (10.1%) | 7 (5.8%) |
| 5:00 AM to 5:29 AM | 0 (0.0%) | 2 (1.7%) |
| 5:30 AM to 5:59 AM | 16 (16.2%) | 23 (19.0%) |
| 6:00 AM to 6:29 AM | 24 (24.2%) | 22 (18.2%) |
| 6:30 AM to 6:59 AM | 20 (20.2%) | 9 (7.4%) |
| 7:00 AM to 7:29 AM | 2 (2.0%) | 14 (11.6%) |
| 7:30 AM to 7:59 AM | 6 (6.1%) | 6 (5.0%) |
| 8:00 AM to 8:29 AM | 7 (7.1%) | 3 (2.5%) |
| 8:30 AM to 8:59 AM | 2 (2.0%) | 18 (14.9%) |
| 9:00 AM to 9:59 AM | 2 (2.0%) | 4 (3.3%) |
| 10:00 AM to 10:59 AM | 0 (0.0%) | 0 (0.0%) |
| 11:00 AM to 11:59 AM | 2 (2.0%) | 1 (0.8%) |
| 12:00 PM to 3:59 PM | 0 (0.0%) | 2 (1.7%) |
| 4:00 PM to 11:59 PM | 8 (8.1%) | 10 (8.3%) |
| Total | 99 (100.0%) | 121 (100.0%) |
Housing Occupancy in Stacyville
Occupancy by Ownership in Stacyville
Of the total 240 dwellings in Stacyville, owner-occupied units account for 208 (86.7%), while renter-occupied units make up 32 (13.3%).
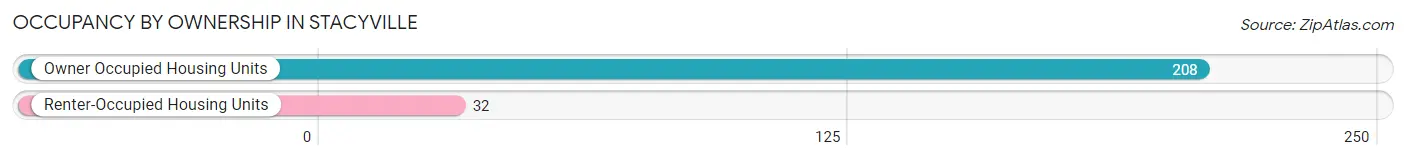
| Occupancy | # Housing Units | % Housing Units |
| Owner Occupied Housing Units | 208 | 86.7% |
| Renter-Occupied Housing Units | 32 | 13.3% |
| Total Occupied Housing Units | 240 | 100.0% |
Occupancy by Household Size in Stacyville
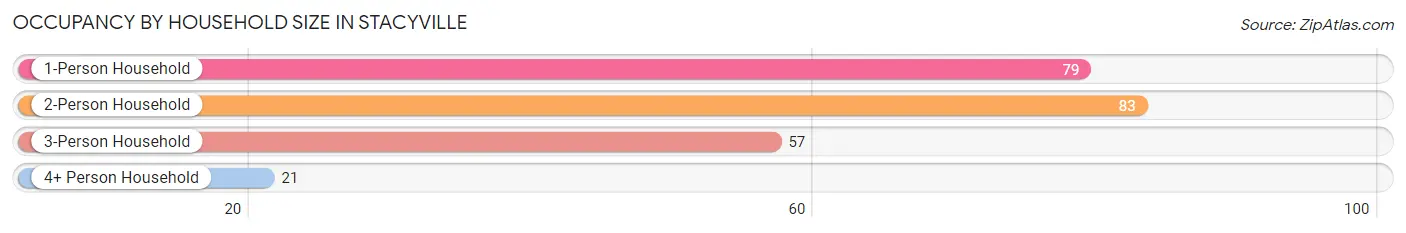
| Household Size | # Housing Units | % Housing Units |
| 1-Person Household | 79 | 32.9% |
| 2-Person Household | 83 | 34.6% |
| 3-Person Household | 57 | 23.7% |
| 4+ Person Household | 21 | 8.7% |
| Total Housing Units | 240 | 100.0% |
Occupancy by Ownership by Household Size in Stacyville
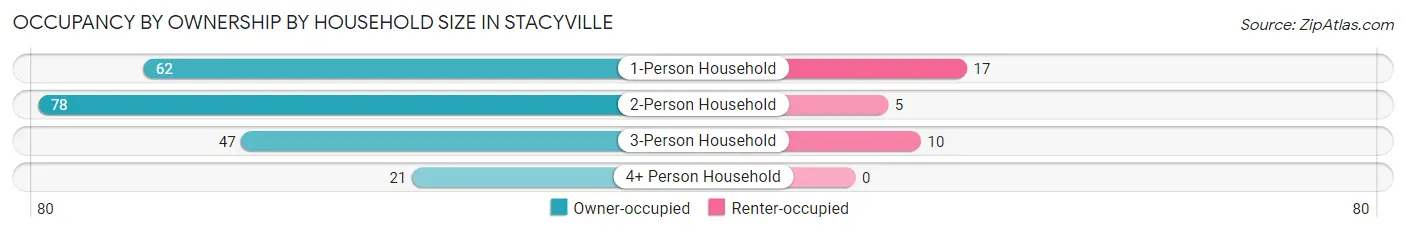
| Household Size | Owner-occupied | Renter-occupied |
| 1-Person Household | 62 (78.5%) | 17 (21.5%) |
| 2-Person Household | 78 (94.0%) | 5 (6.0%) |
| 3-Person Household | 47 (82.5%) | 10 (17.5%) |
| 4+ Person Household | 21 (100.0%) | 0 (0.0%) |
| Total Housing Units | 208 (86.7%) | 32 (13.3%) |
Occupancy by Educational Attainment in Stacyville
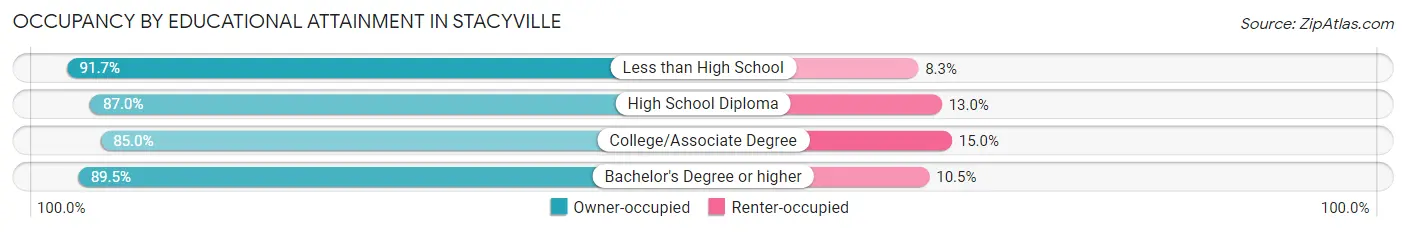
| Household Size | Owner-occupied | Renter-occupied |
| Less than High School | 22 (91.7%) | 2 (8.3%) |
| High School Diploma | 67 (87.0%) | 10 (13.0%) |
| College/Associate Degree | 102 (85.0%) | 18 (15.0%) |
| Bachelor's Degree or higher | 17 (89.5%) | 2 (10.5%) |
Occupancy by Age of Householder in Stacyville
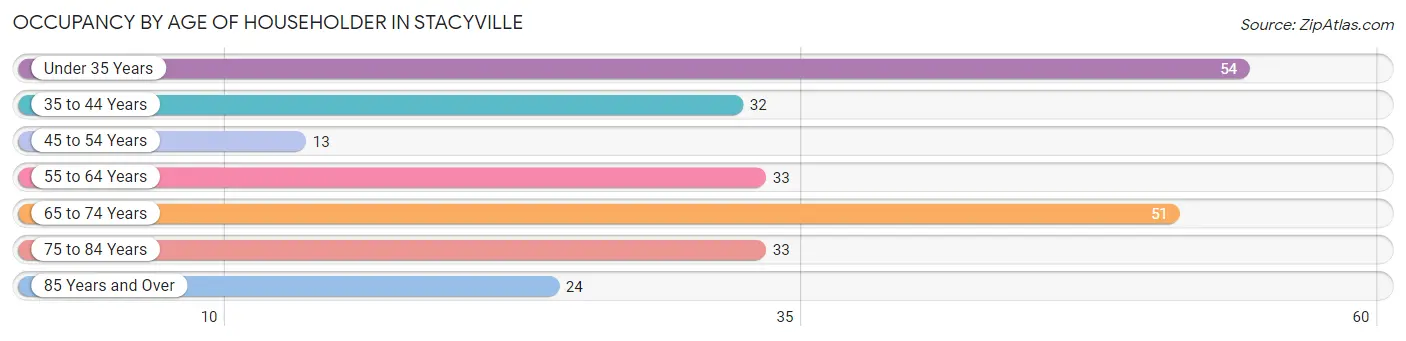
| Age Bracket | # Households | % Households |
| Under 35 Years | 54 | 22.5% |
| 35 to 44 Years | 32 | 13.3% |
| 45 to 54 Years | 13 | 5.4% |
| 55 to 64 Years | 33 | 13.8% |
| 65 to 74 Years | 51 | 21.2% |
| 75 to 84 Years | 33 | 13.8% |
| 85 Years and Over | 24 | 10.0% |
| Total | 240 | 100.0% |
Housing Finances in Stacyville
Median Income by Occupancy in Stacyville
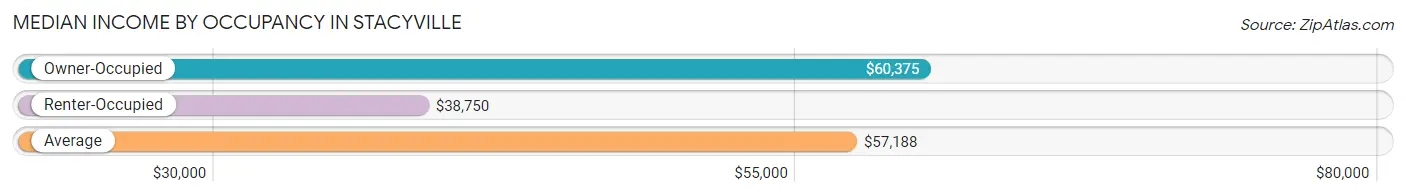
| Occupancy Type | # Households | Median Income |
| Owner-Occupied | 208 (86.7%) | $60,375 |
| Renter-Occupied | 32 (13.3%) | $38,750 |
| Average | 240 (100.0%) | $57,188 |
Occupancy by Householder Income Bracket in Stacyville
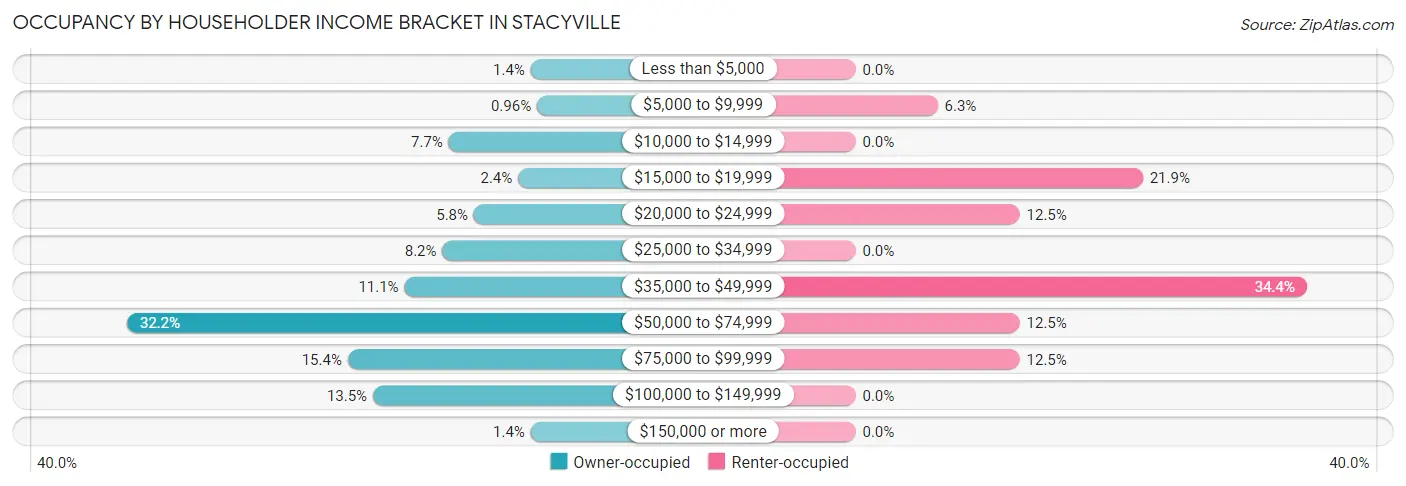
| Income Bracket | Owner-occupied | Renter-occupied |
| Less than $5,000 | 3 (1.4%) | 0 (0.0%) |
| $5,000 to $9,999 | 2 (1.0%) | 2 (6.2%) |
| $10,000 to $14,999 | 16 (7.7%) | 0 (0.0%) |
| $15,000 to $19,999 | 5 (2.4%) | 7 (21.9%) |
| $20,000 to $24,999 | 12 (5.8%) | 4 (12.5%) |
| $25,000 to $34,999 | 17 (8.2%) | 0 (0.0%) |
| $35,000 to $49,999 | 23 (11.1%) | 11 (34.4%) |
| $50,000 to $74,999 | 67 (32.2%) | 4 (12.5%) |
| $75,000 to $99,999 | 32 (15.4%) | 4 (12.5%) |
| $100,000 to $149,999 | 28 (13.5%) | 0 (0.0%) |
| $150,000 or more | 3 (1.4%) | 0 (0.0%) |
| Total | 208 (100.0%) | 32 (100.0%) |
Monthly Housing Cost Tiers in Stacyville
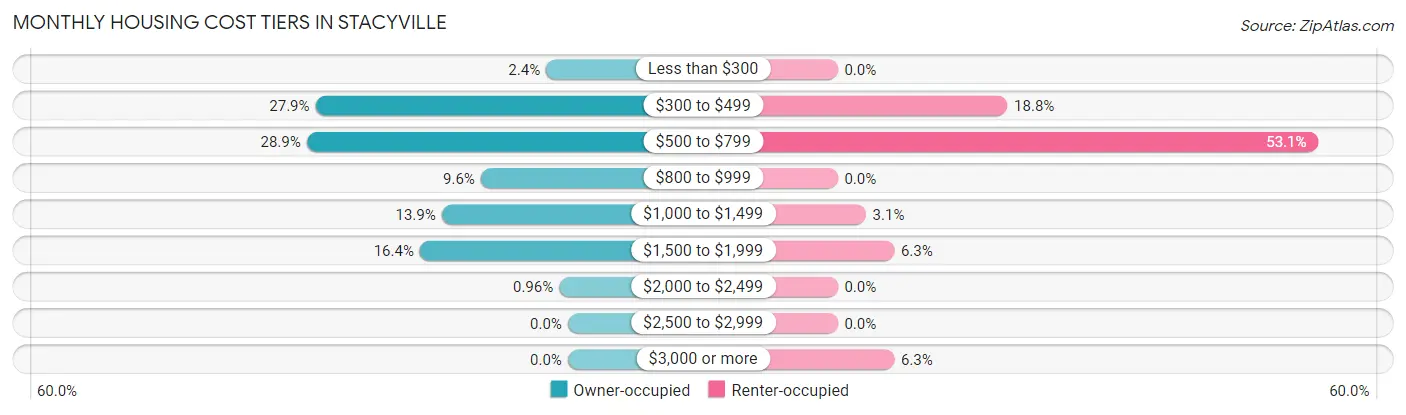
| Monthly Cost | Owner-occupied | Renter-occupied |
| Less than $300 | 5 (2.4%) | 0 (0.0%) |
| $300 to $499 | 58 (27.9%) | 6 (18.8%) |
| $500 to $799 | 60 (28.8%) | 17 (53.1%) |
| $800 to $999 | 20 (9.6%) | 0 (0.0%) |
| $1,000 to $1,499 | 29 (13.9%) | 1 (3.1%) |
| $1,500 to $1,999 | 34 (16.4%) | 2 (6.2%) |
| $2,000 to $2,499 | 2 (1.0%) | 0 (0.0%) |
| $2,500 to $2,999 | 0 (0.0%) | 0 (0.0%) |
| $3,000 or more | 0 (0.0%) | 2 (6.2%) |
| Total | 208 (100.0%) | 32 (100.0%) |
Physical Housing Characteristics in Stacyville
Housing Structures in Stacyville
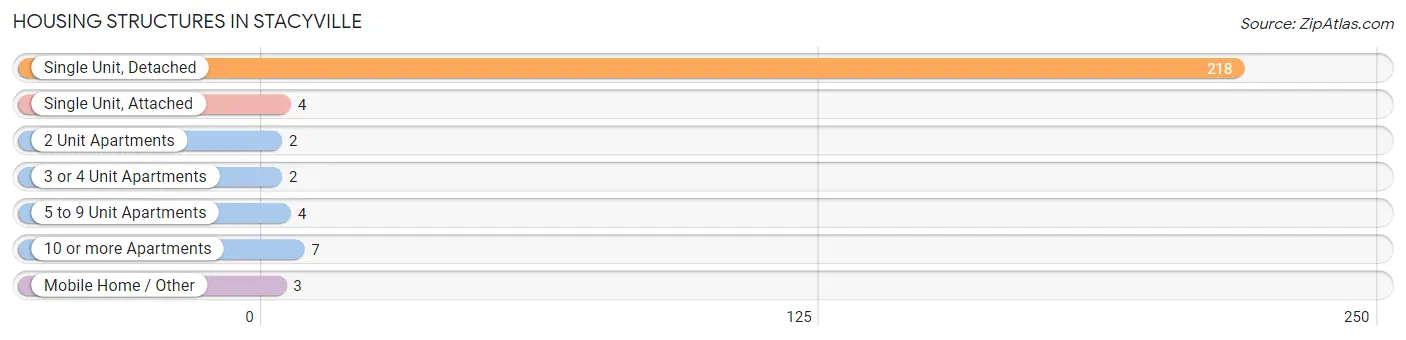
| Structure Type | # Housing Units | % Housing Units |
| Single Unit, Detached | 218 | 90.8% |
| Single Unit, Attached | 4 | 1.7% |
| 2 Unit Apartments | 2 | 0.8% |
| 3 or 4 Unit Apartments | 2 | 0.8% |
| 5 to 9 Unit Apartments | 4 | 1.7% |
| 10 or more Apartments | 7 | 2.9% |
| Mobile Home / Other | 3 | 1.3% |
| Total | 240 | 100.0% |
Housing Structures by Occupancy in Stacyville
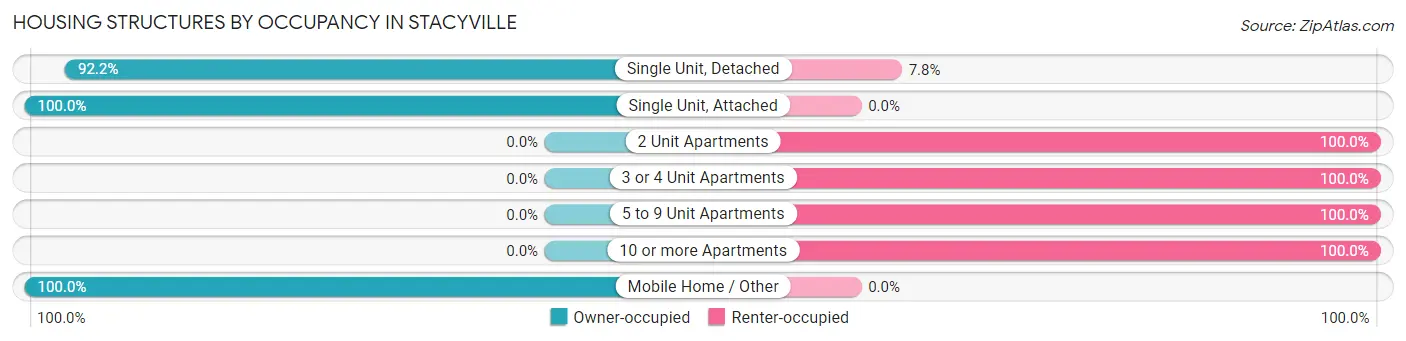
| Structure Type | Owner-occupied | Renter-occupied |
| Single Unit, Detached | 201 (92.2%) | 17 (7.8%) |
| Single Unit, Attached | 4 (100.0%) | 0 (0.0%) |
| 2 Unit Apartments | 0 (0.0%) | 2 (100.0%) |
| 3 or 4 Unit Apartments | 0 (0.0%) | 2 (100.0%) |
| 5 to 9 Unit Apartments | 0 (0.0%) | 4 (100.0%) |
| 10 or more Apartments | 0 (0.0%) | 7 (100.0%) |
| Mobile Home / Other | 3 (100.0%) | 0 (0.0%) |
| Total | 208 (86.7%) | 32 (13.3%) |
Housing Structures by Number of Rooms in Stacyville
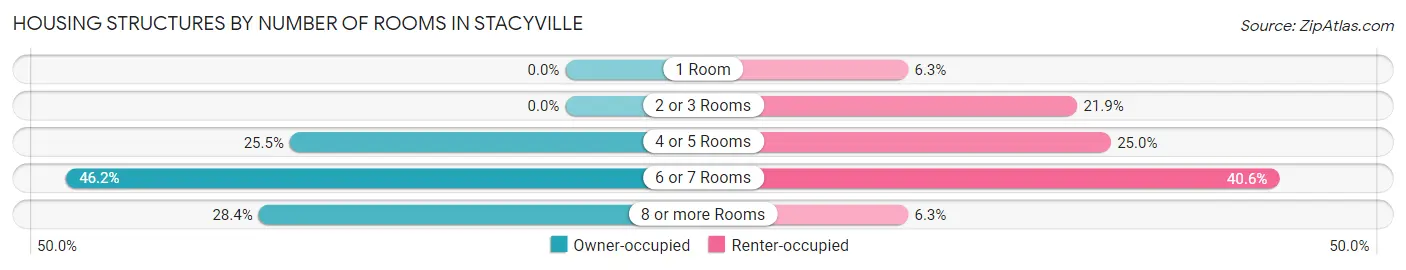
| Number of Rooms | Owner-occupied | Renter-occupied |
| 1 Room | 0 (0.0%) | 2 (6.2%) |
| 2 or 3 Rooms | 0 (0.0%) | 7 (21.9%) |
| 4 or 5 Rooms | 53 (25.5%) | 8 (25.0%) |
| 6 or 7 Rooms | 96 (46.2%) | 13 (40.6%) |
| 8 or more Rooms | 59 (28.4%) | 2 (6.2%) |
| Total | 208 (100.0%) | 32 (100.0%) |
Housing Structure by Heating Type in Stacyville
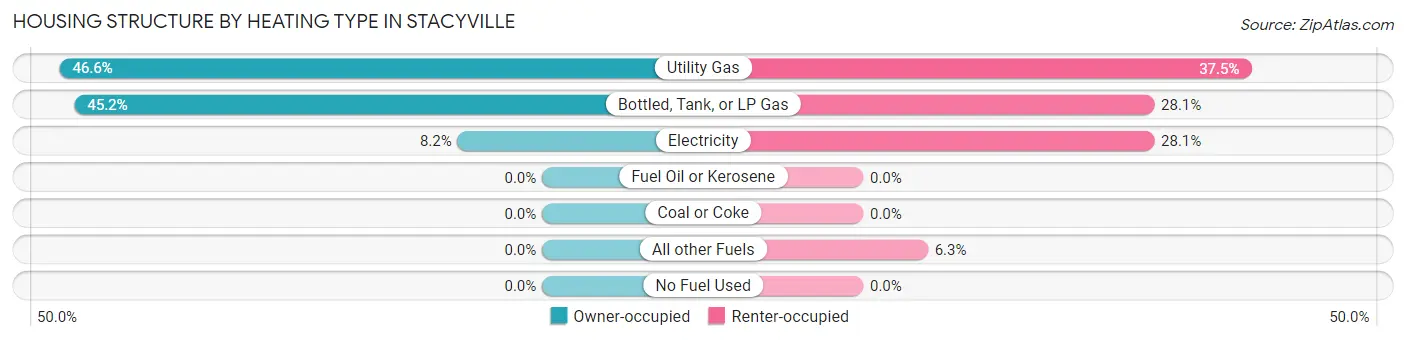
| Heating Type | Owner-occupied | Renter-occupied |
| Utility Gas | 97 (46.6%) | 12 (37.5%) |
| Bottled, Tank, or LP Gas | 94 (45.2%) | 9 (28.1%) |
| Electricity | 17 (8.2%) | 9 (28.1%) |
| Fuel Oil or Kerosene | 0 (0.0%) | 0 (0.0%) |
| Coal or Coke | 0 (0.0%) | 0 (0.0%) |
| All other Fuels | 0 (0.0%) | 2 (6.2%) |
| No Fuel Used | 0 (0.0%) | 0 (0.0%) |
| Total | 208 (100.0%) | 32 (100.0%) |
Household Vehicle Usage in Stacyville
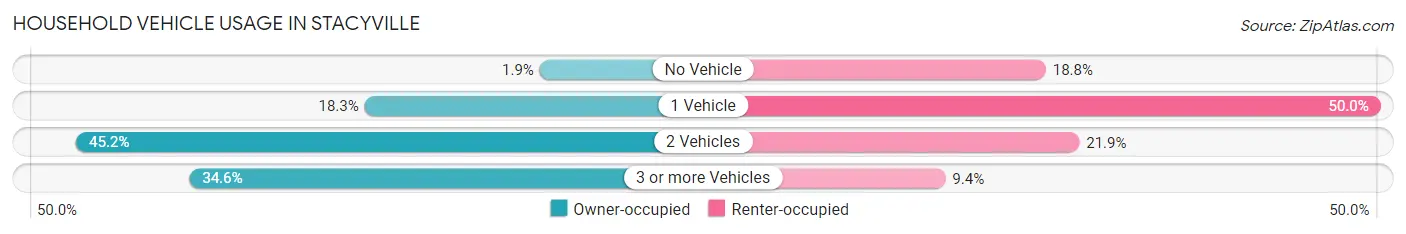
| Vehicles per Household | Owner-occupied | Renter-occupied |
| No Vehicle | 4 (1.9%) | 6 (18.8%) |
| 1 Vehicle | 38 (18.3%) | 16 (50.0%) |
| 2 Vehicles | 94 (45.2%) | 7 (21.9%) |
| 3 or more Vehicles | 72 (34.6%) | 3 (9.4%) |
| Total | 208 (100.0%) | 32 (100.0%) |
Real Estate & Mortgages in Stacyville
Real Estate and Mortgage Overview in Stacyville
| Characteristic | Without Mortgage | With Mortgage |
| Housing Units | 86 | 122 |
| Median Property Value | $89,200 | $94,400 |
| Median Household Income | $56,250 | $2 |
| Monthly Housing Costs | $398 | $0 |
| Real Estate Taxes | $973 | $2 |
Property Value by Mortgage Status in Stacyville
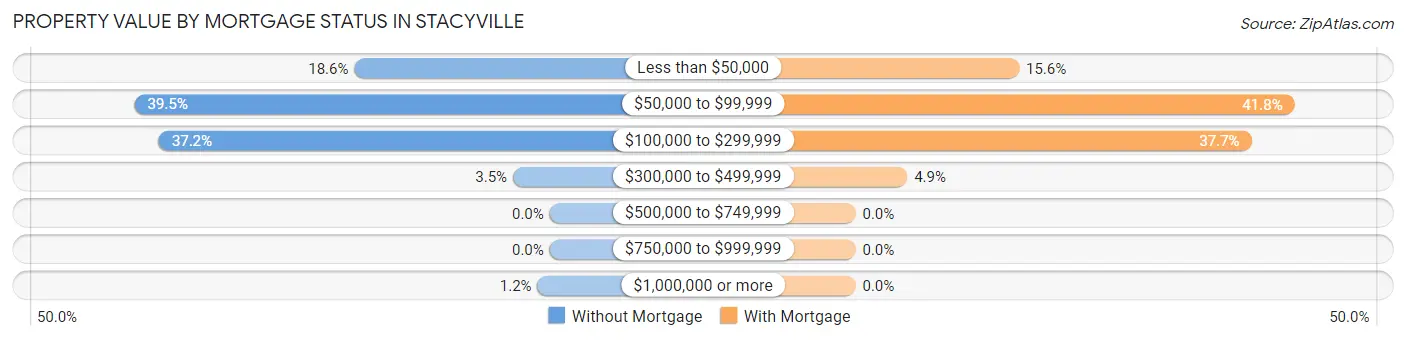
| Property Value | Without Mortgage | With Mortgage |
| Less than $50,000 | 16 (18.6%) | 19 (15.6%) |
| $50,000 to $99,999 | 34 (39.5%) | 51 (41.8%) |
| $100,000 to $299,999 | 32 (37.2%) | 46 (37.7%) |
| $300,000 to $499,999 | 3 (3.5%) | 6 (4.9%) |
| $500,000 to $749,999 | 0 (0.0%) | 0 (0.0%) |
| $750,000 to $999,999 | 0 (0.0%) | 0 (0.0%) |
| $1,000,000 or more | 1 (1.2%) | 0 (0.0%) |
| Total | 86 (100.0%) | 122 (100.0%) |
Household Income by Mortgage Status in Stacyville
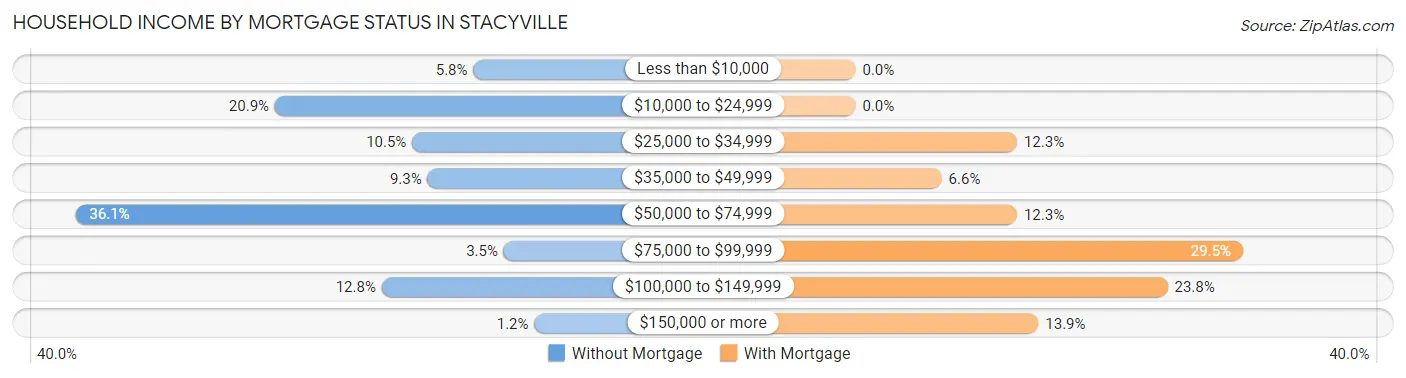
| Household Income | Without Mortgage | With Mortgage |
| Less than $10,000 | 5 (5.8%) | 0 (0.0%) |
| $10,000 to $24,999 | 18 (20.9%) | 0 (0.0%) |
| $25,000 to $34,999 | 9 (10.5%) | 15 (12.3%) |
| $35,000 to $49,999 | 8 (9.3%) | 8 (6.6%) |
| $50,000 to $74,999 | 31 (36.0%) | 15 (12.3%) |
| $75,000 to $99,999 | 3 (3.5%) | 36 (29.5%) |
| $100,000 to $149,999 | 11 (12.8%) | 29 (23.8%) |
| $150,000 or more | 1 (1.2%) | 17 (13.9%) |
| Total | 86 (100.0%) | 122 (100.0%) |
Property Value to Household Income Ratio in Stacyville
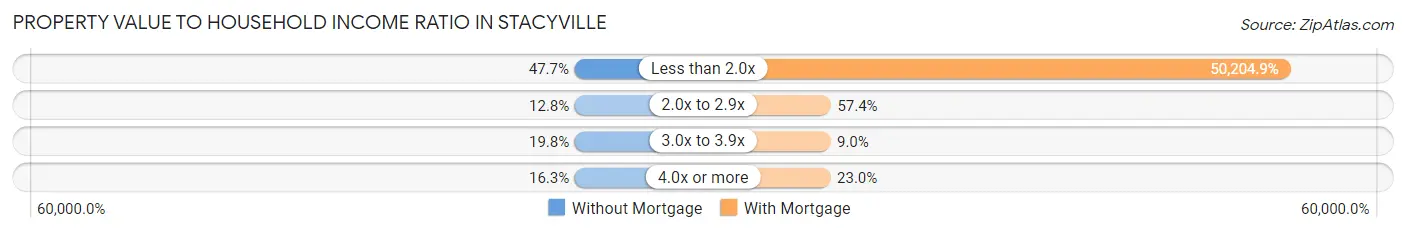
| Value-to-Income Ratio | Without Mortgage | With Mortgage |
| Less than 2.0x | 41 (47.7%) | 61,250 (50,204.9%) |
| 2.0x to 2.9x | 11 (12.8%) | 70 (57.4%) |
| 3.0x to 3.9x | 17 (19.8%) | 11 (9.0%) |
| 4.0x or more | 14 (16.3%) | 28 (23.0%) |
| Total | 86 (100.0%) | 122 (100.0%) |
Real Estate Taxes by Mortgage Status in Stacyville

| Property Taxes | Without Mortgage | With Mortgage |
| Less than $800 | 30 (34.9%) | 0 (0.0%) |
| $800 to $1,499 | 38 (44.2%) | 29 (23.8%) |
| $800 to $1,499 | 18 (20.9%) | 41 (33.6%) |
| Total | 86 (100.0%) | 122 (100.0%) |
Health & Disability in Stacyville
Health Insurance Coverage by Age in Stacyville
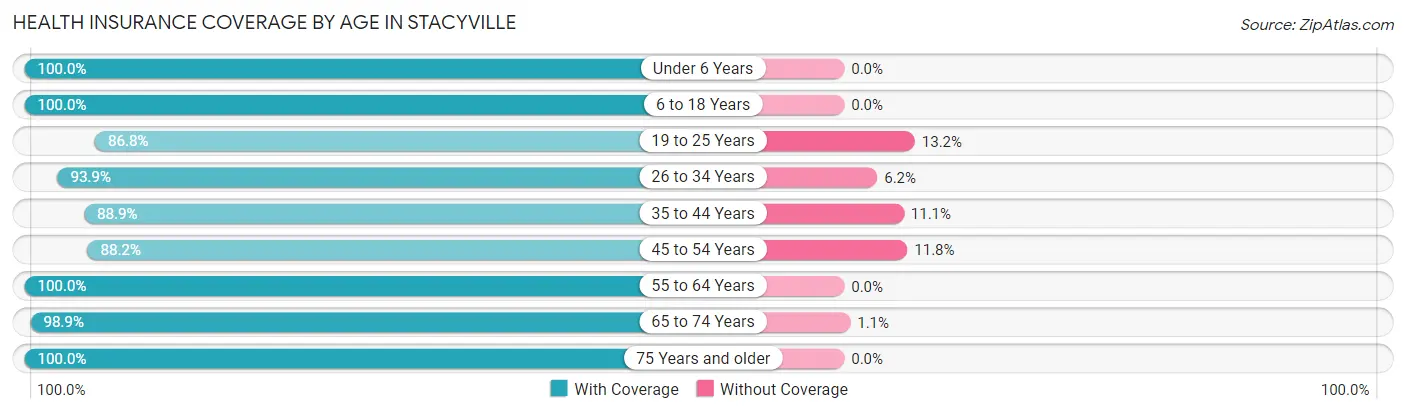
| Age Bracket | With Coverage | Without Coverage |
| Under 6 Years | 40 (100.0%) | 0 (0.0%) |
| 6 to 18 Years | 70 (100.0%) | 0 (0.0%) |
| 19 to 25 Years | 33 (86.8%) | 5 (13.2%) |
| 26 to 34 Years | 61 (93.9%) | 4 (6.1%) |
| 35 to 44 Years | 40 (88.9%) | 5 (11.1%) |
| 45 to 54 Years | 15 (88.2%) | 2 (11.8%) |
| 55 to 64 Years | 57 (100.0%) | 0 (0.0%) |
| 65 to 74 Years | 88 (98.9%) | 1 (1.1%) |
| 75 Years and older | 67 (100.0%) | 0 (0.0%) |
| Total | 471 (96.5%) | 17 (3.5%) |
Health Insurance Coverage by Citizenship Status in Stacyville

| Citizenship Status | With Coverage | Without Coverage |
| Native Born | 40 (100.0%) | 0 (0.0%) |
| Foreign Born, Citizen | 70 (100.0%) | 0 (0.0%) |
| Foreign Born, not a Citizen | 33 (86.8%) | 5 (13.2%) |
Health Insurance Coverage by Household Income in Stacyville

| Household Income | With Coverage | Without Coverage |
| Under $25,000 | 87 (100.0%) | 0 (0.0%) |
| $25,000 to $49,999 | 96 (88.9%) | 12 (11.1%) |
| $50,000 to $74,999 | 132 (96.4%) | 5 (3.6%) |
| $75,000 to $99,999 | 67 (100.0%) | 0 (0.0%) |
| $100,000 and over | 89 (100.0%) | 0 (0.0%) |
Public vs Private Health Insurance Coverage by Age in Stacyville
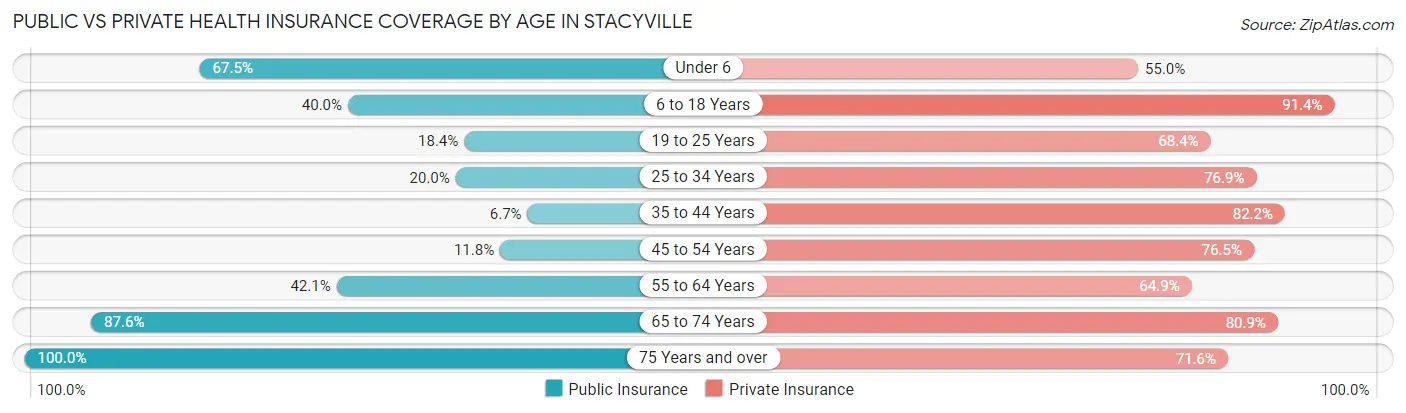
| Age Bracket | Public Insurance | Private Insurance |
| Under 6 | 27 (67.5%) | 22 (55.0%) |
| 6 to 18 Years | 28 (40.0%) | 64 (91.4%) |
| 19 to 25 Years | 7 (18.4%) | 26 (68.4%) |
| 25 to 34 Years | 13 (20.0%) | 50 (76.9%) |
| 35 to 44 Years | 3 (6.7%) | 37 (82.2%) |
| 45 to 54 Years | 2 (11.8%) | 13 (76.5%) |
| 55 to 64 Years | 24 (42.1%) | 37 (64.9%) |
| 65 to 74 Years | 78 (87.6%) | 72 (80.9%) |
| 75 Years and over | 67 (100.0%) | 48 (71.6%) |
| Total | 249 (51.0%) | 369 (75.6%) |
Disability Status by Sex by Age in Stacyville
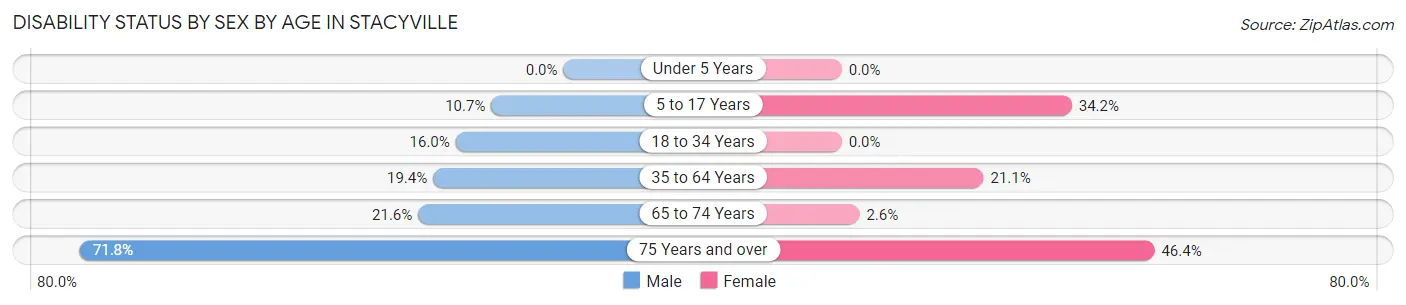
| Age Bracket | Male | Female |
| Under 5 Years | 0 (0.0%) | 0 (0.0%) |
| 5 to 17 Years | 3 (10.7%) | 14 (34.2%) |
| 18 to 34 Years | 8 (16.0%) | 0 (0.0%) |
| 35 to 64 Years | 12 (19.4%) | 12 (21.0%) |
| 65 to 74 Years | 11 (21.6%) | 1 (2.6%) |
| 75 Years and over | 28 (71.8%) | 13 (46.4%) |
Disability Class by Sex by Age in Stacyville
Disability Class: Hearing Difficulty
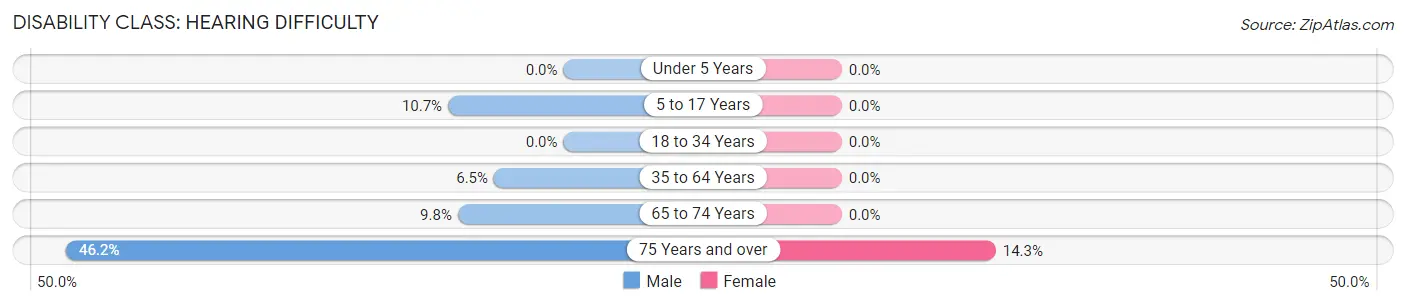
| Age Bracket | Male | Female |
| Under 5 Years | 0 (0.0%) | 0 (0.0%) |
| 5 to 17 Years | 3 (10.7%) | 0 (0.0%) |
| 18 to 34 Years | 0 (0.0%) | 0 (0.0%) |
| 35 to 64 Years | 4 (6.5%) | 0 (0.0%) |
| 65 to 74 Years | 5 (9.8%) | 0 (0.0%) |
| 75 Years and over | 18 (46.2%) | 4 (14.3%) |
Disability Class: Vision Difficulty
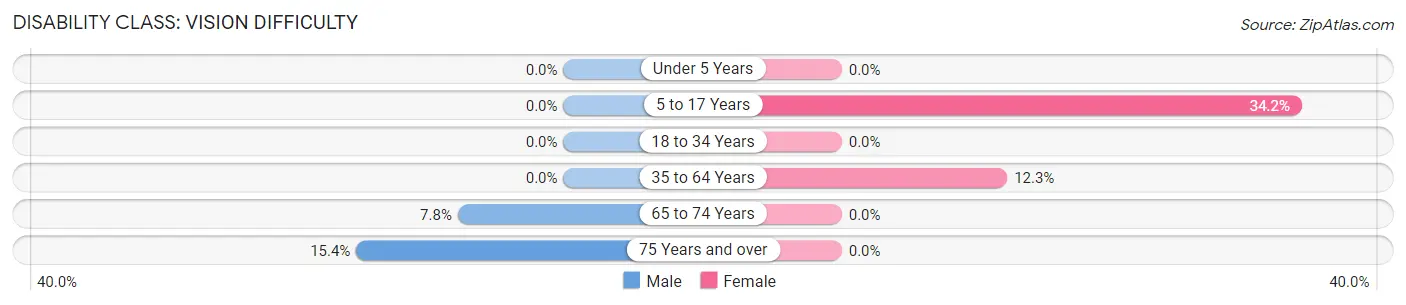
| Age Bracket | Male | Female |
| Under 5 Years | 0 (0.0%) | 0 (0.0%) |
| 5 to 17 Years | 0 (0.0%) | 14 (34.2%) |
| 18 to 34 Years | 0 (0.0%) | 0 (0.0%) |
| 35 to 64 Years | 0 (0.0%) | 7 (12.3%) |
| 65 to 74 Years | 4 (7.8%) | 0 (0.0%) |
| 75 Years and over | 6 (15.4%) | 0 (0.0%) |
Disability Class: Cognitive Difficulty
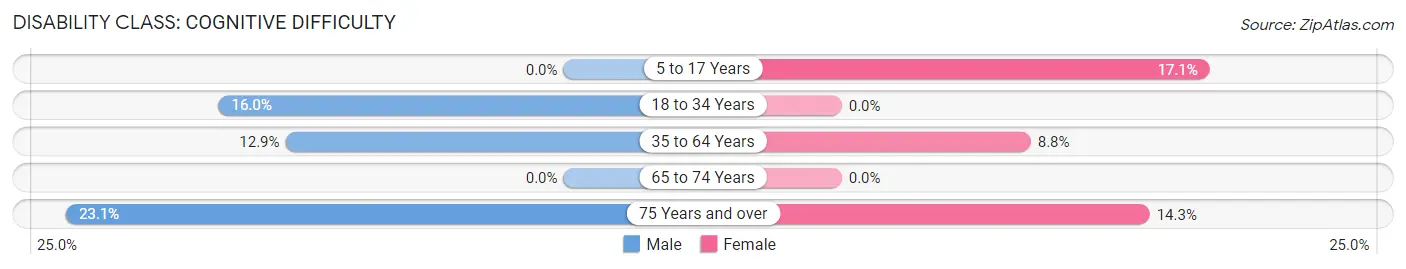
| Age Bracket | Male | Female |
| 5 to 17 Years | 0 (0.0%) | 7 (17.1%) |
| 18 to 34 Years | 8 (16.0%) | 0 (0.0%) |
| 35 to 64 Years | 8 (12.9%) | 5 (8.8%) |
| 65 to 74 Years | 0 (0.0%) | 0 (0.0%) |
| 75 Years and over | 9 (23.1%) | 4 (14.3%) |
Disability Class: Ambulatory Difficulty
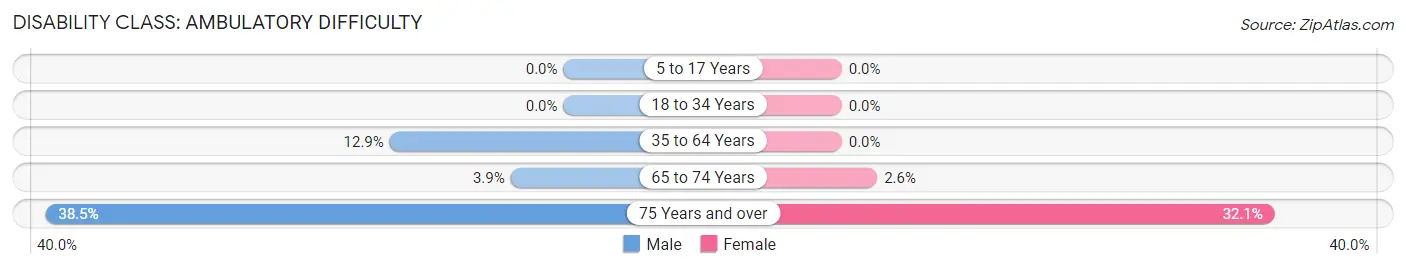
| Age Bracket | Male | Female |
| 5 to 17 Years | 0 (0.0%) | 0 (0.0%) |
| 18 to 34 Years | 0 (0.0%) | 0 (0.0%) |
| 35 to 64 Years | 8 (12.9%) | 0 (0.0%) |
| 65 to 74 Years | 2 (3.9%) | 1 (2.6%) |
| 75 Years and over | 15 (38.5%) | 9 (32.1%) |
Disability Class: Self-Care Difficulty
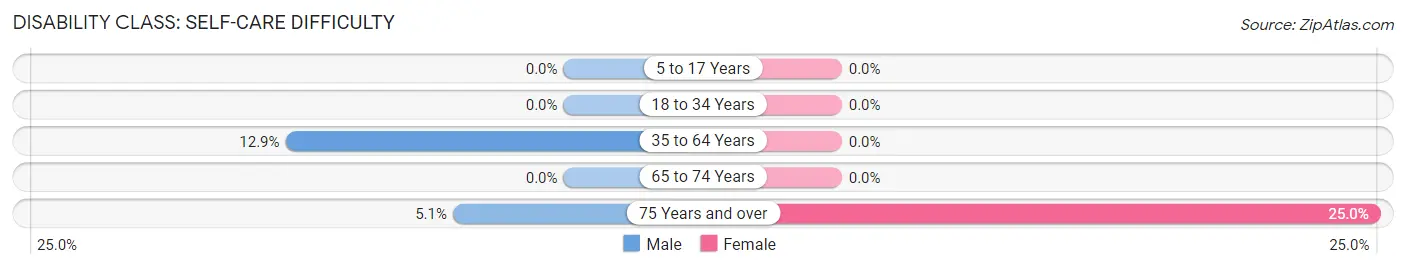
| Age Bracket | Male | Female |
| 5 to 17 Years | 0 (0.0%) | 0 (0.0%) |
| 18 to 34 Years | 0 (0.0%) | 0 (0.0%) |
| 35 to 64 Years | 8 (12.9%) | 0 (0.0%) |
| 65 to 74 Years | 0 (0.0%) | 0 (0.0%) |
| 75 Years and over | 2 (5.1%) | 7 (25.0%) |
Technology Access in Stacyville
Computing Device Access in Stacyville
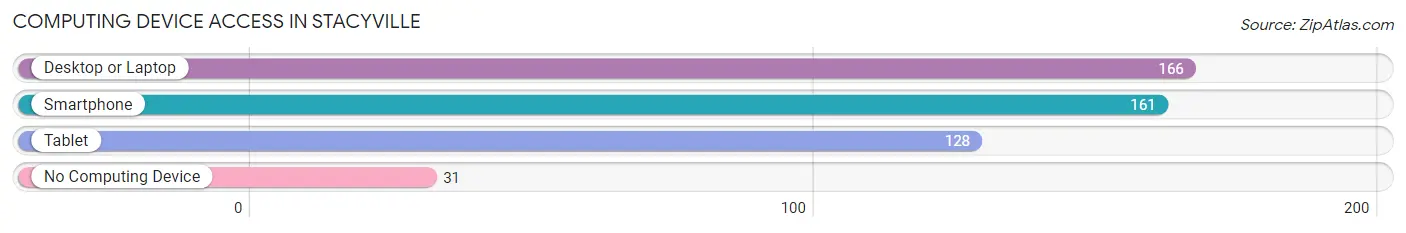
| Device Type | # Households | % Households |
| Desktop or Laptop | 166 | 69.2% |
| Smartphone | 161 | 67.1% |
| Tablet | 128 | 53.3% |
| No Computing Device | 31 | 12.9% |
| Total | 240 | 100.0% |
Internet Access in Stacyville
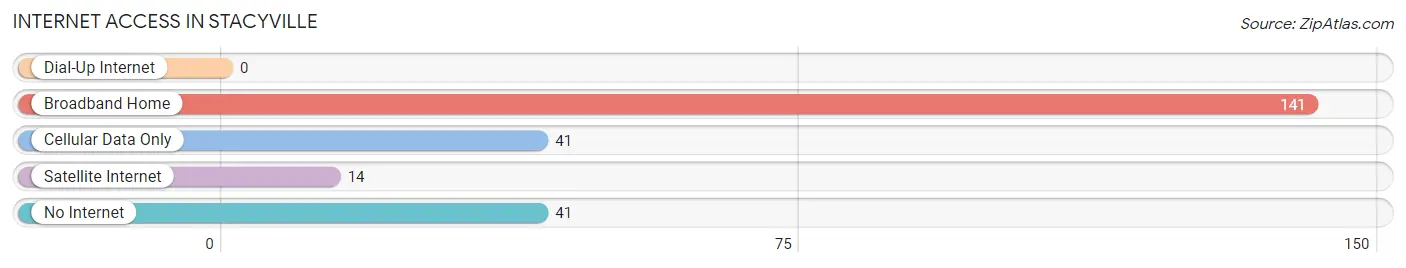
| Internet Type | # Households | % Households |
| Dial-Up Internet | 0 | 0.0% |
| Broadband Home | 141 | 58.8% |
| Cellular Data Only | 41 | 17.1% |
| Satellite Internet | 14 | 5.8% |
| No Internet | 41 | 17.1% |
| Total | 240 | 100.0% |
Stacyville Summary
Stacyville, Iowa is a small town located in Mitchell County, Iowa. It is situated along the Cedar River and is part of the Mason City Micropolitan Statistical Area. The population of Stacyville was 545 in the 2010 census.
History
Stacyville was founded in 1856 by William Stacy, a settler from New York. He named the town after himself and it was incorporated in 1876. The town was originally a farming community, but it soon became a center for the lumber industry. The Cedar River provided a convenient source of power for the sawmills and other businesses that were established in the area.
In the late 19th century, Stacyville was a thriving community with a variety of businesses, including a hotel, a bank, a newspaper, and a variety of stores. The town also had a school, a library, and a post office.
Geography
Stacyville is located in Mitchell County, Iowa, along the Cedar River. The town is situated at the intersection of U.S. Route 63 and Iowa Highway 9. The town is located approximately 25 miles north of Mason City and about 50 miles south of Rochester, Minnesota.
The terrain around Stacyville is mostly flat, with some rolling hills. The town is located in the Driftless Area, which is characterized by its rugged terrain and steep valleys. The area is also known for its abundant wildlife, including deer, turkey, and other game animals.
Economy
Stacyville’s economy is largely based on agriculture. The town is home to several farms, which produce a variety of crops, including corn, soybeans, and hay. The town also has a few small businesses, including a grocery store, a hardware store, and a restaurant.
The town is also home to a number of manufacturing businesses, including a furniture factory and a woodworking shop. The town is also home to a number of small businesses, including a bakery, a florist, and a barber shop.
Demographics
As of the 2010 census, the population of Stacyville was 545. The racial makeup of the town was 97.3% White, 0.2% African American, 0.2% Native American, 0.2% Asian, 0.4% from other races, and 1.9% from two or more races. Hispanic or Latino of any race were 1.3% of the population.
The median income for a household in Stacyville was $41,250, and the median income for a family was $45,000. The per capita income for the town was $18,945. About 8.3% of families and 10.2% of the population were below the poverty line, including 13.3% of those under age 18 and 8.3% of those age 65 or over.
Stacyville is a small town with a rich history and a strong sense of community. The town is home to a variety of businesses and industries, and its economy is largely based on agriculture. The town is also home to a diverse population, with a variety of racial and ethnic backgrounds.
Common Questions
What is the Total Population of Stacyville?
Total Population of Stacyville is 488.
What is the Total Male Population of Stacyville?
Total Male Population of Stacyville is 254.
What is the Total Female Population of Stacyville?
Total Female Population of Stacyville is 234.
What is the Ratio of Males per 100 Females in Stacyville?
There are 108.55 Males per 100 Females in Stacyville.
What is the Ratio of Females per 100 Males in Stacyville?
There are 92.13 Females per 100 Males in Stacyville.
What is the Median Population Age in Stacyville?
Median Population Age in Stacyville is 42.0 Years.
What is the Average Family Size in Stacyville
Average Family Size in Stacyville is 2.4 People.
What is the Average Household Size in Stacyville
Average Household Size in Stacyville is 2.0 People.
What is Per Capita Income in Stacyville?
Per Capita income in Stacyville is $29,333.
What is the Median Family Income in Stacyville?
Median Family Income in Stacyville is $65,469.
What is the Median Household income in Stacyville?
Median Household Income in Stacyville is $57,188.
What is Income or Wage Gap in Stacyville?
Income or Wage Gap in Stacyville is 33.6%.
Women in Stacyville earn 66.4 cents for every dollar earned by a man.
What is Inequality or Gini Index in Stacyville?
Inequality or Gini Index in Stacyville is 0.34.
How Large is the Labor Force in Stacyville?
There are 238 People in the Labor Forcein in Stacyville.
What is the Percentage of People in the Labor Force in Stacyville?
62.3% of People are in the Labor Force in Stacyville.