Oxford, IA
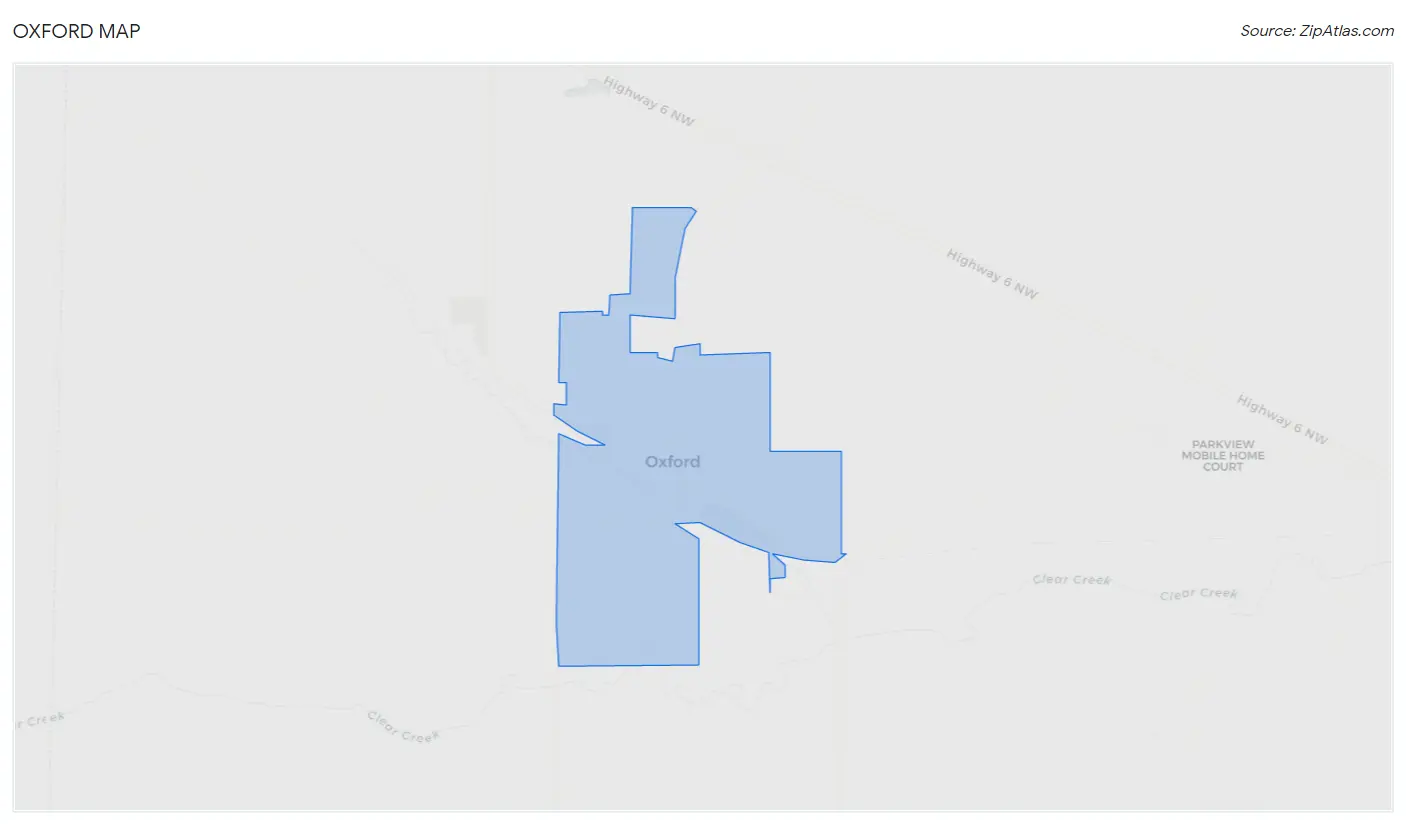
Oxford Map
Oxford Overview
702
TOTAL POPULATION
350
MALE POPULATION
352
FEMALE POPULATION
99.43
MALES / 100 FEMALES
100.57
FEMALES / 100 MALES
38.4
MEDIAN AGE
3.2
AVG FAMILY SIZE
2.1
AVG HOUSEHOLD SIZE
$40,739
PER CAPITA INCOME
$91,250
AVG FAMILY INCOME
$64,643
AVG HOUSEHOLD INCOME
19.7%
WAGE / INCOME GAP [ % ]
80.3¢/ $1
WAGE / INCOME GAP [ $ ]
0.46
INEQUALITY / GINI INDEX
432
LABOR FORCE [ PEOPLE ]
79.4%
PERCENT IN LABOR FORCE
3.0%
UNEMPLOYMENT RATE
Oxford Zip Codes
Oxford Area Codes
Race in Oxford
The most populous races in Oxford are White / Caucasian (636 | 90.6%), Hispanic or Latino (83 | 11.8%), and Two or more Races (41 | 5.8%).
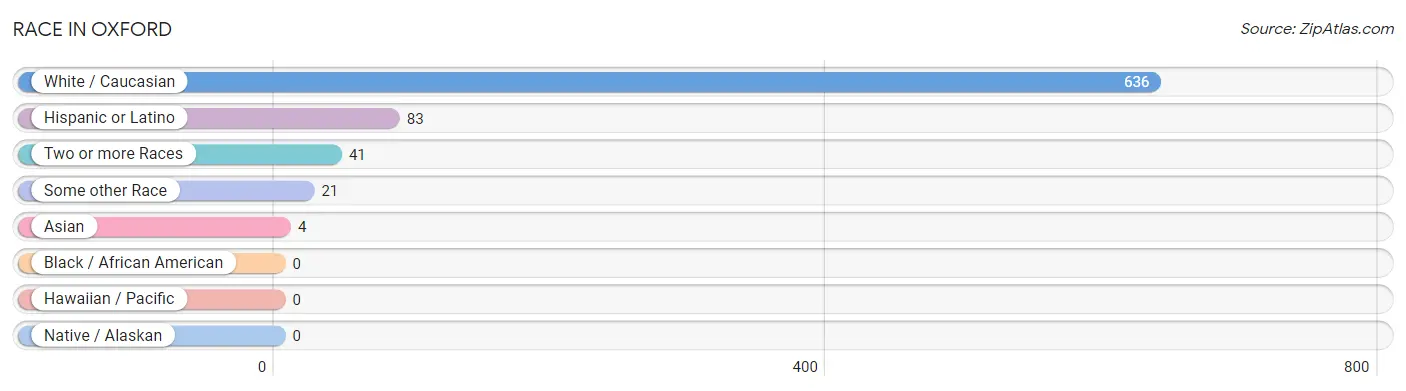
| Race | # Population | % Population |
| Asian | 4 | 0.6% |
| Black / African American | 0 | 0.0% |
| Hawaiian / Pacific | 0 | 0.0% |
| Hispanic or Latino | 83 | 11.8% |
| Native / Alaskan | 0 | 0.0% |
| White / Caucasian | 636 | 90.6% |
| Two or more Races | 41 | 5.8% |
| Some other Race | 21 | 3.0% |
| Total | 702 | 100.0% |
Ancestry in Oxford
The most populous ancestries reported in Oxford are German (253 | 36.0%), Irish (152 | 21.6%), Mexican (49 | 7.0%), Czech (37 | 5.3%), and English (30 | 4.3%), together accounting for 74.2% of all Oxford residents.
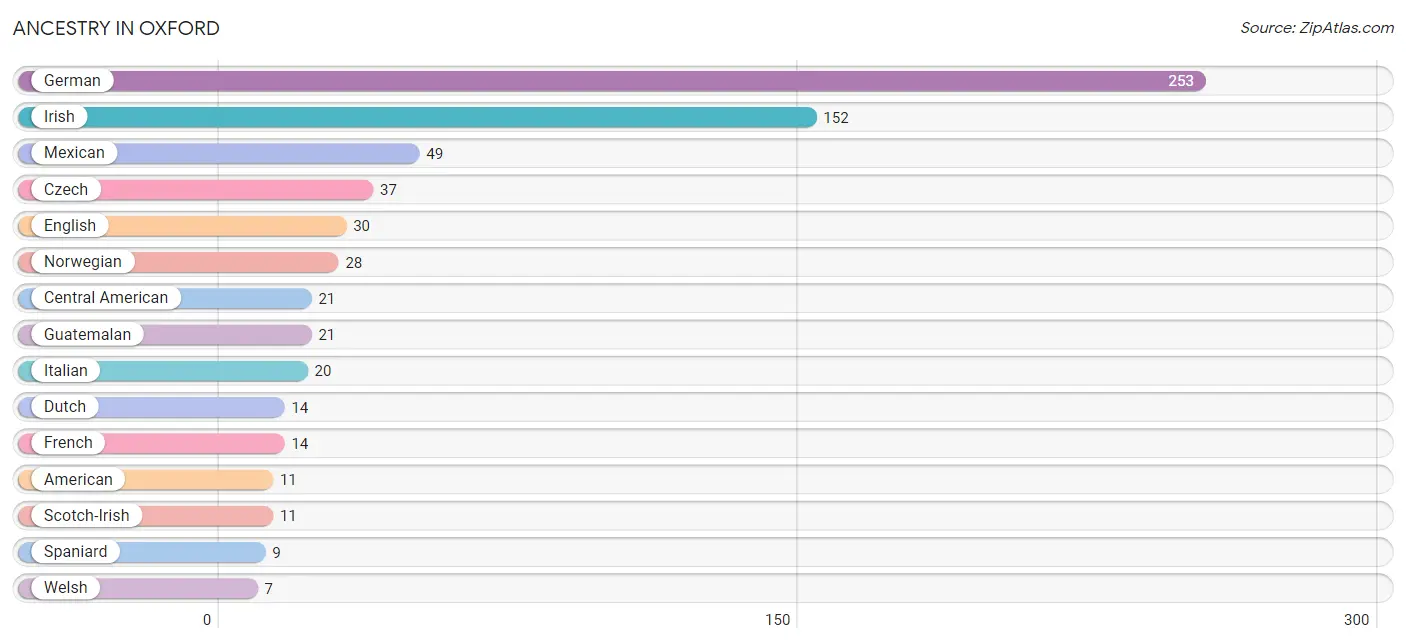
| Ancestry | # Population | % Population |
| American | 11 | 1.6% |
| Arab | 1 | 0.1% |
| British | 3 | 0.4% |
| Burmese | 4 | 0.6% |
| Central American | 21 | 3.0% |
| Czech | 37 | 5.3% |
| Danish | 5 | 0.7% |
| Dutch | 14 | 2.0% |
| English | 30 | 4.3% |
| European | 1 | 0.1% |
| French | 14 | 2.0% |
| French Canadian | 4 | 0.6% |
| German | 253 | 36.0% |
| Guatemalan | 21 | 3.0% |
| Irish | 152 | 21.6% |
| Italian | 20 | 2.9% |
| Lebanese | 1 | 0.1% |
| Mexican | 49 | 7.0% |
| Norwegian | 28 | 4.0% |
| Polish | 3 | 0.4% |
| Puerto Rican | 4 | 0.6% |
| Russian | 5 | 0.7% |
| Scotch-Irish | 11 | 1.6% |
| Scottish | 6 | 0.9% |
| Spaniard | 9 | 1.3% |
| Swedish | 6 | 0.9% |
| Swiss | 4 | 0.6% |
| Welsh | 7 | 1.0% | View All 28 Rows |
Immigrants in Oxford
The most numerous immigrant groups reported in Oxford came from Asia (4 | 0.6%), Eastern Asia (4 | 0.6%), Korea (4 | 0.6%), Canada (3 | 0.4%), and Central America (1 | 0.1%), together accounting for 2.3% of all Oxford residents.
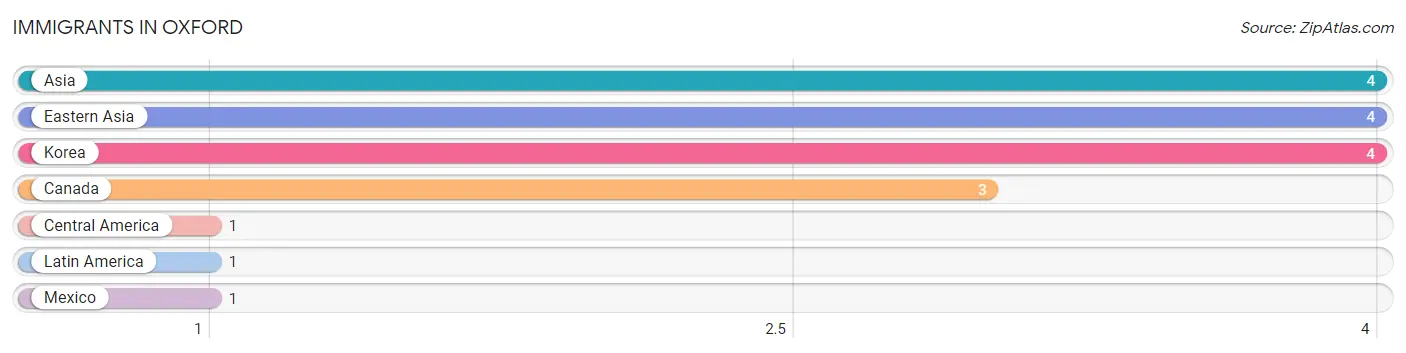
| Immigration Origin | # Population | % Population |
| Asia | 4 | 0.6% |
| Canada | 3 | 0.4% |
| Central America | 1 | 0.1% |
| Eastern Asia | 4 | 0.6% |
| Korea | 4 | 0.6% |
| Latin America | 1 | 0.1% |
| Mexico | 1 | 0.1% | View All 7 Rows |
Sex and Age in Oxford
Sex and Age in Oxford
The most populous age groups in Oxford are 65 to 69 Years (40 | 11.4%) for men and 10 to 14 Years (44 | 12.5%) for women.
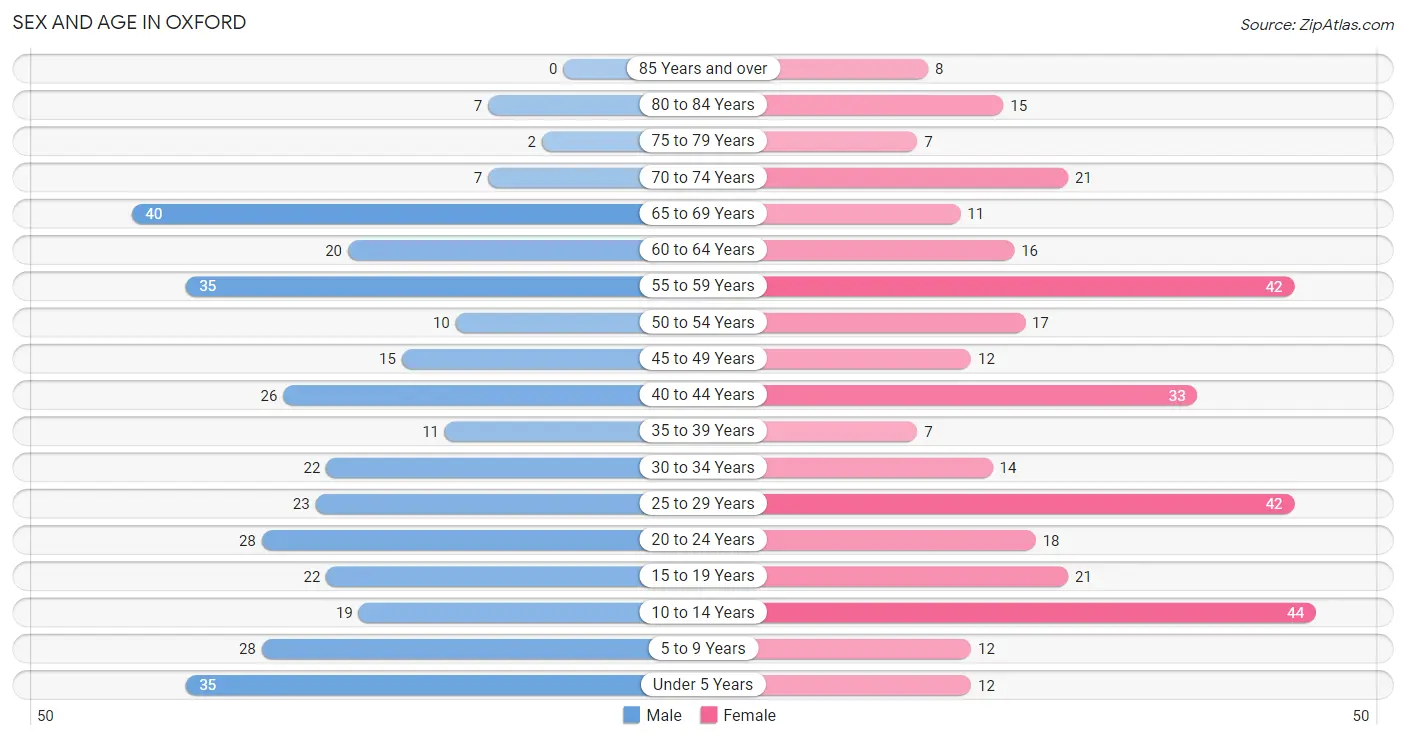
| Age Bracket | Male | Female |
| Under 5 Years | 35 (10.0%) | 12 (3.4%) |
| 5 to 9 Years | 28 (8.0%) | 12 (3.4%) |
| 10 to 14 Years | 19 (5.4%) | 44 (12.5%) |
| 15 to 19 Years | 22 (6.3%) | 21 (6.0%) |
| 20 to 24 Years | 28 (8.0%) | 18 (5.1%) |
| 25 to 29 Years | 23 (6.6%) | 42 (11.9%) |
| 30 to 34 Years | 22 (6.3%) | 14 (4.0%) |
| 35 to 39 Years | 11 (3.1%) | 7 (2.0%) |
| 40 to 44 Years | 26 (7.4%) | 33 (9.4%) |
| 45 to 49 Years | 15 (4.3%) | 12 (3.4%) |
| 50 to 54 Years | 10 (2.9%) | 17 (4.8%) |
| 55 to 59 Years | 35 (10.0%) | 42 (11.9%) |
| 60 to 64 Years | 20 (5.7%) | 16 (4.5%) |
| 65 to 69 Years | 40 (11.4%) | 11 (3.1%) |
| 70 to 74 Years | 7 (2.0%) | 21 (6.0%) |
| 75 to 79 Years | 2 (0.6%) | 7 (2.0%) |
| 80 to 84 Years | 7 (2.0%) | 15 (4.3%) |
| 85 Years and over | 0 (0.0%) | 8 (2.3%) |
| Total | 350 (100.0%) | 352 (100.0%) |
Families and Households in Oxford
Median Family Size in Oxford
The median family size in Oxford is 3.19 persons per family, with married-couple families (120 | 79.5%) accounting for the largest median family size of 3.28 persons per family. On the other hand, single female/mother families (13 | 8.6%) represent the smallest median family size with 2.69 persons per family.
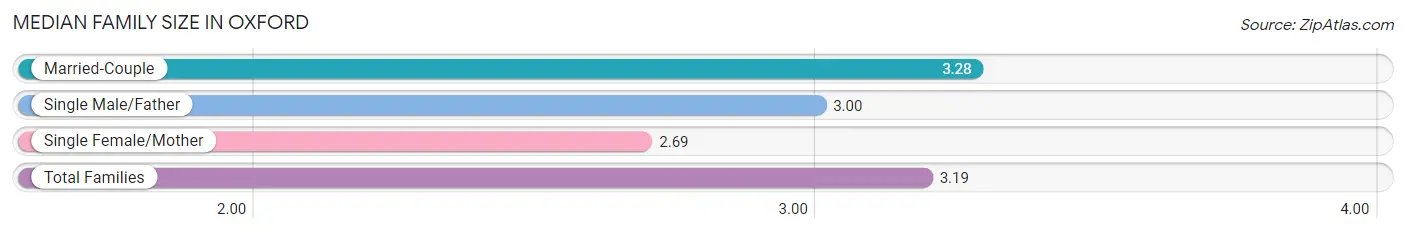
| Family Type | # Families | Family Size |
| Married-Couple | 120 (79.5%) | 3.28 |
| Single Male/Father | 18 (11.9%) | 3.00 |
| Single Female/Mother | 13 (8.6%) | 2.69 |
| Total Families | 151 (100.0%) | 3.19 |
Median Household Size in Oxford
The median household size in Oxford is 2.14 persons per household, with single male/father households (18 | 5.5%) accounting for the largest median household size of 3.61 persons per household. non-family households (177 | 54.0%) represent the smallest median household size with 1.16 persons per household.
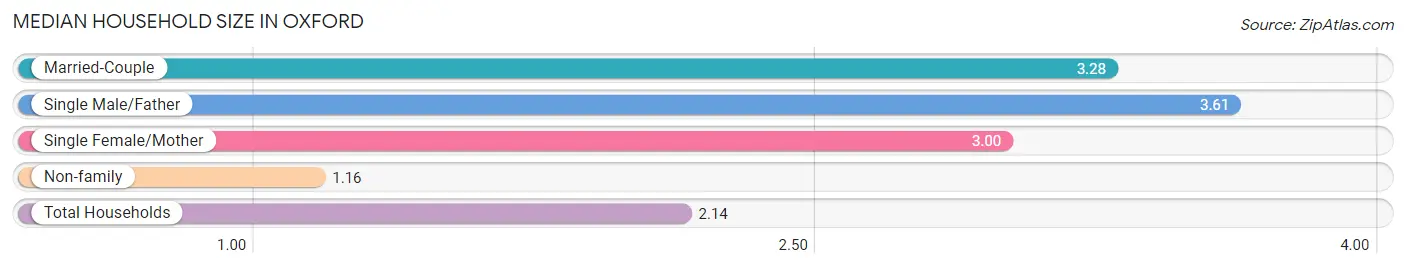
| Household Type | # Households | Household Size |
| Married-Couple | 120 (36.6%) | 3.28 |
| Single Male/Father | 18 (5.5%) | 3.61 |
| Single Female/Mother | 13 (4.0%) | 3.00 |
| Non-family | 177 (54.0%) | 1.16 |
| Total Households | 328 (100.0%) | 2.14 |
Household Size by Marriage Status in Oxford
Out of a total of 328 households in Oxford, 151 (46.0%) are family households, while 177 (54.0%) are nonfamily households. The most numerous type of family households are 2-person households, comprising 68, and the most common type of nonfamily households are 1-person households, comprising 135.
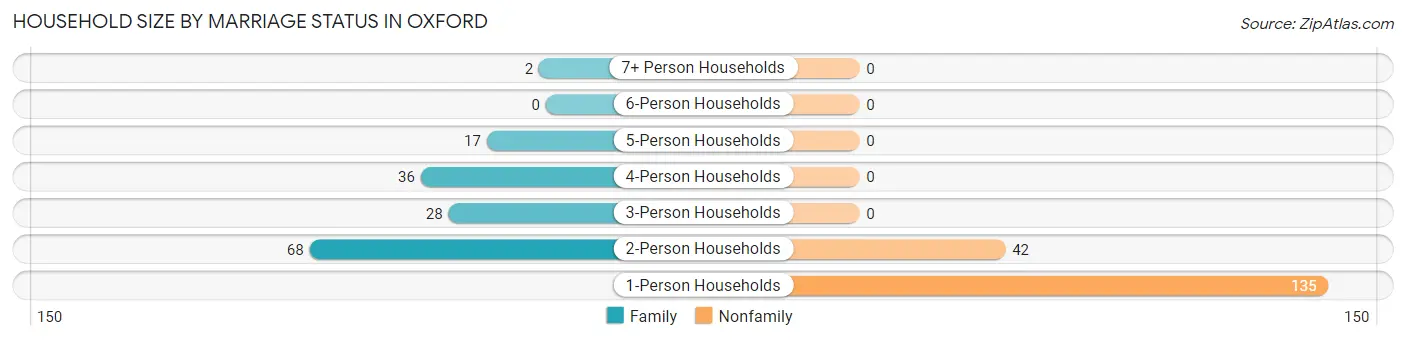
| Household Size | Family Households | Nonfamily Households |
| 1-Person Households | - | 135 (41.2%) |
| 2-Person Households | 68 (20.7%) | 42 (12.8%) |
| 3-Person Households | 28 (8.5%) | 0 (0.0%) |
| 4-Person Households | 36 (11.0%) | 0 (0.0%) |
| 5-Person Households | 17 (5.2%) | 0 (0.0%) |
| 6-Person Households | 0 (0.0%) | 0 (0.0%) |
| 7+ Person Households | 2 (0.6%) | 0 (0.0%) |
| Total | 151 (46.0%) | 177 (54.0%) |
Female Fertility in Oxford
Fertility by Age in Oxford
Average fertility rate in Oxford is 112.0 births per 1,000 women. Women in the age bracket of 20 to 34 years have the highest fertility rate with 216.0 births per 1,000 women. Women in the age bracket of 20 to 34 years acount for 94.1% of all women with births.
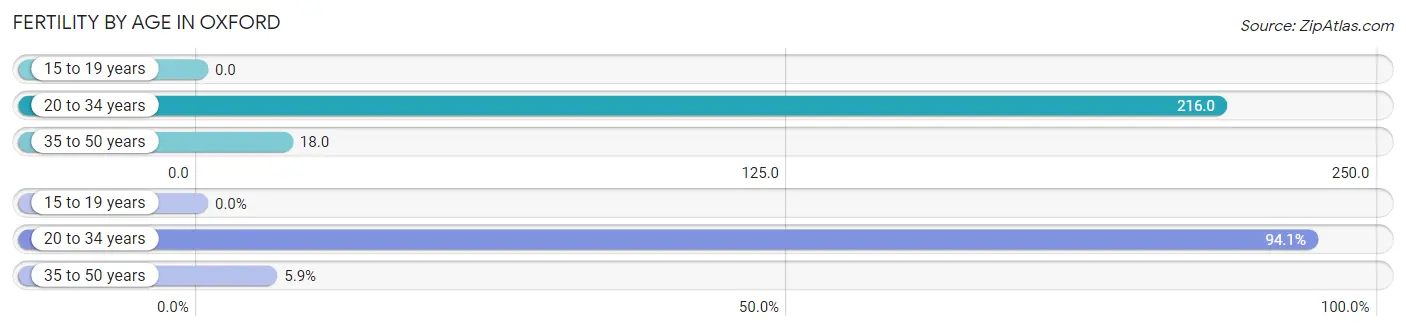
| Age Bracket | Women with Births | Births / 1,000 Women |
| 15 to 19 years | 0 (0.0%) | 0.0 |
| 20 to 34 years | 16 (94.1%) | 216.0 |
| 35 to 50 years | 1 (5.9%) | 18.0 |
| Total | 17 (100.0%) | 112.0 |
Fertility by Age by Marriage Status in Oxford
29.4% of women with births (17) in Oxford are married. The highest percentage of unmarried women with births falls into 35 to 50 years age bracket with 100.0% of them unmarried at the time of birth, while the lowest percentage of unmarried women with births belong to 20 to 34 years age bracket with 68.8% of them unmarried.
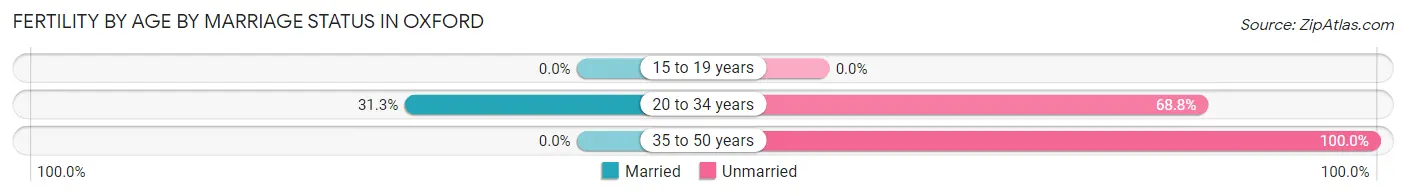
| Age Bracket | Married | Unmarried |
| 15 to 19 years | 0 (0.0%) | 0 (0.0%) |
| 20 to 34 years | 5 (31.2%) | 11 (68.8%) |
| 35 to 50 years | 0 (0.0%) | 1 (100.0%) |
| Total | 5 (29.4%) | 12 (70.6%) |
Fertility by Education in Oxford
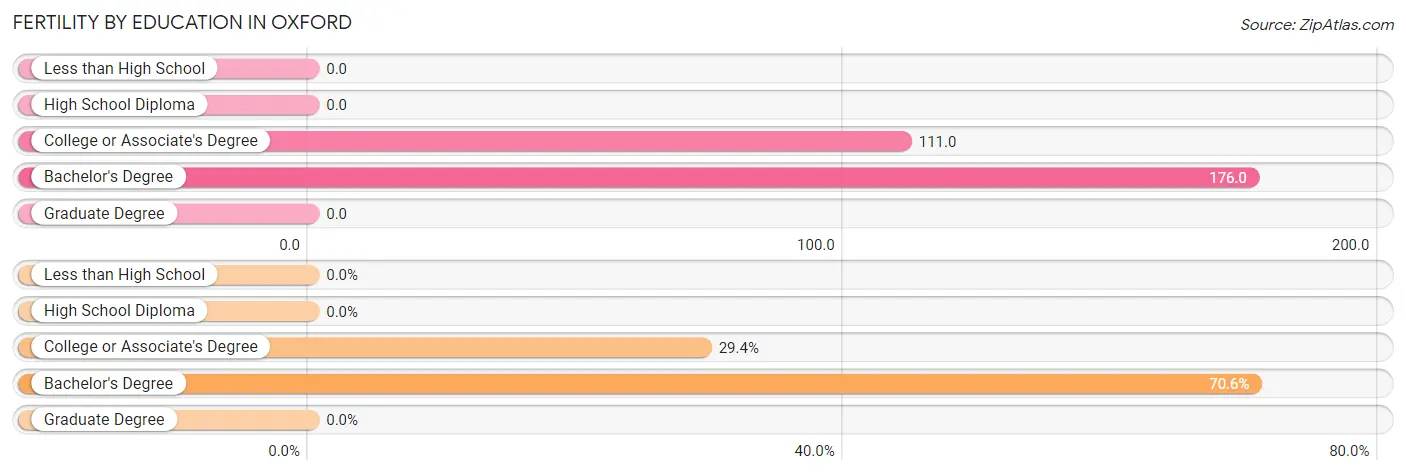
| Educational Attainment | Women with Births | Births / 1,000 Women |
| Less than High School | 0 (0.0%) | 0.0 |
| High School Diploma | 0 (0.0%) | 0.0 |
| College or Associate's Degree | 5 (29.4%) | 111.0 |
| Bachelor's Degree | 12 (70.6%) | 176.0 |
| Graduate Degree | 0 (0.0%) | 0.0 |
| Total | 17 (100.0%) | 112.0 |
Fertility by Education by Marriage Status in Oxford
70.6% of women with births in Oxford are unmarried. Women with the educational attainment of college or associate's degree are most likely to be married with 80.0% of them married at childbirth, while women with the educational attainment of bachelor's degree are least likely to be married with 91.7% of them unmarried at childbirth.
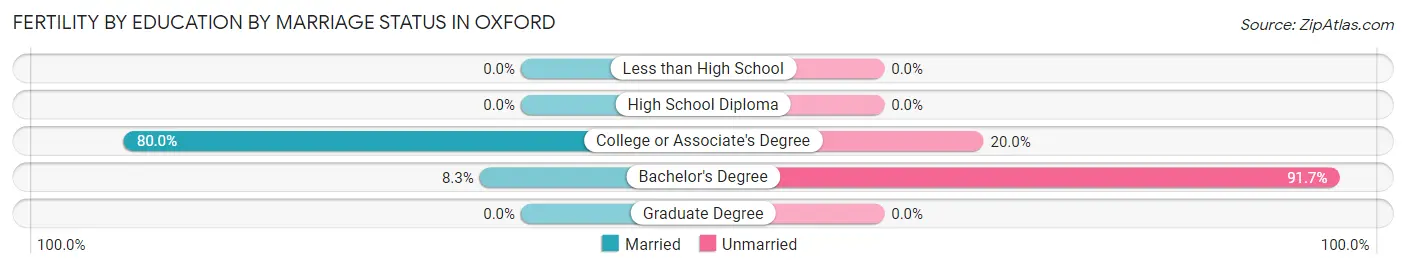
| Educational Attainment | Married | Unmarried |
| Less than High School | 0 (0.0%) | 0 (0.0%) |
| High School Diploma | 0 (0.0%) | 0 (0.0%) |
| College or Associate's Degree | 4 (80.0%) | 1 (20.0%) |
| Bachelor's Degree | 1 (8.3%) | 11 (91.7%) |
| Graduate Degree | 0 (0.0%) | 0 (0.0%) |
| Total | 5 (29.4%) | 12 (70.6%) |
Income in Oxford
Income Overview in Oxford
Per Capita Income in Oxford is $40,739, while median incomes of families and households are $91,250 and $64,643 respectively.
| Characteristic | Number | Measure |
| Per Capita Income | 702 | $40,739 |
| Median Family Income | 151 | $91,250 |
| Mean Family Income | 151 | $133,491 |
| Median Household Income | 328 | $64,643 |
| Mean Household Income | 328 | $88,951 |
| Income Deficit | 151 | $0 |
| Wage / Income Gap (%) | 702 | 19.68% |
| Wage / Income Gap ($) | 702 | 80.32¢ per $1 |
| Gini / Inequality Index | 702 | 0.46 |
Earnings by Sex in Oxford
Average Earnings in Oxford are $46,250, $51,354 for men and $41,250 for women, a difference of 19.7%.
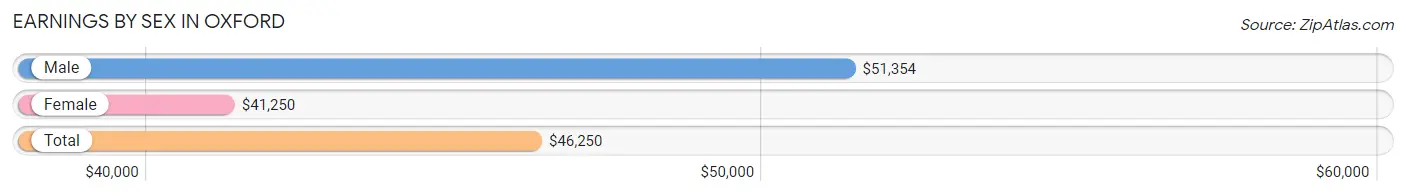
| Sex | Number | Average Earnings |
| Male | 227 (51.5%) | $51,354 |
| Female | 214 (48.5%) | $41,250 |
| Total | 441 (100.0%) | $46,250 |
Earnings by Sex by Income Bracket in Oxford
The most common earnings brackets in Oxford are $65,000 to $74,999 for men (40 | 17.6%) and $55,000 to $64,999 for women (43 | 20.1%).
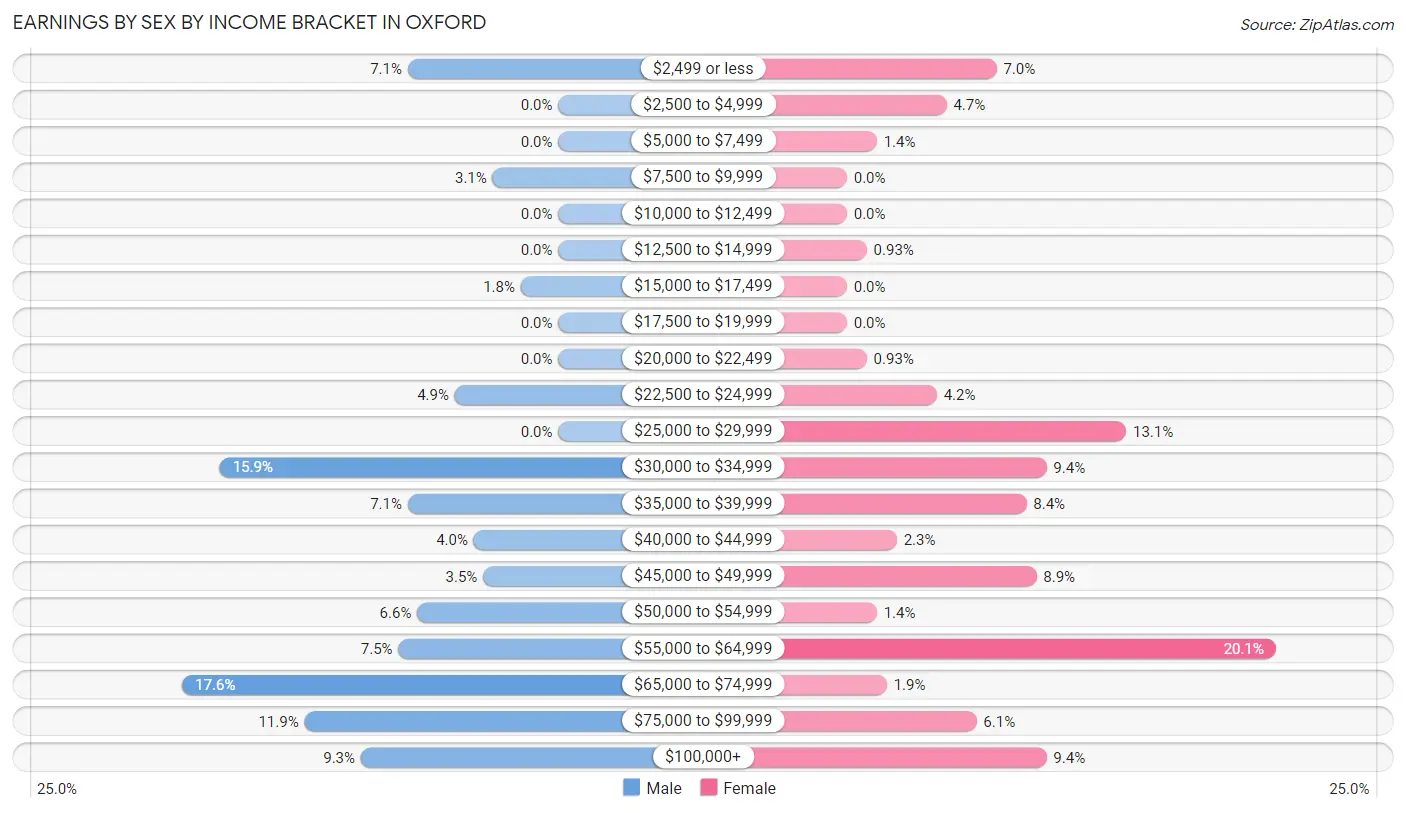
| Income | Male | Female |
| $2,499 or less | 16 (7.0%) | 15 (7.0%) |
| $2,500 to $4,999 | 0 (0.0%) | 10 (4.7%) |
| $5,000 to $7,499 | 0 (0.0%) | 3 (1.4%) |
| $7,500 to $9,999 | 7 (3.1%) | 0 (0.0%) |
| $10,000 to $12,499 | 0 (0.0%) | 0 (0.0%) |
| $12,500 to $14,999 | 0 (0.0%) | 2 (0.9%) |
| $15,000 to $17,499 | 4 (1.8%) | 0 (0.0%) |
| $17,500 to $19,999 | 0 (0.0%) | 0 (0.0%) |
| $20,000 to $22,499 | 0 (0.0%) | 2 (0.9%) |
| $22,500 to $24,999 | 11 (4.9%) | 9 (4.2%) |
| $25,000 to $29,999 | 0 (0.0%) | 28 (13.1%) |
| $30,000 to $34,999 | 36 (15.9%) | 20 (9.3%) |
| $35,000 to $39,999 | 16 (7.0%) | 18 (8.4%) |
| $40,000 to $44,999 | 9 (4.0%) | 5 (2.3%) |
| $45,000 to $49,999 | 8 (3.5%) | 19 (8.9%) |
| $50,000 to $54,999 | 15 (6.6%) | 3 (1.4%) |
| $55,000 to $64,999 | 17 (7.5%) | 43 (20.1%) |
| $65,000 to $74,999 | 40 (17.6%) | 4 (1.9%) |
| $75,000 to $99,999 | 27 (11.9%) | 13 (6.1%) |
| $100,000+ | 21 (9.2%) | 20 (9.3%) |
| Total | 227 (100.0%) | 214 (100.0%) |
Earnings by Sex by Educational Attainment in Oxford
Average earnings in Oxford are $60,313 for men and $46,250 for women, a difference of 23.3%. Men with an educational attainment of graduate degree enjoy the highest average annual earnings of $74,375, while those with high school diploma education earn the least with $53,333. Women with an educational attainment of bachelor's degree earn the most with the average annual earnings of $56,875, while those with high school diploma education have the smallest earnings of $32,083.
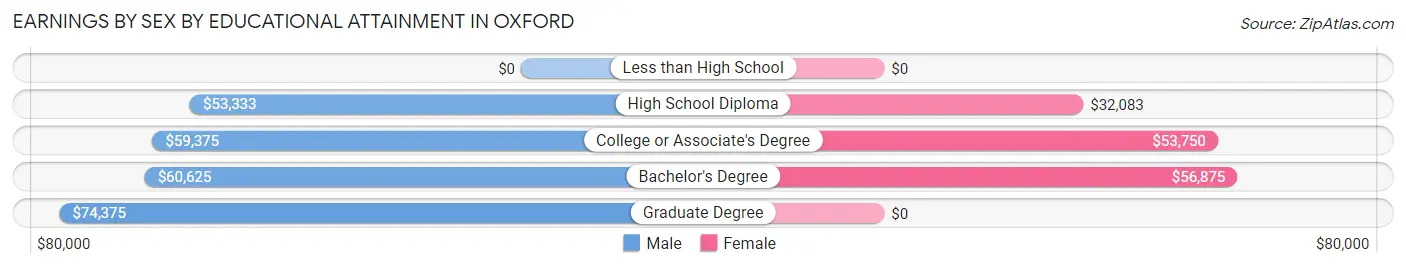
| Educational Attainment | Male Income | Female Income |
| Less than High School | - | - |
| High School Diploma | $53,333 | $32,083 |
| College or Associate's Degree | $59,375 | $53,750 |
| Bachelor's Degree | $60,625 | $56,875 |
| Graduate Degree | $74,375 | $0 |
| Total | $60,313 | $46,250 |
Family Income in Oxford
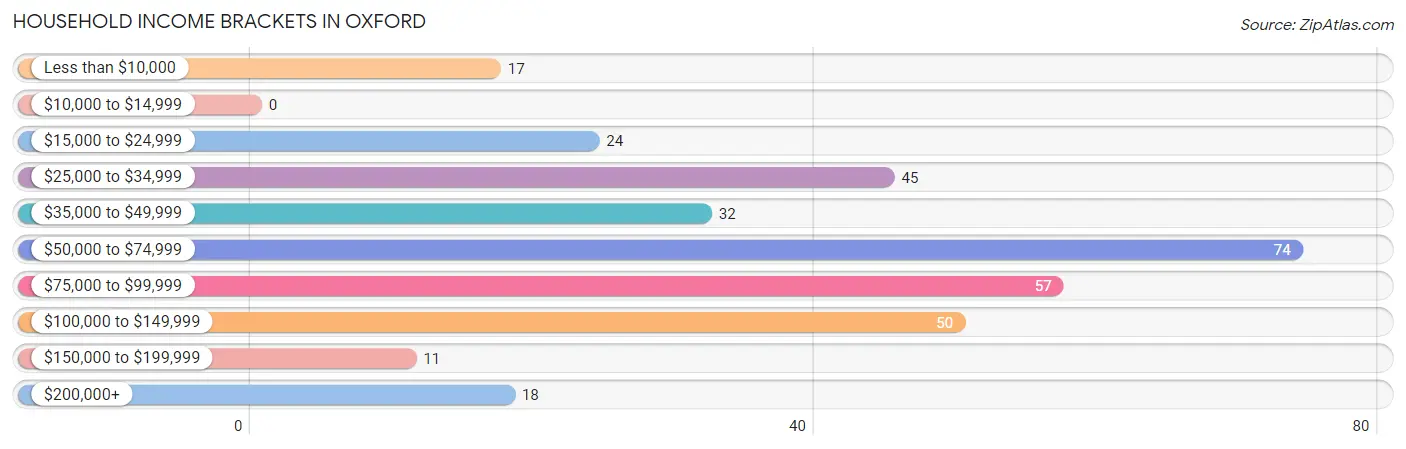
Family Income Brackets in Oxford
According to the Oxford family income data, there are 41 families falling into the $75,000 to $99,999 income range, which is the most common income bracket and makes up 27.2% of all families.
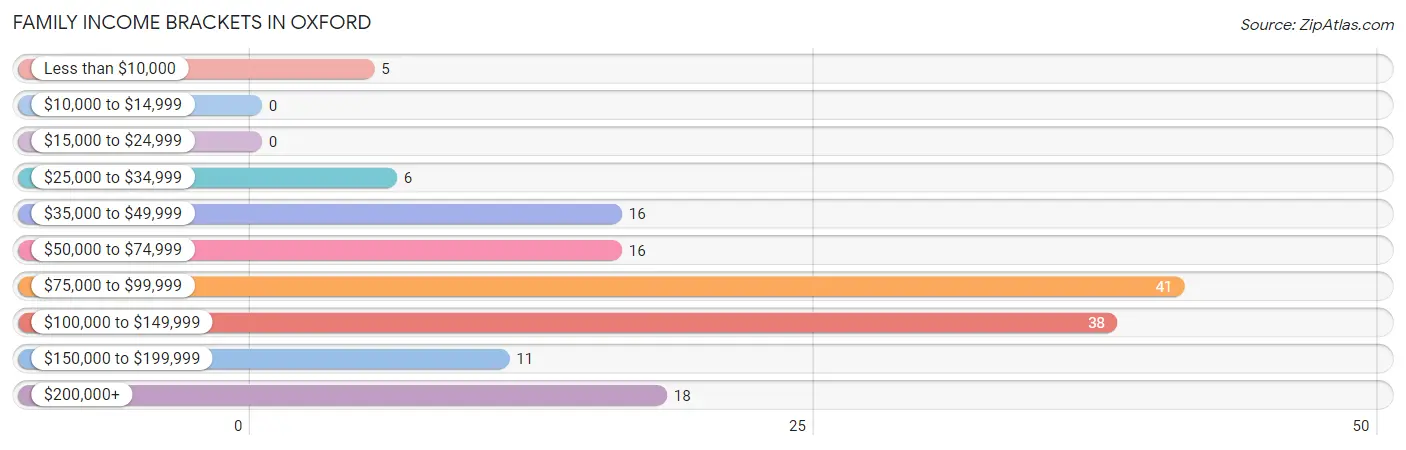
| Income Bracket | # Families | % Families |
| Less than $10,000 | 5 | 3.3% |
| $10,000 to $14,999 | 0 | 0.0% |
| $15,000 to $24,999 | 0 | 0.0% |
| $25,000 to $34,999 | 6 | 4.0% |
| $35,000 to $49,999 | 16 | 10.6% |
| $50,000 to $74,999 | 16 | 10.6% |
| $75,000 to $99,999 | 41 | 27.2% |
| $100,000 to $149,999 | 38 | 25.2% |
| $150,000 to $199,999 | 11 | 7.3% |
| $200,000+ | 18 | 11.9% |
Family Income by Famaliy Size in Oxford
4-person families (31 | 20.5%) account for the highest median family income in Oxford with $250,001 per family, while 4-person families (31 | 20.5%) have the highest median income of $62,500 per family member.
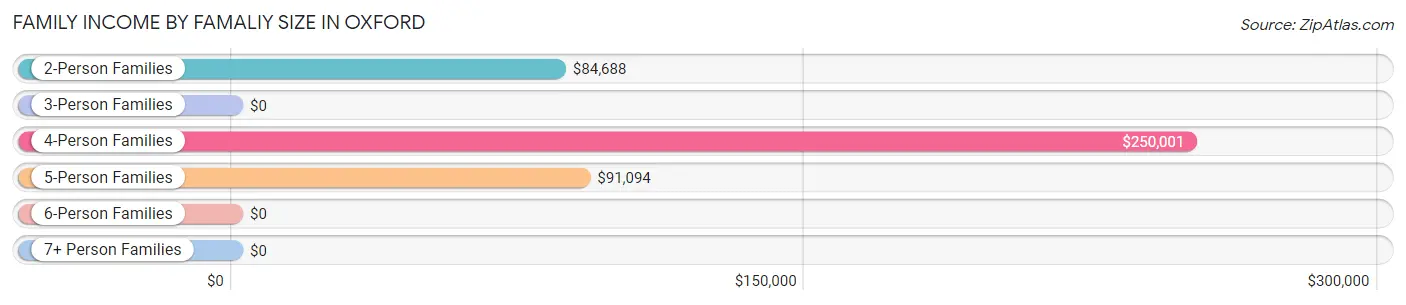
| Income Bracket | # Families | Median Income |
| 2-Person Families | 71 (47.0%) | $84,688 |
| 3-Person Families | 30 (19.9%) | $0 |
| 4-Person Families | 31 (20.5%) | $250,001 |
| 5-Person Families | 17 (11.3%) | $91,094 |
| 6-Person Families | 0 (0.0%) | $0 |
| 7+ Person Families | 2 (1.3%) | $0 |
| Total | 151 (100.0%) | $91,250 |
Family Income by Number of Earners in Oxford
The median family income in Oxford is $91,250, with families comprising 3+ earners (17) having the highest median family income of $140,417, while families with no earners (8) have the lowest median family income of $32,500, accounting for 11.3% and 5.3% of families, respectively.
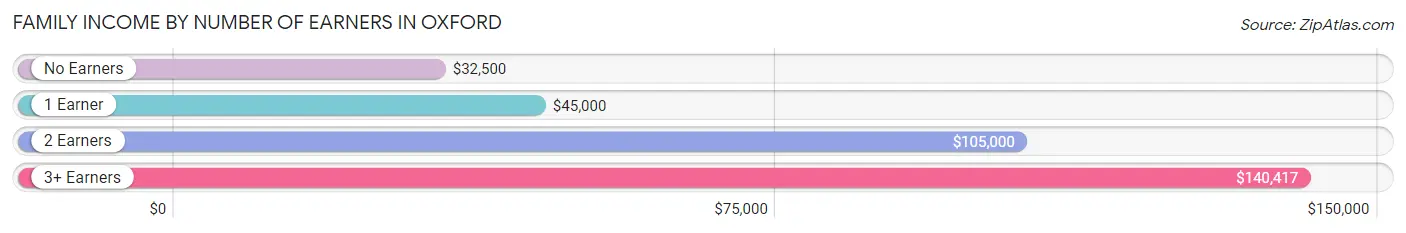
| Number of Earners | # Families | Median Income |
| No Earners | 8 (5.3%) | $32,500 |
| 1 Earner | 38 (25.2%) | $45,000 |
| 2 Earners | 88 (58.3%) | $105,000 |
| 3+ Earners | 17 (11.3%) | $140,417 |
| Total | 151 (100.0%) | $91,250 |
Household Income in Oxford
Household Income Brackets in Oxford
With 74 households falling in the category, the $50,000 to $74,999 income range is the most frequent in Oxford, accounting for 22.6% of all households.
| Income Bracket | # Households | % Households |
| Less than $10,000 | 17 | 5.2% |
| $10,000 to $14,999 | 0 | 0.0% |
| $15,000 to $24,999 | 24 | 7.3% |
| $25,000 to $34,999 | 45 | 13.7% |
| $35,000 to $49,999 | 32 | 9.8% |
| $50,000 to $74,999 | 74 | 22.6% |
| $75,000 to $99,999 | 57 | 17.4% |
| $100,000 to $149,999 | 50 | 15.2% |
| $150,000 to $199,999 | 11 | 3.4% |
| $200,000+ | 18 | 5.5% |
Household Income by Householder Age in Oxford
The median household income in Oxford is $64,643, with the highest median household income of $85,625 found in the 25 to 44 years age bracket for the primary householder. A total of 115 households (35.1%) fall into this category. Meanwhile, the 65+ years age bracket for the primary householder has the lowest median household income of $30,846, with 97 households (29.6%) in this group.
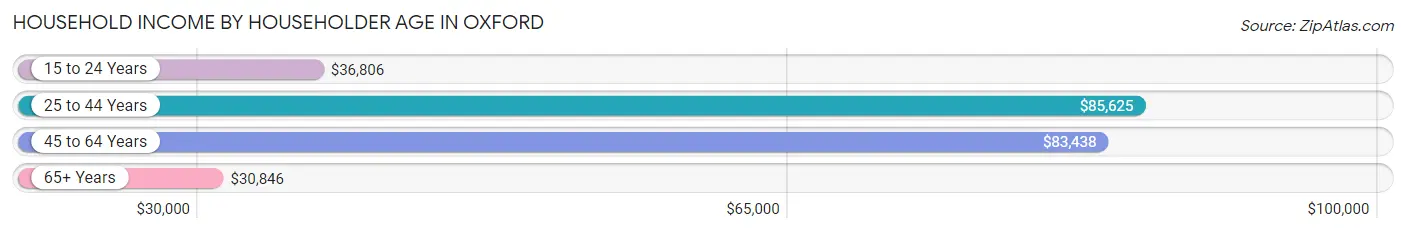
| Income Bracket | # Households | Median Income |
| 15 to 24 Years | 23 (7.0%) | $36,806 |
| 25 to 44 Years | 115 (35.1%) | $85,625 |
| 45 to 64 Years | 93 (28.3%) | $83,438 |
| 65+ Years | 97 (29.6%) | $30,846 |
| Total | 328 (100.0%) | $64,643 |
Poverty in Oxford
Income Below Poverty by Sex and Age in Oxford
With 7.1% poverty level for males and 6.0% for females among the residents of Oxford, under 5 year old males and 18 to 24 year old females are the most vulnerable to poverty, with 16 males (45.7%) and 11 females (45.8%) in their respective age groups living below the poverty level.
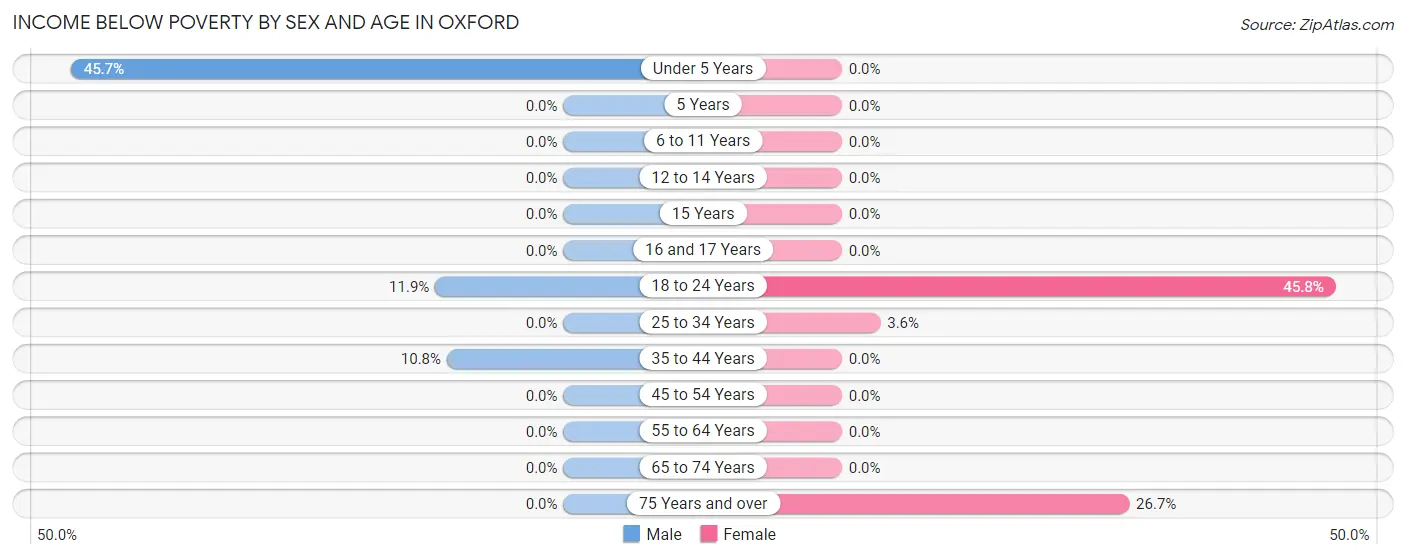
| Age Bracket | Male | Female |
| Under 5 Years | 16 (45.7%) | 0 (0.0%) |
| 5 Years | 0 (0.0%) | 0 (0.0%) |
| 6 to 11 Years | 0 (0.0%) | 0 (0.0%) |
| 12 to 14 Years | 0 (0.0%) | 0 (0.0%) |
| 15 Years | 0 (0.0%) | 0 (0.0%) |
| 16 and 17 Years | 0 (0.0%) | 0 (0.0%) |
| 18 to 24 Years | 5 (11.9%) | 11 (45.8%) |
| 25 to 34 Years | 0 (0.0%) | 2 (3.6%) |
| 35 to 44 Years | 4 (10.8%) | 0 (0.0%) |
| 45 to 54 Years | 0 (0.0%) | 0 (0.0%) |
| 55 to 64 Years | 0 (0.0%) | 0 (0.0%) |
| 65 to 74 Years | 0 (0.0%) | 0 (0.0%) |
| 75 Years and over | 0 (0.0%) | 8 (26.7%) |
| Total | 25 (7.1%) | 21 (6.0%) |
Income Above Poverty by Sex and Age in Oxford
According to the poverty statistics in Oxford, males aged 5 years and females aged under 5 years are the age groups that are most secure financially, with 100.0% of males and 100.0% of females in these age groups living above the poverty line.
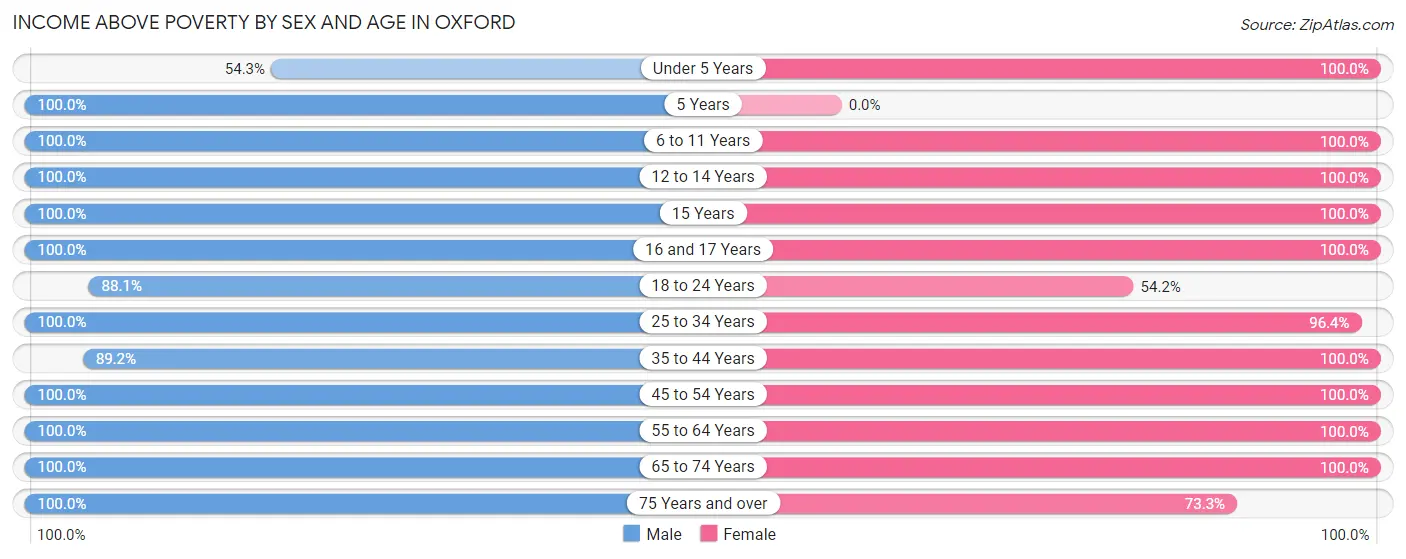
| Age Bracket | Male | Female |
| Under 5 Years | 19 (54.3%) | 12 (100.0%) |
| 5 Years | 8 (100.0%) | 0 (0.0%) |
| 6 to 11 Years | 22 (100.0%) | 35 (100.0%) |
| 12 to 14 Years | 17 (100.0%) | 21 (100.0%) |
| 15 Years | 6 (100.0%) | 2 (100.0%) |
| 16 and 17 Years | 2 (100.0%) | 13 (100.0%) |
| 18 to 24 Years | 37 (88.1%) | 13 (54.2%) |
| 25 to 34 Years | 45 (100.0%) | 54 (96.4%) |
| 35 to 44 Years | 33 (89.2%) | 40 (100.0%) |
| 45 to 54 Years | 25 (100.0%) | 29 (100.0%) |
| 55 to 64 Years | 55 (100.0%) | 58 (100.0%) |
| 65 to 74 Years | 47 (100.0%) | 32 (100.0%) |
| 75 Years and over | 9 (100.0%) | 22 (73.3%) |
| Total | 325 (92.9%) | 331 (94.0%) |
Income Below Poverty Among Married-Couple Families in Oxford
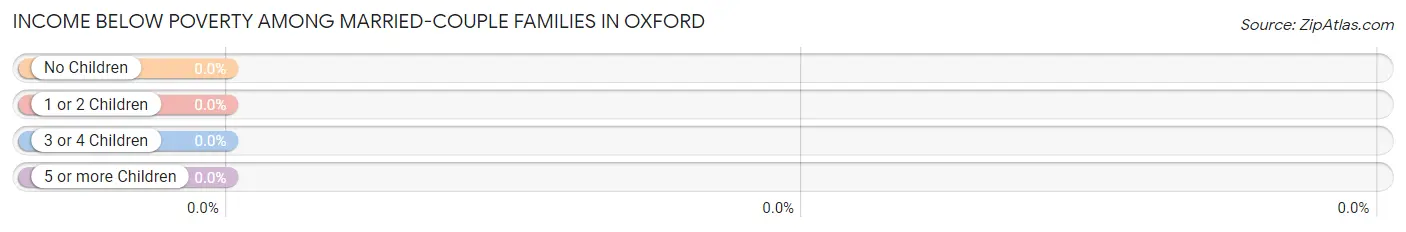
| Children | Above Poverty | Below Poverty |
| No Children | 68 (100.0%) | 0 (0.0%) |
| 1 or 2 Children | 36 (100.0%) | 0 (0.0%) |
| 3 or 4 Children | 16 (100.0%) | 0 (0.0%) |
| 5 or more Children | 0 (0.0%) | 0 (0.0%) |
| Total | 120 (100.0%) | 0 (0.0%) |
Income Below Poverty Among Single-Parent Households in Oxford
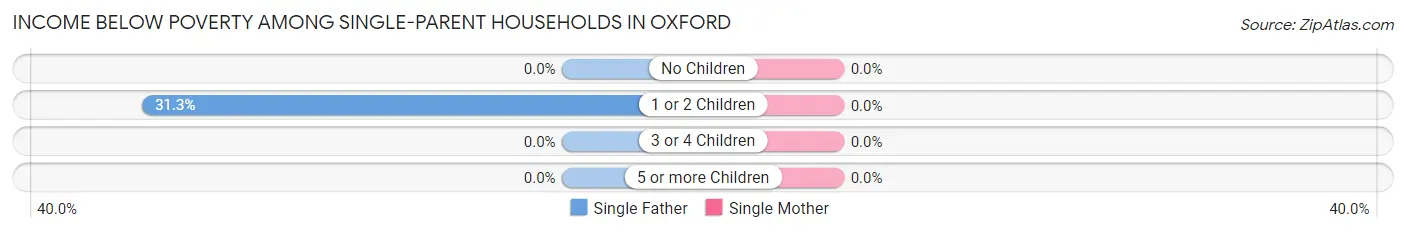
| Children | Single Father | Single Mother |
| No Children | 0 (0.0%) | 0 (0.0%) |
| 1 or 2 Children | 5 (31.2%) | 0 (0.0%) |
| 3 or 4 Children | 0 (0.0%) | 0 (0.0%) |
| 5 or more Children | 0 (0.0%) | 0 (0.0%) |
| Total | 5 (27.8%) | 0 (0.0%) |
Income Below Poverty Among Married-Couple vs Single-Parent Households in Oxford
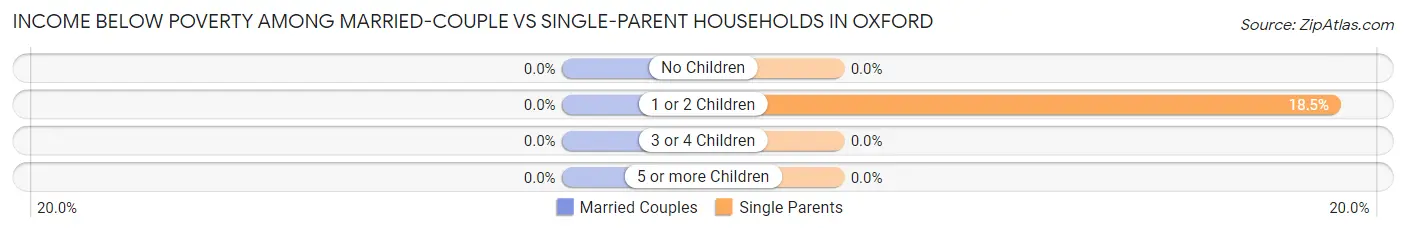
| Children | Married-Couple Families | Single-Parent Households |
| No Children | 0 (0.0%) | 0 (0.0%) |
| 1 or 2 Children | 0 (0.0%) | 5 (18.5%) |
| 3 or 4 Children | 0 (0.0%) | 0 (0.0%) |
| 5 or more Children | 0 (0.0%) | 0 (0.0%) |
| Total | 0 (0.0%) | 5 (16.1%) |
Employment Characteristics in Oxford
Employment by Class of Employer in Oxford
Among the 374 employed individuals in Oxford, private company employees (235 | 62.8%), state government employees (50 | 13.4%), and self-employed (not incorporated) (28 | 7.5%) make up the most common classes of employment.
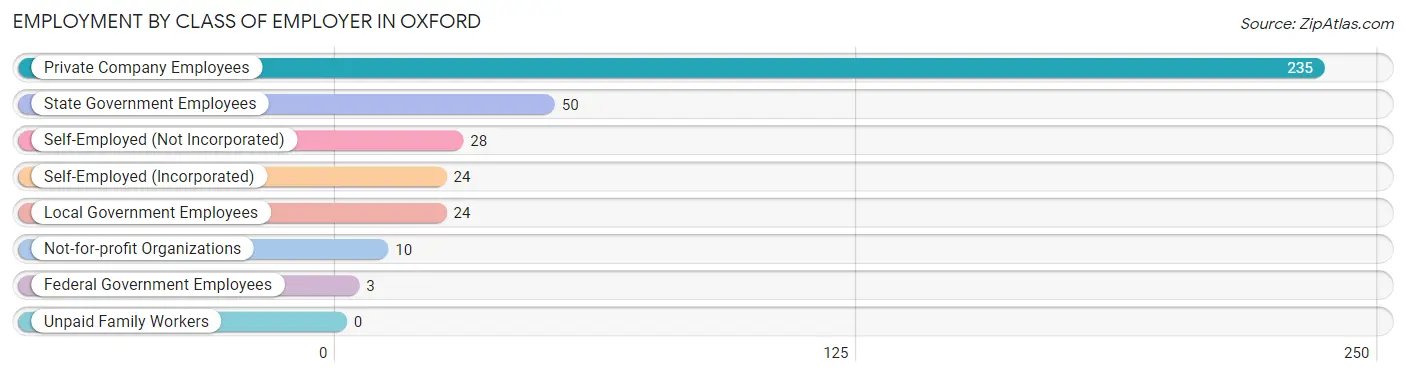
| Employer Class | # Employees | % Employees |
| Private Company Employees | 235 | 62.8% |
| Self-Employed (Incorporated) | 24 | 6.4% |
| Self-Employed (Not Incorporated) | 28 | 7.5% |
| Not-for-profit Organizations | 10 | 2.7% |
| Local Government Employees | 24 | 6.4% |
| State Government Employees | 50 | 13.4% |
| Federal Government Employees | 3 | 0.8% |
| Unpaid Family Workers | 0 | 0.0% |
| Total | 374 | 100.0% |
Employment Status by Age in Oxford
According to the labor force statistics for Oxford, out of the total population over 16 years of age (544), 79.4% or 432 individuals are in the labor force, with 3.0% or 13 of them unemployed. The age group with the highest labor force participation rate is 45 to 54 years, with 100.0% or 54 individuals in the labor force. Within the labor force, the 65 to 74 years age range has the highest percentage of unemployed individuals, with 12.2% or 6 of them being unemployed.
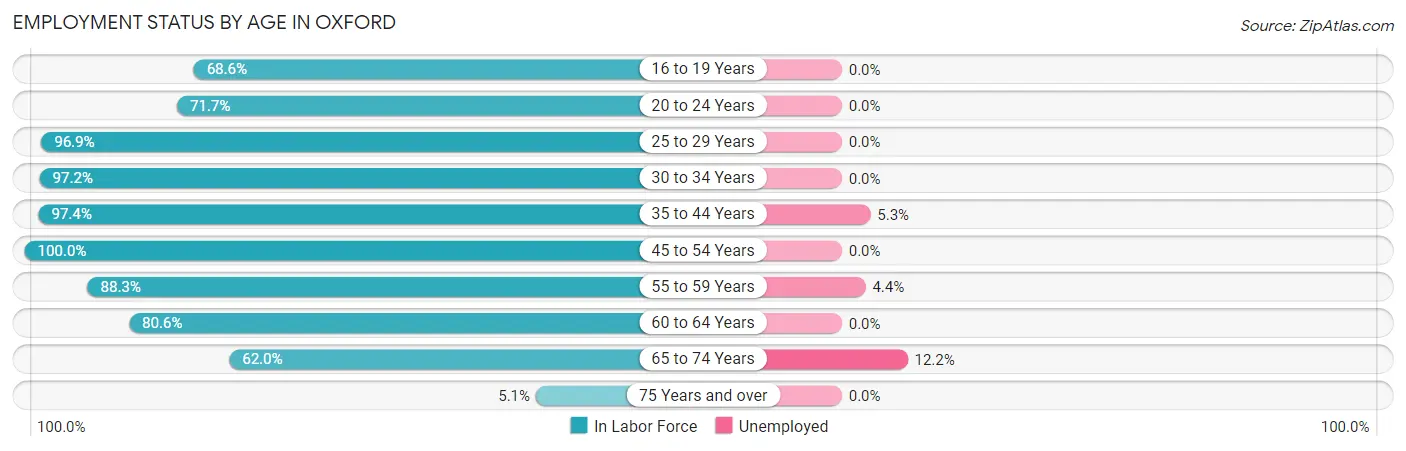
| Age Bracket | In Labor Force | Unemployed |
| 16 to 19 Years | 24 (68.6%) | 0 (0.0%) |
| 20 to 24 Years | 33 (71.7%) | 0 (0.0%) |
| 25 to 29 Years | 63 (96.9%) | 0 (0.0%) |
| 30 to 34 Years | 35 (97.2%) | 0 (0.0%) |
| 35 to 44 Years | 75 (97.4%) | 4 (5.3%) |
| 45 to 54 Years | 54 (100.0%) | 0 (0.0%) |
| 55 to 59 Years | 68 (88.3%) | 3 (4.4%) |
| 60 to 64 Years | 29 (80.6%) | 0 (0.0%) |
| 65 to 74 Years | 49 (62.0%) | 6 (12.2%) |
| 75 Years and over | 2 (5.1%) | 0 (0.0%) |
| Total | 432 (79.4%) | 13 (3.0%) |
Employment Status by Educational Attainment in Oxford
According to labor force statistics for Oxford, 93.9% of individuals (324) out of the total population between 25 and 64 years of age (345) are in the labor force, with 2.2% or 7 of them being unemployed. The group with the highest labor force participation rate are those with the educational attainment of high school diploma, with 97.9% or 93 individuals in the labor force. Within the labor force, individuals with high school diploma education have the highest percentage of unemployment, with 7.5% or 7 of them being unemployed.
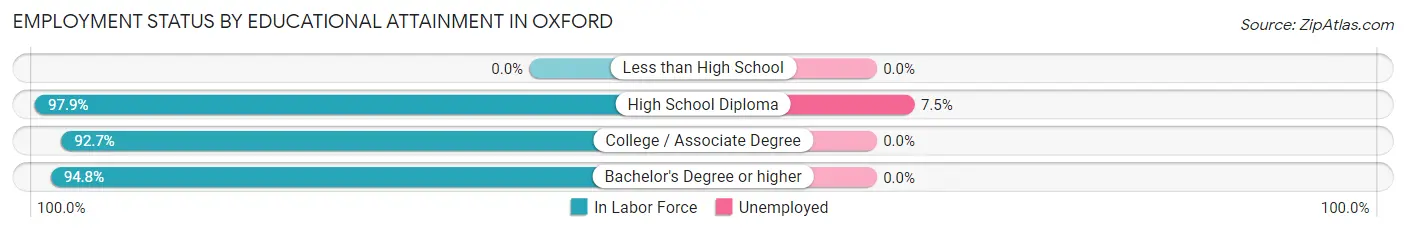
| Educational Attainment | In Labor Force | Unemployed |
| Less than High School | 0 (0.0%) | 0 (0.0%) |
| High School Diploma | 93 (97.9%) | 7 (7.5%) |
| College / Associate Degree | 140 (92.7%) | 0 (0.0%) |
| Bachelor's Degree or higher | 91 (94.8%) | 0 (0.0%) |
| Total | 324 (93.9%) | 8 (2.2%) |
Employment Occupations by Sex in Oxford
Management, Business, Science and Arts Occupations
The most common Management, Business, Science and Arts occupations in Oxford are Management (47 | 11.2%), Community & Social Service (47 | 11.2%), Health Diagnosing & Treating (33 | 7.9%), Education Instruction & Library (31 | 7.4%), and Business & Financial (23 | 5.5%).
Management, Business, Science and Arts Occupations by Sex
Within the Management, Business, Science and Arts occupations in Oxford, the most male-oriented occupations are Computers, Engineering & Science (100.0%), Computers & Mathematics (100.0%), and Architecture & Engineering (100.0%), while the most female-oriented occupations are Health Technologists (100.0%), Health Diagnosing & Treating (97.0%), and Business & Financial (87.0%).
| Occupation | Male | Female |
| Management | 25 (53.2%) | 22 (46.8%) |
| Business & Financial | 3 (13.0%) | 20 (87.0%) |
| Computers, Engineering & Science | 11 (100.0%) | 0 (0.0%) |
| Computers & Mathematics | 3 (100.0%) | 0 (0.0%) |
| Architecture & Engineering | 8 (100.0%) | 0 (0.0%) |
| Life, Physical & Social Science | 0 (0.0%) | 0 (0.0%) |
| Community & Social Service | 28 (59.6%) | 19 (40.4%) |
| Education, Arts & Media | 0 (0.0%) | 0 (0.0%) |
| Legal Services & Support | 0 (0.0%) | 0 (0.0%) |
| Education Instruction & Library | 12 (38.7%) | 19 (61.3%) |
| Arts, Media & Entertainment | 16 (100.0%) | 0 (0.0%) |
| Health Diagnosing & Treating | 1 (3.0%) | 32 (97.0%) |
| Health Technologists | 0 (0.0%) | 22 (100.0%) |
| Total (Category) | 68 (42.2%) | 93 (57.8%) |
| Total (Overall) | 222 (53.0%) | 197 (47.0%) |
Services Occupations
The most common Services occupations in Oxford are Food Preparation & Serving (18 | 4.3%), Healthcare Support (12 | 2.9%), Cleaning & Maintenance (10 | 2.4%), Personal Care & Service (9 | 2.1%), and Security & Protection (5 | 1.2%).
Services Occupations by Sex
Within the Services occupations in Oxford, the most male-oriented occupations are Security & Protection (100.0%), Law Enforcement (100.0%), and Cleaning & Maintenance (40.0%), while the most female-oriented occupations are Healthcare Support (100.0%), Personal Care & Service (100.0%), and Food Preparation & Serving (72.2%).
| Occupation | Male | Female |
| Healthcare Support | 0 (0.0%) | 12 (100.0%) |
| Security & Protection | 5 (100.0%) | 0 (0.0%) |
| Firefighting & Prevention | 0 (0.0%) | 0 (0.0%) |
| Law Enforcement | 5 (100.0%) | 0 (0.0%) |
| Food Preparation & Serving | 5 (27.8%) | 13 (72.2%) |
| Cleaning & Maintenance | 4 (40.0%) | 6 (60.0%) |
| Personal Care & Service | 0 (0.0%) | 9 (100.0%) |
| Total (Category) | 14 (25.9%) | 40 (74.1%) |
| Total (Overall) | 222 (53.0%) | 197 (47.0%) |
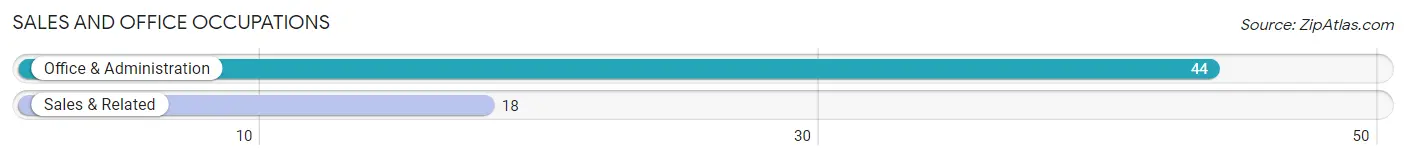
Sales and Office Occupations
The most common Sales and Office occupations in Oxford are Office & Administration (44 | 10.5%), and Sales & Related (18 | 4.3%).
Sales and Office Occupations by Sex
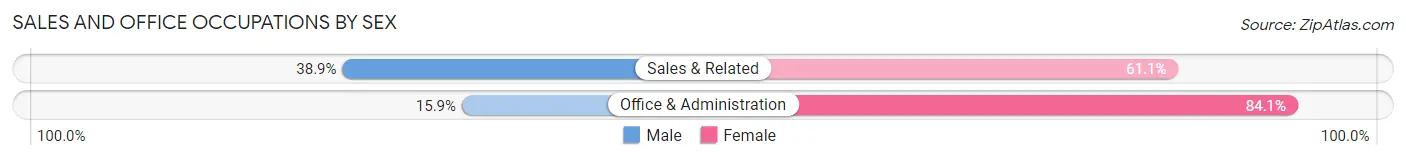
| Occupation | Male | Female |
| Sales & Related | 7 (38.9%) | 11 (61.1%) |
| Office & Administration | 7 (15.9%) | 37 (84.1%) |
| Total (Category) | 14 (22.6%) | 48 (77.4%) |
| Total (Overall) | 222 (53.0%) | 197 (47.0%) |
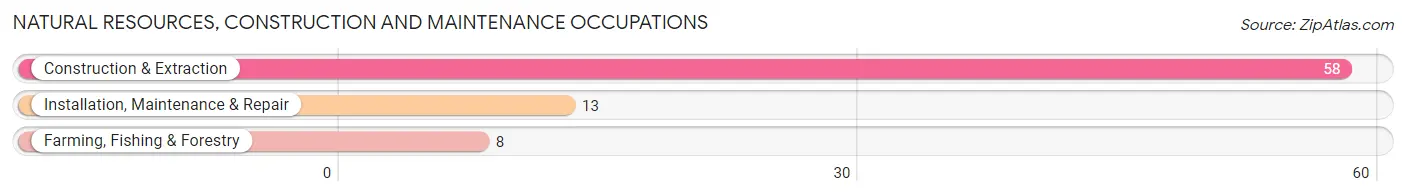
Natural Resources, Construction and Maintenance Occupations
The most common Natural Resources, Construction and Maintenance occupations in Oxford are Construction & Extraction (58 | 13.8%), Installation, Maintenance & Repair (13 | 3.1%), and Farming, Fishing & Forestry (8 | 1.9%).
Natural Resources, Construction and Maintenance Occupations by Sex
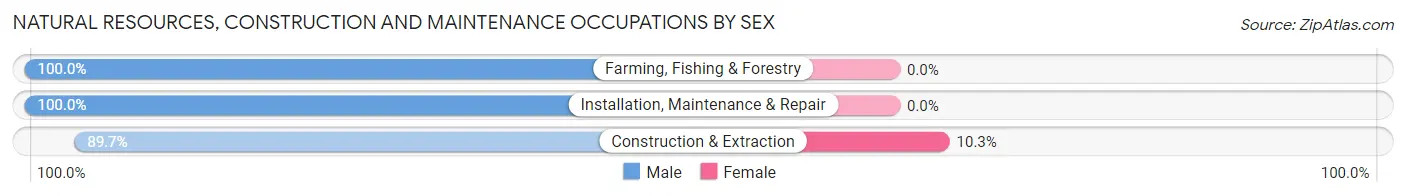
| Occupation | Male | Female |
| Farming, Fishing & Forestry | 8 (100.0%) | 0 (0.0%) |
| Construction & Extraction | 52 (89.7%) | 6 (10.3%) |
| Installation, Maintenance & Repair | 13 (100.0%) | 0 (0.0%) |
| Total (Category) | 73 (92.4%) | 6 (7.6%) |
| Total (Overall) | 222 (53.0%) | 197 (47.0%) |
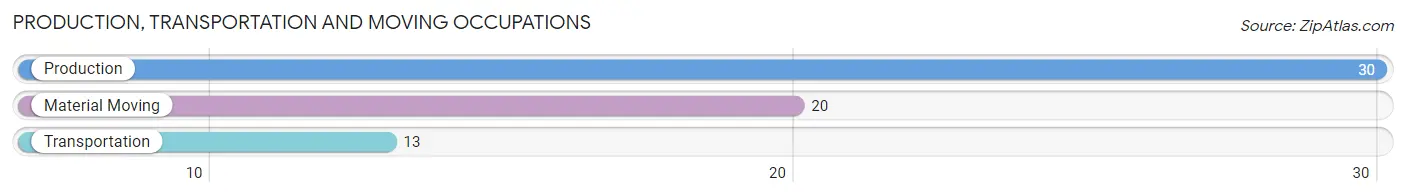
Production, Transportation and Moving Occupations
The most common Production, Transportation and Moving occupations in Oxford are Production (30 | 7.2%), Material Moving (20 | 4.8%), and Transportation (13 | 3.1%).
Production, Transportation and Moving Occupations by Sex
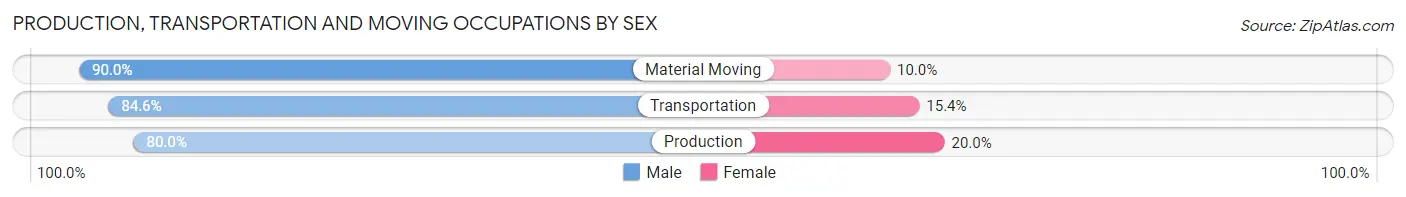
| Occupation | Male | Female |
| Production | 24 (80.0%) | 6 (20.0%) |
| Transportation | 11 (84.6%) | 2 (15.4%) |
| Material Moving | 18 (90.0%) | 2 (10.0%) |
| Total (Category) | 53 (84.1%) | 10 (15.9%) |
| Total (Overall) | 222 (53.0%) | 197 (47.0%) |
Employment Industries by Sex in Oxford
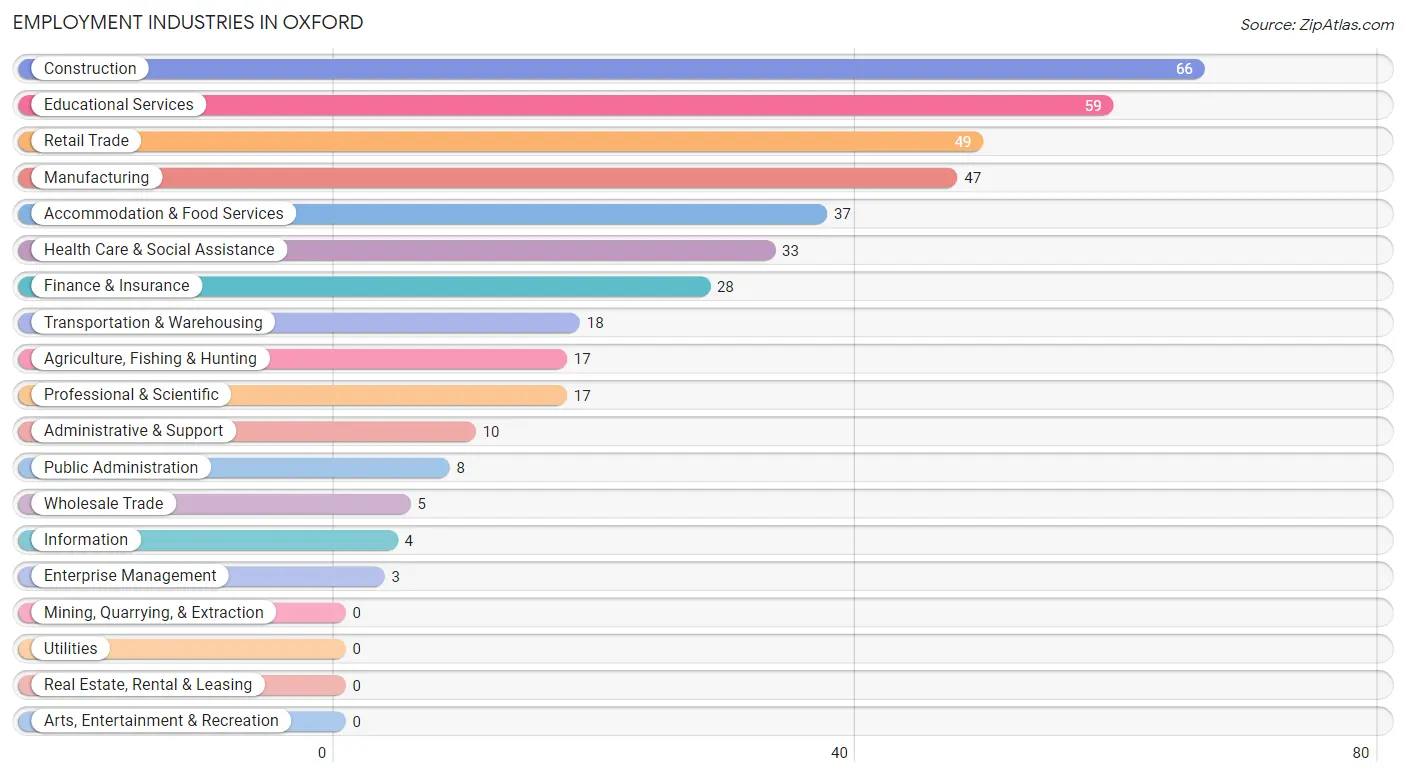
Employment Industries in Oxford
The major employment industries in Oxford include Construction (66 | 15.8%), Educational Services (59 | 14.1%), Retail Trade (49 | 11.7%), Manufacturing (47 | 11.2%), and Accommodation & Food Services (37 | 8.8%).
Employment Industries by Sex in Oxford
The Oxford industries that see more men than women are Agriculture, Fishing & Hunting (100.0%), Information (100.0%), and Construction (90.9%), whereas the industries that tend to have a higher number of women are Finance & Insurance (100.0%), Enterprise Management (100.0%), and Health Care & Social Assistance (100.0%).
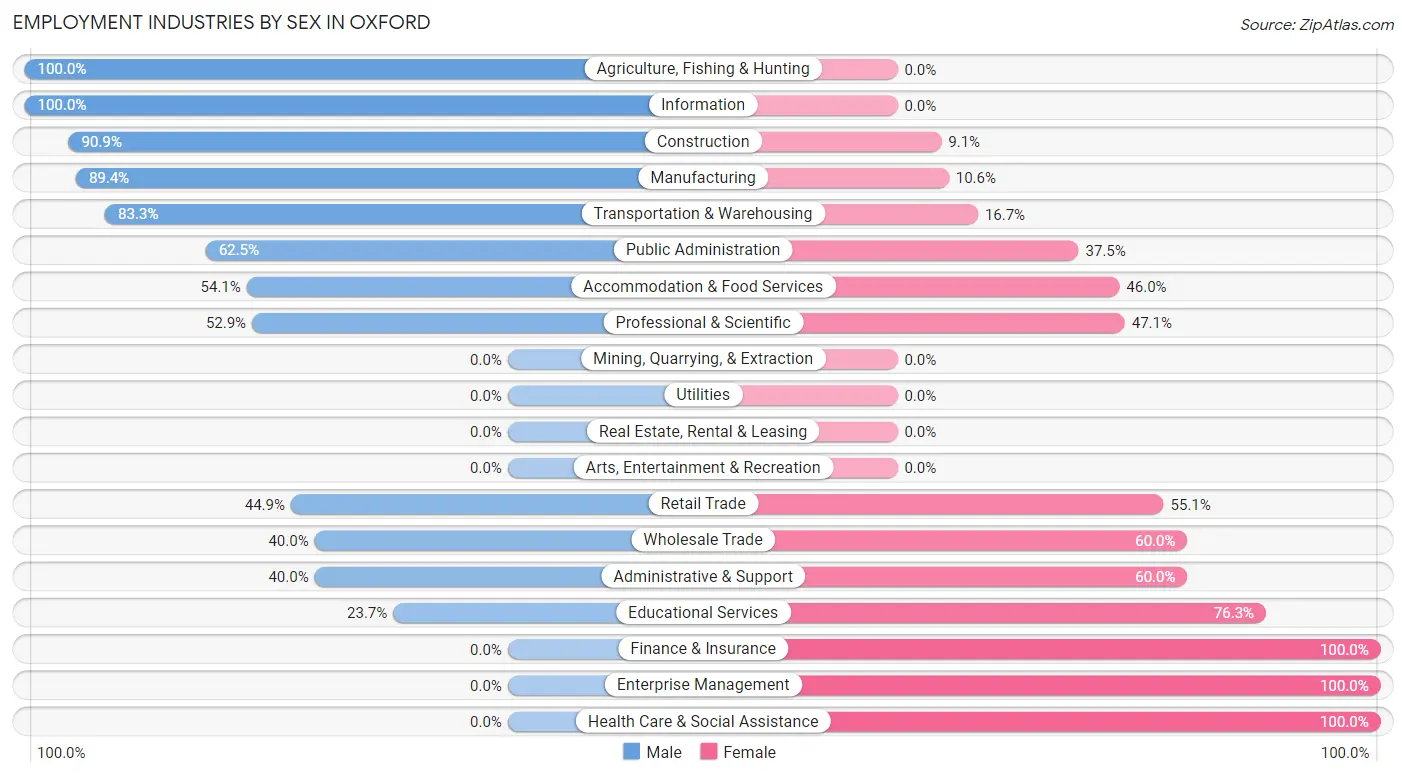
| Industry | Male | Female |
| Agriculture, Fishing & Hunting | 17 (100.0%) | 0 (0.0%) |
| Mining, Quarrying, & Extraction | 0 (0.0%) | 0 (0.0%) |
| Construction | 60 (90.9%) | 6 (9.1%) |
| Manufacturing | 42 (89.4%) | 5 (10.6%) |
| Wholesale Trade | 2 (40.0%) | 3 (60.0%) |
| Retail Trade | 22 (44.9%) | 27 (55.1%) |
| Transportation & Warehousing | 15 (83.3%) | 3 (16.7%) |
| Utilities | 0 (0.0%) | 0 (0.0%) |
| Information | 4 (100.0%) | 0 (0.0%) |
| Finance & Insurance | 0 (0.0%) | 28 (100.0%) |
| Real Estate, Rental & Leasing | 0 (0.0%) | 0 (0.0%) |
| Professional & Scientific | 9 (52.9%) | 8 (47.1%) |
| Enterprise Management | 0 (0.0%) | 3 (100.0%) |
| Administrative & Support | 4 (40.0%) | 6 (60.0%) |
| Educational Services | 14 (23.7%) | 45 (76.3%) |
| Health Care & Social Assistance | 0 (0.0%) | 33 (100.0%) |
| Arts, Entertainment & Recreation | 0 (0.0%) | 0 (0.0%) |
| Accommodation & Food Services | 20 (54.0%) | 17 (46.0%) |
| Public Administration | 5 (62.5%) | 3 (37.5%) |
| Total | 222 (53.0%) | 197 (47.0%) |
Education in Oxford
School Enrollment in Oxford
The most common levels of schooling among the 153 students in Oxford are middle school (49 | 32.0%), elementary school (46 | 30.1%), and high school (37 | 24.2%).
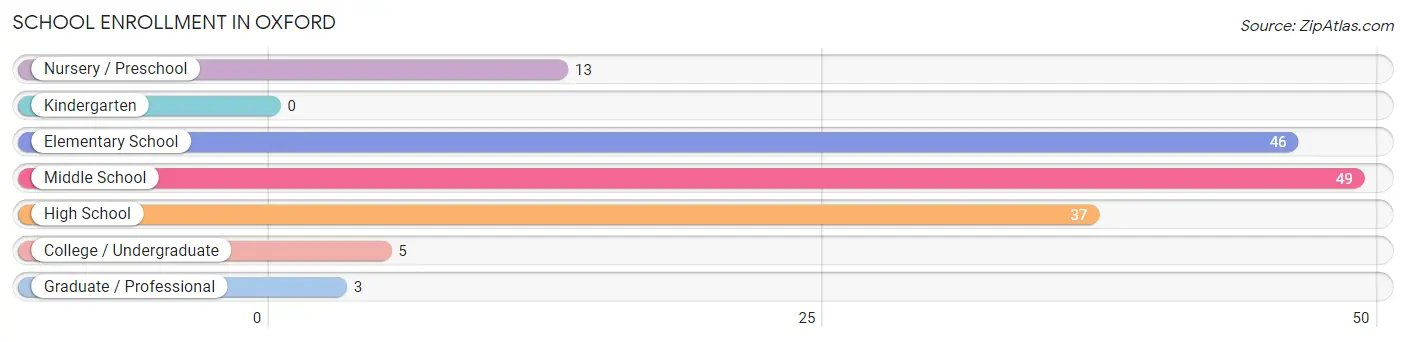
| School Level | # Students | % Students |
| Nursery / Preschool | 13 | 8.5% |
| Kindergarten | 0 | 0.0% |
| Elementary School | 46 | 30.1% |
| Middle School | 49 | 32.0% |
| High School | 37 | 24.2% |
| College / Undergraduate | 5 | 3.3% |
| Graduate / Professional | 3 | 2.0% |
| Total | 153 | 100.0% |
School Enrollment by Age by Funding Source in Oxford
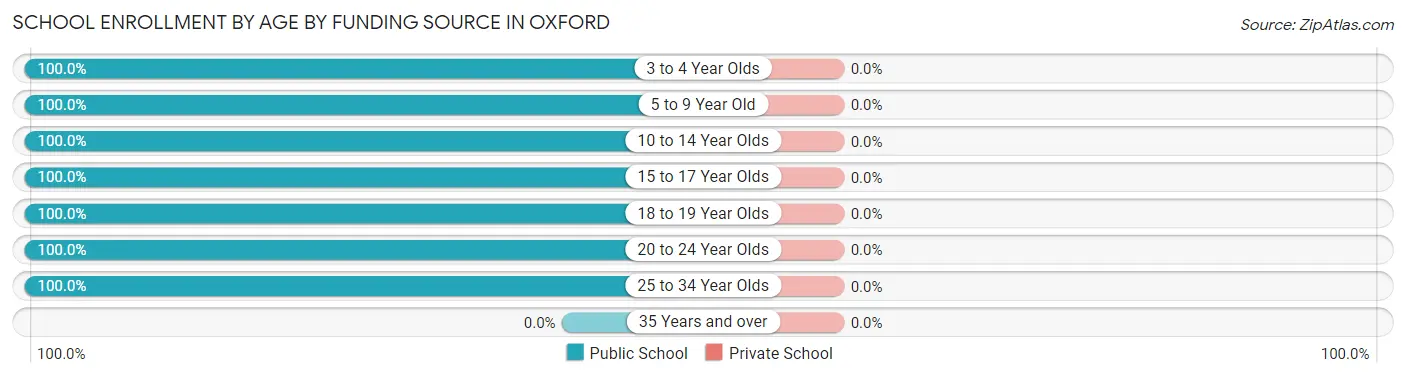
| Age Bracket | Public School | Private School |
| 3 to 4 Year Olds | 5 (100.0%) | 0 (0.0%) |
| 5 to 9 Year Old | 40 (100.0%) | 0 (0.0%) |
| 10 to 14 Year Olds | 63 (100.0%) | 0 (0.0%) |
| 15 to 17 Year Olds | 23 (100.0%) | 0 (0.0%) |
| 18 to 19 Year Olds | 19 (100.0%) | 0 (0.0%) |
| 20 to 24 Year Olds | 2 (100.0%) | 0 (0.0%) |
| 25 to 34 Year Olds | 1 (100.0%) | 0 (0.0%) |
| 35 Years and over | 0 (0.0%) | 0 (0.0%) |
| Total | 153 (100.0%) | 0 (0.0%) |
Educational Attainment by Field of Study in Oxford
Science & technology (39 | 30.0%), education (25 | 19.2%), bio, nature & agricultural (17 | 13.1%), business (10 | 7.7%), and social sciences (7 | 5.4%) are the most common fields of study among 130 individuals in Oxford who have obtained a bachelor's degree or higher.
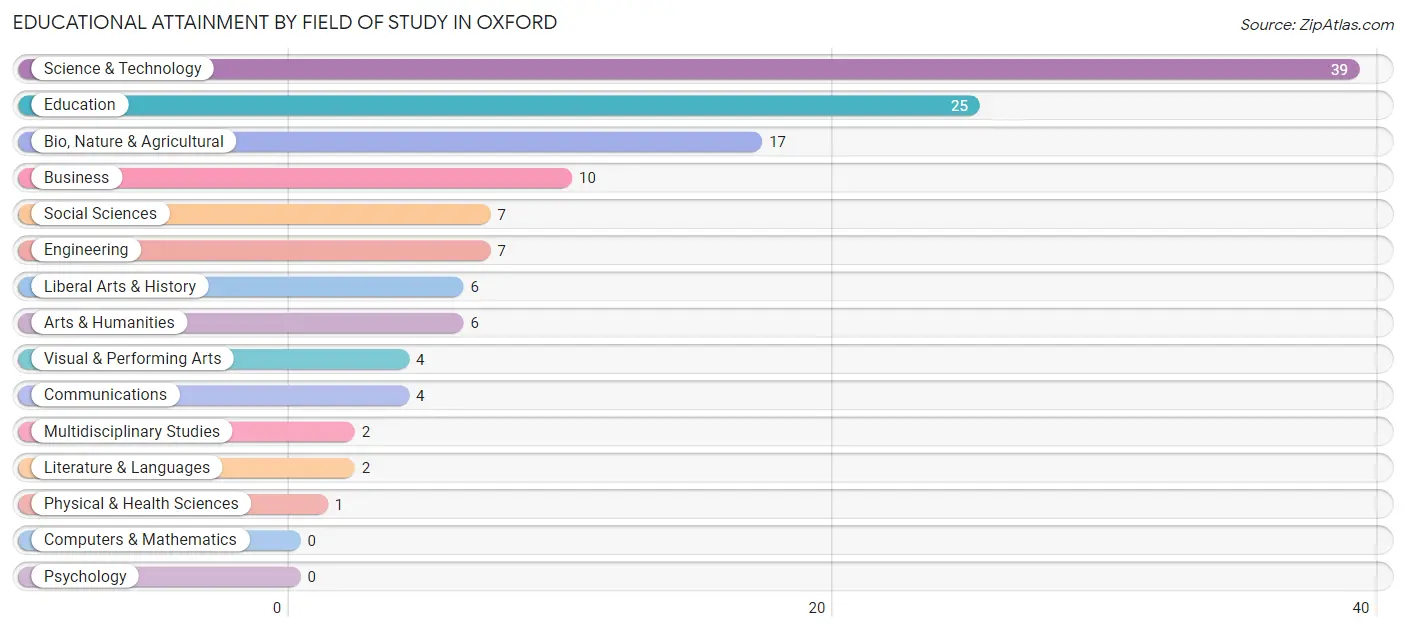
| Field of Study | # Graduates | % Graduates |
| Computers & Mathematics | 0 | 0.0% |
| Bio, Nature & Agricultural | 17 | 13.1% |
| Physical & Health Sciences | 1 | 0.8% |
| Psychology | 0 | 0.0% |
| Social Sciences | 7 | 5.4% |
| Engineering | 7 | 5.4% |
| Multidisciplinary Studies | 2 | 1.5% |
| Science & Technology | 39 | 30.0% |
| Business | 10 | 7.7% |
| Education | 25 | 19.2% |
| Literature & Languages | 2 | 1.5% |
| Liberal Arts & History | 6 | 4.6% |
| Visual & Performing Arts | 4 | 3.1% |
| Communications | 4 | 3.1% |
| Arts & Humanities | 6 | 4.6% |
| Total | 130 | 100.0% |
Transportation & Commute in Oxford
Vehicle Availability by Sex in Oxford
The most prevalent vehicle ownership categories in Oxford are males with 2 vehicles (73, accounting for 39.9%) and females with 2 vehicles (84, making up 38.2%).
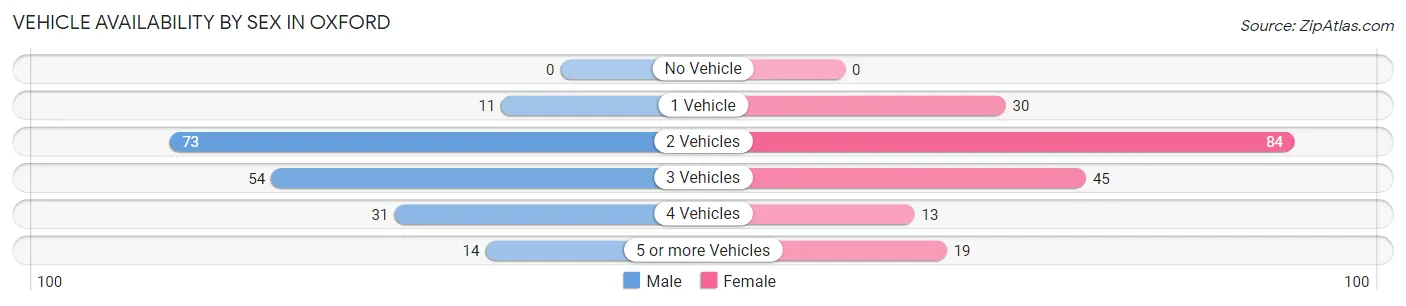
| Vehicles Available | Male | Female |
| No Vehicle | 0 (0.0%) | 0 (0.0%) |
| 1 Vehicle | 11 (6.0%) | 30 (15.7%) |
| 2 Vehicles | 73 (39.9%) | 84 (44.0%) |
| 3 Vehicles | 54 (29.5%) | 45 (23.6%) |
| 4 Vehicles | 31 (16.9%) | 13 (6.8%) |
| 5 or more Vehicles | 14 (7.6%) | 19 (10.0%) |
| Total | 183 (100.0%) | 191 (100.0%) |
Commute Time in Oxford
The most frequently occuring commute durations in Oxford are 20 to 24 minutes (63 commuters, 19.6%), 15 to 19 minutes (52 commuters, 16.2%), and 25 to 29 minutes (46 commuters, 14.3%).
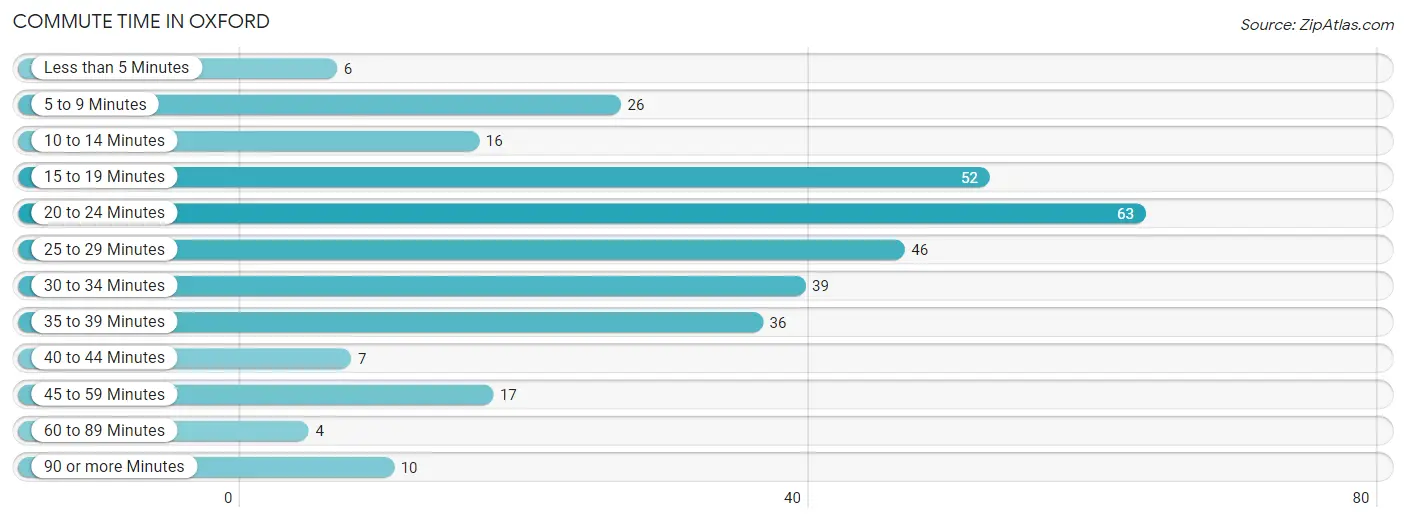
| Commute Time | # Commuters | % Commuters |
| Less than 5 Minutes | 6 | 1.9% |
| 5 to 9 Minutes | 26 | 8.1% |
| 10 to 14 Minutes | 16 | 5.0% |
| 15 to 19 Minutes | 52 | 16.2% |
| 20 to 24 Minutes | 63 | 19.6% |
| 25 to 29 Minutes | 46 | 14.3% |
| 30 to 34 Minutes | 39 | 12.1% |
| 35 to 39 Minutes | 36 | 11.2% |
| 40 to 44 Minutes | 7 | 2.2% |
| 45 to 59 Minutes | 17 | 5.3% |
| 60 to 89 Minutes | 4 | 1.2% |
| 90 or more Minutes | 10 | 3.1% |
Commute Time by Sex in Oxford
The most common commute times in Oxford are 25 to 29 minutes (36 commuters, 20.6%) for males and 20 to 24 minutes (39 commuters, 26.5%) for females.
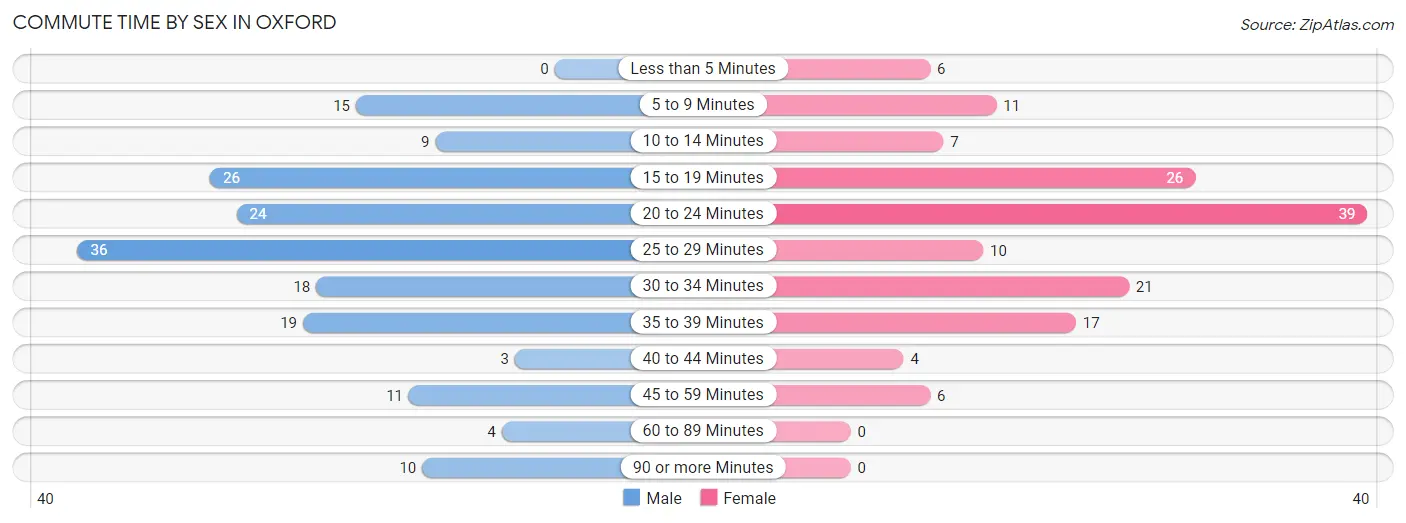
| Commute Time | Male | Female |
| Less than 5 Minutes | 0 (0.0%) | 6 (4.1%) |
| 5 to 9 Minutes | 15 (8.6%) | 11 (7.5%) |
| 10 to 14 Minutes | 9 (5.1%) | 7 (4.8%) |
| 15 to 19 Minutes | 26 (14.9%) | 26 (17.7%) |
| 20 to 24 Minutes | 24 (13.7%) | 39 (26.5%) |
| 25 to 29 Minutes | 36 (20.6%) | 10 (6.8%) |
| 30 to 34 Minutes | 18 (10.3%) | 21 (14.3%) |
| 35 to 39 Minutes | 19 (10.9%) | 17 (11.6%) |
| 40 to 44 Minutes | 3 (1.7%) | 4 (2.7%) |
| 45 to 59 Minutes | 11 (6.3%) | 6 (4.1%) |
| 60 to 89 Minutes | 4 (2.3%) | 0 (0.0%) |
| 90 or more Minutes | 10 (5.7%) | 0 (0.0%) |
Time of Departure to Work by Sex in Oxford
The most frequent times of departure to work in Oxford are 6:00 AM to 6:29 AM (31, 17.7%) for males and 8:00 AM to 8:29 AM (30, 20.4%) for females.
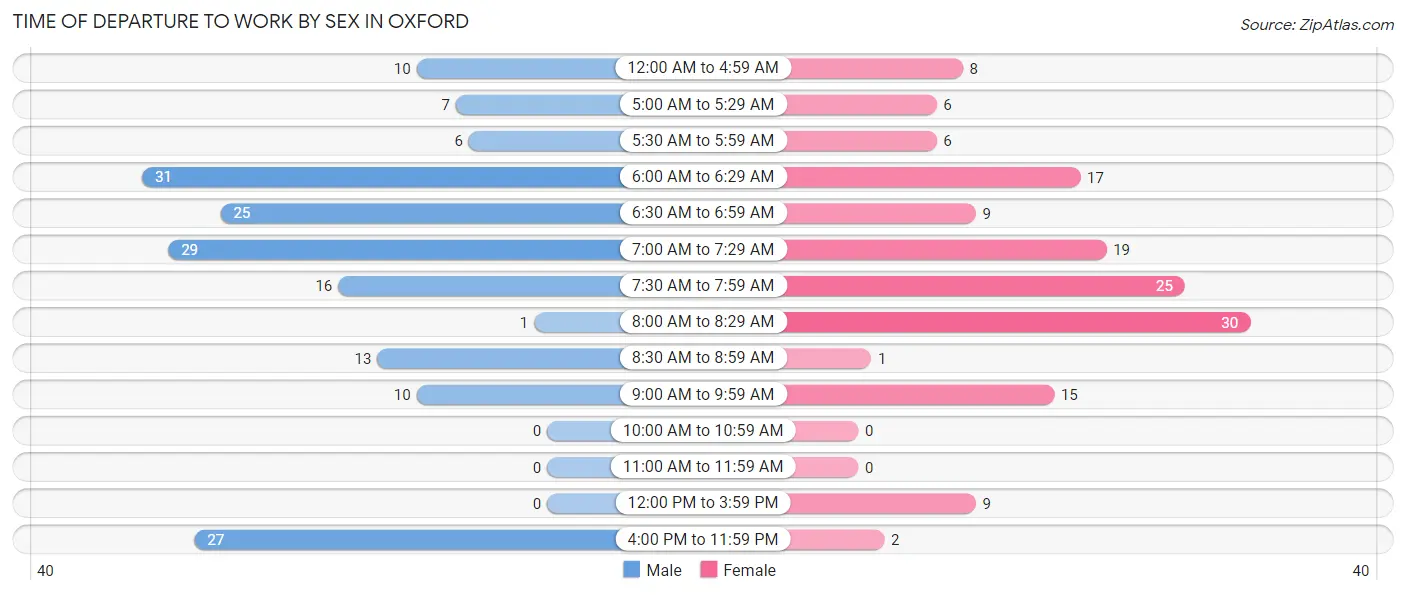
| Time of Departure | Male | Female |
| 12:00 AM to 4:59 AM | 10 (5.7%) | 8 (5.4%) |
| 5:00 AM to 5:29 AM | 7 (4.0%) | 6 (4.1%) |
| 5:30 AM to 5:59 AM | 6 (3.4%) | 6 (4.1%) |
| 6:00 AM to 6:29 AM | 31 (17.7%) | 17 (11.6%) |
| 6:30 AM to 6:59 AM | 25 (14.3%) | 9 (6.1%) |
| 7:00 AM to 7:29 AM | 29 (16.6%) | 19 (12.9%) |
| 7:30 AM to 7:59 AM | 16 (9.1%) | 25 (17.0%) |
| 8:00 AM to 8:29 AM | 1 (0.6%) | 30 (20.4%) |
| 8:30 AM to 8:59 AM | 13 (7.4%) | 1 (0.7%) |
| 9:00 AM to 9:59 AM | 10 (5.7%) | 15 (10.2%) |
| 10:00 AM to 10:59 AM | 0 (0.0%) | 0 (0.0%) |
| 11:00 AM to 11:59 AM | 0 (0.0%) | 0 (0.0%) |
| 12:00 PM to 3:59 PM | 0 (0.0%) | 9 (6.1%) |
| 4:00 PM to 11:59 PM | 27 (15.4%) | 2 (1.4%) |
| Total | 175 (100.0%) | 147 (100.0%) |
Housing Occupancy in Oxford
Occupancy by Ownership in Oxford
Of the total 328 dwellings in Oxford, owner-occupied units account for 242 (73.8%), while renter-occupied units make up 86 (26.2%).
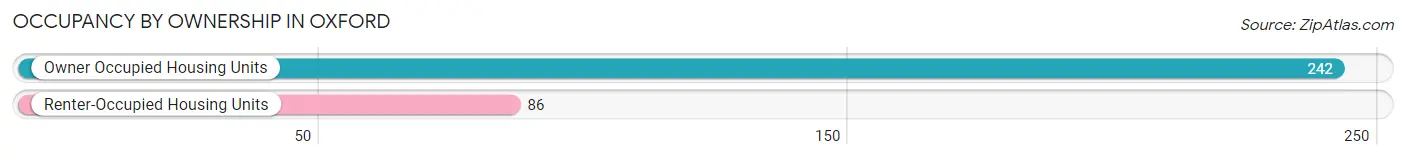
| Occupancy | # Housing Units | % Housing Units |
| Owner Occupied Housing Units | 242 | 73.8% |
| Renter-Occupied Housing Units | 86 | 26.2% |
| Total Occupied Housing Units | 328 | 100.0% |
Occupancy by Household Size in Oxford
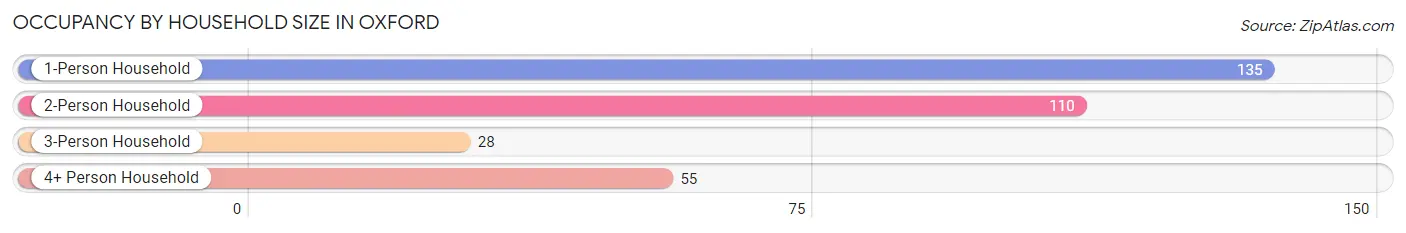
| Household Size | # Housing Units | % Housing Units |
| 1-Person Household | 135 | 41.2% |
| 2-Person Household | 110 | 33.5% |
| 3-Person Household | 28 | 8.5% |
| 4+ Person Household | 55 | 16.8% |
| Total Housing Units | 328 | 100.0% |
Occupancy by Ownership by Household Size in Oxford
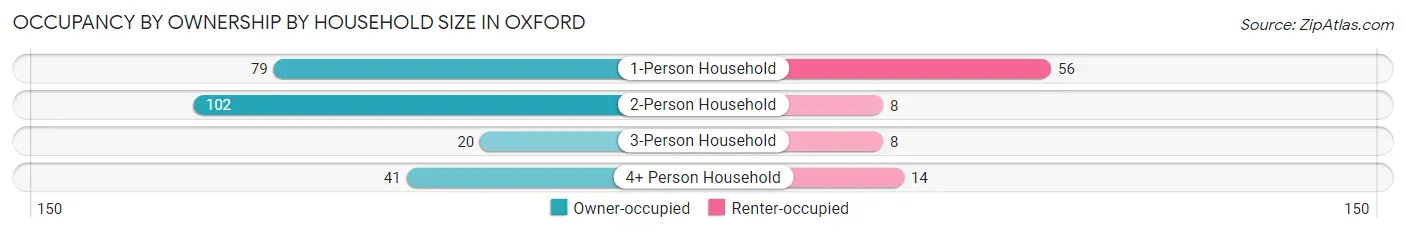
| Household Size | Owner-occupied | Renter-occupied |
| 1-Person Household | 79 (58.5%) | 56 (41.5%) |
| 2-Person Household | 102 (92.7%) | 8 (7.3%) |
| 3-Person Household | 20 (71.4%) | 8 (28.6%) |
| 4+ Person Household | 41 (74.6%) | 14 (25.5%) |
| Total Housing Units | 242 (73.8%) | 86 (26.2%) |
Occupancy by Educational Attainment in Oxford
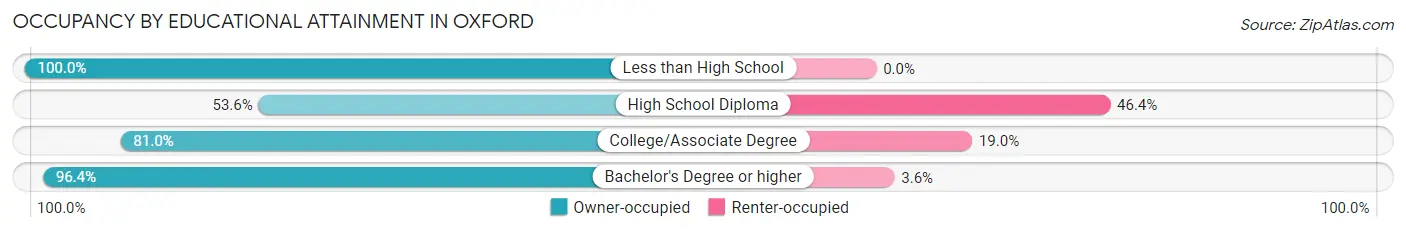
| Household Size | Owner-occupied | Renter-occupied |
| Less than High School | 7 (100.0%) | 0 (0.0%) |
| High School Diploma | 74 (53.6%) | 64 (46.4%) |
| College/Associate Degree | 81 (81.0%) | 19 (19.0%) |
| Bachelor's Degree or higher | 80 (96.4%) | 3 (3.6%) |
Occupancy by Age of Householder in Oxford
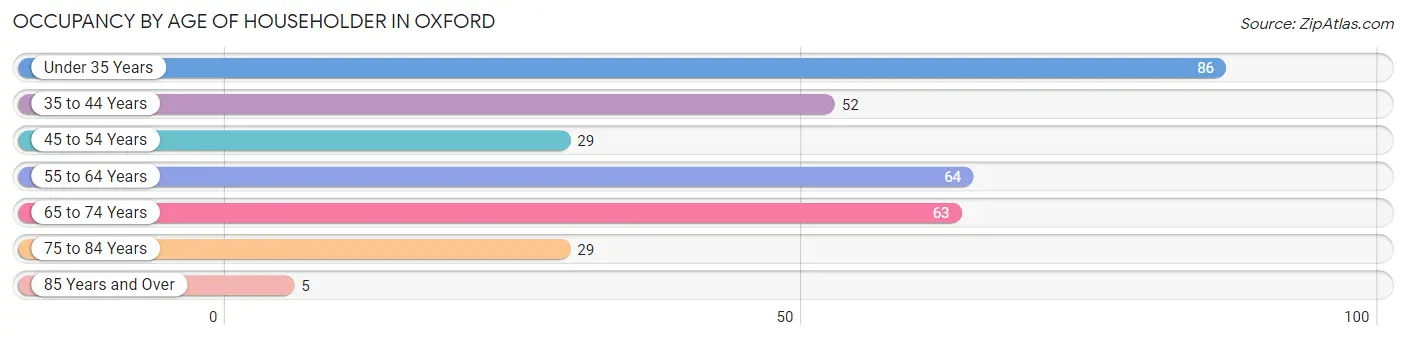
| Age Bracket | # Households | % Households |
| Under 35 Years | 86 | 26.2% |
| 35 to 44 Years | 52 | 15.9% |
| 45 to 54 Years | 29 | 8.8% |
| 55 to 64 Years | 64 | 19.5% |
| 65 to 74 Years | 63 | 19.2% |
| 75 to 84 Years | 29 | 8.8% |
| 85 Years and Over | 5 | 1.5% |
| Total | 328 | 100.0% |
Housing Finances in Oxford
Median Income by Occupancy in Oxford
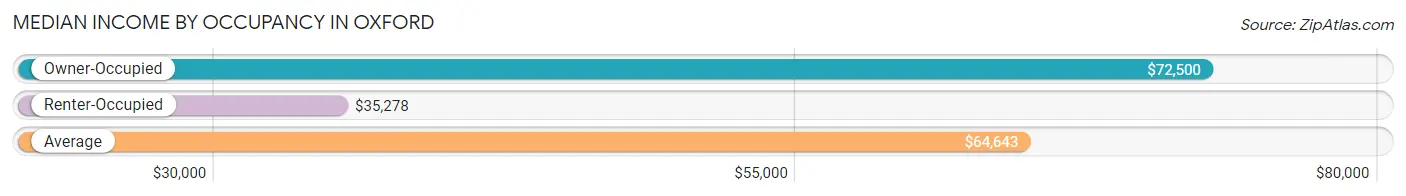
| Occupancy Type | # Households | Median Income |
| Owner-Occupied | 242 (73.8%) | $72,500 |
| Renter-Occupied | 86 (26.2%) | $35,278 |
| Average | 328 (100.0%) | $64,643 |
Occupancy by Householder Income Bracket in Oxford
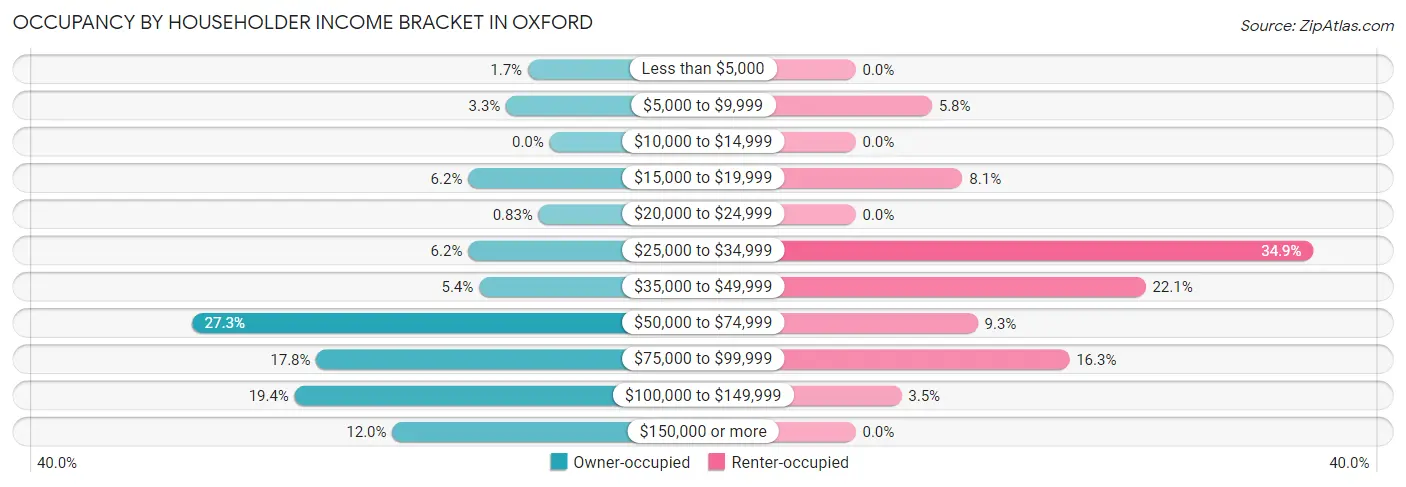
| Income Bracket | Owner-occupied | Renter-occupied |
| Less than $5,000 | 4 (1.7%) | 0 (0.0%) |
| $5,000 to $9,999 | 8 (3.3%) | 5 (5.8%) |
| $10,000 to $14,999 | 0 (0.0%) | 0 (0.0%) |
| $15,000 to $19,999 | 15 (6.2%) | 7 (8.1%) |
| $20,000 to $24,999 | 2 (0.8%) | 0 (0.0%) |
| $25,000 to $34,999 | 15 (6.2%) | 30 (34.9%) |
| $35,000 to $49,999 | 13 (5.4%) | 19 (22.1%) |
| $50,000 to $74,999 | 66 (27.3%) | 8 (9.3%) |
| $75,000 to $99,999 | 43 (17.8%) | 14 (16.3%) |
| $100,000 to $149,999 | 47 (19.4%) | 3 (3.5%) |
| $150,000 or more | 29 (12.0%) | 0 (0.0%) |
| Total | 242 (100.0%) | 86 (100.0%) |
Monthly Housing Cost Tiers in Oxford
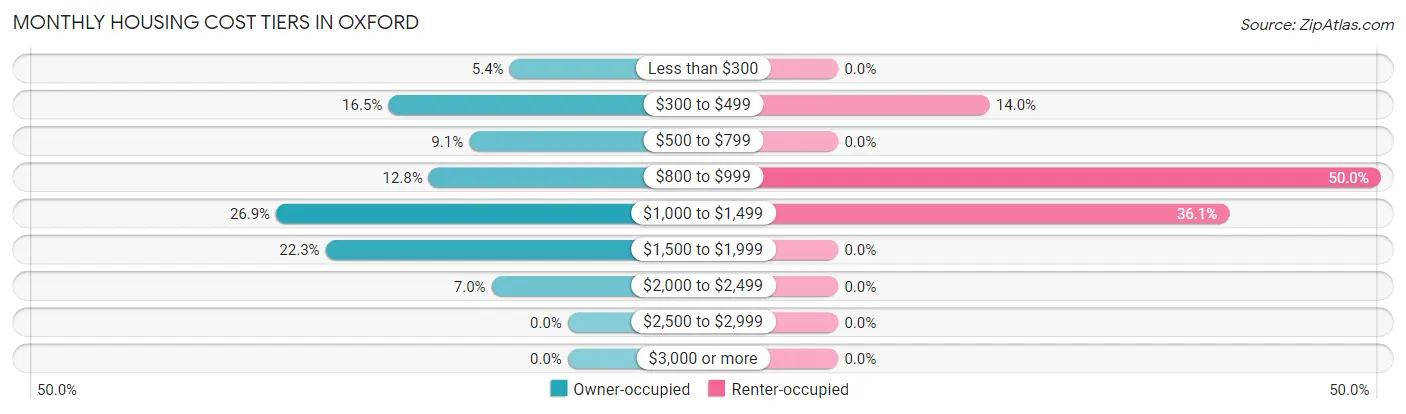
| Monthly Cost | Owner-occupied | Renter-occupied |
| Less than $300 | 13 (5.4%) | 0 (0.0%) |
| $300 to $499 | 40 (16.5%) | 12 (14.0%) |
| $500 to $799 | 22 (9.1%) | 0 (0.0%) |
| $800 to $999 | 31 (12.8%) | 43 (50.0%) |
| $1,000 to $1,499 | 65 (26.9%) | 31 (36.0%) |
| $1,500 to $1,999 | 54 (22.3%) | 0 (0.0%) |
| $2,000 to $2,499 | 17 (7.0%) | 0 (0.0%) |
| $2,500 to $2,999 | 0 (0.0%) | 0 (0.0%) |
| $3,000 or more | 0 (0.0%) | 0 (0.0%) |
| Total | 242 (100.0%) | 86 (100.0%) |
Physical Housing Characteristics in Oxford
Housing Structures in Oxford
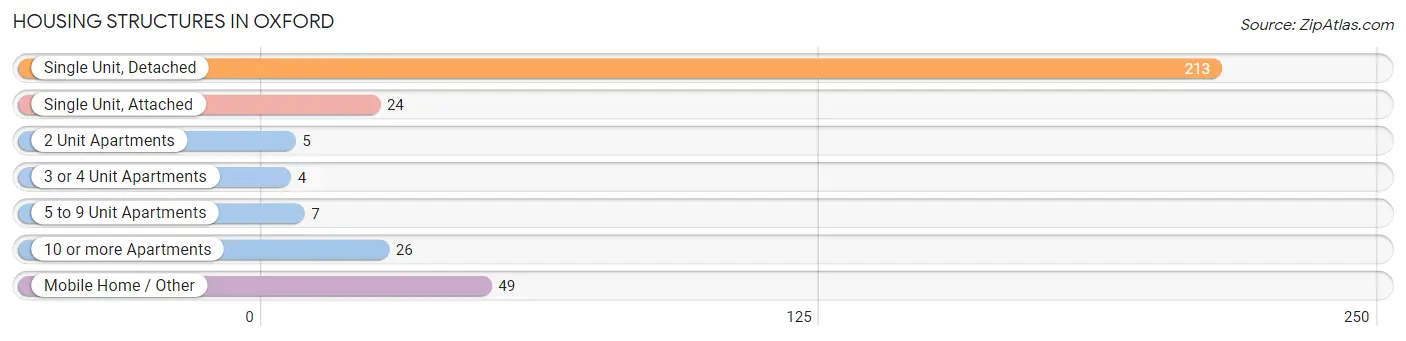
| Structure Type | # Housing Units | % Housing Units |
| Single Unit, Detached | 213 | 64.9% |
| Single Unit, Attached | 24 | 7.3% |
| 2 Unit Apartments | 5 | 1.5% |
| 3 or 4 Unit Apartments | 4 | 1.2% |
| 5 to 9 Unit Apartments | 7 | 2.1% |
| 10 or more Apartments | 26 | 7.9% |
| Mobile Home / Other | 49 | 14.9% |
| Total | 328 | 100.0% |
Housing Structures by Occupancy in Oxford
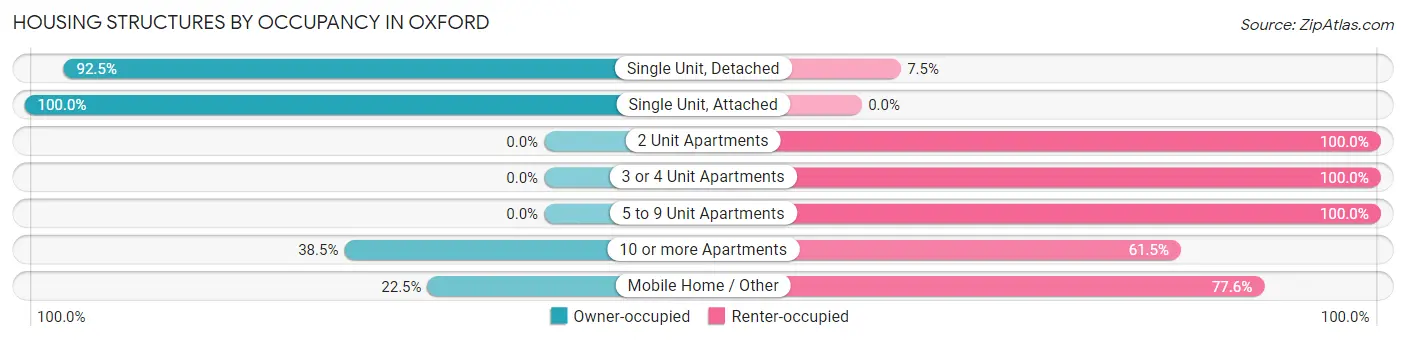
| Structure Type | Owner-occupied | Renter-occupied |
| Single Unit, Detached | 197 (92.5%) | 16 (7.5%) |
| Single Unit, Attached | 24 (100.0%) | 0 (0.0%) |
| 2 Unit Apartments | 0 (0.0%) | 5 (100.0%) |
| 3 or 4 Unit Apartments | 0 (0.0%) | 4 (100.0%) |
| 5 to 9 Unit Apartments | 0 (0.0%) | 7 (100.0%) |
| 10 or more Apartments | 10 (38.5%) | 16 (61.5%) |
| Mobile Home / Other | 11 (22.5%) | 38 (77.5%) |
| Total | 242 (73.8%) | 86 (26.2%) |
Housing Structures by Number of Rooms in Oxford
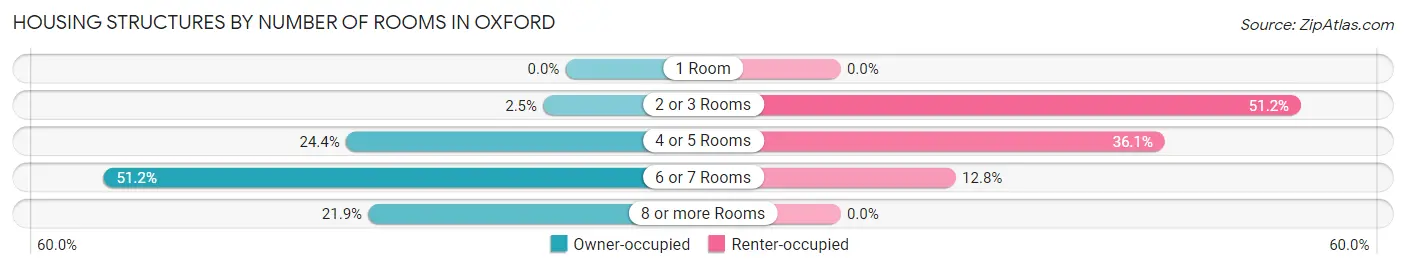
| Number of Rooms | Owner-occupied | Renter-occupied |
| 1 Room | 0 (0.0%) | 0 (0.0%) |
| 2 or 3 Rooms | 6 (2.5%) | 44 (51.2%) |
| 4 or 5 Rooms | 59 (24.4%) | 31 (36.0%) |
| 6 or 7 Rooms | 124 (51.2%) | 11 (12.8%) |
| 8 or more Rooms | 53 (21.9%) | 0 (0.0%) |
| Total | 242 (100.0%) | 86 (100.0%) |
Housing Structure by Heating Type in Oxford
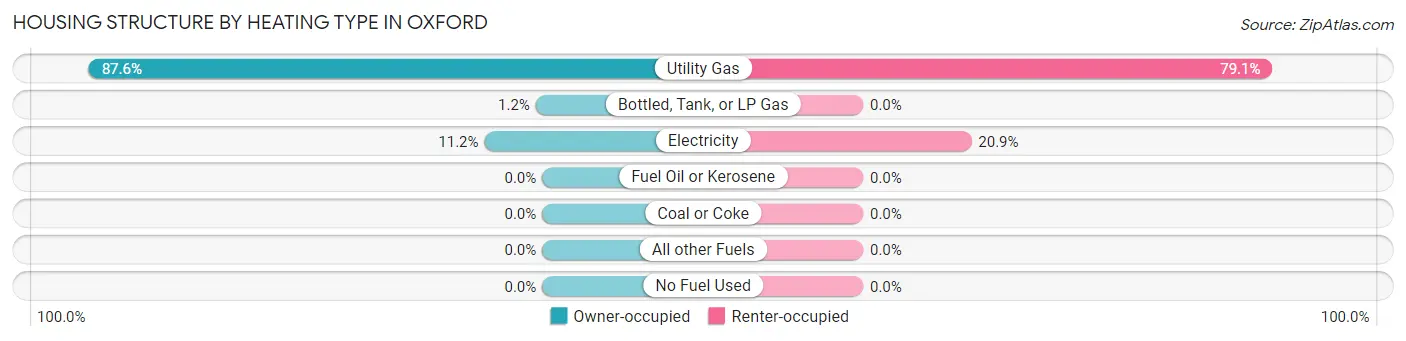
| Heating Type | Owner-occupied | Renter-occupied |
| Utility Gas | 212 (87.6%) | 68 (79.1%) |
| Bottled, Tank, or LP Gas | 3 (1.2%) | 0 (0.0%) |
| Electricity | 27 (11.2%) | 18 (20.9%) |
| Fuel Oil or Kerosene | 0 (0.0%) | 0 (0.0%) |
| Coal or Coke | 0 (0.0%) | 0 (0.0%) |
| All other Fuels | 0 (0.0%) | 0 (0.0%) |
| No Fuel Used | 0 (0.0%) | 0 (0.0%) |
| Total | 242 (100.0%) | 86 (100.0%) |
Household Vehicle Usage in Oxford
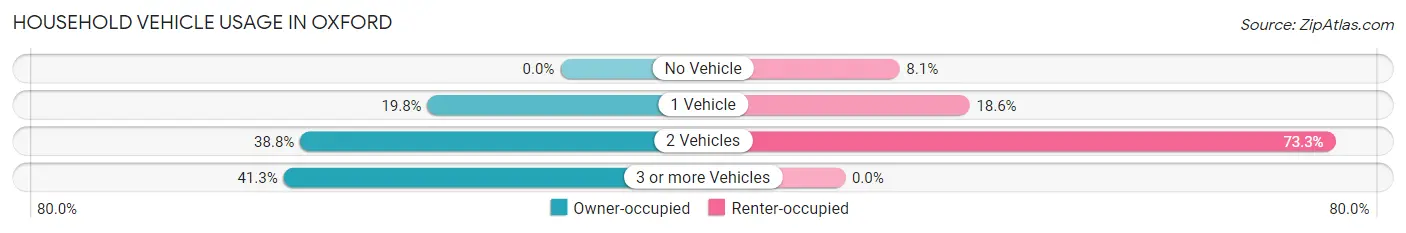
| Vehicles per Household | Owner-occupied | Renter-occupied |
| No Vehicle | 0 (0.0%) | 7 (8.1%) |
| 1 Vehicle | 48 (19.8%) | 16 (18.6%) |
| 2 Vehicles | 94 (38.8%) | 63 (73.3%) |
| 3 or more Vehicles | 100 (41.3%) | 0 (0.0%) |
| Total | 242 (100.0%) | 86 (100.0%) |
Real Estate & Mortgages in Oxford
Real Estate and Mortgage Overview in Oxford
| Characteristic | Without Mortgage | With Mortgage |
| Housing Units | 93 | 149 |
| Median Property Value | $179,400 | $189,700 |
| Median Household Income | $60,368 | $28 |
| Monthly Housing Costs | $478 | $0 |
| Real Estate Taxes | $2,487 | $0 |
Property Value by Mortgage Status in Oxford
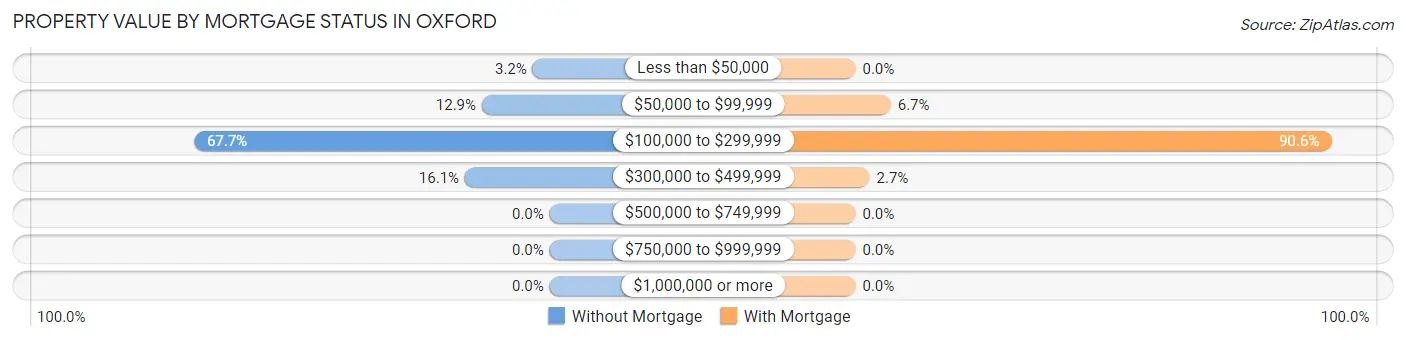
| Property Value | Without Mortgage | With Mortgage |
| Less than $50,000 | 3 (3.2%) | 0 (0.0%) |
| $50,000 to $99,999 | 12 (12.9%) | 10 (6.7%) |
| $100,000 to $299,999 | 63 (67.7%) | 135 (90.6%) |
| $300,000 to $499,999 | 15 (16.1%) | 4 (2.7%) |
| $500,000 to $749,999 | 0 (0.0%) | 0 (0.0%) |
| $750,000 to $999,999 | 0 (0.0%) | 0 (0.0%) |
| $1,000,000 or more | 0 (0.0%) | 0 (0.0%) |
| Total | 93 (100.0%) | 149 (100.0%) |
Household Income by Mortgage Status in Oxford
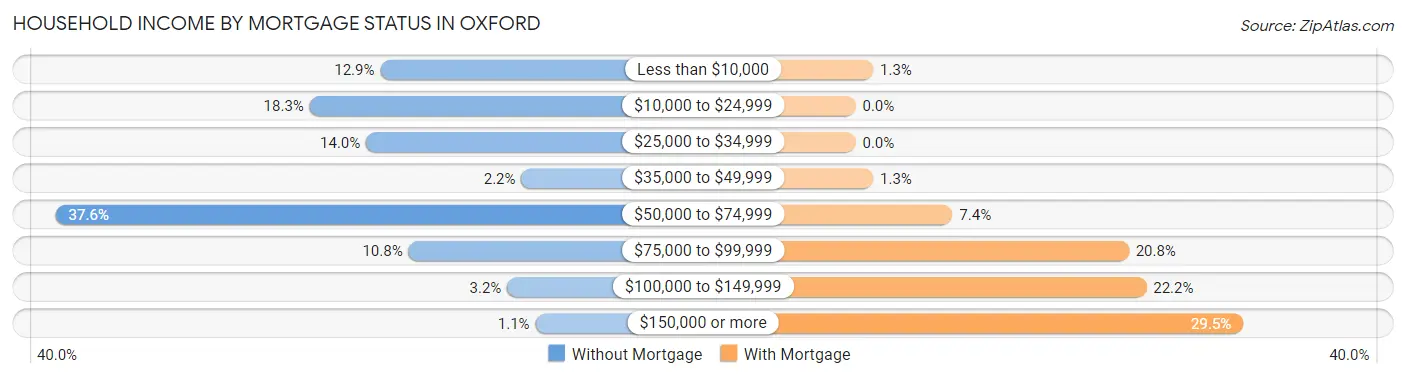
| Household Income | Without Mortgage | With Mortgage |
| Less than $10,000 | 12 (12.9%) | 2 (1.3%) |
| $10,000 to $24,999 | 17 (18.3%) | 0 (0.0%) |
| $25,000 to $34,999 | 13 (14.0%) | 0 (0.0%) |
| $35,000 to $49,999 | 2 (2.1%) | 2 (1.3%) |
| $50,000 to $74,999 | 35 (37.6%) | 11 (7.4%) |
| $75,000 to $99,999 | 10 (10.7%) | 31 (20.8%) |
| $100,000 to $149,999 | 3 (3.2%) | 33 (22.2%) |
| $150,000 or more | 1 (1.1%) | 44 (29.5%) |
| Total | 93 (100.0%) | 149 (100.0%) |
Property Value to Household Income Ratio in Oxford
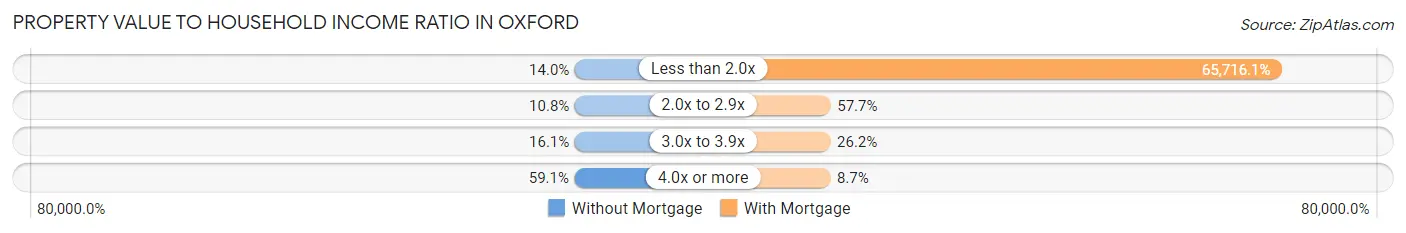
| Value-to-Income Ratio | Without Mortgage | With Mortgage |
| Less than 2.0x | 13 (14.0%) | 97,917 (65,716.1%) |
| 2.0x to 2.9x | 10 (10.7%) | 86 (57.7%) |
| 3.0x to 3.9x | 15 (16.1%) | 39 (26.2%) |
| 4.0x or more | 55 (59.1%) | 13 (8.7%) |
| Total | 93 (100.0%) | 149 (100.0%) |
Real Estate Taxes by Mortgage Status in Oxford
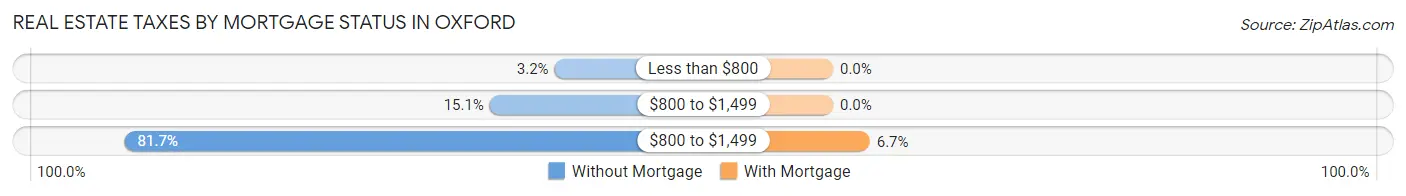
| Property Taxes | Without Mortgage | With Mortgage |
| Less than $800 | 3 (3.2%) | 0 (0.0%) |
| $800 to $1,499 | 14 (15.0%) | 0 (0.0%) |
| $800 to $1,499 | 76 (81.7%) | 10 (6.7%) |
| Total | 93 (100.0%) | 149 (100.0%) |
Health & Disability in Oxford
Health Insurance Coverage by Age in Oxford
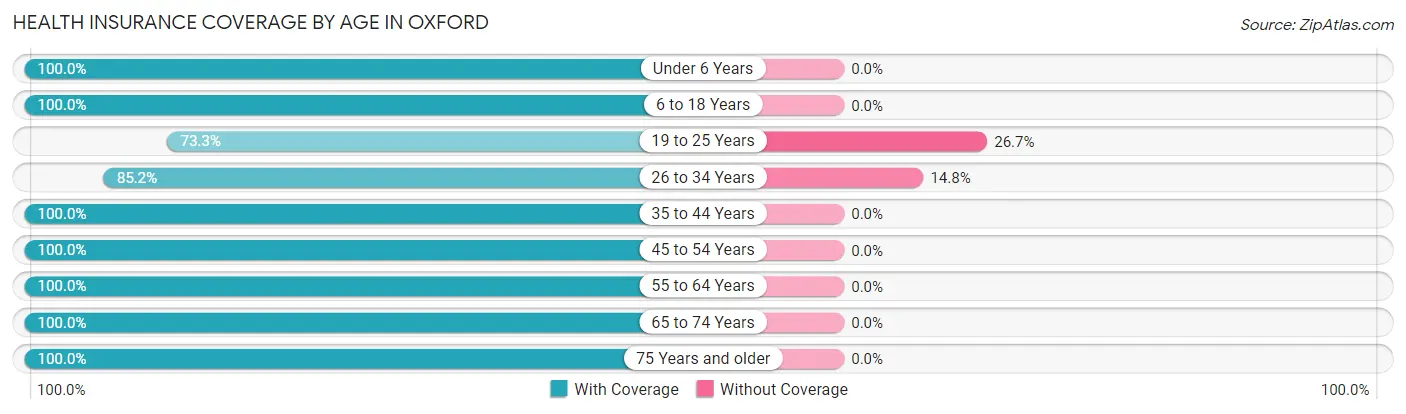
| Age Bracket | With Coverage | Without Coverage |
| Under 6 Years | 55 (100.0%) | 0 (0.0%) |
| 6 to 18 Years | 137 (100.0%) | 0 (0.0%) |
| 19 to 25 Years | 44 (73.3%) | 16 (26.7%) |
| 26 to 34 Years | 75 (85.2%) | 13 (14.8%) |
| 35 to 44 Years | 77 (100.0%) | 0 (0.0%) |
| 45 to 54 Years | 54 (100.0%) | 0 (0.0%) |
| 55 to 64 Years | 113 (100.0%) | 0 (0.0%) |
| 65 to 74 Years | 79 (100.0%) | 0 (0.0%) |
| 75 Years and older | 39 (100.0%) | 0 (0.0%) |
| Total | 673 (95.9%) | 29 (4.1%) |
Health Insurance Coverage by Citizenship Status in Oxford
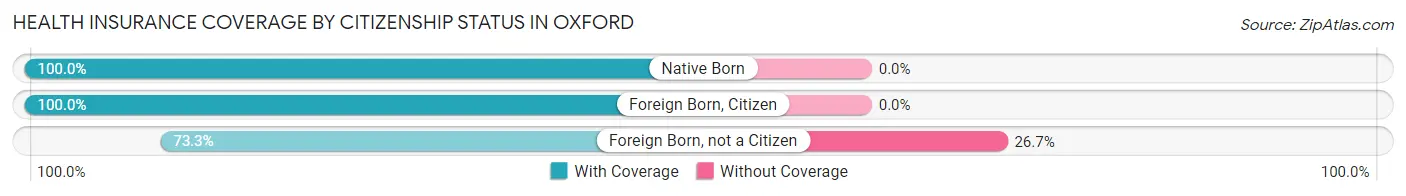
| Citizenship Status | With Coverage | Without Coverage |
| Native Born | 55 (100.0%) | 0 (0.0%) |
| Foreign Born, Citizen | 137 (100.0%) | 0 (0.0%) |
| Foreign Born, not a Citizen | 44 (73.3%) | 16 (26.7%) |
Health Insurance Coverage by Household Income in Oxford
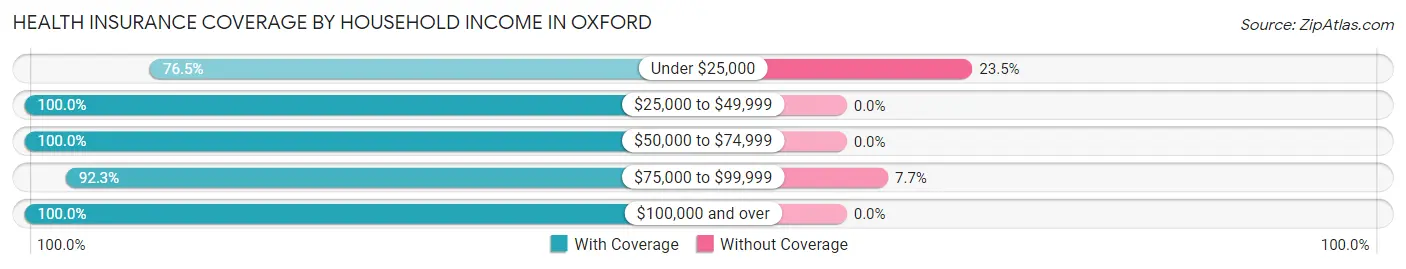
| Household Income | With Coverage | Without Coverage |
| Under $25,000 | 52 (76.5%) | 16 (23.5%) |
| $25,000 to $49,999 | 108 (100.0%) | 0 (0.0%) |
| $50,000 to $74,999 | 114 (100.0%) | 0 (0.0%) |
| $75,000 to $99,999 | 155 (92.3%) | 13 (7.7%) |
| $100,000 and over | 244 (100.0%) | 0 (0.0%) |
Public vs Private Health Insurance Coverage by Age in Oxford
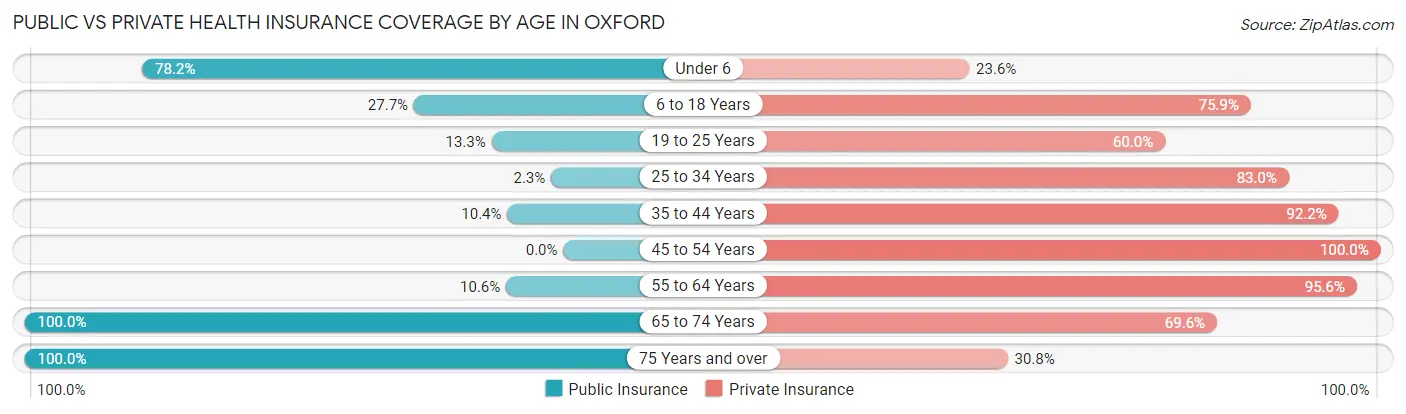
| Age Bracket | Public Insurance | Private Insurance |
| Under 6 | 43 (78.2%) | 13 (23.6%) |
| 6 to 18 Years | 38 (27.7%) | 104 (75.9%) |
| 19 to 25 Years | 8 (13.3%) | 36 (60.0%) |
| 25 to 34 Years | 2 (2.3%) | 73 (83.0%) |
| 35 to 44 Years | 8 (10.4%) | 71 (92.2%) |
| 45 to 54 Years | 0 (0.0%) | 54 (100.0%) |
| 55 to 64 Years | 12 (10.6%) | 108 (95.6%) |
| 65 to 74 Years | 79 (100.0%) | 55 (69.6%) |
| 75 Years and over | 39 (100.0%) | 12 (30.8%) |
| Total | 229 (32.6%) | 526 (74.9%) |
Disability Status by Sex by Age in Oxford
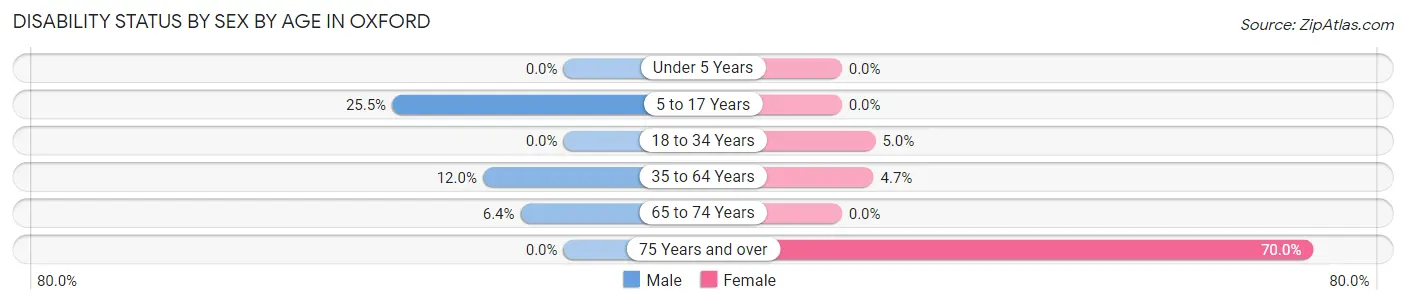
| Age Bracket | Male | Female |
| Under 5 Years | 0 (0.0%) | 0 (0.0%) |
| 5 to 17 Years | 14 (25.5%) | 0 (0.0%) |
| 18 to 34 Years | 0 (0.0%) | 4 (5.0%) |
| 35 to 64 Years | 14 (12.0%) | 6 (4.7%) |
| 65 to 74 Years | 3 (6.4%) | 0 (0.0%) |
| 75 Years and over | 0 (0.0%) | 21 (70.0%) |
Disability Class by Sex by Age in Oxford
Disability Class: Hearing Difficulty
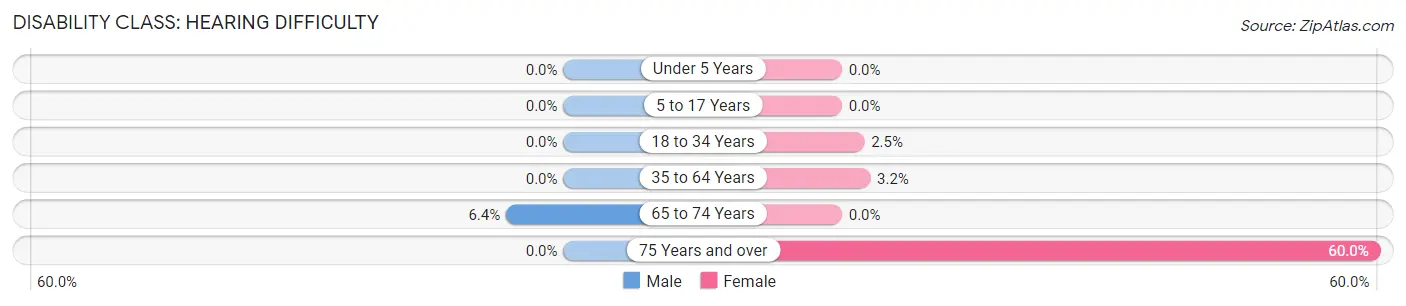
| Age Bracket | Male | Female |
| Under 5 Years | 0 (0.0%) | 0 (0.0%) |
| 5 to 17 Years | 0 (0.0%) | 0 (0.0%) |
| 18 to 34 Years | 0 (0.0%) | 2 (2.5%) |
| 35 to 64 Years | 0 (0.0%) | 4 (3.2%) |
| 65 to 74 Years | 3 (6.4%) | 0 (0.0%) |
| 75 Years and over | 0 (0.0%) | 18 (60.0%) |
Disability Class: Vision Difficulty
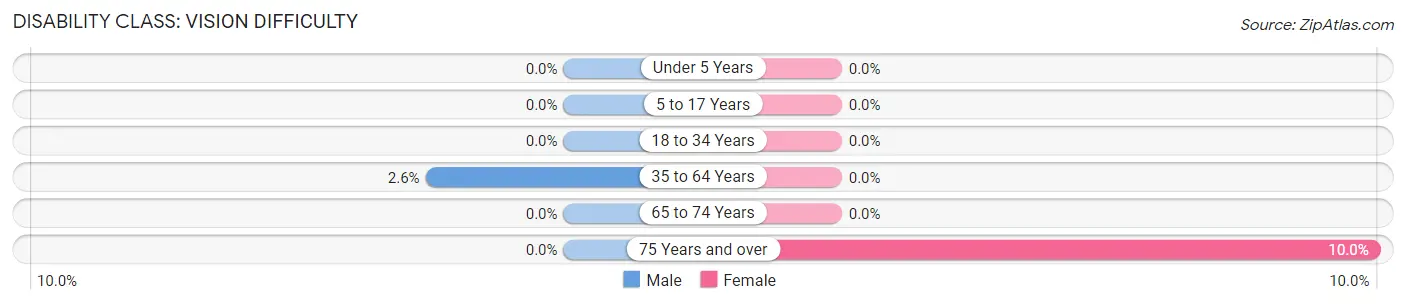
| Age Bracket | Male | Female |
| Under 5 Years | 0 (0.0%) | 0 (0.0%) |
| 5 to 17 Years | 0 (0.0%) | 0 (0.0%) |
| 18 to 34 Years | 0 (0.0%) | 0 (0.0%) |
| 35 to 64 Years | 3 (2.6%) | 0 (0.0%) |
| 65 to 74 Years | 0 (0.0%) | 0 (0.0%) |
| 75 Years and over | 0 (0.0%) | 3 (10.0%) |
Disability Class: Cognitive Difficulty
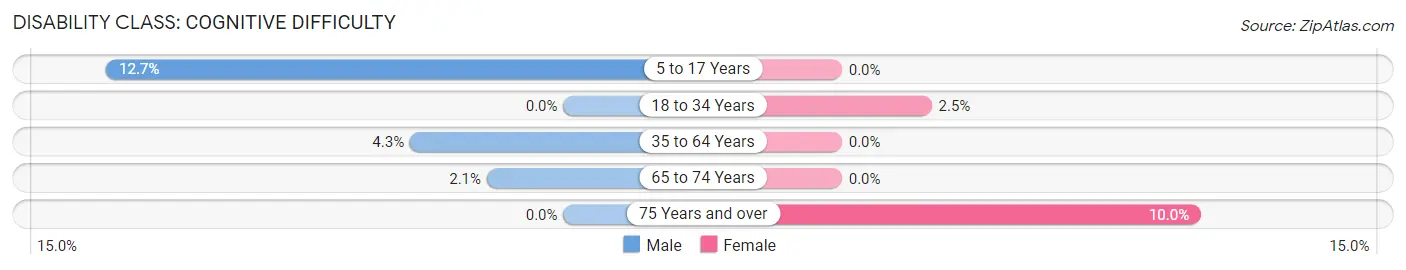
| Age Bracket | Male | Female |
| 5 to 17 Years | 7 (12.7%) | 0 (0.0%) |
| 18 to 34 Years | 0 (0.0%) | 2 (2.5%) |
| 35 to 64 Years | 5 (4.3%) | 0 (0.0%) |
| 65 to 74 Years | 1 (2.1%) | 0 (0.0%) |
| 75 Years and over | 0 (0.0%) | 3 (10.0%) |
Disability Class: Ambulatory Difficulty
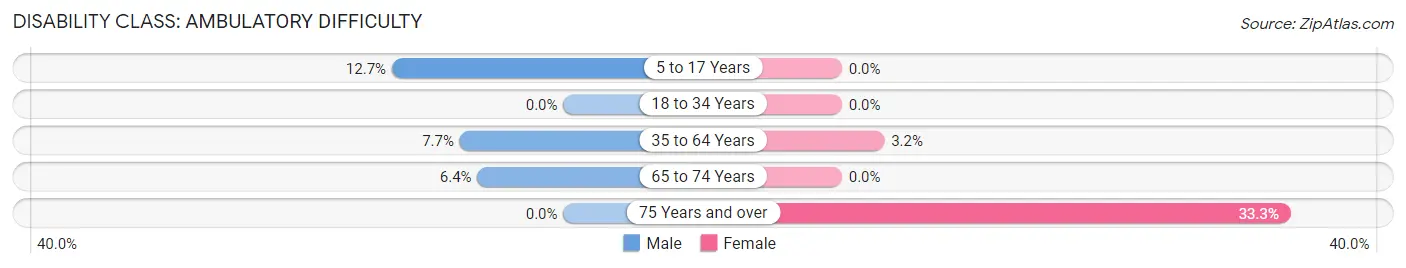
| Age Bracket | Male | Female |
| 5 to 17 Years | 7 (12.7%) | 0 (0.0%) |
| 18 to 34 Years | 0 (0.0%) | 0 (0.0%) |
| 35 to 64 Years | 9 (7.7%) | 4 (3.2%) |
| 65 to 74 Years | 3 (6.4%) | 0 (0.0%) |
| 75 Years and over | 0 (0.0%) | 10 (33.3%) |
Disability Class: Self-Care Difficulty
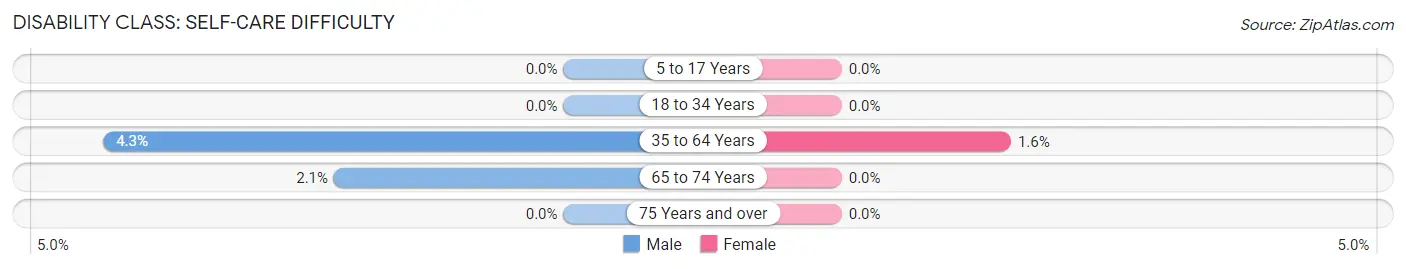
| Age Bracket | Male | Female |
| 5 to 17 Years | 0 (0.0%) | 0 (0.0%) |
| 18 to 34 Years | 0 (0.0%) | 0 (0.0%) |
| 35 to 64 Years | 5 (4.3%) | 2 (1.6%) |
| 65 to 74 Years | 1 (2.1%) | 0 (0.0%) |
| 75 Years and over | 0 (0.0%) | 0 (0.0%) |
Technology Access in Oxford
Computing Device Access in Oxford
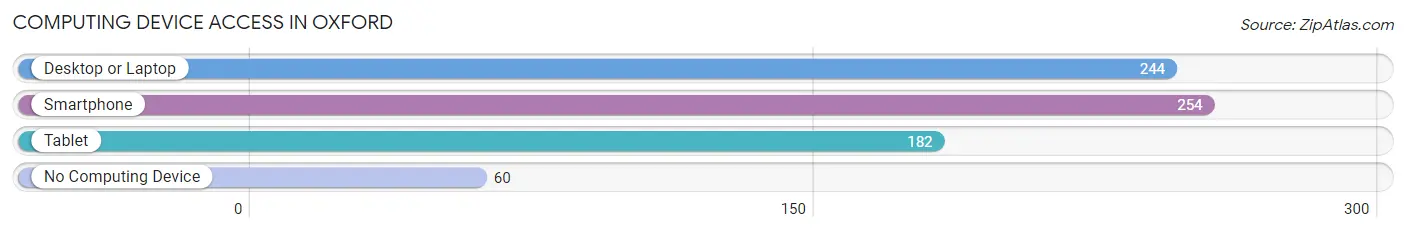
| Device Type | # Households | % Households |
| Desktop or Laptop | 244 | 74.4% |
| Smartphone | 254 | 77.4% |
| Tablet | 182 | 55.5% |
| No Computing Device | 60 | 18.3% |
| Total | 328 | 100.0% |
Internet Access in Oxford
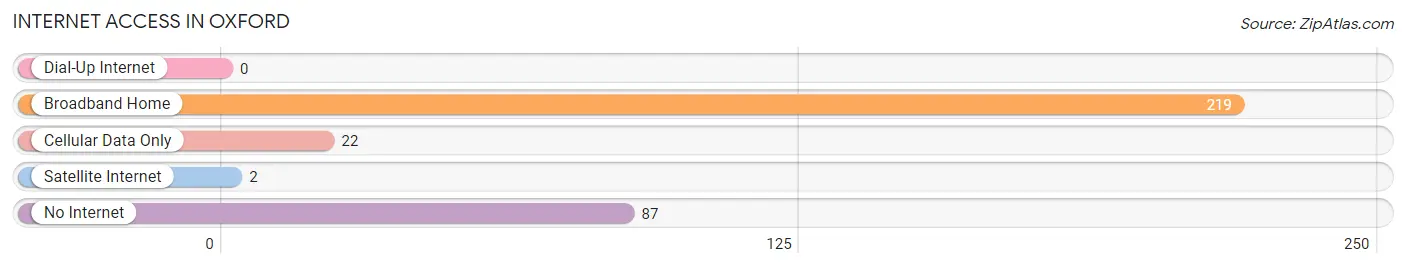
| Internet Type | # Households | % Households |
| Dial-Up Internet | 0 | 0.0% |
| Broadband Home | 219 | 66.8% |
| Cellular Data Only | 22 | 6.7% |
| Satellite Internet | 2 | 0.6% |
| No Internet | 87 | 26.5% |
| Total | 328 | 100.0% |
Oxford Summary
Oxford, Iowa is a small city located in Johnson County, Iowa. It is situated on the banks of the Iowa River and is part of the Iowa City metropolitan area. The city has a population of approximately 1,500 people and is known for its small-town charm and rural atmosphere.
Geography
Oxford is located in the rolling hills of eastern Iowa, approximately 20 miles east of Iowa City. The city is situated on the banks of the Iowa River, which provides a scenic backdrop to the city. The city is surrounded by farmland and is home to a variety of wildlife, including deer, wild turkeys, and bald eagles. The city is also home to a variety of parks and recreational areas, including the Oxford City Park, which features a playground, picnic area, and walking trails.
Economy
Oxford is a small city with a limited economy. The city is home to a variety of small businesses, including a grocery store, a hardware store, and a few restaurants. The city is also home to a number of manufacturing companies, including a furniture manufacturer and a plastics manufacturer. The city is also home to a number of agricultural businesses, including a dairy farm and a hog farm.
Demographics
As of the 2010 census, the population of Oxford was 1,500 people. The racial makeup of the city was 97.3% White, 0.7% African American, 0.3% Native American, 0.3% Asian, 0.3% from other races, and 1.3% from two or more races. The median household income in Oxford was $45,000, and the median family income was $50,000.
The city is home to a variety of religious denominations, including Catholic, Lutheran, Methodist, and Baptist. The city is also home to a variety of educational institutions, including a public elementary school, a public middle school, and a public high school.
Conclusion
Oxford, Iowa is a small city located in Johnson County, Iowa. It is situated on the banks of the Iowa River and is part of the Iowa City metropolitan area. The city has a population of approximately 1,500 people and is known for its small-town charm and rural atmosphere. The city is home to a variety of small businesses, manufacturing companies, and agricultural businesses. The city is also home to a variety of religious denominations and educational institutions.
Common Questions
What is the Total Population of Oxford?
Total Population of Oxford is 702.
What is the Total Male Population of Oxford?
Total Male Population of Oxford is 350.
What is the Total Female Population of Oxford?
Total Female Population of Oxford is 352.
What is the Ratio of Males per 100 Females in Oxford?
There are 99.43 Males per 100 Females in Oxford.
What is the Ratio of Females per 100 Males in Oxford?
There are 100.57 Females per 100 Males in Oxford.
What is the Median Population Age in Oxford?
Median Population Age in Oxford is 38.4 Years.
What is the Average Family Size in Oxford
Average Family Size in Oxford is 3.2 People.
What is the Average Household Size in Oxford
Average Household Size in Oxford is 2.1 People.
What is Per Capita Income in Oxford?
Per Capita income in Oxford is $40,739.
What is the Median Family Income in Oxford?
Median Family Income in Oxford is $91,250.
What is the Median Household income in Oxford?
Median Household Income in Oxford is $64,643.
What is Income or Wage Gap in Oxford?
Income or Wage Gap in Oxford is 19.7%.
Women in Oxford earn 80.3 cents for every dollar earned by a man.
What is Inequality or Gini Index in Oxford?
Inequality or Gini Index in Oxford is 0.46.
How Large is the Labor Force in Oxford?
There are 432 People in the Labor Forcein in Oxford.
What is the Percentage of People in the Labor Force in Oxford?
79.4% of People are in the Labor Force in Oxford.
What is the Unemployment Rate in Oxford?
Unemployment Rate in Oxford is 3.0%.