Winneshiek County, IA
Winneshiek County Map

Winneshiek County Overview
20,050
TOTAL POPULATION
10,072
MALE POPULATION
9,978
FEMALE POPULATION
100.94
MALES / 100 FEMALES
99.07
FEMALES / 100 MALES
42.6
MEDIAN AGE
2.7
AVG FAMILY SIZE
2.2
AVG HOUSEHOLD SIZE
$37,561
PER CAPITA INCOME
$88,023
AVG FAMILY INCOME
$67,770
AVG HOUSEHOLD INCOME
28.6%
WAGE / INCOME GAP [ % ]
71.4¢/ $1
WAGE / INCOME GAP [ $ ]
$6,287
FAMILY INCOME DEFICIT
0.44
INEQUALITY / GINI INDEX
11,179
LABOR FORCE [ PEOPLE ]
66.3%
PERCENT IN LABOR FORCE
2.1%
UNEMPLOYMENT RATE
Winneshiek County Area Codes
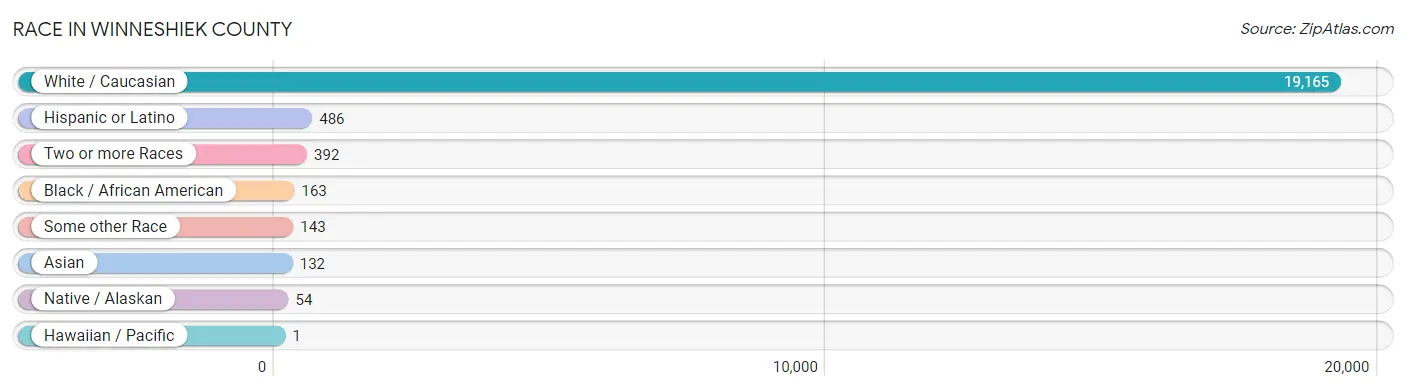
Race in Winneshiek County
The most populous races in Winneshiek County are White / Caucasian (19,165 | 95.6%), Hispanic or Latino (486 | 2.4%), and Two or more Races (392 | 2.0%).
| Race | # Population | % Population |
| Asian | 132 | 0.7% |
| Black / African American | 163 | 0.8% |
| Hawaiian / Pacific | 1 | 0.0% |
| Hispanic or Latino | 486 | 2.4% |
| Native / Alaskan | 54 | 0.3% |
| White / Caucasian | 19,165 | 95.6% |
| Two or more Races | 392 | 2.0% |
| Some other Race | 143 | 0.7% |
| Total | 20,050 | 100.0% |
Ancestry in Winneshiek County
The most populous ancestries reported in Winneshiek County are German (7,862 | 39.2%), Norwegian (4,958 | 24.7%), Irish (2,411 | 12.0%), Czech (1,597 | 8.0%), and English (1,492 | 7.4%), together accounting for 91.4% of all Winneshiek County residents.

| Ancestry | # Population | % Population |
| African | 7 | 0.0% |
| American | 806 | 4.0% |
| Arab | 11 | 0.1% |
| Armenian | 15 | 0.1% |
| Austrian | 10 | 0.1% |
| Belgian | 30 | 0.2% |
| Bhutanese | 12 | 0.1% |
| Blackfeet | 21 | 0.1% |
| British | 41 | 0.2% |
| Bulgarian | 12 | 0.1% |
| Burmese | 64 | 0.3% |
| Central American | 99 | 0.5% |
| Cherokee | 47 | 0.2% |
| Chickasaw | 54 | 0.3% |
| Colombian | 11 | 0.1% |
| Czech | 1,597 | 8.0% |
| Czechoslovakian | 31 | 0.2% |
| Danish | 308 | 1.5% |
| Dominican | 44 | 0.2% |
| Dutch | 170 | 0.9% |
| English | 1,492 | 7.4% |
| European | 203 | 1.0% |
| Finnish | 48 | 0.2% |
| French | 238 | 1.2% |
| French American Indian | 8 | 0.0% |
| French Canadian | 26 | 0.1% |
| German | 7,862 | 39.2% |
| Ghanaian | 11 | 0.1% |
| Greek | 14 | 0.1% |
| Guatemalan | 77 | 0.4% |
| Honduran | 13 | 0.1% |
| Hungarian | 7 | 0.0% |
| Indian (Asian) | 16 | 0.1% |
| Indonesian | 25 | 0.1% |
| Iranian | 4 | 0.0% |
| Irish | 2,411 | 12.0% |
| Italian | 158 | 0.8% |
| Korean | 48 | 0.2% |
| Laotian | 4 | 0.0% |
| Latvian | 5 | 0.0% |
| Lebanese | 5 | 0.0% |
| Lithuanian | 5 | 0.0% |
| Luxembourger | 8 | 0.0% |
| Malaysian | 8 | 0.0% |
| Maltese | 1 | 0.0% |
| Mexican | 271 | 1.3% |
| Northern European | 83 | 0.4% |
| Norwegian | 4,958 | 24.7% |
| Pakistani | 1 | 0.0% |
| Panamanian | 9 | 0.0% |
| Peruvian | 29 | 0.1% |
| Polish | 112 | 0.6% |
| Russian | 30 | 0.2% |
| Samoan | 3 | 0.0% |
| Scandinavian | 115 | 0.6% |
| Scotch-Irish | 122 | 0.6% |
| Scottish | 159 | 0.8% |
| South American | 40 | 0.2% |
| Spaniard | 14 | 0.1% |
| Spanish | 18 | 0.1% |
| Sri Lankan | 15 | 0.1% |
| Subsaharan African | 25 | 0.1% |
| Swedish | 364 | 1.8% |
| Swiss | 43 | 0.2% |
| Thai | 49 | 0.2% |
| Turkish | 11 | 0.1% |
| Ukrainian | 21 | 0.1% |
| Vietnamese | 1 | 0.0% |
| Welsh | 112 | 0.6% |
| Zimbabwean | 7 | 0.0% | View All 70 Rows |
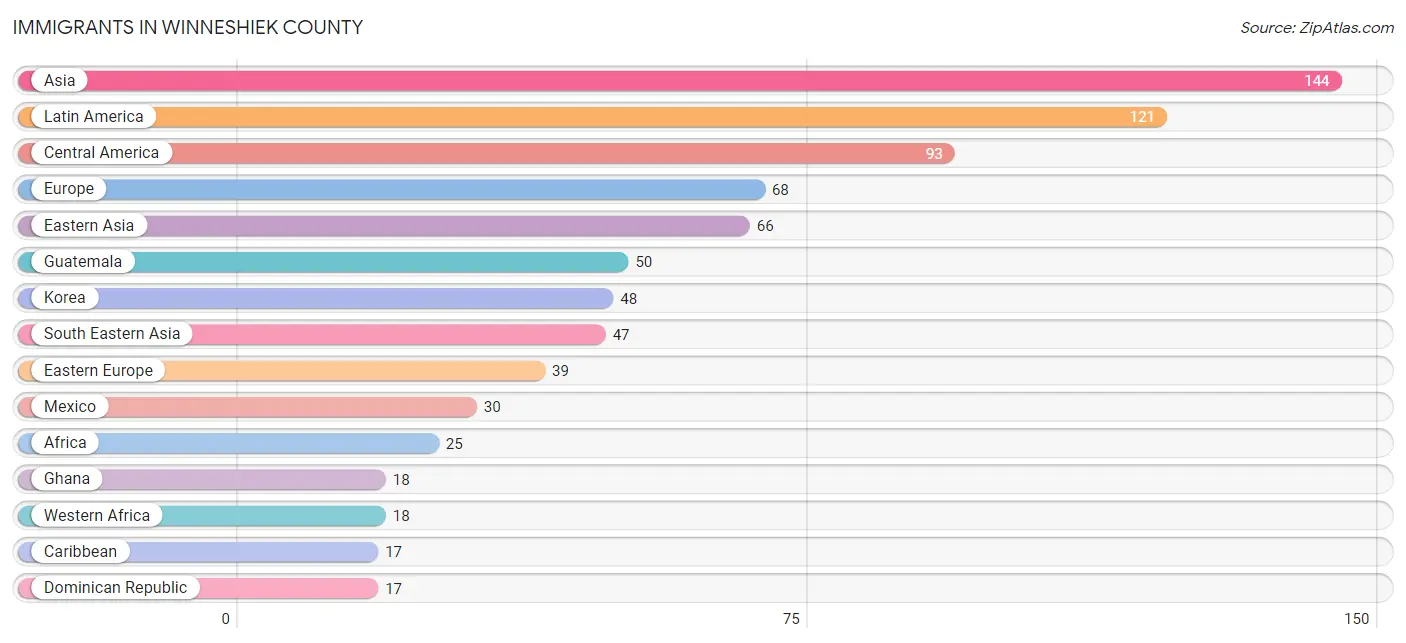
Immigrants in Winneshiek County
The most numerous immigrant groups reported in Winneshiek County came from Asia (144 | 0.7%), Latin America (121 | 0.6%), Central America (93 | 0.5%), Europe (68 | 0.3%), and Eastern Asia (66 | 0.3%), together accounting for 2.5% of all Winneshiek County residents.
| Immigration Origin | # Population | % Population |
| Africa | 25 | 0.1% |
| Asia | 144 | 0.7% |
| Bangladesh | 1 | 0.0% |
| Canada | 16 | 0.1% |
| Caribbean | 17 | 0.1% |
| Central America | 93 | 0.5% |
| China | 6 | 0.0% |
| Colombia | 11 | 0.1% |
| Dominican Republic | 17 | 0.1% |
| Eastern Africa | 7 | 0.0% |
| Eastern Asia | 66 | 0.3% |
| Eastern Europe | 39 | 0.2% |
| Europe | 68 | 0.3% |
| Germany | 15 | 0.1% |
| Ghana | 18 | 0.1% |
| Guatemala | 50 | 0.3% |
| Honduras | 13 | 0.1% |
| India | 2 | 0.0% |
| Ireland | 6 | 0.0% |
| Japan | 12 | 0.1% |
| Korea | 48 | 0.2% |
| Latin America | 121 | 0.6% |
| Lebanon | 5 | 0.0% |
| Mexico | 30 | 0.2% |
| Nepal | 8 | 0.0% |
| Northern Europe | 6 | 0.0% |
| Philippines | 2 | 0.0% |
| Russia | 16 | 0.1% |
| South America | 11 | 0.1% |
| South Central Asia | 15 | 0.1% |
| South Eastern Asia | 47 | 0.2% |
| Southern Europe | 8 | 0.0% |
| Spain | 8 | 0.0% |
| Taiwan | 1 | 0.0% |
| Thailand | 1 | 0.0% |
| Turkey | 11 | 0.1% |
| Ukraine | 16 | 0.1% |
| Vietnam | 15 | 0.1% |
| Western Africa | 18 | 0.1% |
| Western Asia | 16 | 0.1% |
| Western Europe | 15 | 0.1% |
| Zimbabwe | 7 | 0.0% | View All 42 Rows |
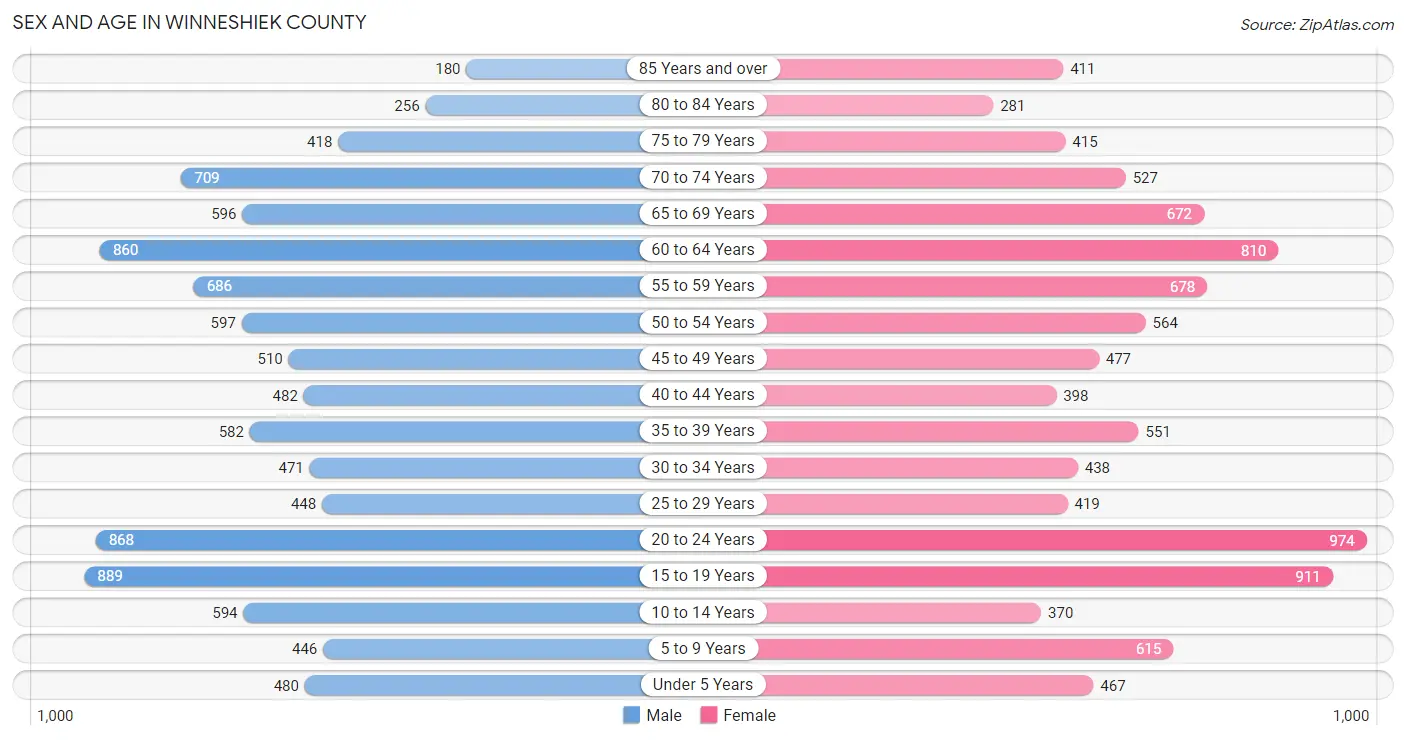
Sex and Age in Winneshiek County
Sex and Age in Winneshiek County
The most populous age groups in Winneshiek County are 15 to 19 Years (889 | 8.8%) for men and 20 to 24 Years (974 | 9.8%) for women.
| Age Bracket | Male | Female |
| Under 5 Years | 480 (4.8%) | 467 (4.7%) |
| 5 to 9 Years | 446 (4.4%) | 615 (6.2%) |
| 10 to 14 Years | 594 (5.9%) | 370 (3.7%) |
| 15 to 19 Years | 889 (8.8%) | 911 (9.1%) |
| 20 to 24 Years | 868 (8.6%) | 974 (9.8%) |
| 25 to 29 Years | 448 (4.4%) | 419 (4.2%) |
| 30 to 34 Years | 471 (4.7%) | 438 (4.4%) |
| 35 to 39 Years | 582 (5.8%) | 551 (5.5%) |
| 40 to 44 Years | 482 (4.8%) | 398 (4.0%) |
| 45 to 49 Years | 510 (5.1%) | 477 (4.8%) |
| 50 to 54 Years | 597 (5.9%) | 564 (5.7%) |
| 55 to 59 Years | 686 (6.8%) | 678 (6.8%) |
| 60 to 64 Years | 860 (8.5%) | 810 (8.1%) |
| 65 to 69 Years | 596 (5.9%) | 672 (6.7%) |
| 70 to 74 Years | 709 (7.0%) | 527 (5.3%) |
| 75 to 79 Years | 418 (4.2%) | 415 (4.2%) |
| 80 to 84 Years | 256 (2.5%) | 281 (2.8%) |
| 85 Years and over | 180 (1.8%) | 411 (4.1%) |
| Total | 10,072 (100.0%) | 9,978 (100.0%) |
Families and Households in Winneshiek County
Median Family Size in Winneshiek County
The median family size in Winneshiek County is 2.74 persons per family, with married-couple families (4,526 | 86.2%) accounting for the largest median family size of 2.79 persons per family. On the other hand, single male/father families (215 | 4.1%) represent the smallest median family size with 2.20 persons per family.

| Family Type | # Families | Family Size |
| Married-Couple | 4,526 (86.2%) | 2.79 |
| Single Male/Father | 215 (4.1%) | 2.20 |
| Single Female/Mother | 509 (9.7%) | 2.51 |
| Total Families | 5,250 (100.0%) | 2.74 |
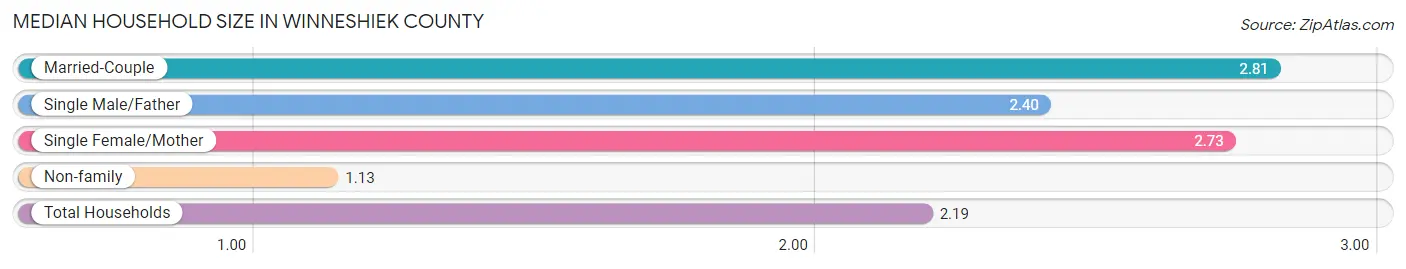
Median Household Size in Winneshiek County
The median household size in Winneshiek County is 2.19 persons per household, with married-couple households (4,526 | 55.1%) accounting for the largest median household size of 2.81 persons per household. non-family households (2,968 | 36.1%) represent the smallest median household size with 1.13 persons per household.
| Household Type | # Households | Household Size |
| Married-Couple | 4,526 (55.1%) | 2.81 |
| Single Male/Father | 215 (2.6%) | 2.40 |
| Single Female/Mother | 509 (6.2%) | 2.73 |
| Non-family | 2,968 (36.1%) | 1.13 |
| Total Households | 8,218 (100.0%) | 2.19 |
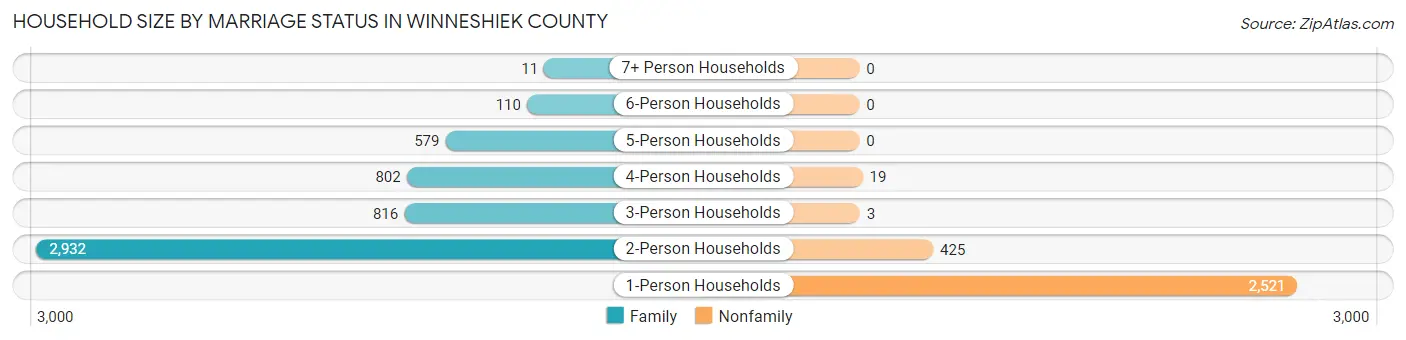
Household Size by Marriage Status in Winneshiek County
Out of a total of 8,218 households in Winneshiek County, 5,250 (63.9%) are family households, while 2,968 (36.1%) are nonfamily households. The most numerous type of family households are 2-person households, comprising 2,932, and the most common type of nonfamily households are 1-person households, comprising 2,521.
| Household Size | Family Households | Nonfamily Households |
| 1-Person Households | - | 2,521 (30.7%) |
| 2-Person Households | 2,932 (35.7%) | 425 (5.2%) |
| 3-Person Households | 816 (9.9%) | 3 (0.0%) |
| 4-Person Households | 802 (9.8%) | 19 (0.2%) |
| 5-Person Households | 579 (7.0%) | 0 (0.0%) |
| 6-Person Households | 110 (1.3%) | 0 (0.0%) |
| 7+ Person Households | 11 (0.1%) | 0 (0.0%) |
| Total | 5,250 (63.9%) | 2,968 (36.1%) |
Female Fertility in Winneshiek County
Fertility by Age in Winneshiek County
Average fertility rate in Winneshiek County is 61.0 births per 1,000 women. Women in the age bracket of 20 to 34 years have the highest fertility rate with 129.0 births per 1,000 women. Women in the age bracket of 20 to 34 years acount for 89.8% of all women with births.

| Age Bracket | Women with Births | Births / 1,000 Women |
| 15 to 19 years | 0 (0.0%) | 0.0 |
| 20 to 34 years | 237 (89.8%) | 129.0 |
| 35 to 50 years | 27 (10.2%) | 17.0 |
| Total | 264 (100.0%) | 61.0 |
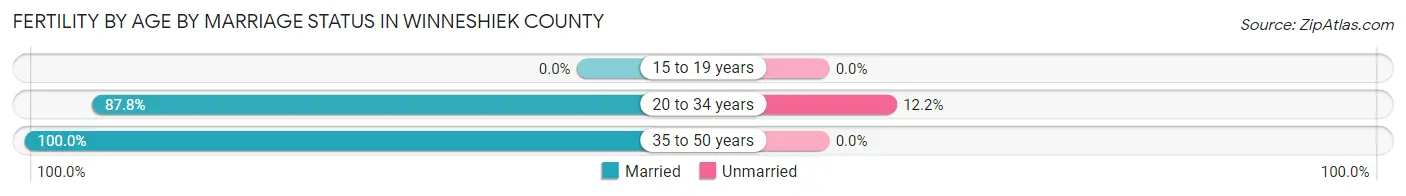
Fertility by Age by Marriage Status in Winneshiek County
89.0% of women with births (264) in Winneshiek County are married. The highest percentage of unmarried women with births falls into 20 to 34 years age bracket with 12.2% of them unmarried at the time of birth, while the lowest percentage of unmarried women with births belong to 35 to 50 years age bracket with 0.0% of them unmarried.
| Age Bracket | Married | Unmarried |
| 15 to 19 years | 0 (0.0%) | 0 (0.0%) |
| 20 to 34 years | 208 (87.8%) | 29 (12.2%) |
| 35 to 50 years | 27 (100.0%) | 0 (0.0%) |
| Total | 235 (89.0%) | 29 (11.0%) |
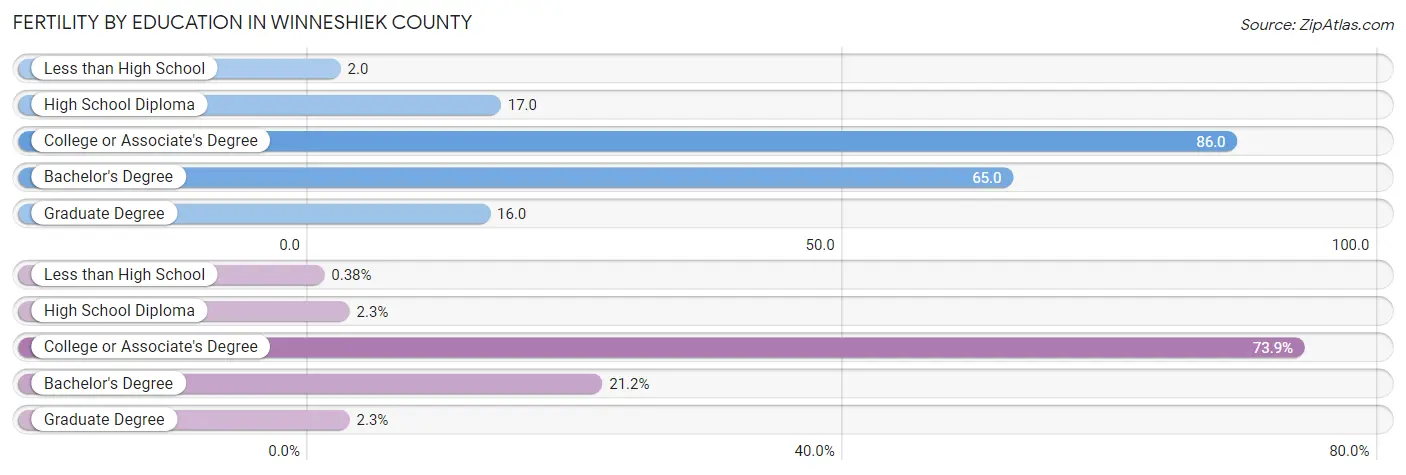
Fertility by Education in Winneshiek County
Average fertility rate in Winneshiek County is 61.0 births per 1,000 women. Women with the education attainment of college or associate's degree have the highest fertility rate of 86.0 births per 1,000 women, while women with the education attainment of less than high school have the lowest fertility at 2.0 births per 1,000 women. Women with the education attainment of college or associate's degree represent 73.9% of all women with births.
| Educational Attainment | Women with Births | Births / 1,000 Women |
| Less than High School | 1 (0.4%) | 2.0 |
| High School Diploma | 6 (2.3%) | 17.0 |
| College or Associate's Degree | 195 (73.9%) | 86.0 |
| Bachelor's Degree | 56 (21.2%) | 65.0 |
| Graduate Degree | 6 (2.3%) | 16.0 |
| Total | 264 (100.0%) | 61.0 |
Fertility by Education by Marriage Status in Winneshiek County
11.0% of women with births in Winneshiek County are unmarried. Women with the educational attainment of less than high school are most likely to be married with 100.0% of them married at childbirth, while women with the educational attainment of college or associate's degree are least likely to be married with 14.9% of them unmarried at childbirth.

| Educational Attainment | Married | Unmarried |
| Less than High School | 1 (100.0%) | 0 (0.0%) |
| High School Diploma | 6 (100.0%) | 0 (0.0%) |
| College or Associate's Degree | 166 (85.1%) | 29 (14.9%) |
| Bachelor's Degree | 56 (100.0%) | 0 (0.0%) |
| Graduate Degree | 6 (100.0%) | 0 (0.0%) |
| Total | 235 (89.0%) | 29 (11.0%) |
Income in Winneshiek County
Income Overview in Winneshiek County
Per Capita Income in Winneshiek County is $37,561, while median incomes of families and households are $88,023 and $67,770 respectively.
| Characteristic | Number | Measure |
| Per Capita Income | 20,050 | $37,561 |
| Median Family Income | 5,250 | $88,023 |
| Mean Family Income | 5,250 | $110,165 |
| Median Household Income | 8,218 | $67,770 |
| Mean Household Income | 8,218 | $90,134 |
| Income Deficit | 5,250 | $6,287 |
| Wage / Income Gap (%) | 20,050 | 28.56% |
| Wage / Income Gap ($) | 20,050 | 71.44¢ per $1 |
| Gini / Inequality Index | 20,050 | 0.44 |
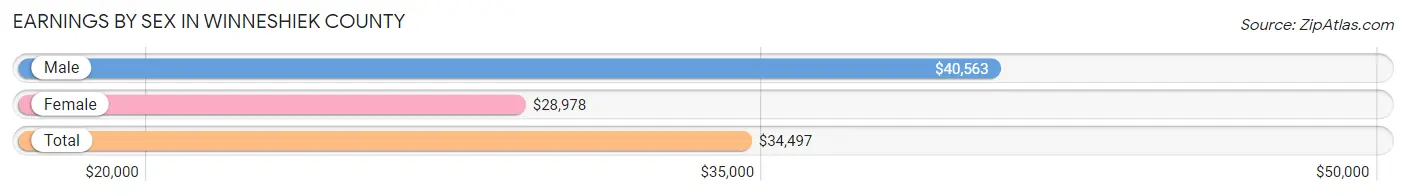
Earnings by Sex in Winneshiek County
Average Earnings in Winneshiek County are $34,497, $40,563 for men and $28,978 for women, a difference of 28.6%.
| Sex | Number | Average Earnings |
| Male | 6,285 (50.8%) | $40,563 |
| Female | 6,076 (49.1%) | $28,978 |
| Total | 12,361 (100.0%) | $34,497 |
Earnings by Sex by Income Bracket in Winneshiek County
The most common earnings brackets in Winneshiek County are $55,000 to $64,999 for men (604 | 9.6%) and $2,499 or less for women (621 | 10.2%).

| Income | Male | Female |
| $2,499 or less | 391 (6.2%) | 621 (10.2%) |
| $2,500 to $4,999 | 332 (5.3%) | 588 (9.7%) |
| $5,000 to $7,499 | 331 (5.3%) | 301 (5.0%) |
| $7,500 to $9,999 | 214 (3.4%) | 314 (5.2%) |
| $10,000 to $12,499 | 246 (3.9%) | 216 (3.5%) |
| $12,500 to $14,999 | 85 (1.3%) | 148 (2.4%) |
| $15,000 to $17,499 | 161 (2.6%) | 143 (2.4%) |
| $17,500 to $19,999 | 79 (1.3%) | 161 (2.6%) |
| $20,000 to $22,499 | 131 (2.1%) | 55 (0.9%) |
| $22,500 to $24,999 | 188 (3.0%) | 264 (4.3%) |
| $25,000 to $29,999 | 285 (4.5%) | 301 (5.0%) |
| $30,000 to $34,999 | 410 (6.5%) | 296 (4.9%) |
| $35,000 to $39,999 | 276 (4.4%) | 499 (8.2%) |
| $40,000 to $44,999 | 245 (3.9%) | 301 (5.0%) |
| $45,000 to $49,999 | 415 (6.6%) | 298 (4.9%) |
| $50,000 to $54,999 | 375 (6.0%) | 489 (8.1%) |
| $55,000 to $64,999 | 604 (9.6%) | 287 (4.7%) |
| $65,000 to $74,999 | 338 (5.4%) | 258 (4.3%) |
| $75,000 to $99,999 | 576 (9.2%) | 370 (6.1%) |
| $100,000+ | 603 (9.6%) | 166 (2.7%) |
| Total | 6,285 (100.0%) | 6,076 (100.0%) |
Earnings by Sex by Educational Attainment in Winneshiek County
Average earnings in Winneshiek County are $48,085 for men and $39,189 for women, a difference of 18.5%. Men with an educational attainment of graduate degree enjoy the highest average annual earnings of $76,068, while those with less than high school education earn the least with $37,813. Women with an educational attainment of graduate degree earn the most with the average annual earnings of $64,022, while those with high school diploma education have the smallest earnings of $29,481.
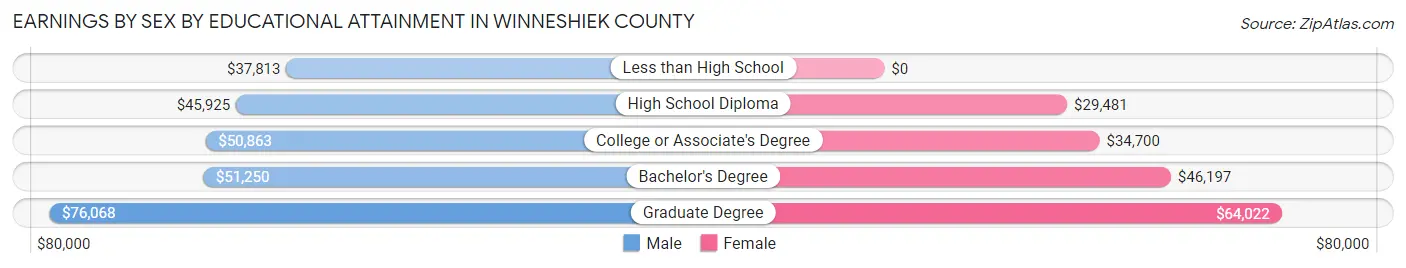
| Educational Attainment | Male Income | Female Income |
| Less than High School | $37,813 | $0 |
| High School Diploma | $45,925 | $29,481 |
| College or Associate's Degree | $50,863 | $34,700 |
| Bachelor's Degree | $51,250 | $46,197 |
| Graduate Degree | $76,068 | $64,022 |
| Total | $48,085 | $39,189 |
Family Income in Winneshiek County
Family Income Brackets in Winneshiek County
According to the Winneshiek County family income data, there are 1,307 families falling into the $100,000 to $149,999 income range, which is the most common income bracket and makes up 24.9% of all families. Conversely, the $10,000 to $14,999 income bracket is the least frequent group with only 42 families (0.8%) belonging to this category.
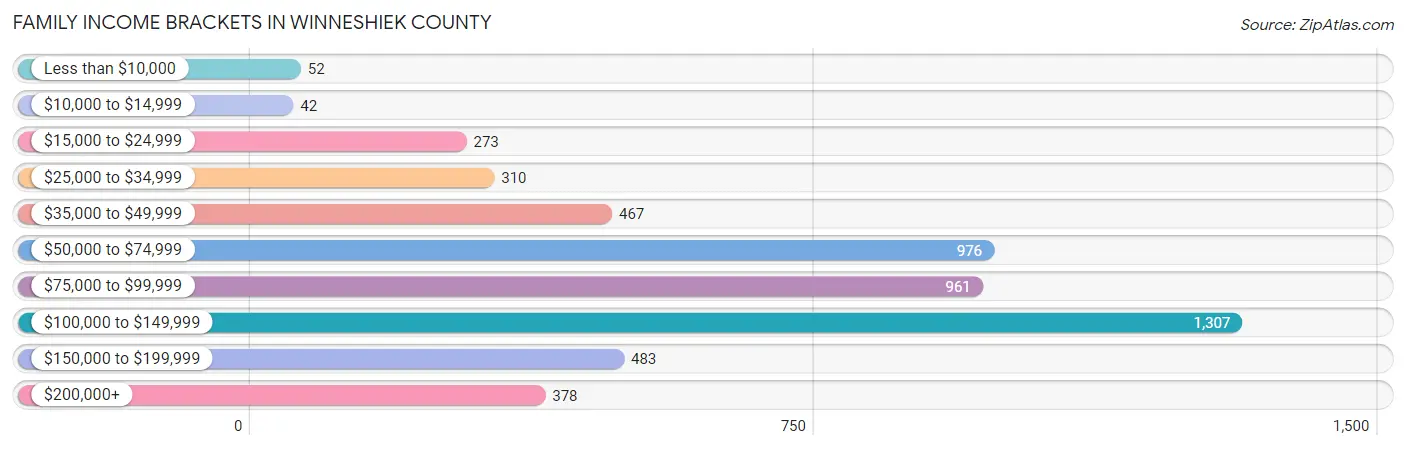
| Income Bracket | # Families | % Families |
| Less than $10,000 | 52 | 1.0% |
| $10,000 to $14,999 | 42 | 0.8% |
| $15,000 to $24,999 | 273 | 5.2% |
| $25,000 to $34,999 | 310 | 5.9% |
| $35,000 to $49,999 | 467 | 8.9% |
| $50,000 to $74,999 | 976 | 18.6% |
| $75,000 to $99,999 | 961 | 18.3% |
| $100,000 to $149,999 | 1,307 | 24.9% |
| $150,000 to $199,999 | 483 | 9.2% |
| $200,000+ | 378 | 7.2% |
Family Income by Famaliy Size in Winneshiek County
5-person families (565 | 10.8%) account for the highest median family income in Winneshiek County with $104,325 per family, while 2-person families (3,044 | 58.0%) have the highest median income of $39,190 per family member.
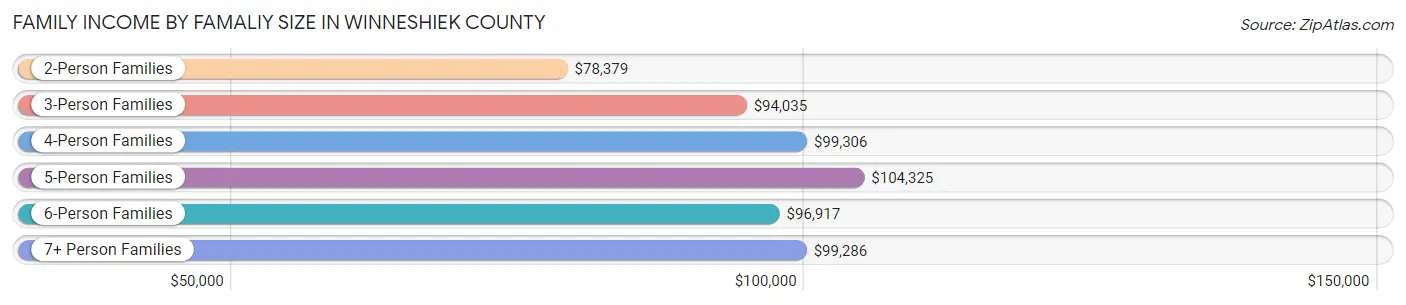
| Income Bracket | # Families | Median Income |
| 2-Person Families | 3,044 (58.0%) | $78,379 |
| 3-Person Families | 795 (15.1%) | $94,035 |
| 4-Person Families | 755 (14.4%) | $99,306 |
| 5-Person Families | 565 (10.8%) | $104,325 |
| 6-Person Families | 81 (1.5%) | $96,917 |
| 7+ Person Families | 10 (0.2%) | $99,286 |
| Total | 5,250 (100.0%) | $88,023 |
Family Income by Number of Earners in Winneshiek County
The median family income in Winneshiek County is $88,023, with families comprising 3+ earners (527) having the highest median family income of $132,679, while families with no earners (812) have the lowest median family income of $62,143, accounting for 10.0% and 15.5% of families, respectively.
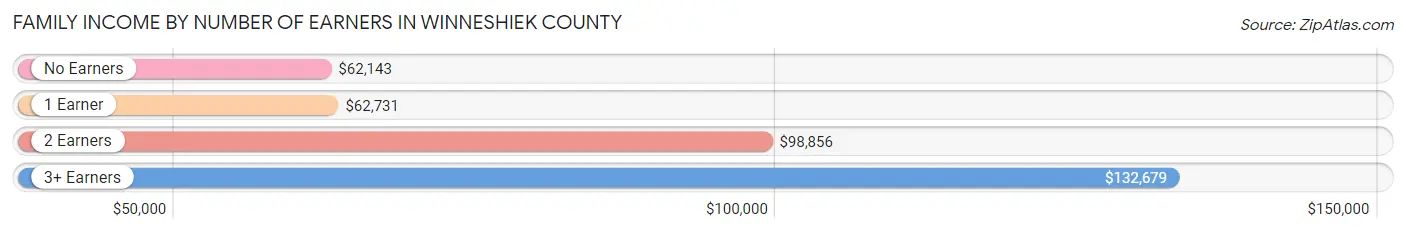
| Number of Earners | # Families | Median Income |
| No Earners | 812 (15.5%) | $62,143 |
| 1 Earner | 1,152 (21.9%) | $62,731 |
| 2 Earners | 2,759 (52.5%) | $98,856 |
| 3+ Earners | 527 (10.0%) | $132,679 |
| Total | 5,250 (100.0%) | $88,023 |
Household Income in Winneshiek County
Household Income Brackets in Winneshiek County
With 1,545 households falling in the category, the $50,000 to $74,999 income range is the most frequent in Winneshiek County, accounting for 18.8% of all households. In contrast, only 214 households (2.6%) fall into the $10,000 to $14,999 income bracket, making it the least populous group.

| Income Bracket | # Households | % Households |
| Less than $10,000 | 288 | 3.5% |
| $10,000 to $14,999 | 214 | 2.6% |
| $15,000 to $24,999 | 608 | 7.4% |
| $25,000 to $34,999 | 715 | 8.7% |
| $35,000 to $49,999 | 1,035 | 12.6% |
| $50,000 to $74,999 | 1,545 | 18.8% |
| $75,000 to $99,999 | 1,323 | 16.1% |
| $100,000 to $149,999 | 1,504 | 18.3% |
| $150,000 to $199,999 | 510 | 6.2% |
| $200,000+ | 477 | 5.8% |
Household Income by Householder Age in Winneshiek County
The median household income in Winneshiek County is $67,770, with the highest median household income of $87,171 found in the 25 to 44 years age bracket for the primary householder. A total of 2,159 households (26.3%) fall into this category. Meanwhile, the 15 to 24 years age bracket for the primary householder has the lowest median household income of $36,971, with 259 households (3.2%) in this group.
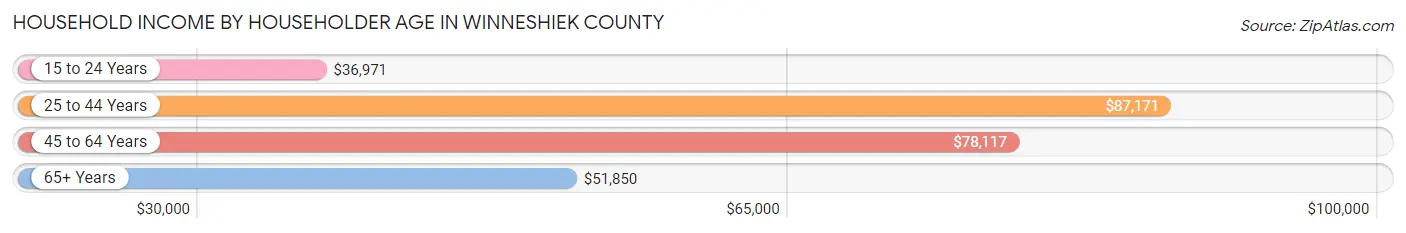
| Income Bracket | # Households | Median Income |
| 15 to 24 Years | 259 (3.2%) | $36,971 |
| 25 to 44 Years | 2,159 (26.3%) | $87,171 |
| 45 to 64 Years | 3,020 (36.7%) | $78,117 |
| 65+ Years | 2,780 (33.8%) | $51,850 |
| Total | 8,218 (100.0%) | $67,770 |
Poverty in Winneshiek County
Income Below Poverty by Sex and Age in Winneshiek County
With 7.7% poverty level for males and 10.2% for females among the residents of Winneshiek County, 5 year old males and 5 year old females are the most vulnerable to poverty, with 47 males (43.9%) and 27 females (40.9%) in their respective age groups living below the poverty level.
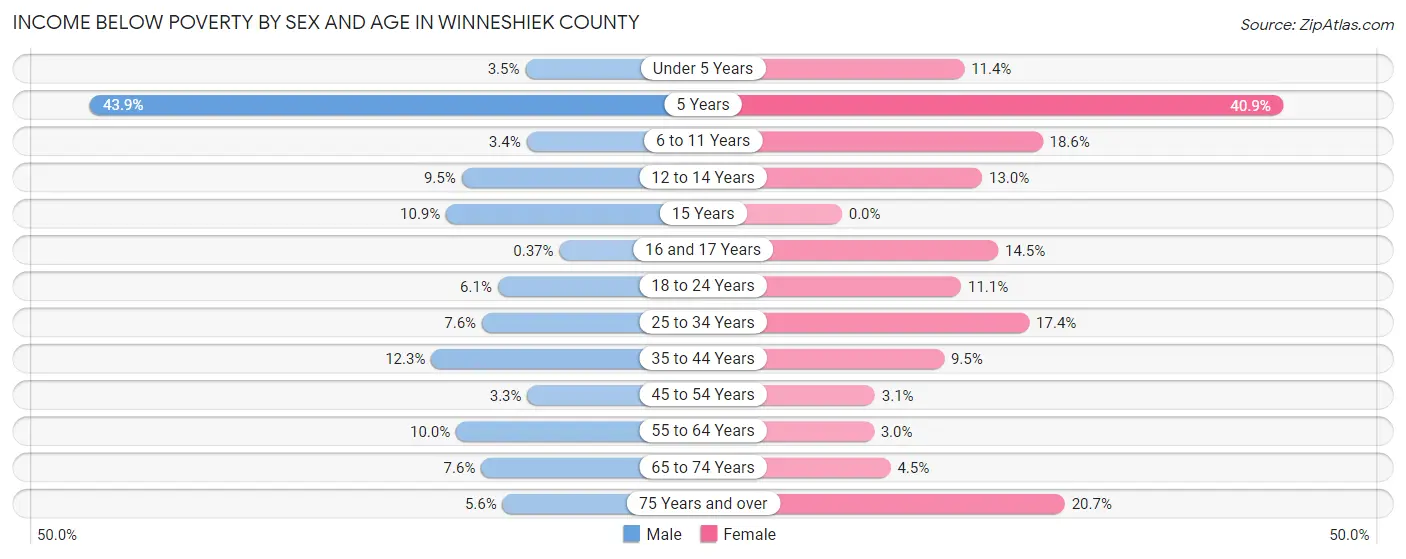
| Age Bracket | Male | Female |
| Under 5 Years | 16 (3.5%) | 50 (11.4%) |
| 5 Years | 47 (43.9%) | 27 (40.9%) |
| 6 to 11 Years | 17 (3.4%) | 125 (18.6%) |
| 12 to 14 Years | 41 (9.5%) | 28 (13.0%) |
| 15 Years | 16 (10.9%) | 0 (0.0%) |
| 16 and 17 Years | 1 (0.4%) | 39 (14.5%) |
| 18 to 24 Years | 31 (6.1%) | 63 (11.1%) |
| 25 to 34 Years | 69 (7.6%) | 149 (17.4%) |
| 35 to 44 Years | 130 (12.3%) | 90 (9.5%) |
| 45 to 54 Years | 37 (3.3%) | 32 (3.1%) |
| 55 to 64 Years | 154 (10.0%) | 44 (3.0%) |
| 65 to 74 Years | 99 (7.6%) | 54 (4.5%) |
| 75 Years and over | 45 (5.6%) | 197 (20.7%) |
| Total | 703 (7.7%) | 898 (10.2%) |
Income Above Poverty by Sex and Age in Winneshiek County
According to the poverty statistics in Winneshiek County, males aged 16 and 17 years and females aged 15 years are the age groups that are most secure financially, with 99.6% of males and 100.0% of females in these age groups living above the poverty line.
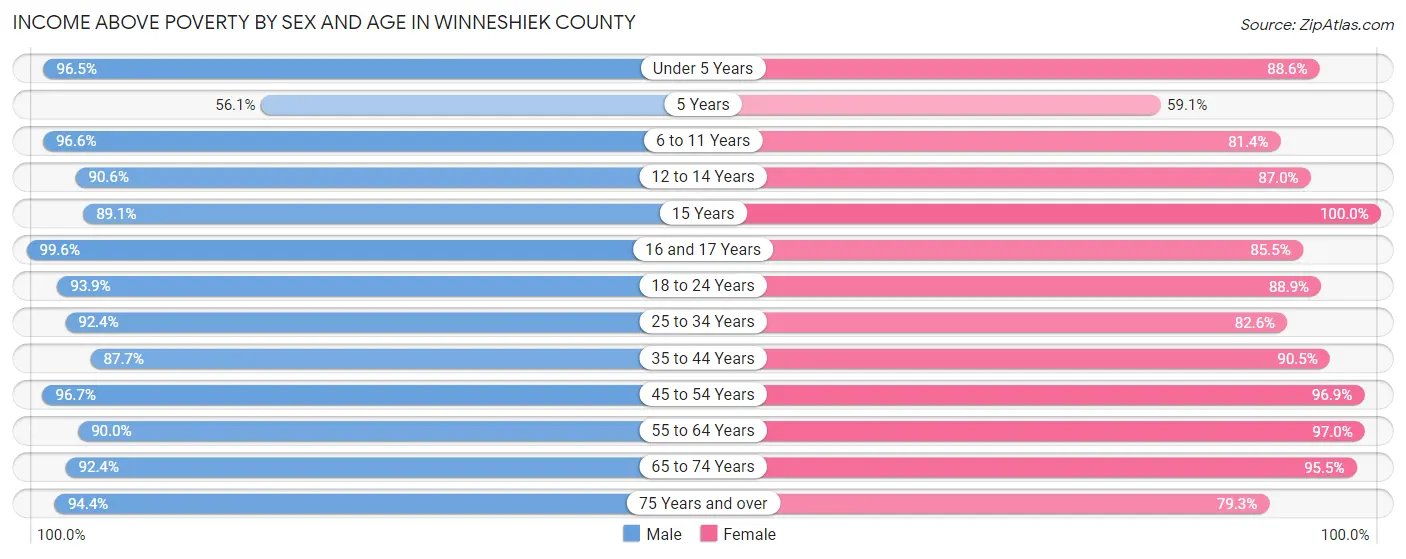
| Age Bracket | Male | Female |
| Under 5 Years | 437 (96.5%) | 390 (88.6%) |
| 5 Years | 60 (56.1%) | 39 (59.1%) |
| 6 to 11 Years | 480 (96.6%) | 546 (81.4%) |
| 12 to 14 Years | 393 (90.5%) | 187 (87.0%) |
| 15 Years | 131 (89.1%) | 69 (100.0%) |
| 16 and 17 Years | 266 (99.6%) | 230 (85.5%) |
| 18 to 24 Years | 478 (93.9%) | 506 (88.9%) |
| 25 to 34 Years | 844 (92.4%) | 708 (82.6%) |
| 35 to 44 Years | 930 (87.7%) | 859 (90.5%) |
| 45 to 54 Years | 1,070 (96.7%) | 1,009 (96.9%) |
| 55 to 64 Years | 1,392 (90.0%) | 1,444 (97.0%) |
| 65 to 74 Years | 1,201 (92.4%) | 1,142 (95.5%) |
| 75 Years and over | 753 (94.4%) | 755 (79.3%) |
| Total | 8,435 (92.3%) | 7,884 (89.8%) |
Income Below Poverty Among Married-Couple Families in Winneshiek County
The poverty statistics for married-couple families in Winneshiek County show that 5.0% or 228 of the total 4,526 families live below the poverty line. Families with 3 or 4 children have the highest poverty rate of 8.7%, comprising of 49 families. On the other hand, families with no children have the lowest poverty rate of 3.8%, which includes 110 families.
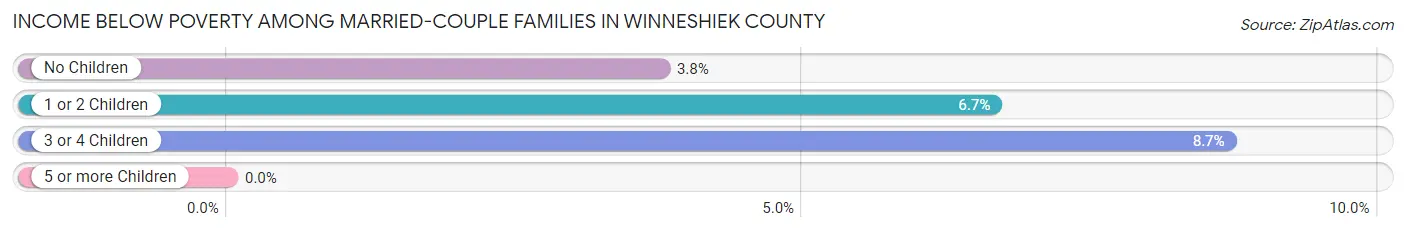
| Children | Above Poverty | Below Poverty |
| No Children | 2,815 (96.2%) | 110 (3.8%) |
| 1 or 2 Children | 968 (93.3%) | 69 (6.7%) |
| 3 or 4 Children | 515 (91.3%) | 49 (8.7%) |
| 5 or more Children | 0 (0.0%) | 0 (0.0%) |
| Total | 4,298 (95.0%) | 228 (5.0%) |
Income Below Poverty Among Single-Parent Households in Winneshiek County
According to the poverty data in Winneshiek County, 8.4% or 18 single-father households and 16.7% or 85 single-mother households are living below the poverty line. Among single-father households, those with 1 or 2 children have the highest poverty rate, with 11 households (11.8%) experiencing poverty. Likewise, among single-mother households, those with 3 or 4 children have the highest poverty rate, with 30 households (78.9%) falling below the poverty line.

| Children | Single Father | Single Mother |
| No Children | 7 (7.5%) | 24 (14.0%) |
| 1 or 2 Children | 11 (11.8%) | 30 (10.1%) |
| 3 or 4 Children | 0 (0.0%) | 30 (78.9%) |
| 5 or more Children | 0 (0.0%) | 1 (50.0%) |
| Total | 18 (8.4%) | 85 (16.7%) |
Income Below Poverty Among Married-Couple vs Single-Parent Households in Winneshiek County
The poverty data for Winneshiek County shows that 228 of the married-couple family households (5.0%) and 103 of the single-parent households (14.2%) are living below the poverty level. Within the married-couple family households, those with 3 or 4 children have the highest poverty rate, with 49 households (8.7%) falling below the poverty line. Among the single-parent households, those with 5 or more children have the highest poverty rate, with 1 household (50.0%) living below poverty.
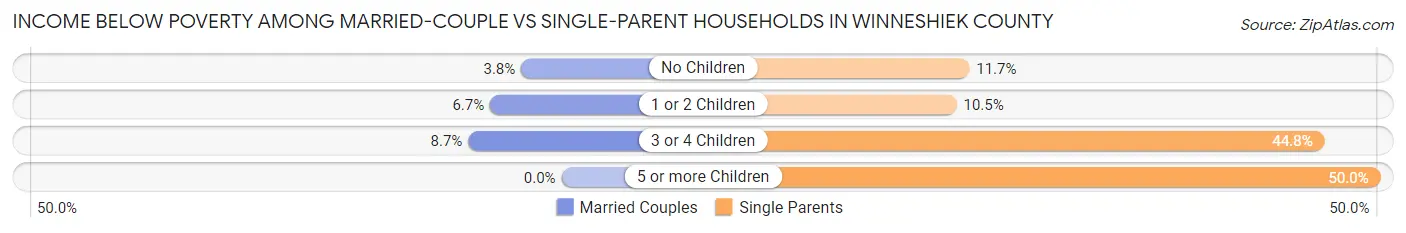
| Children | Married-Couple Families | Single-Parent Households |
| No Children | 110 (3.8%) | 31 (11.7%) |
| 1 or 2 Children | 69 (6.7%) | 41 (10.5%) |
| 3 or 4 Children | 49 (8.7%) | 30 (44.8%) |
| 5 or more Children | 0 (0.0%) | 1 (50.0%) |
| Total | 228 (5.0%) | 103 (14.2%) |
Employment Characteristics in Winneshiek County
Employment by Class of Employer in Winneshiek County
Among the 10,797 employed individuals in Winneshiek County, private company employees (6,159 | 57.0%), not-for-profit organizations (1,662 | 15.4%), and self-employed (not incorporated) (1,201 | 11.1%) make up the most common classes of employment.
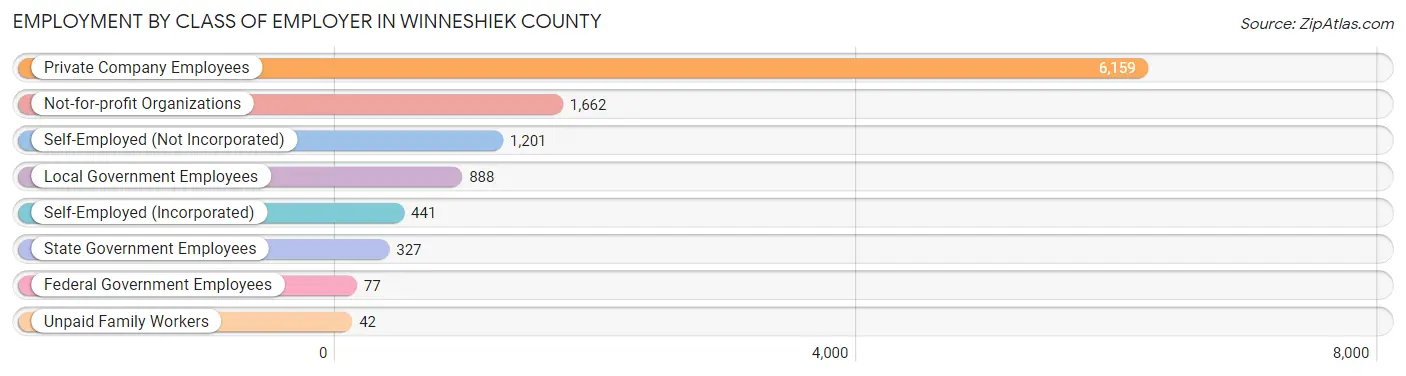
| Employer Class | # Employees | % Employees |
| Private Company Employees | 6,159 | 57.0% |
| Self-Employed (Incorporated) | 441 | 4.1% |
| Self-Employed (Not Incorporated) | 1,201 | 11.1% |
| Not-for-profit Organizations | 1,662 | 15.4% |
| Local Government Employees | 888 | 8.2% |
| State Government Employees | 327 | 3.0% |
| Federal Government Employees | 77 | 0.7% |
| Unpaid Family Workers | 42 | 0.4% |
| Total | 10,797 | 100.0% |
Employment Status by Age in Winneshiek County
According to the labor force statistics for Winneshiek County, out of the total population over 16 years of age (16,861), 66.3% or 11,179 individuals are in the labor force, with 2.1% or 235 of them unemployed. The age group with the highest labor force participation rate is 35 to 44 years, with 95.6% or 1,924 individuals in the labor force. Within the labor force, the 65 to 74 years age range has the highest percentage of unemployed individuals, with 5.5% or 49 of them being unemployed.
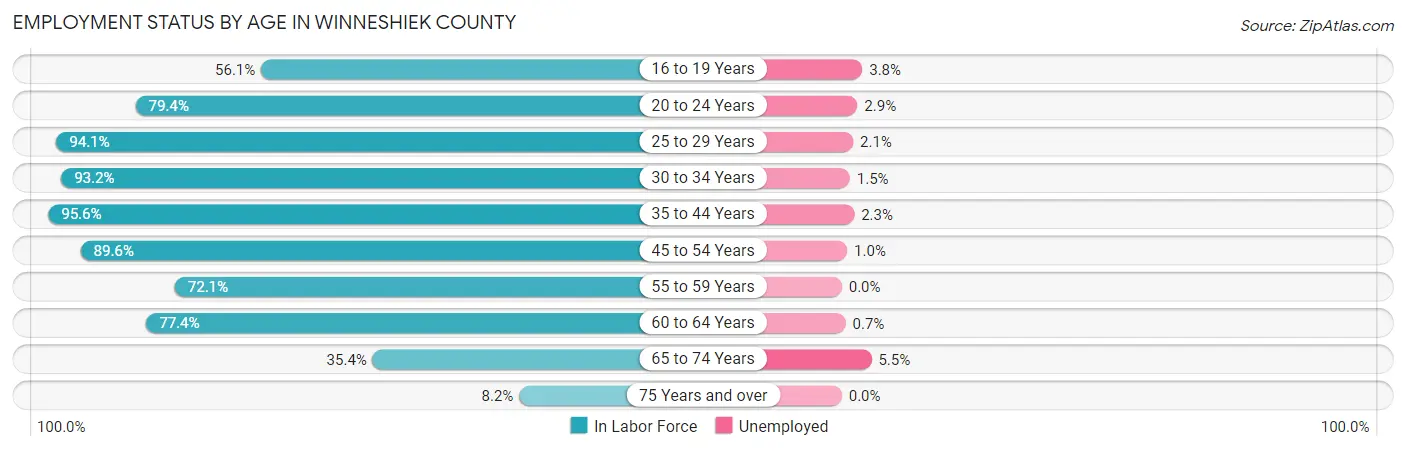
| Age Bracket | In Labor Force | Unemployed |
| 16 to 19 Years | 888 (56.1%) | 34 (3.8%) |
| 20 to 24 Years | 1,463 (79.4%) | 42 (2.9%) |
| 25 to 29 Years | 816 (94.1%) | 17 (2.1%) |
| 30 to 34 Years | 847 (93.2%) | 13 (1.5%) |
| 35 to 44 Years | 1,924 (95.6%) | 44 (2.3%) |
| 45 to 54 Years | 1,925 (89.6%) | 19 (1.0%) |
| 55 to 59 Years | 983 (72.1%) | 0 (0.0%) |
| 60 to 64 Years | 1,293 (77.4%) | 9 (0.7%) |
| 65 to 74 Years | 886 (35.4%) | 49 (5.5%) |
| 75 Years and over | 161 (8.2%) | 0 (0.0%) |
| Total | 11,179 (66.3%) | 235 (2.1%) |
Employment Status by Educational Attainment in Winneshiek County
According to labor force statistics for Winneshiek County, 86.8% of individuals (7,787) out of the total population between 25 and 64 years of age (8,971) are in the labor force, with 1.3% or 101 of them being unemployed. The group with the highest labor force participation rate are those with the educational attainment of bachelor's degree or higher, with 94.1% or 2,684 individuals in the labor force. Within the labor force, individuals with high school diploma education have the highest percentage of unemployment, with 2.0% or 41 of them being unemployed.

| Educational Attainment | In Labor Force | Unemployed |
| Less than High School | 213 (70.3%) | 2 (0.5%) |
| High School Diploma | 2,064 (77.2%) | 53 (2.0%) |
| College / Associate Degree | 2,825 (89.9%) | 44 (1.4%) |
| Bachelor's Degree or higher | 2,684 (94.1%) | 23 (0.8%) |
| Total | 7,787 (86.8%) | 117 (1.3%) |
Employment Occupations by Sex in Winneshiek County
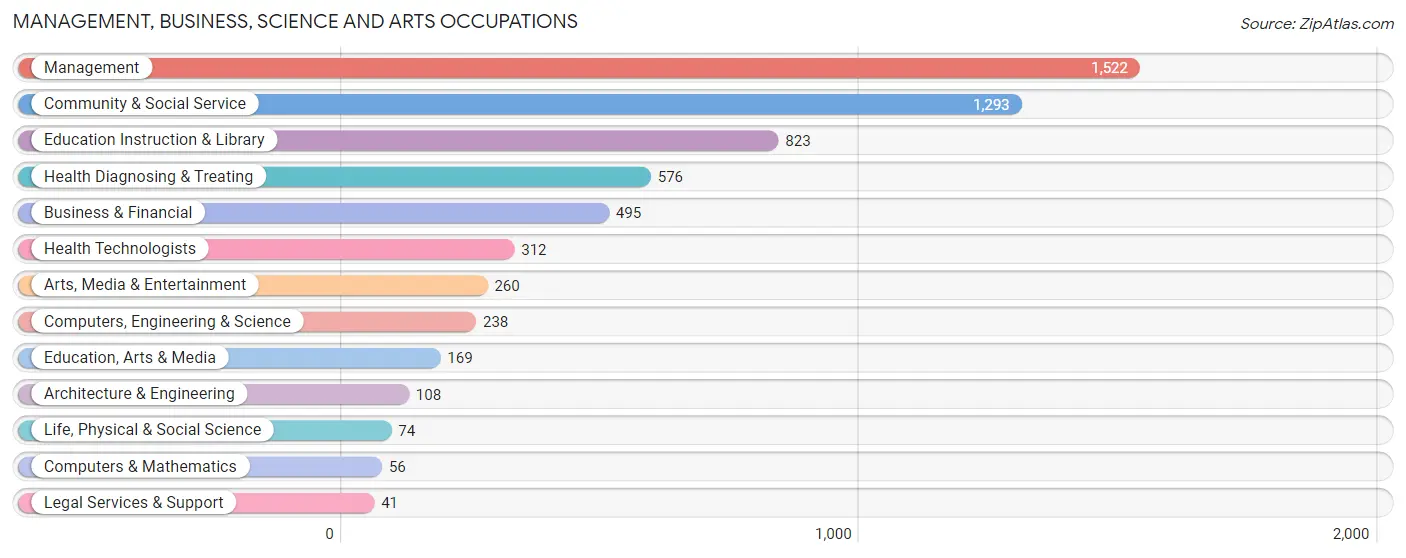
Management, Business, Science and Arts Occupations
The most common Management, Business, Science and Arts occupations in Winneshiek County are Management (1,522 | 13.9%), Community & Social Service (1,293 | 11.8%), Education Instruction & Library (823 | 7.5%), Health Diagnosing & Treating (576 | 5.3%), and Business & Financial (495 | 4.5%).
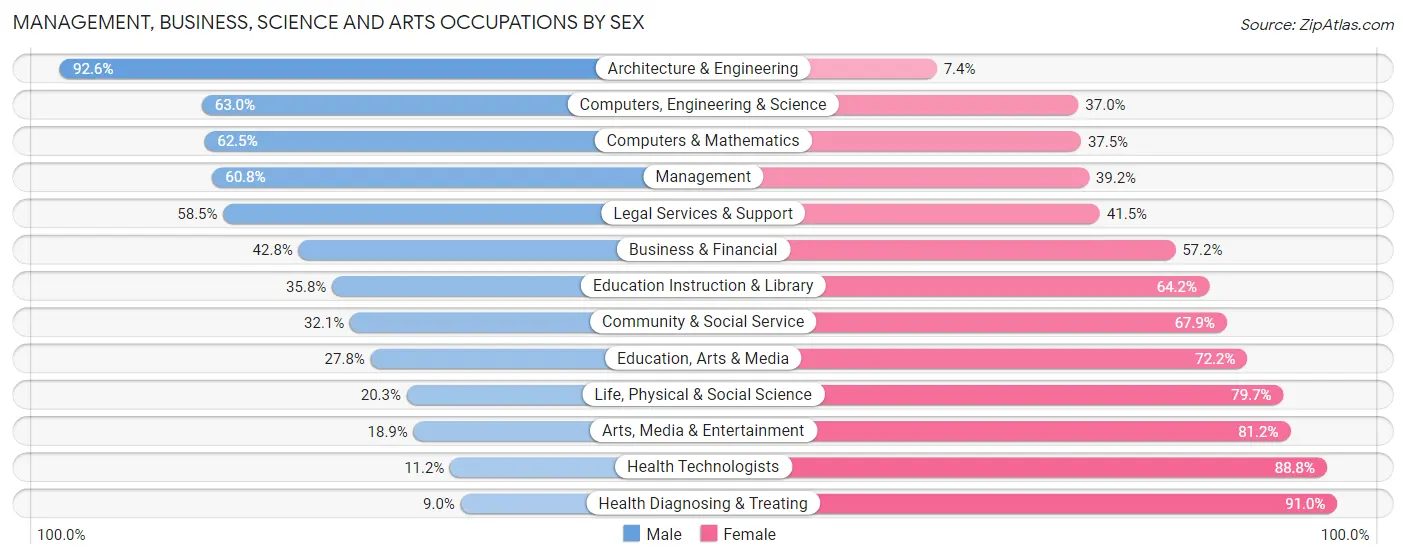
Management, Business, Science and Arts Occupations by Sex
Within the Management, Business, Science and Arts occupations in Winneshiek County, the most male-oriented occupations are Architecture & Engineering (92.6%), Computers, Engineering & Science (63.0%), and Computers & Mathematics (62.5%), while the most female-oriented occupations are Health Diagnosing & Treating (91.0%), Health Technologists (88.8%), and Arts, Media & Entertainment (81.1%).
| Occupation | Male | Female |
| Management | 926 (60.8%) | 596 (39.2%) |
| Business & Financial | 212 (42.8%) | 283 (57.2%) |
| Computers, Engineering & Science | 150 (63.0%) | 88 (37.0%) |
| Computers & Mathematics | 35 (62.5%) | 21 (37.5%) |
| Architecture & Engineering | 100 (92.6%) | 8 (7.4%) |
| Life, Physical & Social Science | 15 (20.3%) | 59 (79.7%) |
| Community & Social Service | 415 (32.1%) | 878 (67.9%) |
| Education, Arts & Media | 47 (27.8%) | 122 (72.2%) |
| Legal Services & Support | 24 (58.5%) | 17 (41.5%) |
| Education Instruction & Library | 295 (35.8%) | 528 (64.2%) |
| Arts, Media & Entertainment | 49 (18.9%) | 211 (81.1%) |
| Health Diagnosing & Treating | 52 (9.0%) | 524 (91.0%) |
| Health Technologists | 35 (11.2%) | 277 (88.8%) |
| Total (Category) | 1,755 (42.6%) | 2,369 (57.4%) |
| Total (Overall) | 5,498 (50.2%) | 5,457 (49.8%) |
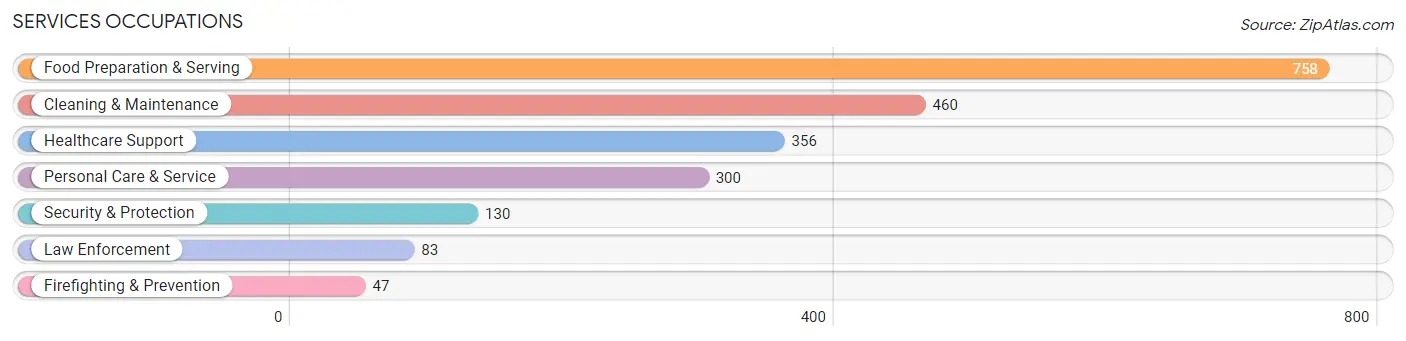
Services Occupations
The most common Services occupations in Winneshiek County are Food Preparation & Serving (758 | 6.9%), Cleaning & Maintenance (460 | 4.2%), Healthcare Support (356 | 3.3%), Personal Care & Service (300 | 2.7%), and Security & Protection (130 | 1.2%).
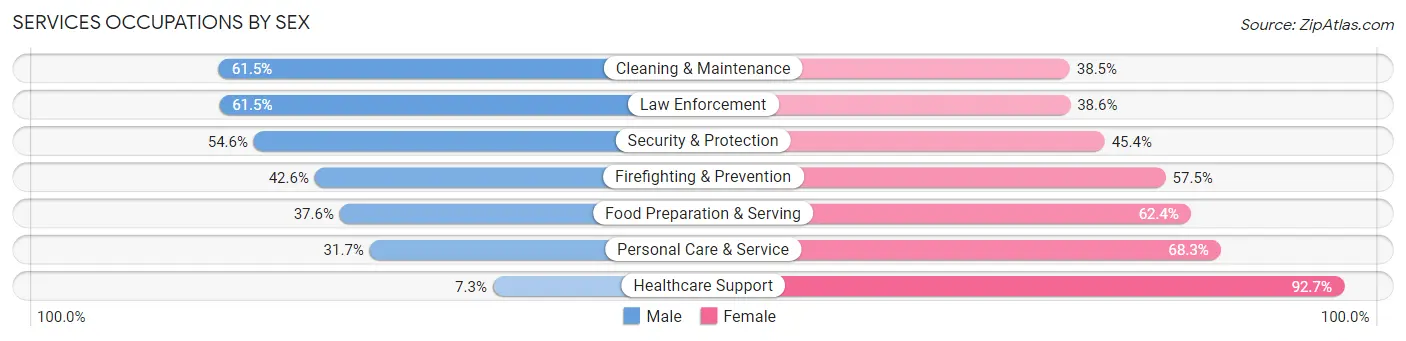
Services Occupations by Sex
Within the Services occupations in Winneshiek County, the most male-oriented occupations are Cleaning & Maintenance (61.5%), Law Enforcement (61.5%), and Security & Protection (54.6%), while the most female-oriented occupations are Healthcare Support (92.7%), Personal Care & Service (68.3%), and Food Preparation & Serving (62.4%).
| Occupation | Male | Female |
| Healthcare Support | 26 (7.3%) | 330 (92.7%) |
| Security & Protection | 71 (54.6%) | 59 (45.4%) |
| Firefighting & Prevention | 20 (42.5%) | 27 (57.5%) |
| Law Enforcement | 51 (61.5%) | 32 (38.6%) |
| Food Preparation & Serving | 285 (37.6%) | 473 (62.4%) |
| Cleaning & Maintenance | 283 (61.5%) | 177 (38.5%) |
| Personal Care & Service | 95 (31.7%) | 205 (68.3%) |
| Total (Category) | 760 (37.9%) | 1,244 (62.1%) |
| Total (Overall) | 5,498 (50.2%) | 5,457 (49.8%) |
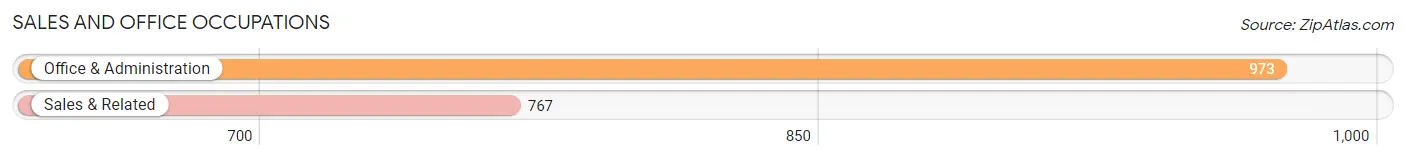
Sales and Office Occupations
The most common Sales and Office occupations in Winneshiek County are Office & Administration (973 | 8.9%), and Sales & Related (767 | 7.0%).
Sales and Office Occupations by Sex
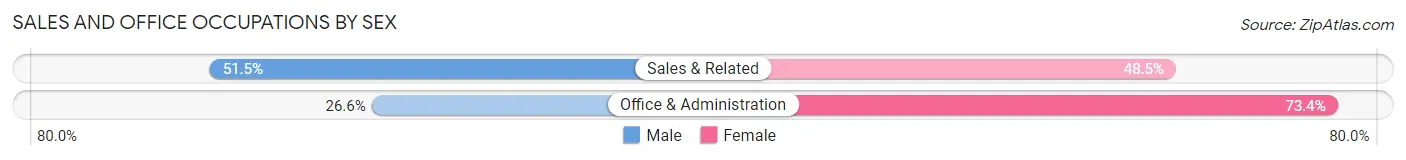
| Occupation | Male | Female |
| Sales & Related | 395 (51.5%) | 372 (48.5%) |
| Office & Administration | 259 (26.6%) | 714 (73.4%) |
| Total (Category) | 654 (37.6%) | 1,086 (62.4%) |
| Total (Overall) | 5,498 (50.2%) | 5,457 (49.8%) |
Natural Resources, Construction and Maintenance Occupations
The most common Natural Resources, Construction and Maintenance occupations in Winneshiek County are Construction & Extraction (687 | 6.3%), Installation, Maintenance & Repair (326 | 3.0%), and Farming, Fishing & Forestry (298 | 2.7%).

Natural Resources, Construction and Maintenance Occupations by Sex
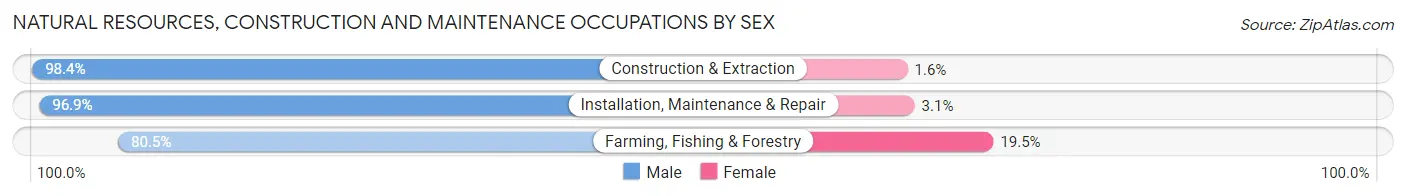
| Occupation | Male | Female |
| Farming, Fishing & Forestry | 240 (80.5%) | 58 (19.5%) |
| Construction & Extraction | 676 (98.4%) | 11 (1.6%) |
| Installation, Maintenance & Repair | 316 (96.9%) | 10 (3.1%) |
| Total (Category) | 1,232 (94.0%) | 79 (6.0%) |
| Total (Overall) | 5,498 (50.2%) | 5,457 (49.8%) |
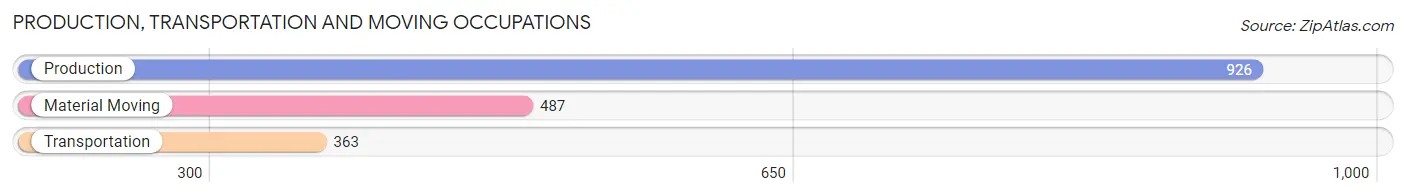
Production, Transportation and Moving Occupations
The most common Production, Transportation and Moving occupations in Winneshiek County are Production (926 | 8.5%), Material Moving (487 | 4.4%), and Transportation (363 | 3.3%).
Production, Transportation and Moving Occupations by Sex
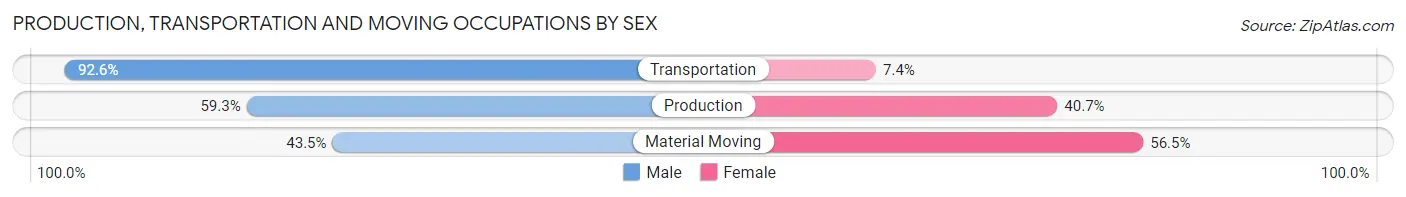
| Occupation | Male | Female |
| Production | 549 (59.3%) | 377 (40.7%) |
| Transportation | 336 (92.6%) | 27 (7.4%) |
| Material Moving | 212 (43.5%) | 275 (56.5%) |
| Total (Category) | 1,097 (61.8%) | 679 (38.2%) |
| Total (Overall) | 5,498 (50.2%) | 5,457 (49.8%) |
Employment Industries by Sex in Winneshiek County
Employment Industries in Winneshiek County
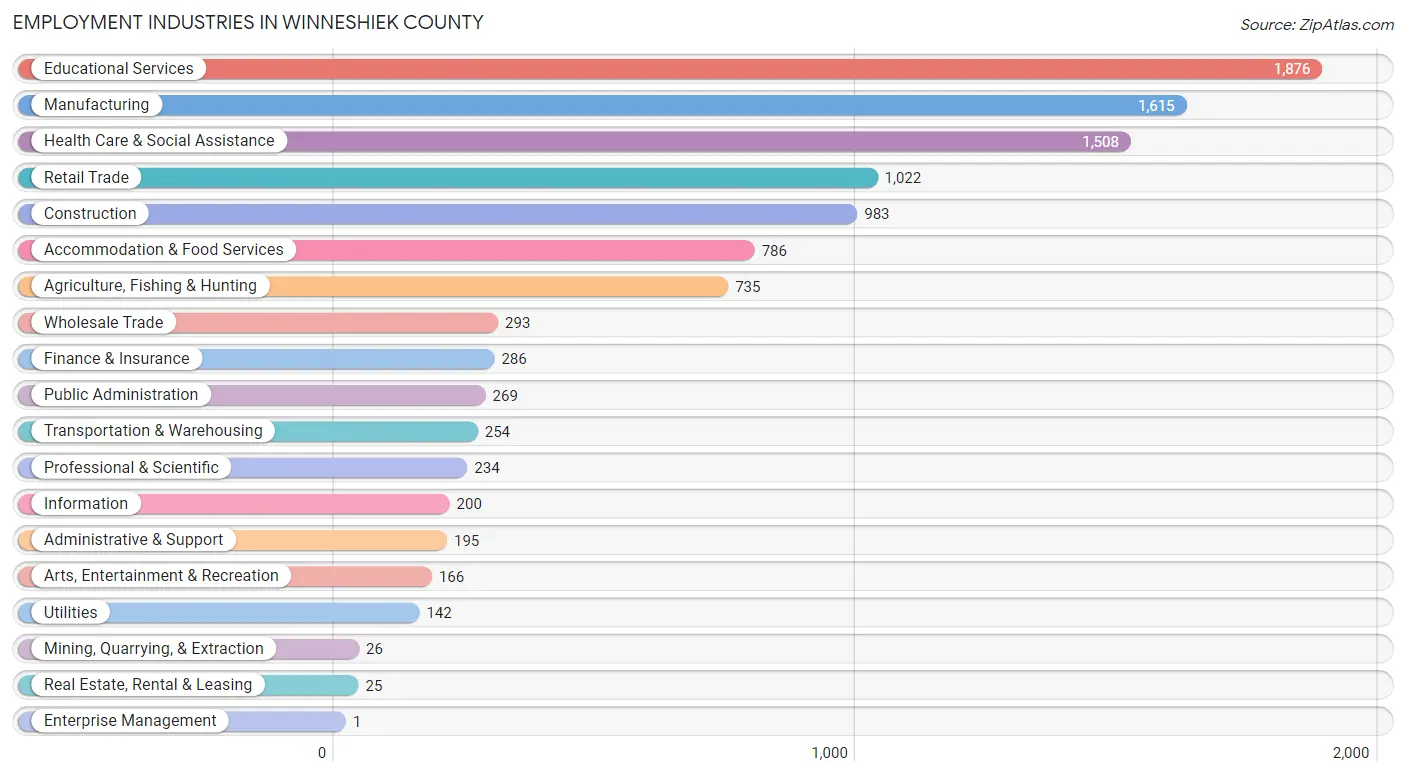
The major employment industries in Winneshiek County include Educational Services (1,876 | 17.1%), Manufacturing (1,615 | 14.7%), Health Care & Social Assistance (1,508 | 13.8%), Retail Trade (1,022 | 9.3%), and Construction (983 | 9.0%).
Employment Industries by Sex in Winneshiek County
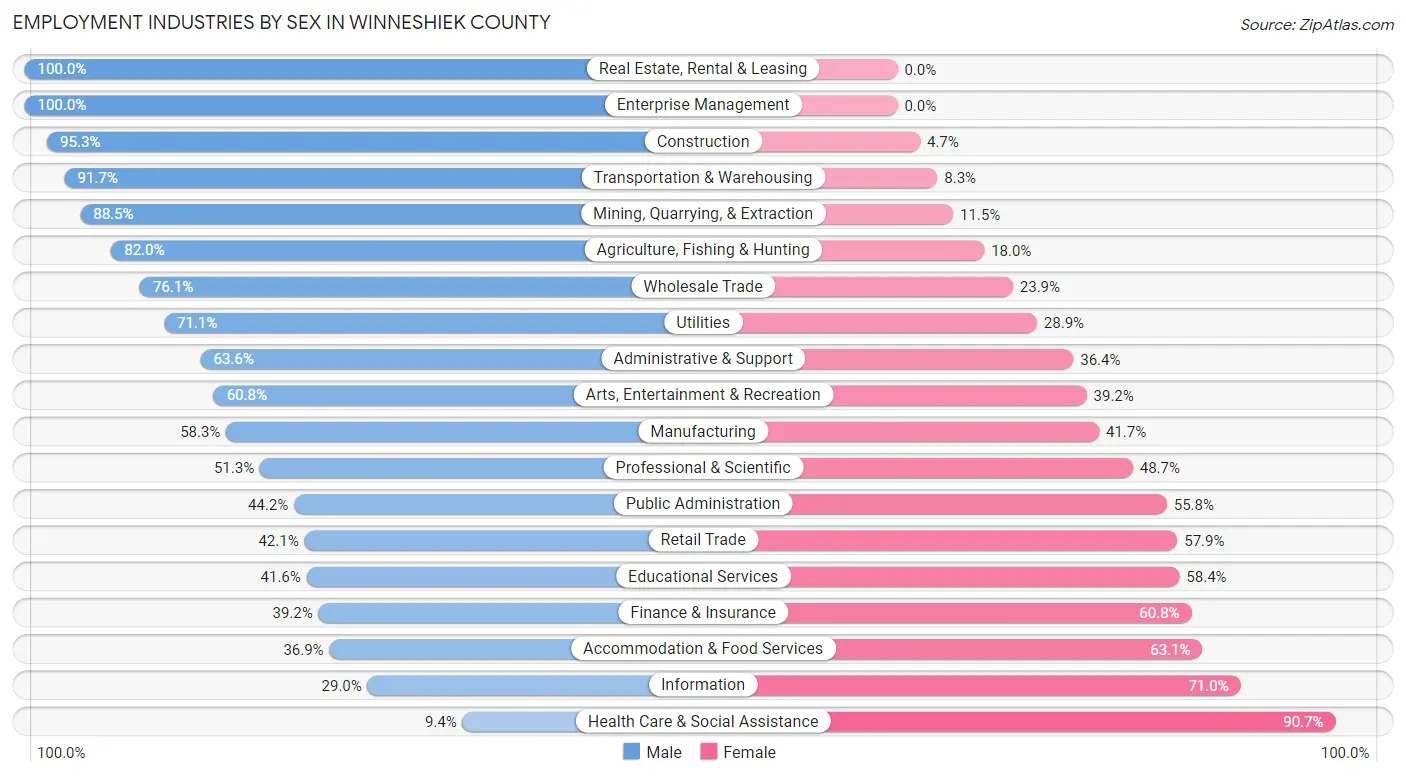
The Winneshiek County industries that see more men than women are Real Estate, Rental & Leasing (100.0%), Enterprise Management (100.0%), and Construction (95.3%), whereas the industries that tend to have a higher number of women are Health Care & Social Assistance (90.6%), Information (71.0%), and Accommodation & Food Services (63.1%).
| Industry | Male | Female |
| Agriculture, Fishing & Hunting | 603 (82.0%) | 132 (18.0%) |
| Mining, Quarrying, & Extraction | 23 (88.5%) | 3 (11.5%) |
| Construction | 937 (95.3%) | 46 (4.7%) |
| Manufacturing | 941 (58.3%) | 674 (41.7%) |
| Wholesale Trade | 223 (76.1%) | 70 (23.9%) |
| Retail Trade | 430 (42.1%) | 592 (57.9%) |
| Transportation & Warehousing | 233 (91.7%) | 21 (8.3%) |
| Utilities | 101 (71.1%) | 41 (28.9%) |
| Information | 58 (29.0%) | 142 (71.0%) |
| Finance & Insurance | 112 (39.2%) | 174 (60.8%) |
| Real Estate, Rental & Leasing | 25 (100.0%) | 0 (0.0%) |
| Professional & Scientific | 120 (51.3%) | 114 (48.7%) |
| Enterprise Management | 1 (100.0%) | 0 (0.0%) |
| Administrative & Support | 124 (63.6%) | 71 (36.4%) |
| Educational Services | 781 (41.6%) | 1,095 (58.4%) |
| Health Care & Social Assistance | 141 (9.3%) | 1,367 (90.6%) |
| Arts, Entertainment & Recreation | 101 (60.8%) | 65 (39.2%) |
| Accommodation & Food Services | 290 (36.9%) | 496 (63.1%) |
| Public Administration | 119 (44.2%) | 150 (55.8%) |
| Total | 5,498 (50.2%) | 5,457 (49.8%) |
Education in Winneshiek County
School Enrollment in Winneshiek County
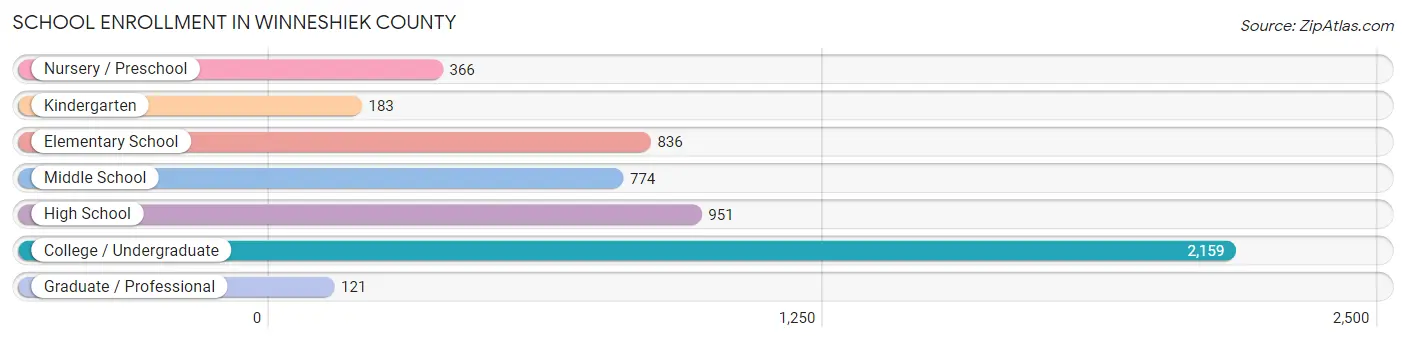
The most common levels of schooling among the 5,390 students in Winneshiek County are college / undergraduate (2,159 | 40.1%), high school (951 | 17.6%), and elementary school (836 | 15.5%).
| School Level | # Students | % Students |
| Nursery / Preschool | 366 | 6.8% |
| Kindergarten | 183 | 3.4% |
| Elementary School | 836 | 15.5% |
| Middle School | 774 | 14.4% |
| High School | 951 | 17.6% |
| College / Undergraduate | 2,159 | 40.1% |
| Graduate / Professional | 121 | 2.2% |
| Total | 5,390 | 100.0% |
School Enrollment by Age by Funding Source in Winneshiek County
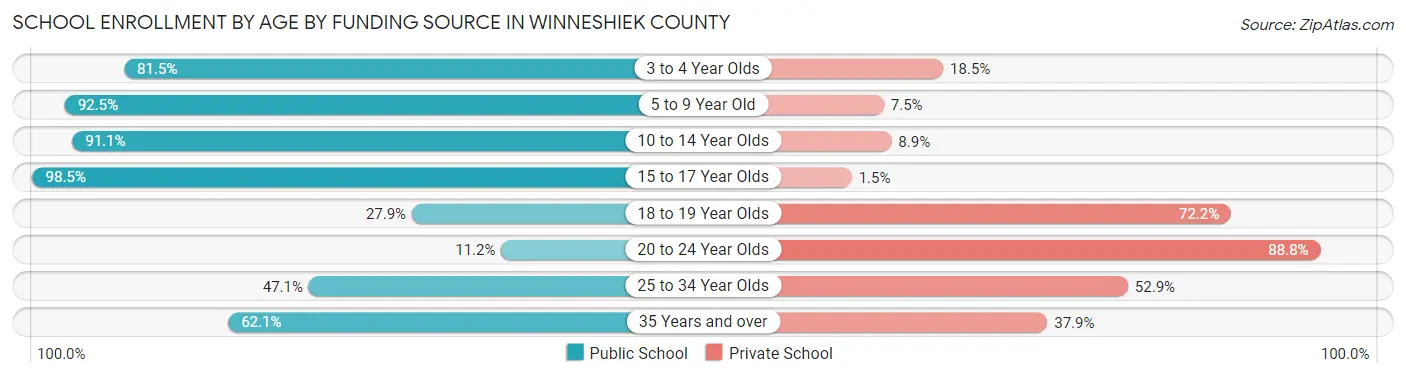
Out of a total of 5,390 students who are enrolled in schools in Winneshiek County, 2,129 (39.5%) attend a private institution, while the remaining 3,261 (60.5%) are enrolled in public schools. The age group of 20 to 24 year olds has the highest likelihood of being enrolled in private schools, with 1,109 (88.8% in the age bracket) enrolled. Conversely, the age group of 15 to 17 year olds has the lowest likelihood of being enrolled in a private school, with 720 (98.5% in the age bracket) attending a public institution.
| Age Bracket | Public School | Private School |
| 3 to 4 Year Olds | 211 (81.5%) | 48 (18.5%) |
| 5 to 9 Year Old | 940 (92.5%) | 76 (7.5%) |
| 10 to 14 Year Olds | 871 (91.1%) | 85 (8.9%) |
| 15 to 17 Year Olds | 720 (98.5%) | 11 (1.5%) |
| 18 to 19 Year Olds | 271 (27.9%) | 702 (72.2%) |
| 20 to 24 Year Olds | 140 (11.2%) | 1,109 (88.8%) |
| 25 to 34 Year Olds | 56 (47.1%) | 63 (52.9%) |
| 35 Years and over | 54 (62.1%) | 33 (37.9%) |
| Total | 3,261 (60.5%) | 2,129 (39.5%) |
Educational Attainment by Field of Study in Winneshiek County
Education (1,004 | 21.4%), business (749 | 16.0%), bio, nature & agricultural (462 | 9.9%), science & technology (434 | 9.3%), and social sciences (323 | 6.9%) are the most common fields of study among 4,687 individuals in Winneshiek County who have obtained a bachelor's degree or higher.

| Field of Study | # Graduates | % Graduates |
| Computers & Mathematics | 72 | 1.5% |
| Bio, Nature & Agricultural | 462 | 9.9% |
| Physical & Health Sciences | 172 | 3.7% |
| Psychology | 197 | 4.2% |
| Social Sciences | 323 | 6.9% |
| Engineering | 142 | 3.0% |
| Multidisciplinary Studies | 35 | 0.7% |
| Science & Technology | 434 | 9.3% |
| Business | 749 | 16.0% |
| Education | 1,004 | 21.4% |
| Literature & Languages | 191 | 4.1% |
| Liberal Arts & History | 292 | 6.2% |
| Visual & Performing Arts | 205 | 4.4% |
| Communications | 138 | 2.9% |
| Arts & Humanities | 271 | 5.8% |
| Total | 4,687 | 100.0% |
Transportation & Commute in Winneshiek County
Vehicle Availability by Sex in Winneshiek County
The most prevalent vehicle ownership categories in Winneshiek County are males with 2 vehicles (1,839, accounting for 37.4%) and females with 2 vehicles (1,762, making up 39.0%).
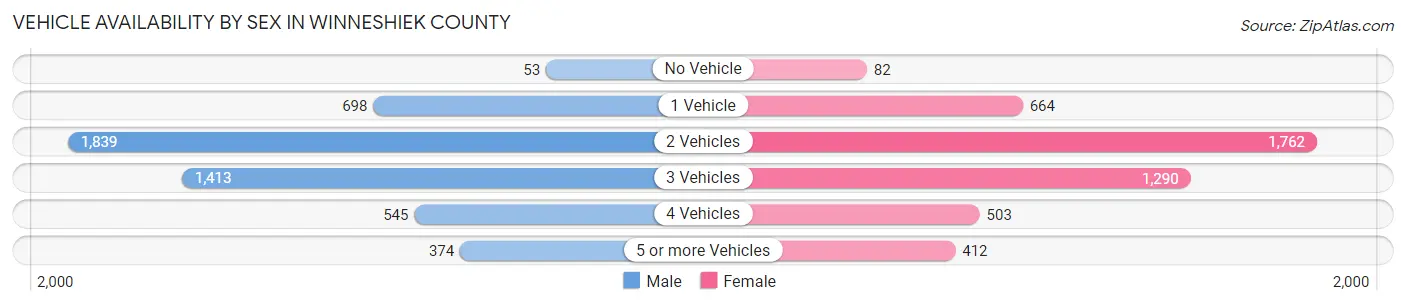
| Vehicles Available | Male | Female |
| No Vehicle | 53 (1.1%) | 82 (1.7%) |
| 1 Vehicle | 698 (14.2%) | 664 (14.1%) |
| 2 Vehicles | 1,839 (37.4%) | 1,762 (37.4%) |
| 3 Vehicles | 1,413 (28.7%) | 1,290 (27.4%) |
| 4 Vehicles | 545 (11.1%) | 503 (10.7%) |
| 5 or more Vehicles | 374 (7.6%) | 412 (8.7%) |
| Total | 4,922 (100.0%) | 4,713 (100.0%) |
Commute Time in Winneshiek County
The most frequently occuring commute durations in Winneshiek County are 5 to 9 minutes (2,446 commuters, 25.5%), 10 to 14 minutes (1,576 commuters, 16.4%), and 15 to 19 minutes (1,168 commuters, 12.2%).
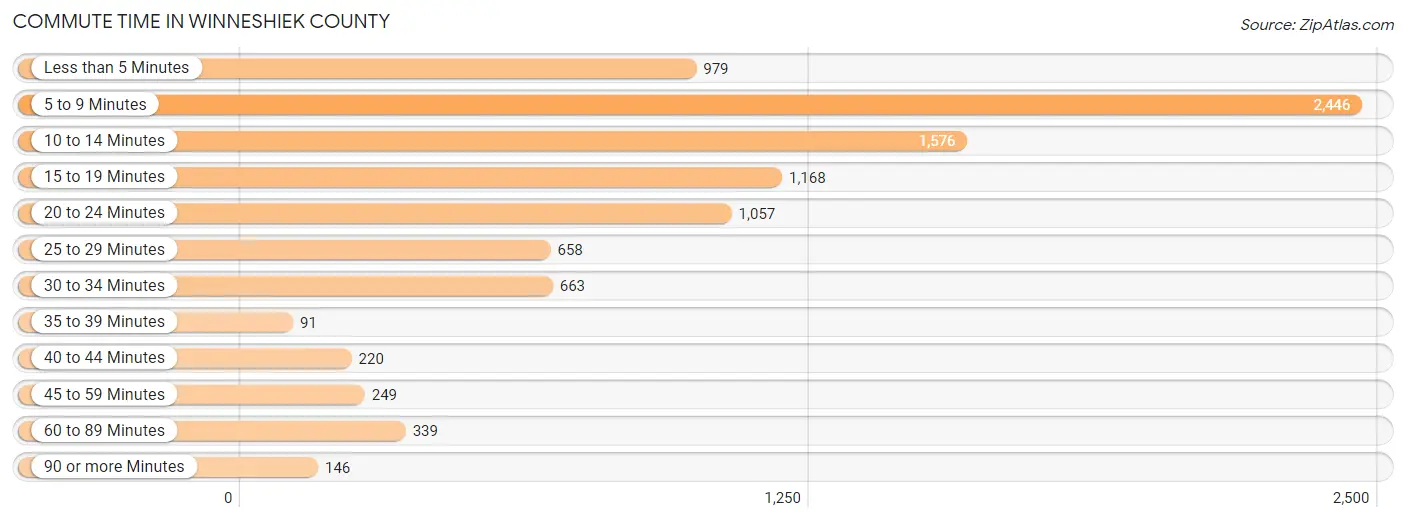
| Commute Time | # Commuters | % Commuters |
| Less than 5 Minutes | 979 | 10.2% |
| 5 to 9 Minutes | 2,446 | 25.5% |
| 10 to 14 Minutes | 1,576 | 16.4% |
| 15 to 19 Minutes | 1,168 | 12.2% |
| 20 to 24 Minutes | 1,057 | 11.0% |
| 25 to 29 Minutes | 658 | 6.9% |
| 30 to 34 Minutes | 663 | 6.9% |
| 35 to 39 Minutes | 91 | 0.9% |
| 40 to 44 Minutes | 220 | 2.3% |
| 45 to 59 Minutes | 249 | 2.6% |
| 60 to 89 Minutes | 339 | 3.5% |
| 90 or more Minutes | 146 | 1.5% |
Commute Time by Sex in Winneshiek County
The most common commute times in Winneshiek County are 5 to 9 minutes (1,175 commuters, 24.1%) for males and 5 to 9 minutes (1,271 commuters, 27.0%) for females.
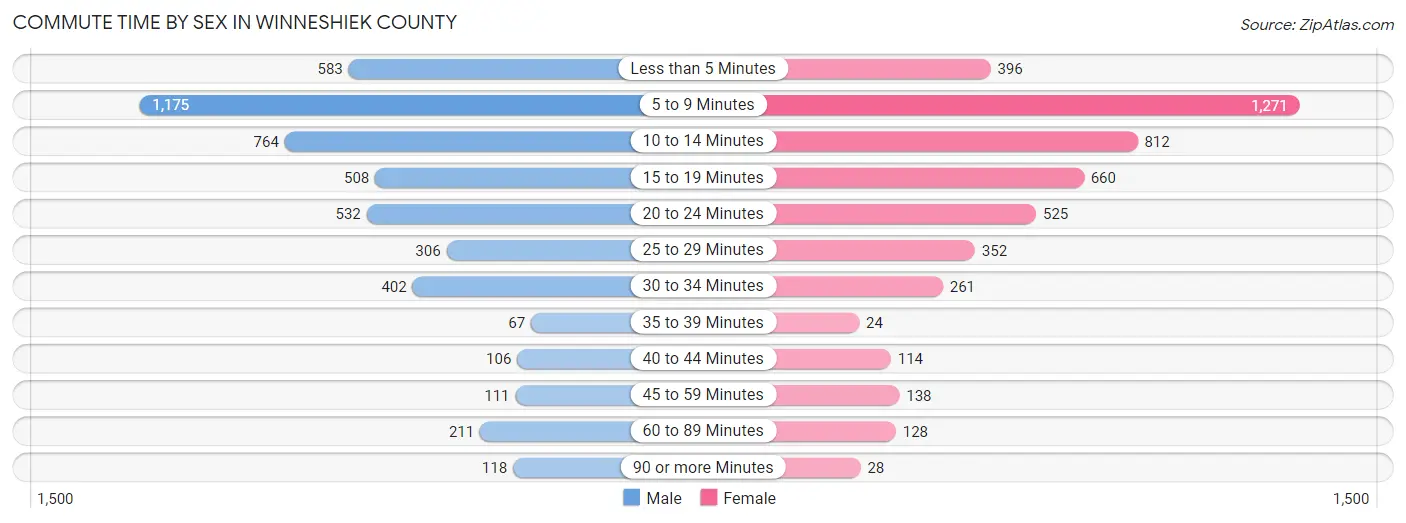
| Commute Time | Male | Female |
| Less than 5 Minutes | 583 (11.9%) | 396 (8.4%) |
| 5 to 9 Minutes | 1,175 (24.1%) | 1,271 (27.0%) |
| 10 to 14 Minutes | 764 (15.7%) | 812 (17.2%) |
| 15 to 19 Minutes | 508 (10.4%) | 660 (14.0%) |
| 20 to 24 Minutes | 532 (10.9%) | 525 (11.2%) |
| 25 to 29 Minutes | 306 (6.3%) | 352 (7.5%) |
| 30 to 34 Minutes | 402 (8.2%) | 261 (5.5%) |
| 35 to 39 Minutes | 67 (1.4%) | 24 (0.5%) |
| 40 to 44 Minutes | 106 (2.2%) | 114 (2.4%) |
| 45 to 59 Minutes | 111 (2.3%) | 138 (2.9%) |
| 60 to 89 Minutes | 211 (4.3%) | 128 (2.7%) |
| 90 or more Minutes | 118 (2.4%) | 28 (0.6%) |
Time of Departure to Work by Sex in Winneshiek County
The most frequent times of departure to work in Winneshiek County are 7:00 AM to 7:29 AM (792, 16.2%) for males and 7:30 AM to 7:59 AM (765, 16.3%) for females.
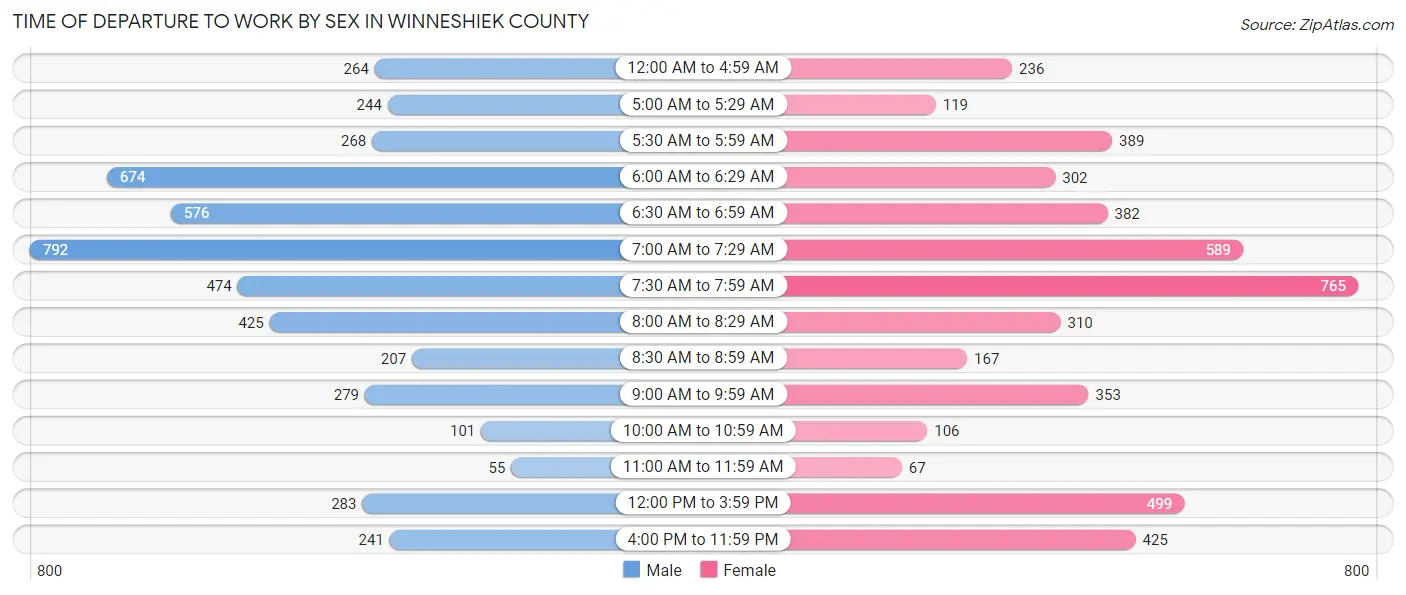
| Time of Departure | Male | Female |
| 12:00 AM to 4:59 AM | 264 (5.4%) | 236 (5.0%) |
| 5:00 AM to 5:29 AM | 244 (5.0%) | 119 (2.5%) |
| 5:30 AM to 5:59 AM | 268 (5.5%) | 389 (8.3%) |
| 6:00 AM to 6:29 AM | 674 (13.8%) | 302 (6.4%) |
| 6:30 AM to 6:59 AM | 576 (11.8%) | 382 (8.1%) |
| 7:00 AM to 7:29 AM | 792 (16.2%) | 589 (12.5%) |
| 7:30 AM to 7:59 AM | 474 (9.7%) | 765 (16.3%) |
| 8:00 AM to 8:29 AM | 425 (8.7%) | 310 (6.6%) |
| 8:30 AM to 8:59 AM | 207 (4.2%) | 167 (3.5%) |
| 9:00 AM to 9:59 AM | 279 (5.7%) | 353 (7.5%) |
| 10:00 AM to 10:59 AM | 101 (2.1%) | 106 (2.2%) |
| 11:00 AM to 11:59 AM | 55 (1.1%) | 67 (1.4%) |
| 12:00 PM to 3:59 PM | 283 (5.8%) | 499 (10.6%) |
| 4:00 PM to 11:59 PM | 241 (4.9%) | 425 (9.0%) |
| Total | 4,883 (100.0%) | 4,709 (100.0%) |
Housing Occupancy in Winneshiek County
Occupancy by Ownership in Winneshiek County
Of the total 8,218 dwellings in Winneshiek County, owner-occupied units account for 6,282 (76.4%), while renter-occupied units make up 1,936 (23.6%).

| Occupancy | # Housing Units | % Housing Units |
| Owner Occupied Housing Units | 6,282 | 76.4% |
| Renter-Occupied Housing Units | 1,936 | 23.6% |
| Total Occupied Housing Units | 8,218 | 100.0% |
Occupancy by Household Size in Winneshiek County
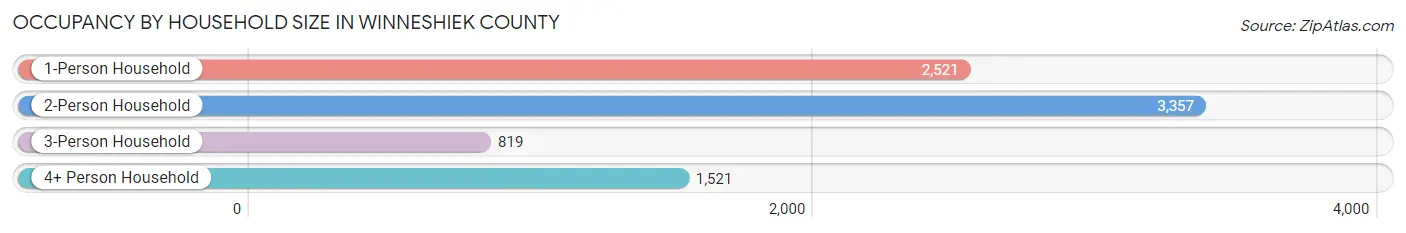
| Household Size | # Housing Units | % Housing Units |
| 1-Person Household | 2,521 | 30.7% |
| 2-Person Household | 3,357 | 40.8% |
| 3-Person Household | 819 | 10.0% |
| 4+ Person Household | 1,521 | 18.5% |
| Total Housing Units | 8,218 | 100.0% |
Occupancy by Ownership by Household Size in Winneshiek County

| Household Size | Owner-occupied | Renter-occupied |
| 1-Person Household | 1,485 (58.9%) | 1,036 (41.1%) |
| 2-Person Household | 2,942 (87.6%) | 415 (12.4%) |
| 3-Person Household | 631 (77.0%) | 188 (23.0%) |
| 4+ Person Household | 1,224 (80.5%) | 297 (19.5%) |
| Total Housing Units | 6,282 (76.4%) | 1,936 (23.6%) |
Occupancy by Educational Attainment in Winneshiek County
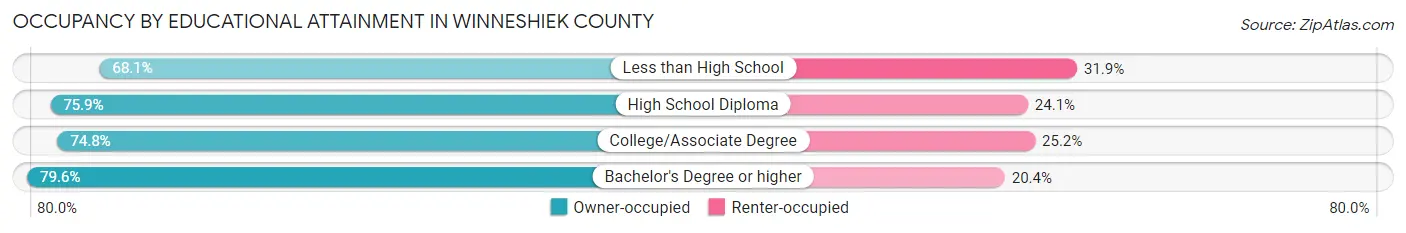
| Household Size | Owner-occupied | Renter-occupied |
| Less than High School | 216 (68.1%) | 101 (31.9%) |
| High School Diploma | 1,968 (75.9%) | 624 (24.1%) |
| College/Associate Degree | 1,991 (74.8%) | 671 (25.2%) |
| Bachelor's Degree or higher | 2,107 (79.6%) | 540 (20.4%) |
Occupancy by Age of Householder in Winneshiek County
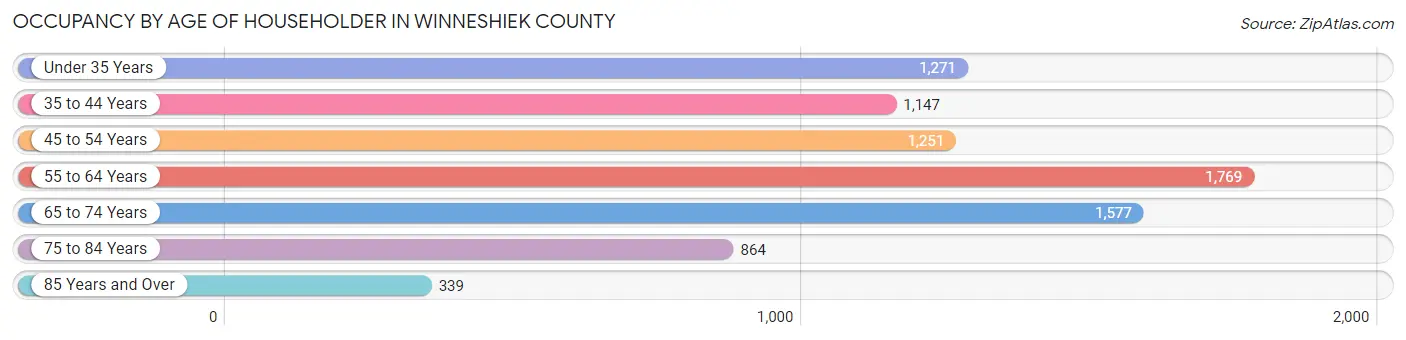
| Age Bracket | # Households | % Households |
| Under 35 Years | 1,271 | 15.5% |
| 35 to 44 Years | 1,147 | 14.0% |
| 45 to 54 Years | 1,251 | 15.2% |
| 55 to 64 Years | 1,769 | 21.5% |
| 65 to 74 Years | 1,577 | 19.2% |
| 75 to 84 Years | 864 | 10.5% |
| 85 Years and Over | 339 | 4.1% |
| Total | 8,218 | 100.0% |
Housing Finances in Winneshiek County
Median Income by Occupancy in Winneshiek County
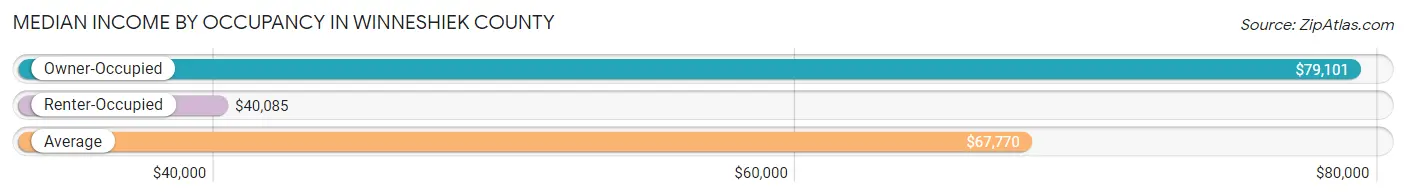
| Occupancy Type | # Households | Median Income |
| Owner-Occupied | 6,282 (76.4%) | $79,101 |
| Renter-Occupied | 1,936 (23.6%) | $40,085 |
| Average | 8,218 (100.0%) | $67,770 |
Occupancy by Householder Income Bracket in Winneshiek County
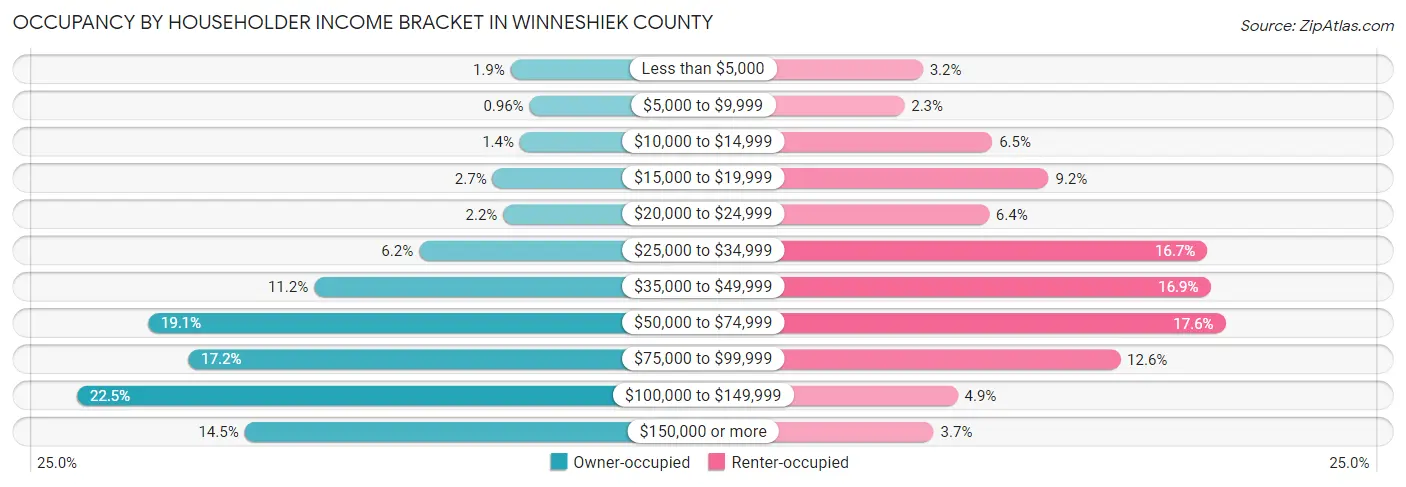
| Income Bracket | Owner-occupied | Renter-occupied |
| Less than $5,000 | 117 (1.9%) | 62 (3.2%) |
| $5,000 to $9,999 | 60 (1.0%) | 45 (2.3%) |
| $10,000 to $14,999 | 89 (1.4%) | 126 (6.5%) |
| $15,000 to $19,999 | 171 (2.7%) | 178 (9.2%) |
| $20,000 to $24,999 | 139 (2.2%) | 123 (6.4%) |
| $25,000 to $34,999 | 391 (6.2%) | 324 (16.7%) |
| $35,000 to $49,999 | 705 (11.2%) | 327 (16.9%) |
| $50,000 to $74,999 | 1,202 (19.1%) | 341 (17.6%) |
| $75,000 to $99,999 | 1,081 (17.2%) | 244 (12.6%) |
| $100,000 to $149,999 | 1,414 (22.5%) | 94 (4.9%) |
| $150,000 or more | 913 (14.5%) | 72 (3.7%) |
| Total | 6,282 (100.0%) | 1,936 (100.0%) |
Monthly Housing Cost Tiers in Winneshiek County
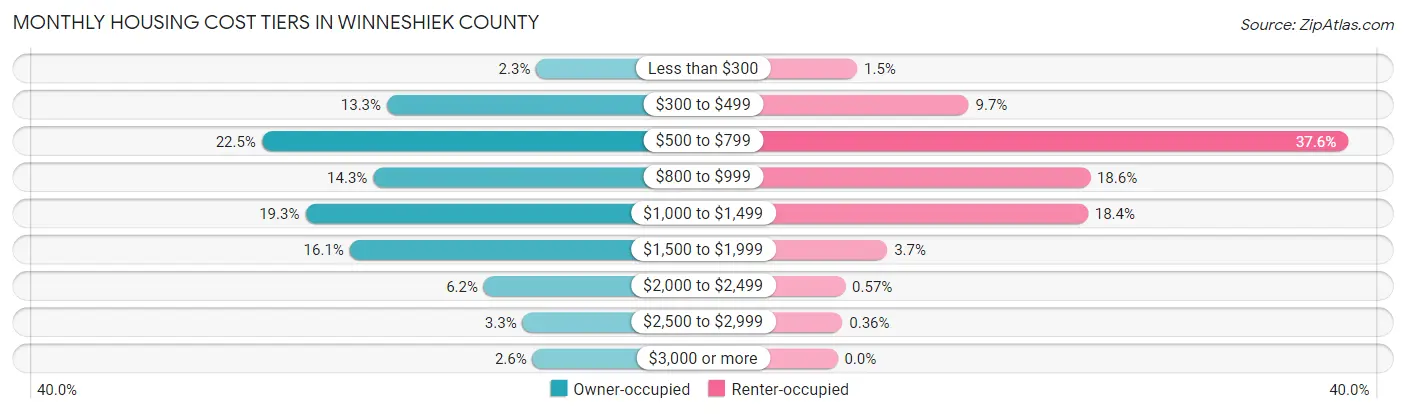
| Monthly Cost | Owner-occupied | Renter-occupied |
| Less than $300 | 146 (2.3%) | 28 (1.5%) |
| $300 to $499 | 837 (13.3%) | 187 (9.7%) |
| $500 to $799 | 1,416 (22.5%) | 728 (37.6%) |
| $800 to $999 | 900 (14.3%) | 360 (18.6%) |
| $1,000 to $1,499 | 1,214 (19.3%) | 357 (18.4%) |
| $1,500 to $1,999 | 1,009 (16.1%) | 71 (3.7%) |
| $2,000 to $2,499 | 388 (6.2%) | 11 (0.6%) |
| $2,500 to $2,999 | 209 (3.3%) | 7 (0.4%) |
| $3,000 or more | 163 (2.6%) | 0 (0.0%) |
| Total | 6,282 (100.0%) | 1,936 (100.0%) |
Physical Housing Characteristics in Winneshiek County
Housing Structures in Winneshiek County

| Structure Type | # Housing Units | % Housing Units |
| Single Unit, Detached | 6,863 | 83.5% |
| Single Unit, Attached | 140 | 1.7% |
| 2 Unit Apartments | 232 | 2.8% |
| 3 or 4 Unit Apartments | 267 | 3.3% |
| 5 to 9 Unit Apartments | 190 | 2.3% |
| 10 or more Apartments | 264 | 3.2% |
| Mobile Home / Other | 262 | 3.2% |
| Total | 8,218 | 100.0% |
Housing Structures by Occupancy in Winneshiek County
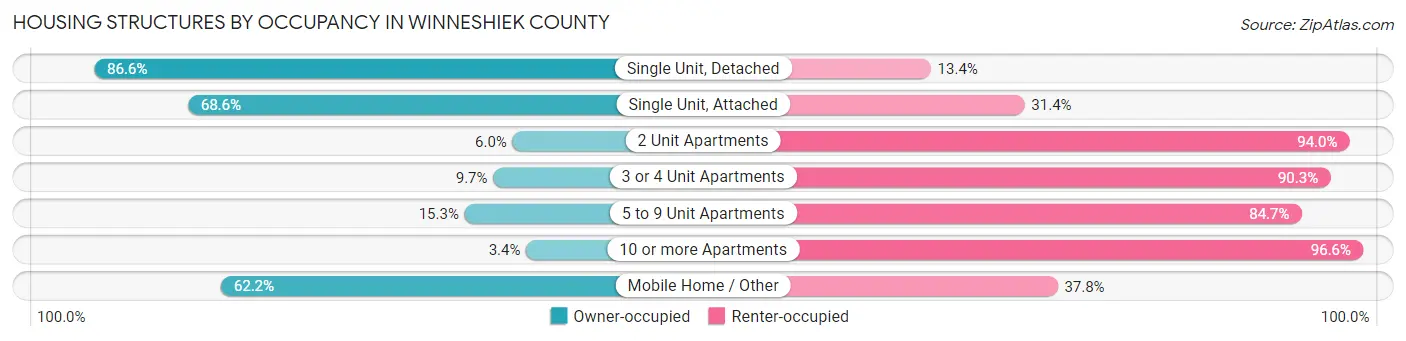
| Structure Type | Owner-occupied | Renter-occupied |
| Single Unit, Detached | 5,945 (86.6%) | 918 (13.4%) |
| Single Unit, Attached | 96 (68.6%) | 44 (31.4%) |
| 2 Unit Apartments | 14 (6.0%) | 218 (94.0%) |
| 3 or 4 Unit Apartments | 26 (9.7%) | 241 (90.3%) |
| 5 to 9 Unit Apartments | 29 (15.3%) | 161 (84.7%) |
| 10 or more Apartments | 9 (3.4%) | 255 (96.6%) |
| Mobile Home / Other | 163 (62.2%) | 99 (37.8%) |
| Total | 6,282 (76.4%) | 1,936 (23.6%) |
Housing Structures by Number of Rooms in Winneshiek County
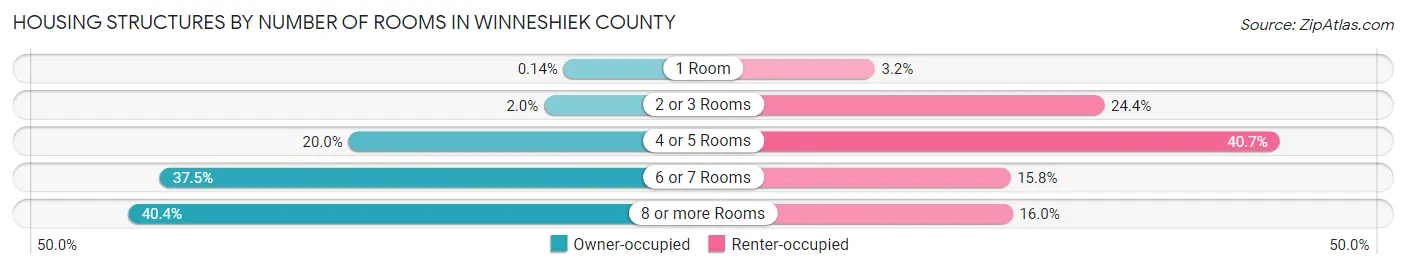
| Number of Rooms | Owner-occupied | Renter-occupied |
| 1 Room | 9 (0.1%) | 62 (3.2%) |
| 2 or 3 Rooms | 123 (2.0%) | 473 (24.4%) |
| 4 or 5 Rooms | 1,259 (20.0%) | 787 (40.6%) |
| 6 or 7 Rooms | 2,355 (37.5%) | 305 (15.8%) |
| 8 or more Rooms | 2,536 (40.4%) | 309 (16.0%) |
| Total | 6,282 (100.0%) | 1,936 (100.0%) |
Housing Structure by Heating Type in Winneshiek County

| Heating Type | Owner-occupied | Renter-occupied |
| Utility Gas | 2,595 (41.3%) | 731 (37.8%) |
| Bottled, Tank, or LP Gas | 2,597 (41.3%) | 512 (26.5%) |
| Electricity | 551 (8.8%) | 608 (31.4%) |
| Fuel Oil or Kerosene | 94 (1.5%) | 28 (1.5%) |
| Coal or Coke | 0 (0.0%) | 0 (0.0%) |
| All other Fuels | 420 (6.7%) | 44 (2.3%) |
| No Fuel Used | 25 (0.4%) | 13 (0.7%) |
| Total | 6,282 (100.0%) | 1,936 (100.0%) |
Household Vehicle Usage in Winneshiek County

| Vehicles per Household | Owner-occupied | Renter-occupied |
| No Vehicle | 69 (1.1%) | 289 (14.9%) |
| 1 Vehicle | 1,244 (19.8%) | 949 (49.0%) |
| 2 Vehicles | 2,655 (42.3%) | 462 (23.9%) |
| 3 or more Vehicles | 2,314 (36.8%) | 236 (12.2%) |
| Total | 6,282 (100.0%) | 1,936 (100.0%) |
Real Estate & Mortgages in Winneshiek County
Real Estate and Mortgage Overview in Winneshiek County
| Characteristic | Without Mortgage | With Mortgage |
| Housing Units | 2,830 | 3,452 |
| Median Property Value | $219,200 | $230,300 |
| Median Household Income | $66,933 | $609 |
| Monthly Housing Costs | $581 | $163 |
| Real Estate Taxes | $2,577 | $47 |
Property Value by Mortgage Status in Winneshiek County
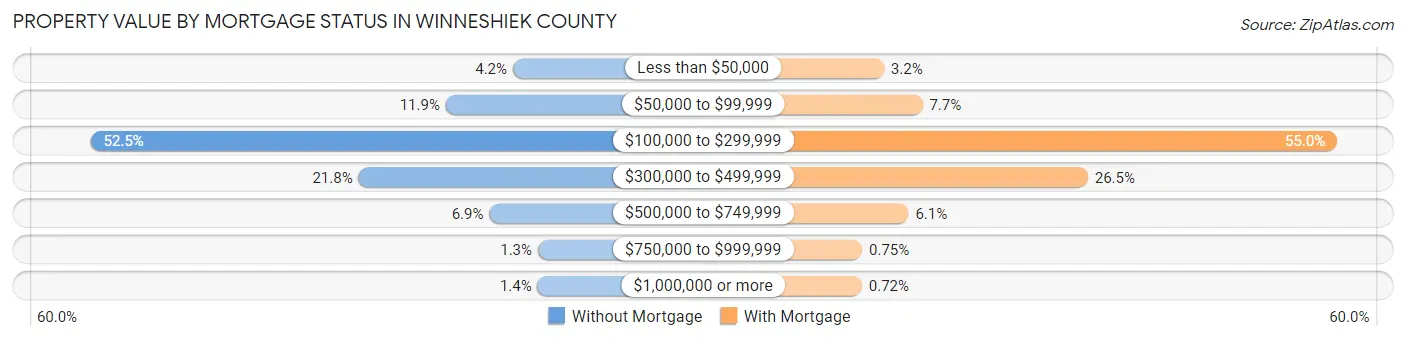
| Property Value | Without Mortgage | With Mortgage |
| Less than $50,000 | 119 (4.2%) | 112 (3.2%) |
| $50,000 to $99,999 | 336 (11.9%) | 264 (7.6%) |
| $100,000 to $299,999 | 1,485 (52.5%) | 1,900 (55.0%) |
| $300,000 to $499,999 | 618 (21.8%) | 916 (26.5%) |
| $500,000 to $749,999 | 195 (6.9%) | 209 (6.0%) |
| $750,000 to $999,999 | 38 (1.3%) | 26 (0.7%) |
| $1,000,000 or more | 39 (1.4%) | 25 (0.7%) |
| Total | 2,830 (100.0%) | 3,452 (100.0%) |
Household Income by Mortgage Status in Winneshiek County
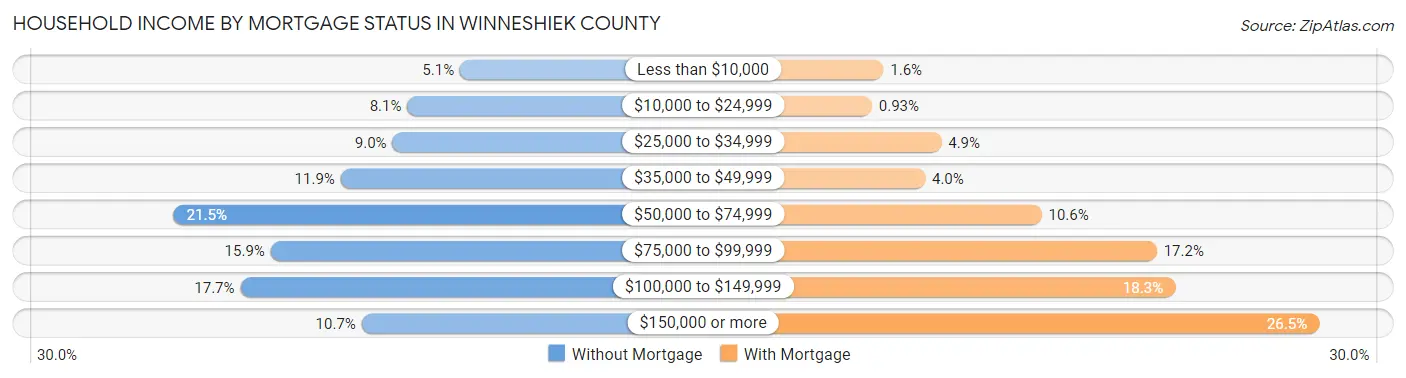
| Household Income | Without Mortgage | With Mortgage |
| Less than $10,000 | 145 (5.1%) | 55 (1.6%) |
| $10,000 to $24,999 | 230 (8.1%) | 32 (0.9%) |
| $25,000 to $34,999 | 254 (9.0%) | 169 (4.9%) |
| $35,000 to $49,999 | 338 (11.9%) | 137 (4.0%) |
| $50,000 to $74,999 | 608 (21.5%) | 367 (10.6%) |
| $75,000 to $99,999 | 451 (15.9%) | 594 (17.2%) |
| $100,000 to $149,999 | 500 (17.7%) | 630 (18.2%) |
| $150,000 or more | 304 (10.7%) | 914 (26.5%) |
| Total | 2,830 (100.0%) | 3,452 (100.0%) |
Property Value to Household Income Ratio in Winneshiek County
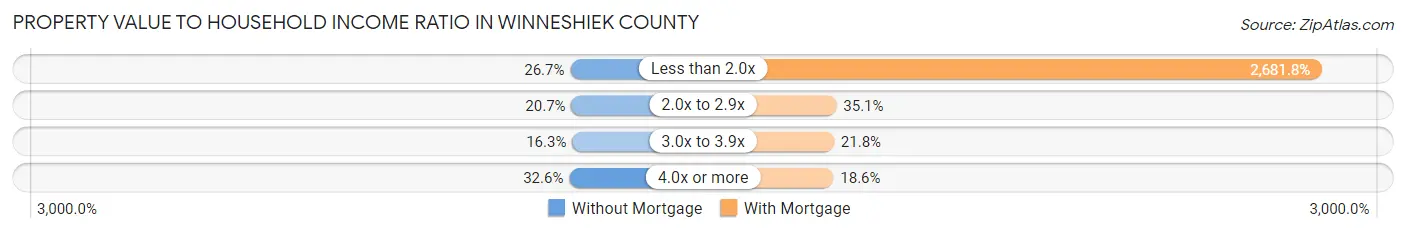
| Value-to-Income Ratio | Without Mortgage | With Mortgage |
| Less than 2.0x | 756 (26.7%) | 92,575 (2,681.8%) |
| 2.0x to 2.9x | 586 (20.7%) | 1,211 (35.1%) |
| 3.0x to 3.9x | 460 (16.3%) | 751 (21.8%) |
| 4.0x or more | 923 (32.6%) | 643 (18.6%) |
| Total | 2,830 (100.0%) | 3,452 (100.0%) |
Real Estate Taxes by Mortgage Status in Winneshiek County

| Property Taxes | Without Mortgage | With Mortgage |
| Less than $800 | 158 (5.6%) | 0 (0.0%) |
| $800 to $1,499 | 481 (17.0%) | 208 (6.0%) |
| $800 to $1,499 | 2,133 (75.4%) | 376 (10.9%) |
| Total | 2,830 (100.0%) | 3,452 (100.0%) |
Health & Disability in Winneshiek County
Health Insurance Coverage by Age in Winneshiek County
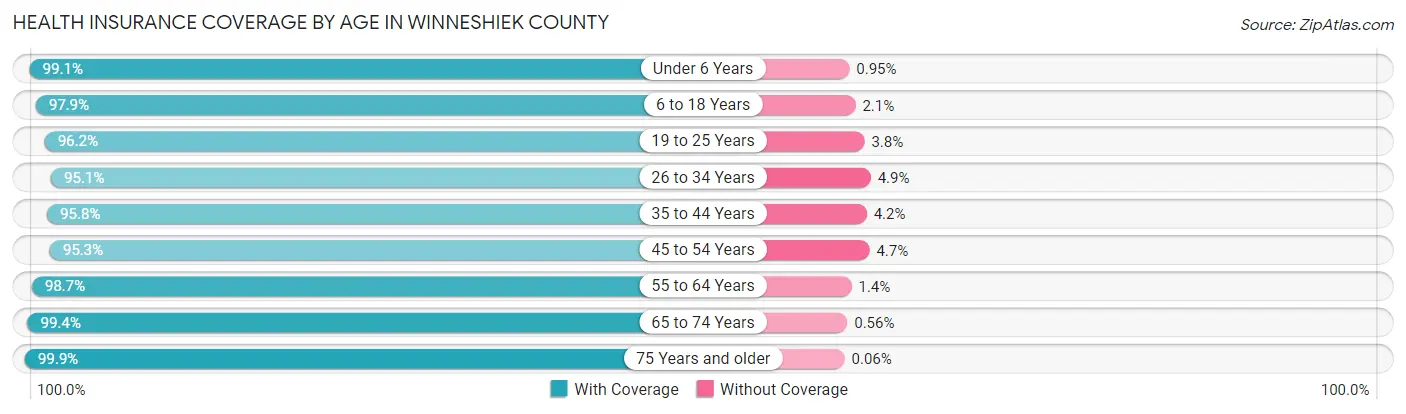
| Age Bracket | With Coverage | Without Coverage |
| Under 6 Years | 1,142 (99.1%) | 11 (0.9%) |
| 6 to 18 Years | 3,039 (97.9%) | 65 (2.1%) |
| 19 to 25 Years | 2,406 (96.2%) | 94 (3.8%) |
| 26 to 34 Years | 1,543 (95.1%) | 80 (4.9%) |
| 35 to 44 Years | 1,925 (95.8%) | 84 (4.2%) |
| 45 to 54 Years | 2,047 (95.3%) | 101 (4.7%) |
| 55 to 64 Years | 2,993 (98.7%) | 41 (1.3%) |
| 65 to 74 Years | 2,482 (99.4%) | 14 (0.6%) |
| 75 Years and older | 1,749 (99.9%) | 1 (0.1%) |
| Total | 19,326 (97.5%) | 491 (2.5%) |
Health Insurance Coverage by Citizenship Status in Winneshiek County

| Citizenship Status | With Coverage | Without Coverage |
| Native Born | 1,142 (99.1%) | 11 (0.9%) |
| Foreign Born, Citizen | 3,039 (97.9%) | 65 (2.1%) |
| Foreign Born, not a Citizen | 2,406 (96.2%) | 94 (3.8%) |
Health Insurance Coverage by Household Income in Winneshiek County
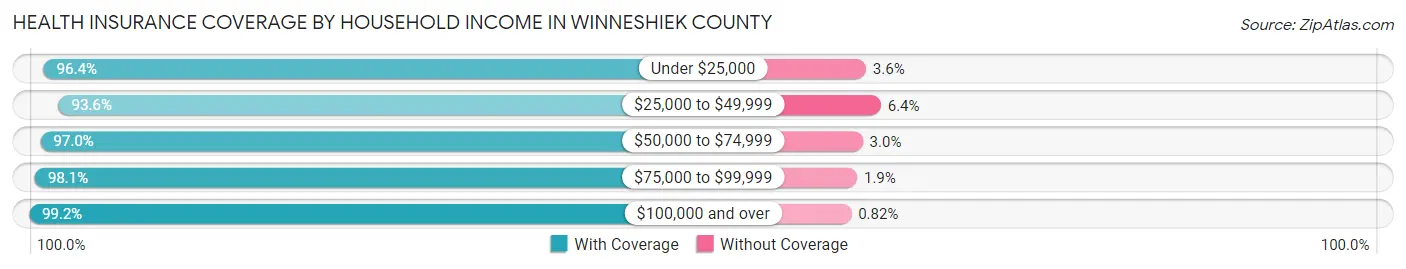
| Household Income | With Coverage | Without Coverage |
| Under $25,000 | 1,723 (96.4%) | 64 (3.6%) |
| $25,000 to $49,999 | 2,647 (93.6%) | 180 (6.4%) |
| $50,000 to $74,999 | 3,037 (97.0%) | 93 (3.0%) |
| $75,000 to $99,999 | 3,275 (98.1%) | 64 (1.9%) |
| $100,000 and over | 6,860 (99.2%) | 57 (0.8%) |
Public vs Private Health Insurance Coverage by Age in Winneshiek County
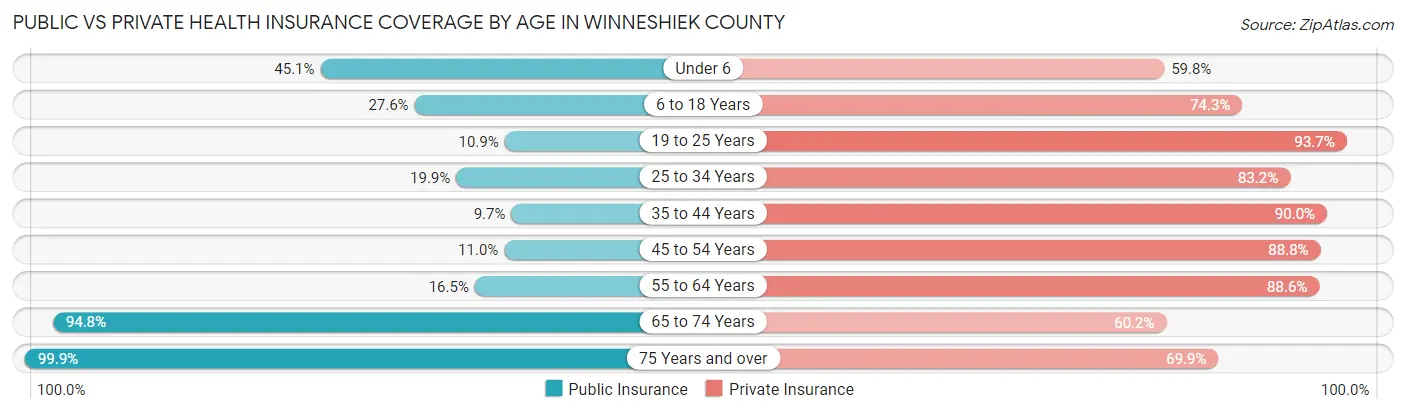
| Age Bracket | Public Insurance | Private Insurance |
| Under 6 | 520 (45.1%) | 690 (59.8%) |
| 6 to 18 Years | 858 (27.6%) | 2,307 (74.3%) |
| 19 to 25 Years | 273 (10.9%) | 2,342 (93.7%) |
| 25 to 34 Years | 323 (19.9%) | 1,350 (83.2%) |
| 35 to 44 Years | 194 (9.7%) | 1,809 (90.0%) |
| 45 to 54 Years | 236 (11.0%) | 1,908 (88.8%) |
| 55 to 64 Years | 499 (16.5%) | 2,688 (88.6%) |
| 65 to 74 Years | 2,365 (94.8%) | 1,503 (60.2%) |
| 75 Years and over | 1,749 (99.9%) | 1,223 (69.9%) |
| Total | 7,017 (35.4%) | 15,820 (79.8%) |
Disability Status by Sex by Age in Winneshiek County
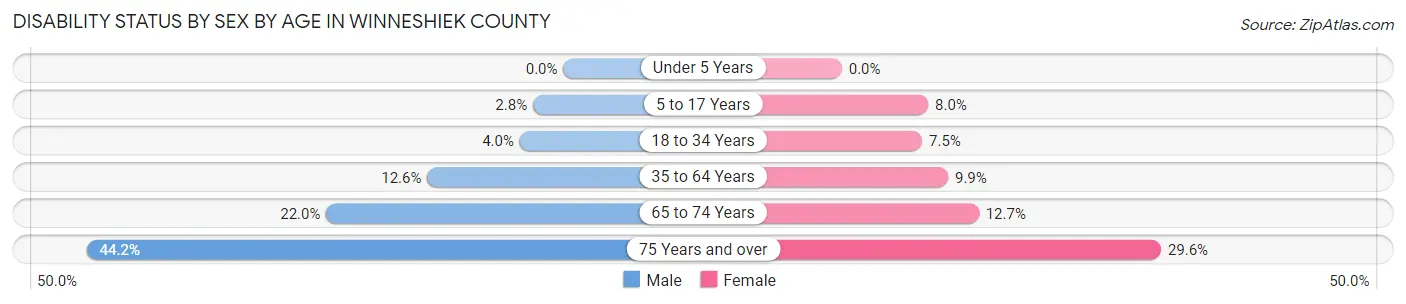
| Age Bracket | Male | Female |
| Under 5 Years | 0 (0.0%) | 0 (0.0%) |
| 5 to 17 Years | 41 (2.8%) | 106 (8.0%) |
| 18 to 34 Years | 91 (4.0%) | 179 (7.4%) |
| 35 to 64 Years | 469 (12.6%) | 343 (9.9%) |
| 65 to 74 Years | 286 (22.0%) | 152 (12.7%) |
| 75 Years and over | 353 (44.2%) | 282 (29.6%) |
Disability Class by Sex by Age in Winneshiek County
Disability Class: Hearing Difficulty
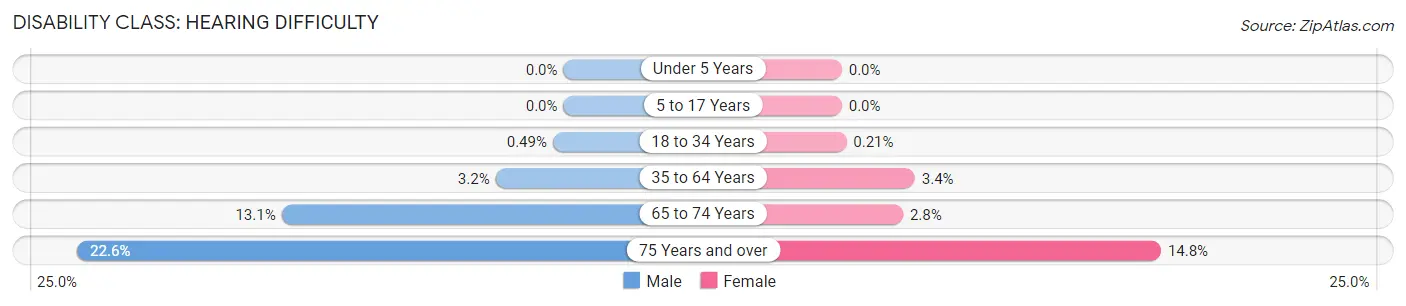
| Age Bracket | Male | Female |
| Under 5 Years | 0 (0.0%) | 0 (0.0%) |
| 5 to 17 Years | 0 (0.0%) | 0 (0.0%) |
| 18 to 34 Years | 11 (0.5%) | 5 (0.2%) |
| 35 to 64 Years | 117 (3.2%) | 118 (3.4%) |
| 65 to 74 Years | 170 (13.1%) | 34 (2.8%) |
| 75 Years and over | 180 (22.6%) | 141 (14.8%) |
Disability Class: Vision Difficulty

| Age Bracket | Male | Female |
| Under 5 Years | 0 (0.0%) | 0 (0.0%) |
| 5 to 17 Years | 1 (0.1%) | 14 (1.1%) |
| 18 to 34 Years | 0 (0.0%) | 113 (4.7%) |
| 35 to 64 Years | 72 (1.9%) | 57 (1.6%) |
| 65 to 74 Years | 25 (1.9%) | 13 (1.1%) |
| 75 Years and over | 74 (9.3%) | 38 (4.0%) |
Disability Class: Cognitive Difficulty
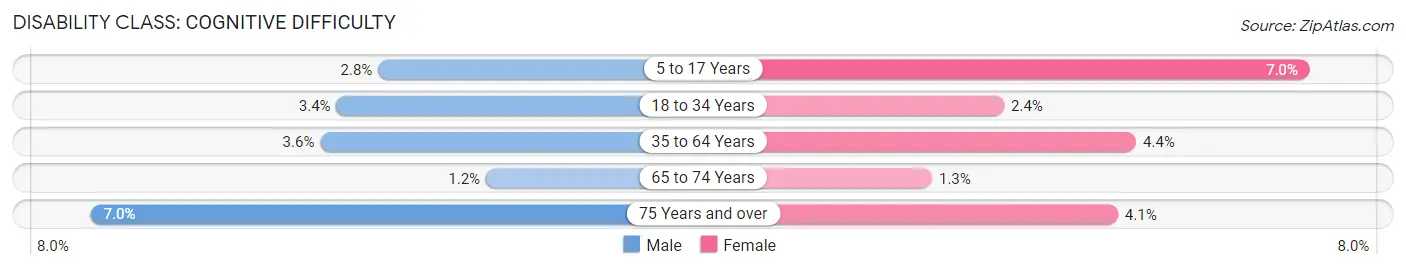
| Age Bracket | Male | Female |
| 5 to 17 Years | 40 (2.8%) | 92 (7.0%) |
| 18 to 34 Years | 76 (3.4%) | 58 (2.4%) |
| 35 to 64 Years | 134 (3.6%) | 152 (4.4%) |
| 65 to 74 Years | 15 (1.1%) | 16 (1.3%) |
| 75 Years and over | 56 (7.0%) | 39 (4.1%) |
Disability Class: Ambulatory Difficulty
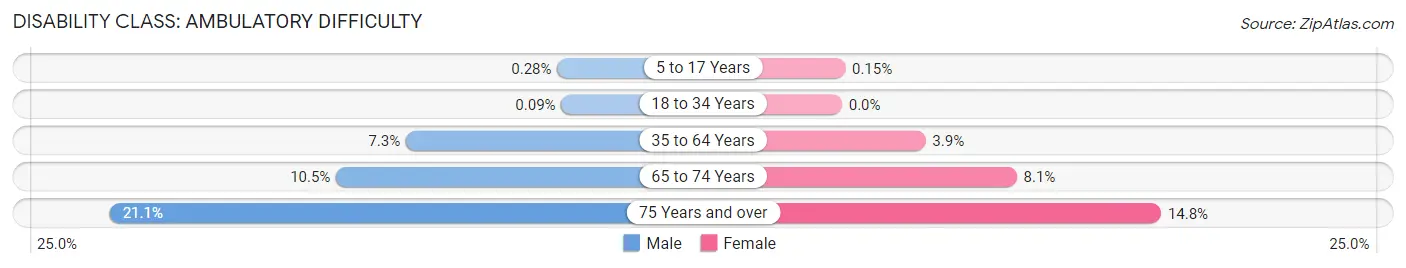
| Age Bracket | Male | Female |
| 5 to 17 Years | 4 (0.3%) | 2 (0.2%) |
| 18 to 34 Years | 2 (0.1%) | 0 (0.0%) |
| 35 to 64 Years | 271 (7.3%) | 135 (3.9%) |
| 65 to 74 Years | 137 (10.5%) | 97 (8.1%) |
| 75 Years and over | 168 (21.0%) | 141 (14.8%) |
Disability Class: Self-Care Difficulty
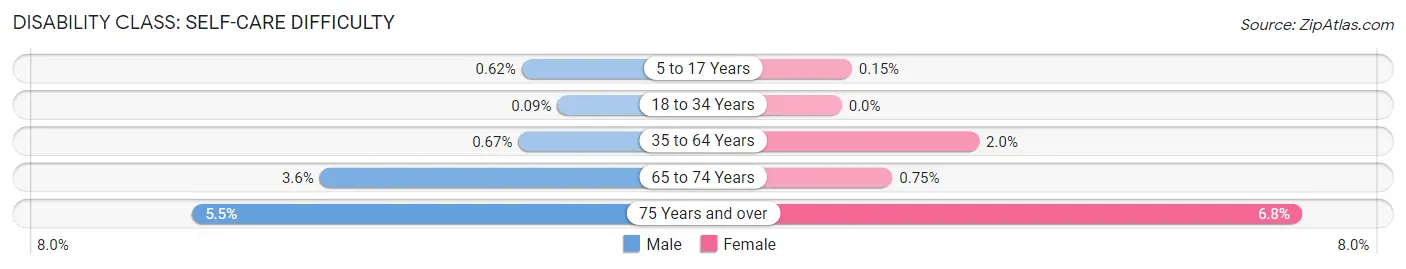
| Age Bracket | Male | Female |
| 5 to 17 Years | 9 (0.6%) | 2 (0.2%) |
| 18 to 34 Years | 2 (0.1%) | 0 (0.0%) |
| 35 to 64 Years | 25 (0.7%) | 71 (2.0%) |
| 65 to 74 Years | 47 (3.6%) | 9 (0.7%) |
| 75 Years and over | 44 (5.5%) | 65 (6.8%) |
Technology Access in Winneshiek County
Computing Device Access in Winneshiek County

| Device Type | # Households | % Households |
| Desktop or Laptop | 6,319 | 76.9% |
| Smartphone | 6,592 | 80.2% |
| Tablet | 4,693 | 57.1% |
| No Computing Device | 822 | 10.0% |
| Total | 8,218 | 100.0% |
Internet Access in Winneshiek County
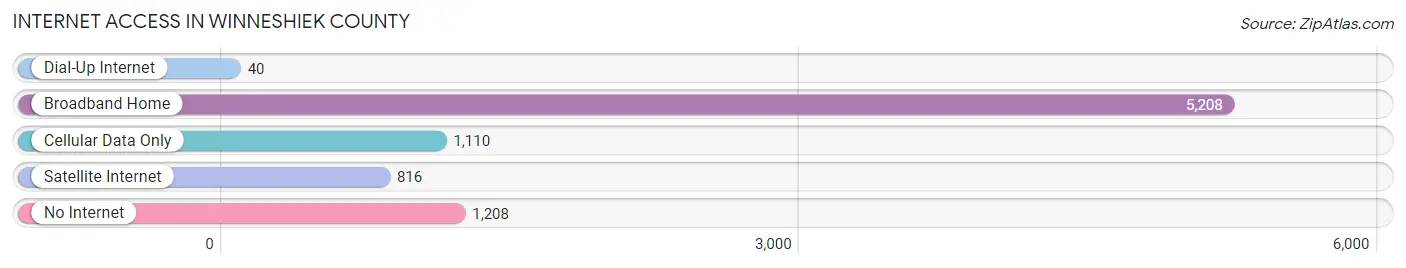
| Internet Type | # Households | % Households |
| Dial-Up Internet | 40 | 0.5% |
| Broadband Home | 5,208 | 63.4% |
| Cellular Data Only | 1,110 | 13.5% |
| Satellite Internet | 816 | 9.9% |
| No Internet | 1,208 | 14.7% |
| Total | 8,218 | 100.0% |
Winneshiek County Summary
Winneshiek County is located in the northeastern corner of Iowa, and is part of the Decorah Metropolitan Statistical Area. It is bordered by Allamakee County to the north, Fayette County to the east, Clayton County to the south, and Howard County to the west. The county seat is Decorah, and the county has a total area of 576 square miles.
History
Winneshiek County was established in 1848, and was named after the Winnebago tribe of Native Americans. The first settlers arrived in the area in 1849, and the county was officially organized in 1851. The first courthouse was built in 1853, and the county seat was moved to Decorah in 1855.
The county was home to several Native American tribes, including the Winnebago, Sioux, and Ojibwe. The first settlers were mostly of German and Norwegian descent, and the county was heavily influenced by these two cultures.
Geography
Winneshiek County is located in the Driftless Area of Iowa, which is characterized by its rugged terrain and rolling hills. The county is home to several rivers, including the Upper Iowa River, the Turkey River, and the Yellow River. The county is also home to several lakes, including Lake Meyer, Lake Hendricks, and Lake Oelwein.
The county is mostly rural, with the majority of the population living in small towns and villages. The largest city in the county is Decorah, which is home to about 8,000 people. Other cities in the county include Calmar, Ossian, and Fort Atkinson.
Economy
The economy of Winneshiek County is largely based on agriculture and tourism. The county is home to several large farms, and the main crops grown in the area are corn, soybeans, and hay. The county is also home to several wineries, and the area is known for its production of wine and other alcoholic beverages.
Tourism is also an important part of the county’s economy. The county is home to several popular attractions, including the Vesterheim Norwegian-American Museum, the Decorah Fish Hatchery, and the Effigy Mounds National Monument. The county is also home to several popular outdoor recreation areas, including the Upper Iowa River, the Yellow River, and the Turkey River.
Demographics
As of the 2010 census, the population of Winneshiek County was 21,056. The population is mostly white (96.3%), with small percentages of African American (1.2%), Asian (0.7%), and Native American (0.4%) residents. The median household income in the county is $50,945, and the median age is 40.7 years.
The county is home to several higher education institutions, including Luther College, Northeast Iowa Community College, and Upper Iowa University. The county is also home to several public school districts, including Decorah Community Schools, Mabel-Canton Public Schools, and South Winneshiek Community Schools.
Conclusion
Winneshiek County is a rural county located in the northeastern corner of Iowa. The county is home to several rivers and lakes, and is known for its rugged terrain and rolling hills. The economy of the county is largely based on agriculture and tourism, and the county is home to several higher education institutions and public school districts. The population of the county is mostly white, and the median household income is $50,945.
Common Questions
What is the Total Population of Winneshiek County?
Total Population of Winneshiek County is 20,050.
What is the Total Male Population of Winneshiek County?
Total Male Population of Winneshiek County is 10,072.
What is the Total Female Population of Winneshiek County?
Total Female Population of Winneshiek County is 9,978.
What is the Ratio of Males per 100 Females in Winneshiek County?
There are 100.94 Males per 100 Females in Winneshiek County.
What is the Ratio of Females per 100 Males in Winneshiek County?
There are 99.07 Females per 100 Males in Winneshiek County.
What is the Median Population Age in Winneshiek County?
Median Population Age in Winneshiek County is 42.6 Years.
What is the Average Family Size in Winneshiek County
Average Family Size in Winneshiek County is 2.7 People.
What is the Average Household Size in Winneshiek County
Average Household Size in Winneshiek County is 2.2 People.
What is Per Capita Income in Winneshiek County?
Per Capita income in Winneshiek County is $37,561.
What is the Median Family Income in Winneshiek County?
Median Family Income in Winneshiek County is $88,023.
What is the Median Household income in Winneshiek County?
Median Household Income in Winneshiek County is $67,770.
What is Income or Wage Gap in Winneshiek County?
Income or Wage Gap in Winneshiek County is 28.6%.
Women in Winneshiek County earn 71.4 cents for every dollar earned by a man.
What is Family Income Deficit in Winneshiek County?
Family Income Deficit in Winneshiek County is $6,287.
Families that are below poverty line in Winneshiek County earn $6,287 less on average than the poverty threshold level.
What is Inequality or Gini Index in Winneshiek County?
Inequality or Gini Index in Winneshiek County is 0.44.
How Large is the Labor Force in Winneshiek County?
There are 11,179 People in the Labor Forcein in Winneshiek County.
What is the Percentage of People in the Labor Force in Winneshiek County?
66.3% of People are in the Labor Force in Winneshiek County.
What is the Unemployment Rate in Winneshiek County?
Unemployment Rate in Winneshiek County is 2.1%.