Pottawattamie County, IA
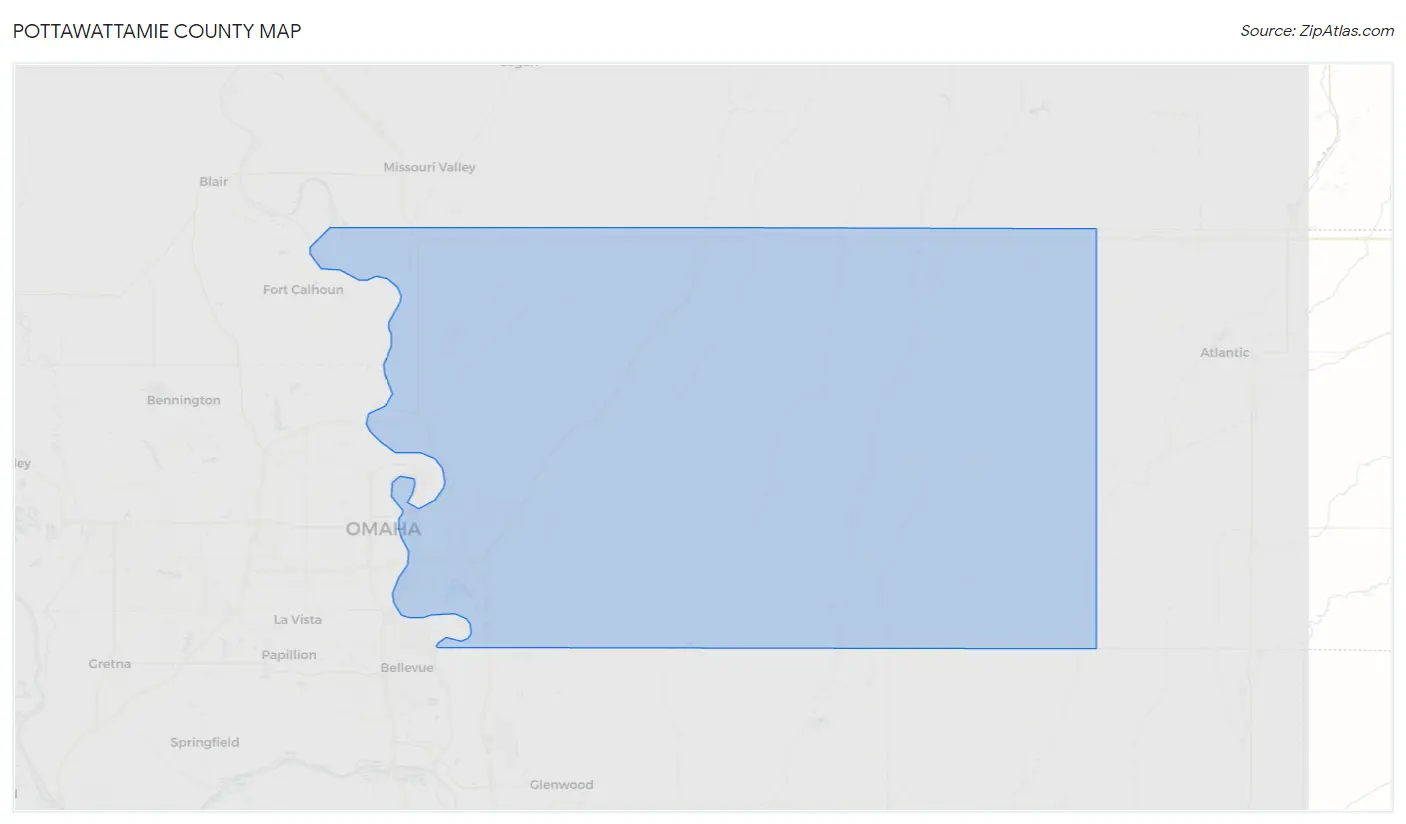
Pottawattamie County Map
Pottawattamie County Overview
93,543
TOTAL POPULATION
46,861
MALE POPULATION
46,682
FEMALE POPULATION
100.38
MALES / 100 FEMALES
99.62
FEMALES / 100 MALES
39.7
MEDIAN AGE
3.0
AVG FAMILY SIZE
2.5
AVG HOUSEHOLD SIZE
$34,701
PER CAPITA INCOME
$84,320
AVG FAMILY INCOME
$68,718
AVG HOUSEHOLD INCOME
25.1%
WAGE / INCOME GAP [ % ]
74.9¢/ $1
WAGE / INCOME GAP [ $ ]
$11,705
FAMILY INCOME DEFICIT
0.43
INEQUALITY / GINI INDEX
47,540
LABOR FORCE [ PEOPLE ]
63.8%
PERCENT IN LABOR FORCE
3.6%
UNEMPLOYMENT RATE
Pottawattamie County Area Codes
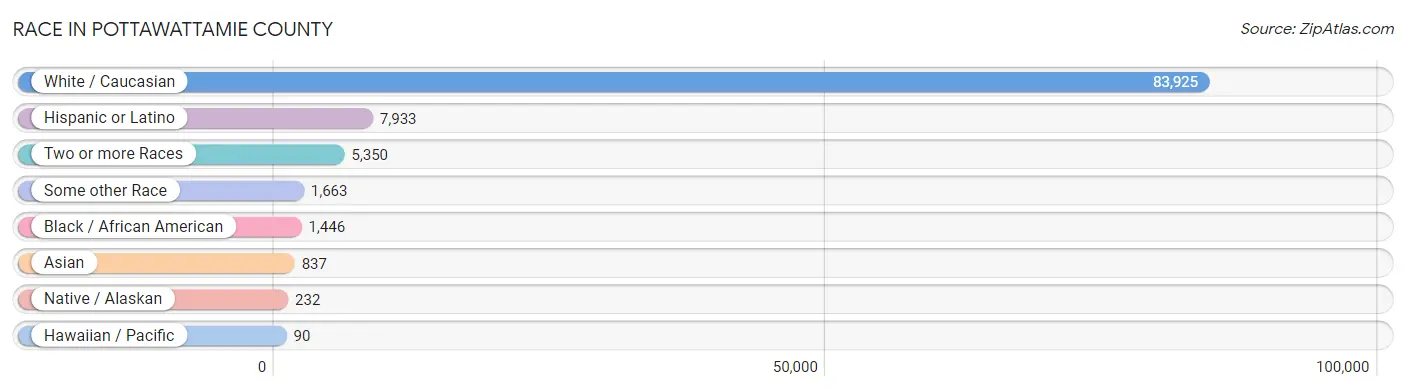
Race in Pottawattamie County
The most populous races in Pottawattamie County are White / Caucasian (83,925 | 89.7%), Hispanic or Latino (7,933 | 8.5%), and Two or more Races (5,350 | 5.7%).
| Race | # Population | % Population |
| Asian | 837 | 0.9% |
| Black / African American | 1,446 | 1.5% |
| Hawaiian / Pacific | 90 | 0.1% |
| Hispanic or Latino | 7,933 | 8.5% |
| Native / Alaskan | 232 | 0.3% |
| White / Caucasian | 83,925 | 89.7% |
| Two or more Races | 5,350 | 5.7% |
| Some other Race | 1,663 | 1.8% |
| Total | 93,543 | 100.0% |
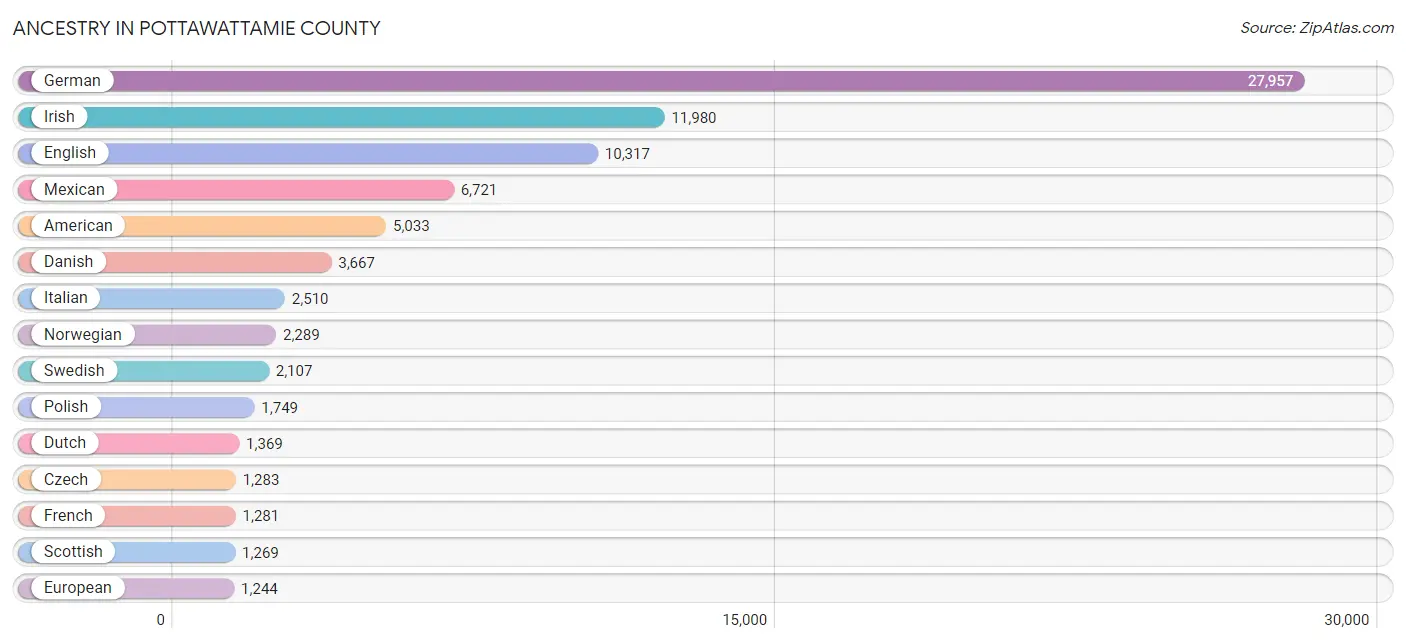
Ancestry in Pottawattamie County
The most populous ancestries reported in Pottawattamie County are German (27,957 | 29.9%), Irish (11,980 | 12.8%), English (10,317 | 11.0%), Mexican (6,721 | 7.2%), and American (5,033 | 5.4%), together accounting for 66.3% of all Pottawattamie County residents.
| Ancestry | # Population | % Population |
| African | 193 | 0.2% |
| American | 5,033 | 5.4% |
| Apache | 29 | 0.0% |
| Arab | 54 | 0.1% |
| Argentinean | 11 | 0.0% |
| Armenian | 5 | 0.0% |
| Australian | 62 | 0.1% |
| Austrian | 77 | 0.1% |
| Belgian | 64 | 0.1% |
| Bhutanese | 113 | 0.1% |
| Blackfeet | 3 | 0.0% |
| Brazilian | 25 | 0.0% |
| British | 332 | 0.4% |
| Bulgarian | 34 | 0.0% |
| Burmese | 183 | 0.2% |
| Canadian | 37 | 0.0% |
| Celtic | 2 | 0.0% |
| Central American | 515 | 0.5% |
| Central American Indian | 40 | 0.0% |
| Cherokee | 185 | 0.2% |
| Cheyenne | 18 | 0.0% |
| Chippewa | 55 | 0.1% |
| Choctaw | 8 | 0.0% |
| Colombian | 20 | 0.0% |
| Comanche | 17 | 0.0% |
| Costa Rican | 16 | 0.0% |
| Creek | 16 | 0.0% |
| Croatian | 116 | 0.1% |
| Cuban | 155 | 0.2% |
| Czech | 1,283 | 1.4% |
| Czechoslovakian | 274 | 0.3% |
| Danish | 3,667 | 3.9% |
| Delaware | 8 | 0.0% |
| Dutch | 1,369 | 1.5% |
| Dutch West Indian | 5 | 0.0% |
| Eastern European | 89 | 0.1% |
| Egyptian | 10 | 0.0% |
| English | 10,317 | 11.0% |
| Estonian | 19 | 0.0% |
| Ethiopian | 8 | 0.0% |
| European | 1,244 | 1.3% |
| Finnish | 14 | 0.0% |
| French | 1,281 | 1.4% |
| French Canadian | 170 | 0.2% |
| German | 27,957 | 29.9% |
| German Russian | 10 | 0.0% |
| Greek | 170 | 0.2% |
| Guatemalan | 284 | 0.3% |
| Honduran | 50 | 0.1% |
| Hungarian | 75 | 0.1% |
| Icelander | 82 | 0.1% |
| Indian (Asian) | 394 | 0.4% |
| Iranian | 20 | 0.0% |
| Irish | 11,980 | 12.8% |
| Italian | 2,510 | 2.7% |
| Jamaican | 9 | 0.0% |
| Kenyan | 1 | 0.0% |
| Korean | 331 | 0.4% |
| Lebanese | 17 | 0.0% |
| Lithuanian | 51 | 0.1% |
| Luxembourger | 140 | 0.2% |
| Macedonian | 5 | 0.0% |
| Malaysian | 27 | 0.0% |
| Mexican | 6,721 | 7.2% |
| Mexican American Indian | 77 | 0.1% |
| Moroccan | 6 | 0.0% |
| Native Hawaiian | 17 | 0.0% |
| Navajo | 36 | 0.0% |
| Nigerian | 13 | 0.0% |
| Northern European | 44 | 0.1% |
| Norwegian | 2,289 | 2.5% |
| Pakistani | 112 | 0.1% |
| Paraguayan | 13 | 0.0% |
| Pennsylvania German | 44 | 0.1% |
| Polish | 1,749 | 1.9% |
| Portuguese | 80 | 0.1% |
| Potawatomi | 30 | 0.0% |
| Puerto Rican | 196 | 0.2% |
| Romanian | 45 | 0.1% |
| Russian | 198 | 0.2% |
| Salvadoran | 165 | 0.2% |
| Samoan | 51 | 0.1% |
| Scandinavian | 388 | 0.4% |
| Scotch-Irish | 459 | 0.5% |
| Scottish | 1,269 | 1.4% |
| Serbian | 8 | 0.0% |
| Sioux | 101 | 0.1% |
| Slavic | 21 | 0.0% |
| Slovak | 37 | 0.0% |
| South American | 44 | 0.1% |
| Spaniard | 31 | 0.0% |
| Spanish | 20 | 0.0% |
| Spanish American | 5 | 0.0% |
| Sri Lankan | 83 | 0.1% |
| Subsaharan African | 227 | 0.2% |
| Sudanese | 12 | 0.0% |
| Swedish | 2,107 | 2.2% |
| Swiss | 145 | 0.2% |
| Syrian | 21 | 0.0% |
| Thai | 125 | 0.1% |
| Ukrainian | 59 | 0.1% |
| Ute | 20 | 0.0% |
| Welsh | 380 | 0.4% | View All 103 Rows |
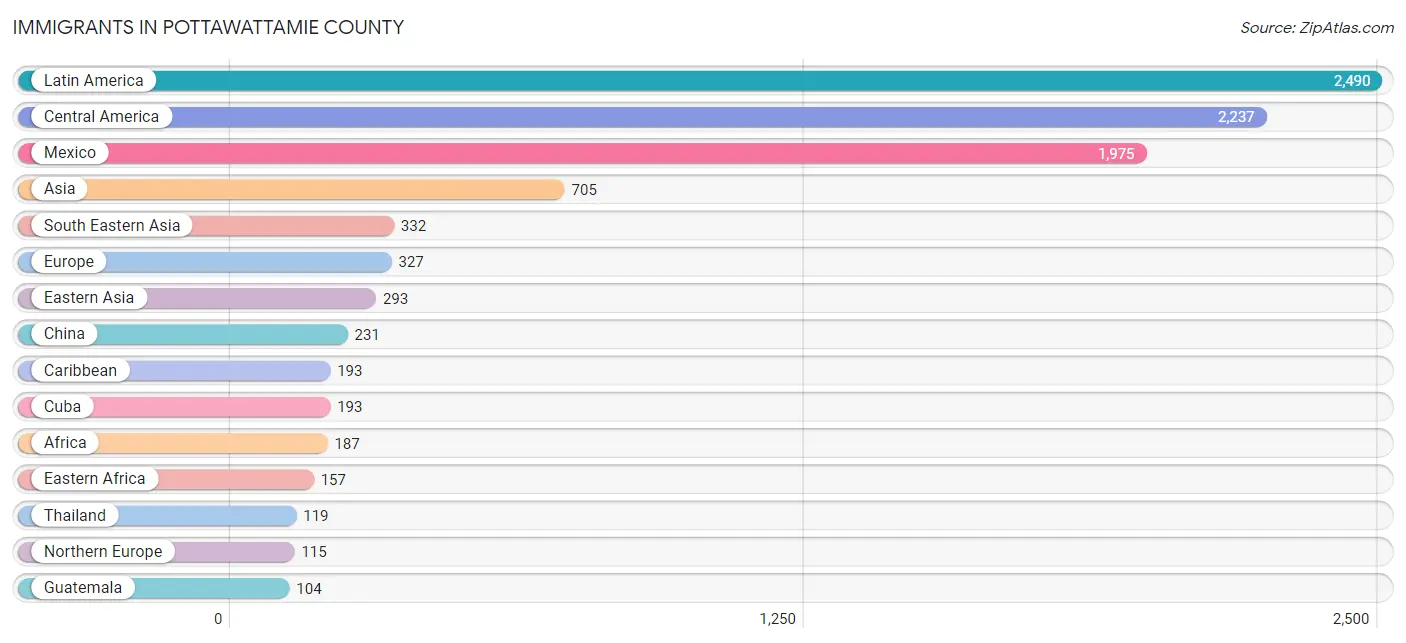
Immigrants in Pottawattamie County
The most numerous immigrant groups reported in Pottawattamie County came from Latin America (2,490 | 2.7%), Central America (2,237 | 2.4%), Mexico (1,975 | 2.1%), Asia (705 | 0.7%), and South Eastern Asia (332 | 0.4%), together accounting for 8.3% of all Pottawattamie County residents.
| Immigration Origin | # Population | % Population |
| Africa | 187 | 0.2% |
| Asia | 705 | 0.7% |
| Australia | 32 | 0.0% |
| Azores | 4 | 0.0% |
| Bosnia and Herzegovina | 12 | 0.0% |
| Brazil | 35 | 0.0% |
| Cambodia | 28 | 0.0% |
| Canada | 41 | 0.0% |
| Caribbean | 193 | 0.2% |
| Central America | 2,237 | 2.4% |
| China | 231 | 0.3% |
| Colombia | 18 | 0.0% |
| Congo | 6 | 0.0% |
| Costa Rica | 16 | 0.0% |
| Cuba | 193 | 0.2% |
| Czechoslovakia | 19 | 0.0% |
| Eastern Africa | 157 | 0.2% |
| Eastern Asia | 293 | 0.3% |
| Eastern Europe | 103 | 0.1% |
| El Salvador | 47 | 0.1% |
| England | 48 | 0.1% |
| Eritrea | 3 | 0.0% |
| Ethiopia | 8 | 0.0% |
| Europe | 327 | 0.4% |
| France | 6 | 0.0% |
| Germany | 63 | 0.1% |
| Greece | 9 | 0.0% |
| Guatemala | 104 | 0.1% |
| Honduras | 83 | 0.1% |
| Hong Kong | 21 | 0.0% |
| India | 80 | 0.1% |
| Japan | 5 | 0.0% |
| Korea | 57 | 0.1% |
| Latin America | 2,490 | 2.7% |
| Lithuania | 23 | 0.0% |
| Mexico | 1,975 | 2.1% |
| Micronesia | 29 | 0.0% |
| Middle Africa | 6 | 0.0% |
| Morocco | 6 | 0.0% |
| Nigeria | 1 | 0.0% |
| Northern Africa | 18 | 0.0% |
| Northern Europe | 115 | 0.1% |
| Norway | 21 | 0.0% |
| Oceania | 68 | 0.1% |
| Panama | 12 | 0.0% |
| Philippines | 102 | 0.1% |
| Portugal | 4 | 0.0% |
| Romania | 9 | 0.0% |
| South America | 60 | 0.1% |
| South Central Asia | 80 | 0.1% |
| South Eastern Asia | 332 | 0.4% |
| Southern Europe | 40 | 0.0% |
| Spain | 27 | 0.0% |
| Sudan | 12 | 0.0% |
| Thailand | 119 | 0.1% |
| Ukraine | 28 | 0.0% |
| Vietnam | 83 | 0.1% |
| Western Africa | 1 | 0.0% |
| Western Europe | 69 | 0.1% | View All 59 Rows |
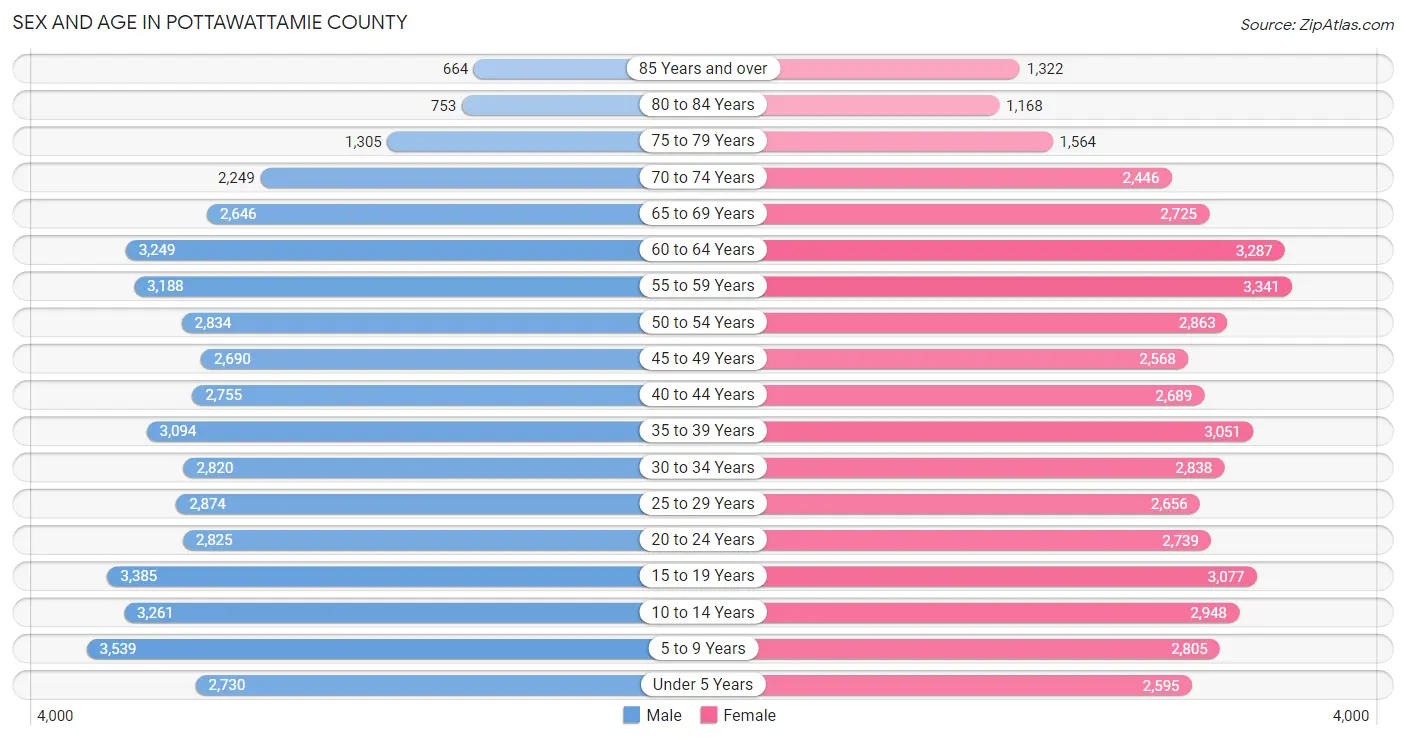
Sex and Age in Pottawattamie County
Sex and Age in Pottawattamie County
The most populous age groups in Pottawattamie County are 5 to 9 Years (3,539 | 7.5%) for men and 55 to 59 Years (3,341 | 7.2%) for women.
| Age Bracket | Male | Female |
| Under 5 Years | 2,730 (5.8%) | 2,595 (5.6%) |
| 5 to 9 Years | 3,539 (7.5%) | 2,805 (6.0%) |
| 10 to 14 Years | 3,261 (7.0%) | 2,948 (6.3%) |
| 15 to 19 Years | 3,385 (7.2%) | 3,077 (6.6%) |
| 20 to 24 Years | 2,825 (6.0%) | 2,739 (5.9%) |
| 25 to 29 Years | 2,874 (6.1%) | 2,656 (5.7%) |
| 30 to 34 Years | 2,820 (6.0%) | 2,838 (6.1%) |
| 35 to 39 Years | 3,094 (6.6%) | 3,051 (6.5%) |
| 40 to 44 Years | 2,755 (5.9%) | 2,689 (5.8%) |
| 45 to 49 Years | 2,690 (5.7%) | 2,568 (5.5%) |
| 50 to 54 Years | 2,834 (6.0%) | 2,863 (6.1%) |
| 55 to 59 Years | 3,188 (6.8%) | 3,341 (7.2%) |
| 60 to 64 Years | 3,249 (6.9%) | 3,287 (7.0%) |
| 65 to 69 Years | 2,646 (5.7%) | 2,725 (5.8%) |
| 70 to 74 Years | 2,249 (4.8%) | 2,446 (5.2%) |
| 75 to 79 Years | 1,305 (2.8%) | 1,564 (3.4%) |
| 80 to 84 Years | 753 (1.6%) | 1,168 (2.5%) |
| 85 Years and over | 664 (1.4%) | 1,322 (2.8%) |
| Total | 46,861 (100.0%) | 46,682 (100.0%) |
Families and Households in Pottawattamie County
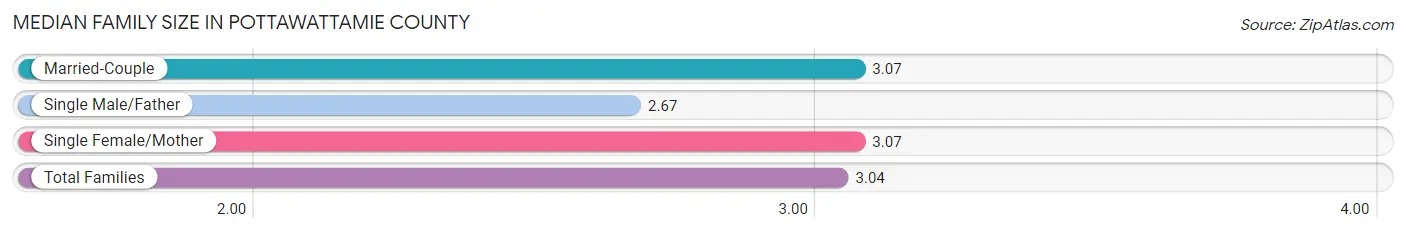
Median Family Size in Pottawattamie County
The median family size in Pottawattamie County is 3.04 persons per family, with married-couple families (17,156 | 72.5%) accounting for the largest median family size of 3.07 persons per family. On the other hand, single male/father families (1,841 | 7.8%) represent the smallest median family size with 2.67 persons per family.
| Family Type | # Families | Family Size |
| Married-Couple | 17,156 (72.5%) | 3.07 |
| Single Male/Father | 1,841 (7.8%) | 2.67 |
| Single Female/Mother | 4,652 (19.7%) | 3.07 |
| Total Families | 23,649 (100.0%) | 3.04 |
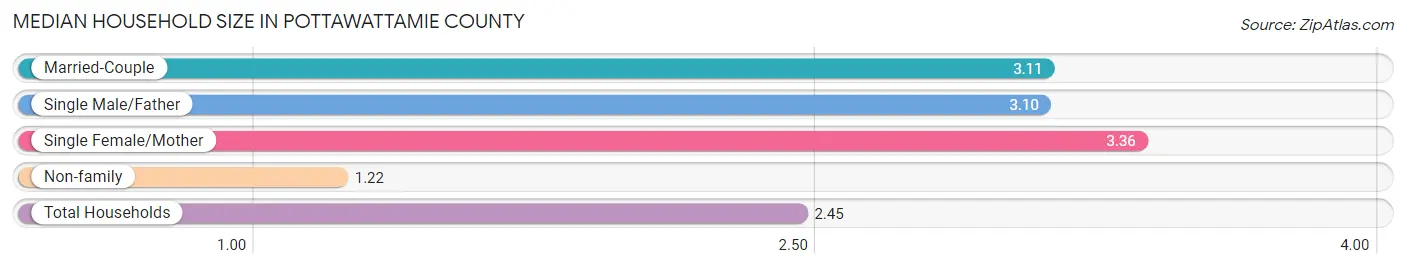
Median Household Size in Pottawattamie County
The median household size in Pottawattamie County is 2.45 persons per household, with single female/mother households (4,652 | 12.5%) accounting for the largest median household size of 3.36 persons per household. non-family households (13,513 | 36.4%) represent the smallest median household size with 1.22 persons per household.
| Household Type | # Households | Household Size |
| Married-Couple | 17,156 (46.2%) | 3.11 |
| Single Male/Father | 1,841 (5.0%) | 3.10 |
| Single Female/Mother | 4,652 (12.5%) | 3.36 |
| Non-family | 13,513 (36.4%) | 1.22 |
| Total Households | 37,162 (100.0%) | 2.45 |
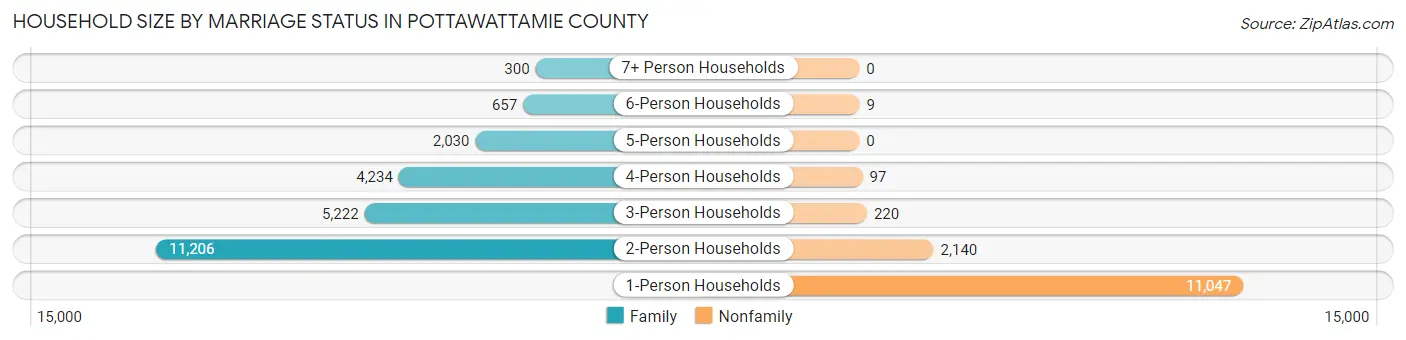
Household Size by Marriage Status in Pottawattamie County
Out of a total of 37,162 households in Pottawattamie County, 23,649 (63.6%) are family households, while 13,513 (36.4%) are nonfamily households. The most numerous type of family households are 2-person households, comprising 11,206, and the most common type of nonfamily households are 1-person households, comprising 11,047.
| Household Size | Family Households | Nonfamily Households |
| 1-Person Households | - | 11,047 (29.7%) |
| 2-Person Households | 11,206 (30.1%) | 2,140 (5.8%) |
| 3-Person Households | 5,222 (14.1%) | 220 (0.6%) |
| 4-Person Households | 4,234 (11.4%) | 97 (0.3%) |
| 5-Person Households | 2,030 (5.5%) | 0 (0.0%) |
| 6-Person Households | 657 (1.8%) | 9 (0.0%) |
| 7+ Person Households | 300 (0.8%) | 0 (0.0%) |
| Total | 23,649 (63.6%) | 13,513 (36.4%) |
Female Fertility in Pottawattamie County
Fertility by Age in Pottawattamie County
Average fertility rate in Pottawattamie County is 45.0 births per 1,000 women. Women in the age bracket of 20 to 34 years have the highest fertility rate with 89.0 births per 1,000 women. Women in the age bracket of 20 to 34 years acount for 81.1% of all women with births.
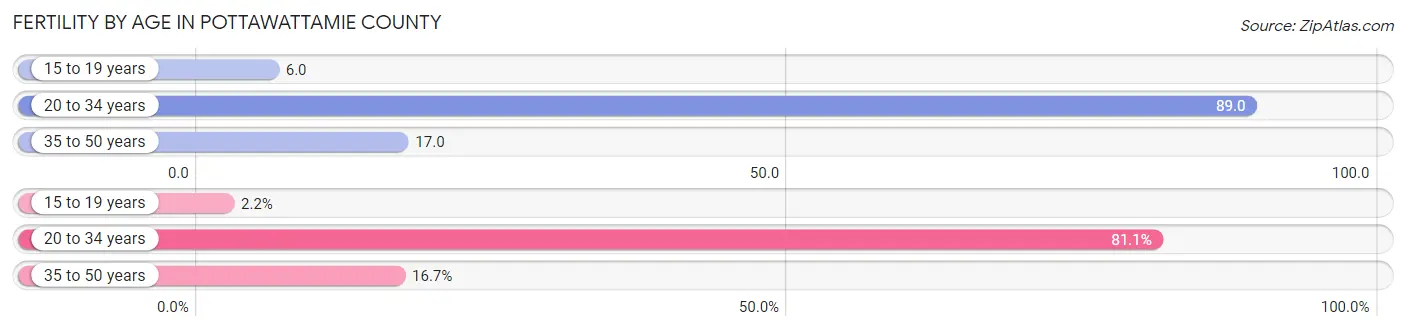
| Age Bracket | Women with Births | Births / 1,000 Women |
| 15 to 19 years | 20 (2.2%) | 6.0 |
| 20 to 34 years | 732 (81.1%) | 89.0 |
| 35 to 50 years | 151 (16.7%) | 17.0 |
| Total | 903 (100.0%) | 45.0 |
Fertility by Age by Marriage Status in Pottawattamie County
53.3% of women with births (903) in Pottawattamie County are married. The highest percentage of unmarried women with births falls into 15 to 19 years age bracket with 100.0% of them unmarried at the time of birth, while the lowest percentage of unmarried women with births belong to 35 to 50 years age bracket with 8.6% of them unmarried.
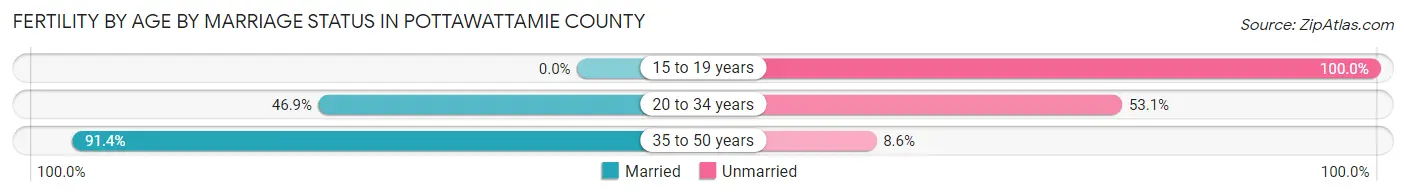
| Age Bracket | Married | Unmarried |
| 15 to 19 years | 0 (0.0%) | 20 (100.0%) |
| 20 to 34 years | 343 (46.9%) | 389 (53.1%) |
| 35 to 50 years | 138 (91.4%) | 13 (8.6%) |
| Total | 481 (53.3%) | 422 (46.7%) |
Fertility by Education in Pottawattamie County
Average fertility rate in Pottawattamie County is 45.0 births per 1,000 women. Women with the education attainment of bachelor's degree have the highest fertility rate of 74.0 births per 1,000 women, while women with the education attainment of graduate degree have the lowest fertility at 29.0 births per 1,000 women. Women with the education attainment of bachelor's degree represent 28.5% of all women with births.
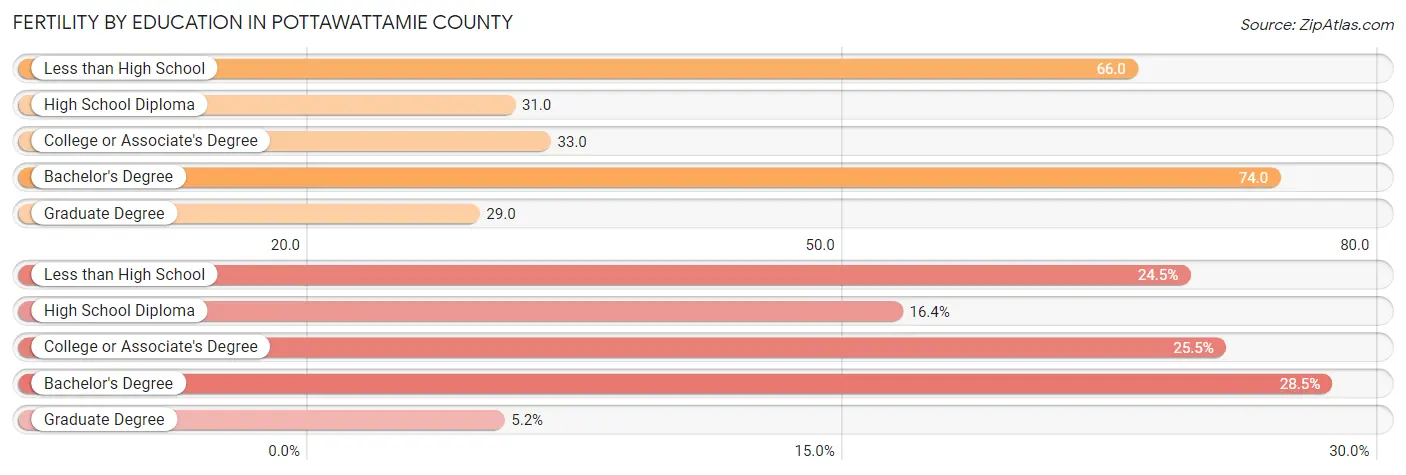
| Educational Attainment | Women with Births | Births / 1,000 Women |
| Less than High School | 221 (24.5%) | 66.0 |
| High School Diploma | 148 (16.4%) | 31.0 |
| College or Associate's Degree | 230 (25.5%) | 33.0 |
| Bachelor's Degree | 257 (28.5%) | 74.0 |
| Graduate Degree | 47 (5.2%) | 29.0 |
| Total | 903 (100.0%) | 45.0 |
Fertility by Education by Marriage Status in Pottawattamie County
46.7% of women with births in Pottawattamie County are unmarried. Women with the educational attainment of graduate degree are most likely to be married with 100.0% of them married at childbirth, while women with the educational attainment of less than high school are least likely to be married with 80.1% of them unmarried at childbirth.
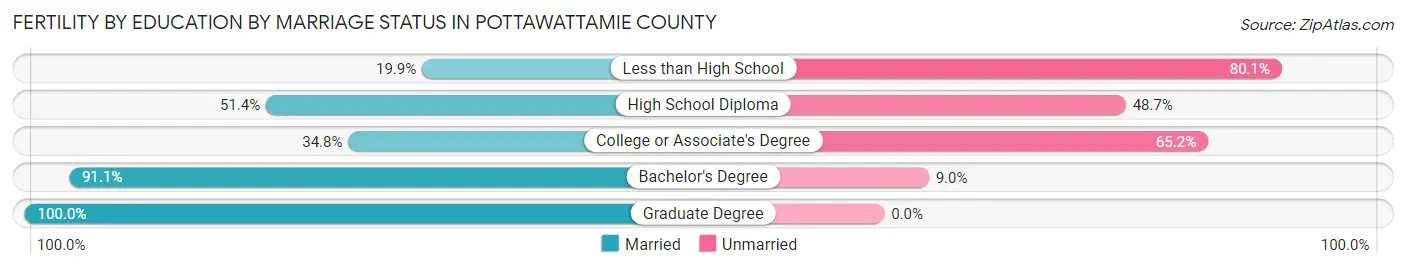
| Educational Attainment | Married | Unmarried |
| Less than High School | 44 (19.9%) | 177 (80.1%) |
| High School Diploma | 76 (51.3%) | 72 (48.6%) |
| College or Associate's Degree | 80 (34.8%) | 150 (65.2%) |
| Bachelor's Degree | 234 (91.0%) | 23 (8.9%) |
| Graduate Degree | 47 (100.0%) | 0 (0.0%) |
| Total | 481 (53.3%) | 422 (46.7%) |
Income in Pottawattamie County
Income Overview in Pottawattamie County
Per Capita Income in Pottawattamie County is $34,701, while median incomes of families and households are $84,320 and $68,718 respectively.
| Characteristic | Number | Measure |
| Per Capita Income | 93,543 | $34,701 |
| Median Family Income | 23,649 | $84,320 |
| Mean Family Income | 23,649 | $101,558 |
| Median Household Income | 37,162 | $68,718 |
| Mean Household Income | 37,162 | $85,937 |
| Income Deficit | 23,649 | $11,705 |
| Wage / Income Gap (%) | 93,543 | 25.12% |
| Wage / Income Gap ($) | 93,543 | 74.88¢ per $1 |
| Gini / Inequality Index | 93,543 | 0.43 |
Earnings by Sex in Pottawattamie County
Average Earnings in Pottawattamie County are $40,680, $47,375 for men and $35,476 for women, a difference of 25.1%.
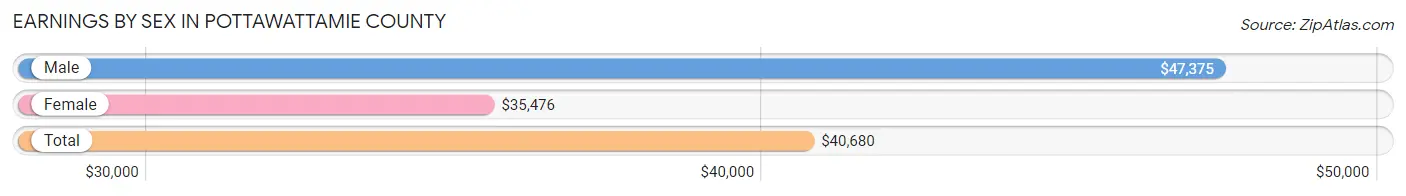
| Sex | Number | Average Earnings |
| Male | 25,892 (52.0%) | $47,375 |
| Female | 23,855 (47.9%) | $35,476 |
| Total | 49,747 (100.0%) | $40,680 |
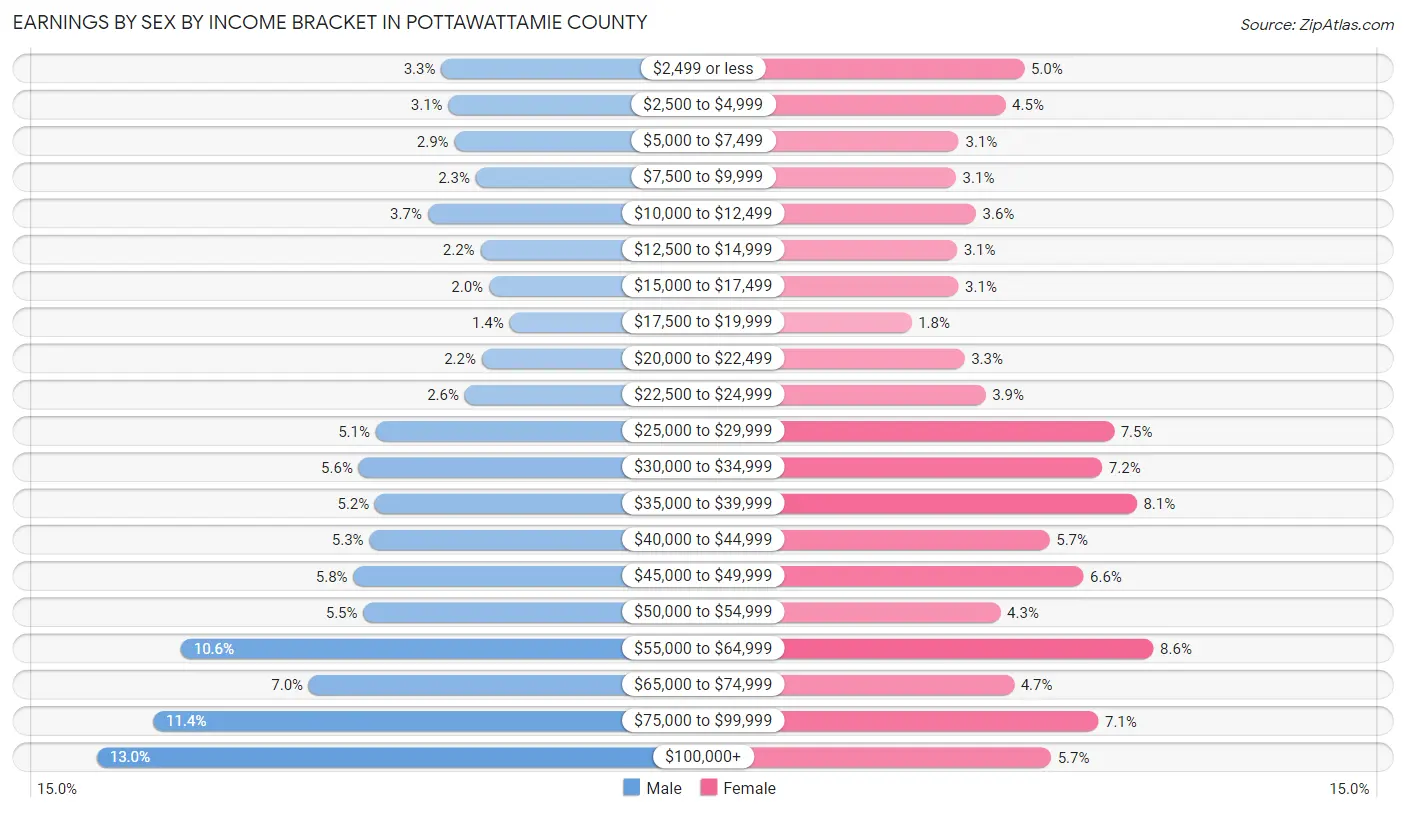
Earnings by Sex by Income Bracket in Pottawattamie County
The most common earnings brackets in Pottawattamie County are $100,000+ for men (3,358 | 13.0%) and $55,000 to $64,999 for women (2,054 | 8.6%).
| Income | Male | Female |
| $2,499 or less | 853 (3.3%) | 1,187 (5.0%) |
| $2,500 to $4,999 | 801 (3.1%) | 1,062 (4.4%) |
| $5,000 to $7,499 | 757 (2.9%) | 748 (3.1%) |
| $7,500 to $9,999 | 601 (2.3%) | 729 (3.1%) |
| $10,000 to $12,499 | 951 (3.7%) | 863 (3.6%) |
| $12,500 to $14,999 | 566 (2.2%) | 738 (3.1%) |
| $15,000 to $17,499 | 505 (1.9%) | 747 (3.1%) |
| $17,500 to $19,999 | 354 (1.4%) | 431 (1.8%) |
| $20,000 to $22,499 | 557 (2.1%) | 787 (3.3%) |
| $22,500 to $24,999 | 682 (2.6%) | 928 (3.9%) |
| $25,000 to $29,999 | 1,327 (5.1%) | 1,789 (7.5%) |
| $30,000 to $34,999 | 1,452 (5.6%) | 1,711 (7.2%) |
| $35,000 to $39,999 | 1,333 (5.1%) | 1,942 (8.1%) |
| $40,000 to $44,999 | 1,374 (5.3%) | 1,357 (5.7%) |
| $45,000 to $49,999 | 1,491 (5.8%) | 1,585 (6.6%) |
| $50,000 to $54,999 | 1,419 (5.5%) | 1,028 (4.3%) |
| $55,000 to $64,999 | 2,748 (10.6%) | 2,054 (8.6%) |
| $65,000 to $74,999 | 1,815 (7.0%) | 1,119 (4.7%) |
| $75,000 to $99,999 | 2,948 (11.4%) | 1,684 (7.1%) |
| $100,000+ | 3,358 (13.0%) | 1,366 (5.7%) |
| Total | 25,892 (100.0%) | 23,855 (100.0%) |
Earnings by Sex by Educational Attainment in Pottawattamie County
Average earnings in Pottawattamie County are $53,565 for men and $39,606 for women, a difference of 26.1%. Men with an educational attainment of graduate degree enjoy the highest average annual earnings of $83,949, while those with less than high school education earn the least with $42,824. Women with an educational attainment of graduate degree earn the most with the average annual earnings of $69,099, while those with less than high school education have the smallest earnings of $31,500.
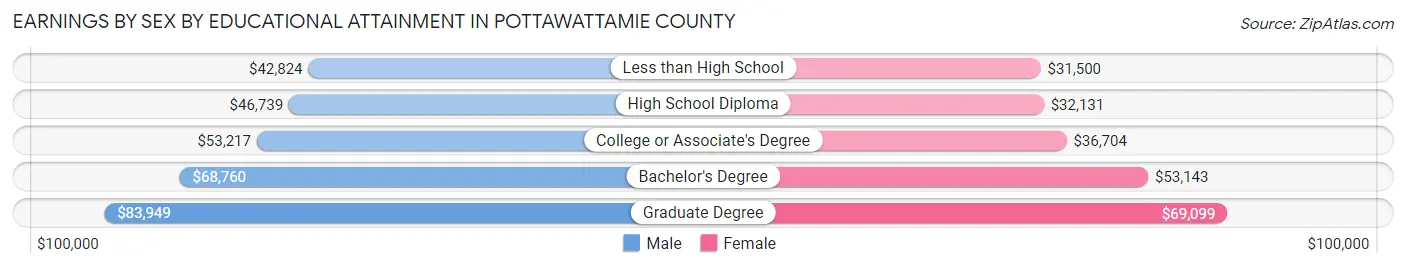
| Educational Attainment | Male Income | Female Income |
| Less than High School | $42,824 | $31,500 |
| High School Diploma | $46,739 | $32,131 |
| College or Associate's Degree | $53,217 | $36,704 |
| Bachelor's Degree | $68,760 | $53,143 |
| Graduate Degree | $83,949 | $69,099 |
| Total | $53,565 | $39,606 |
Family Income in Pottawattamie County
Family Income Brackets in Pottawattamie County
According to the Pottawattamie County family income data, there are 5,321 families falling into the $100,000 to $149,999 income range, which is the most common income bracket and makes up 22.5% of all families. Conversely, the $10,000 to $14,999 income bracket is the least frequent group with only 497 families (2.1%) belonging to this category.
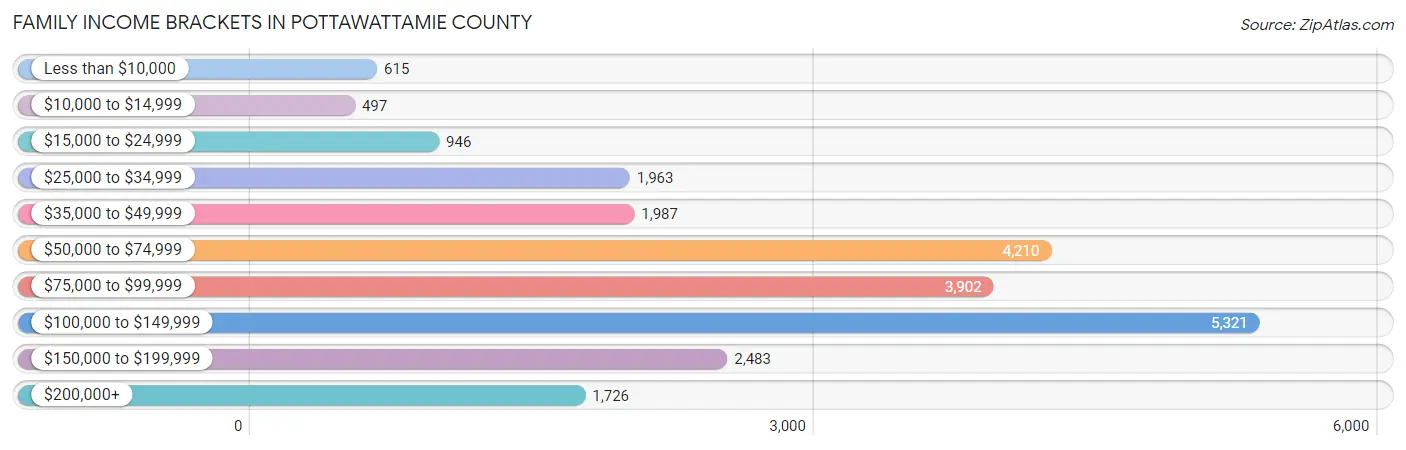
| Income Bracket | # Families | % Families |
| Less than $10,000 | 615 | 2.6% |
| $10,000 to $14,999 | 497 | 2.1% |
| $15,000 to $24,999 | 946 | 4.0% |
| $25,000 to $34,999 | 1,963 | 8.3% |
| $35,000 to $49,999 | 1,987 | 8.4% |
| $50,000 to $74,999 | 4,210 | 17.8% |
| $75,000 to $99,999 | 3,902 | 16.5% |
| $100,000 to $149,999 | 5,321 | 22.5% |
| $150,000 to $199,999 | 2,483 | 10.5% |
| $200,000+ | 1,726 | 7.3% |
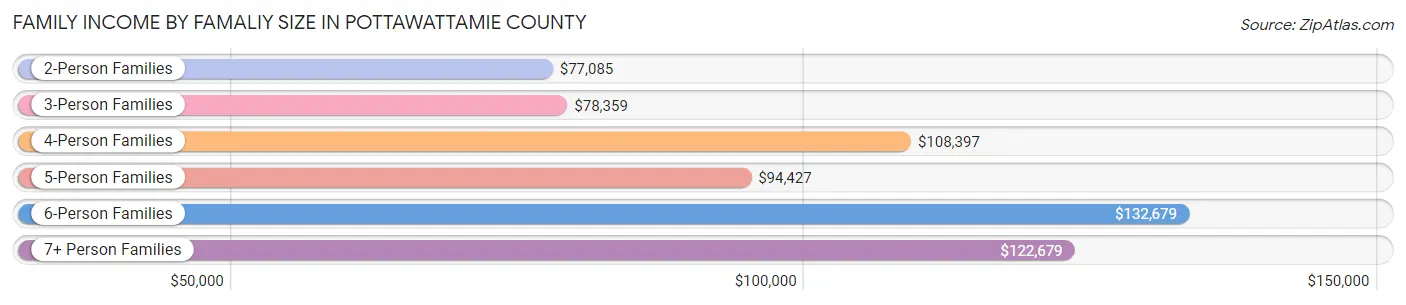
Family Income by Famaliy Size in Pottawattamie County
6-person families (617 | 2.6%) account for the highest median family income in Pottawattamie County with $132,679 per family, while 2-person families (12,299 | 52.0%) have the highest median income of $38,542 per family member.
| Income Bracket | # Families | Median Income |
| 2-Person Families | 12,299 (52.0%) | $77,085 |
| 3-Person Families | 4,860 (20.5%) | $78,359 |
| 4-Person Families | 3,899 (16.5%) | $108,397 |
| 5-Person Families | 1,773 (7.5%) | $94,427 |
| 6-Person Families | 617 (2.6%) | $132,679 |
| 7+ Person Families | 201 (0.9%) | $122,679 |
| Total | 23,649 (100.0%) | $84,320 |
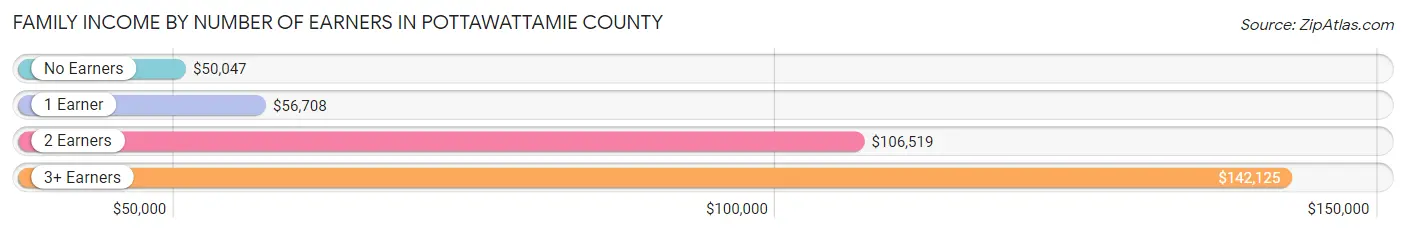
Family Income by Number of Earners in Pottawattamie County
The median family income in Pottawattamie County is $84,320, with families comprising 3+ earners (2,385) having the highest median family income of $142,125, while families with no earners (4,035) have the lowest median family income of $50,047, accounting for 10.1% and 17.1% of families, respectively.
| Number of Earners | # Families | Median Income |
| No Earners | 4,035 (17.1%) | $50,047 |
| 1 Earner | 7,017 (29.7%) | $56,708 |
| 2 Earners | 10,212 (43.2%) | $106,519 |
| 3+ Earners | 2,385 (10.1%) | $142,125 |
| Total | 23,649 (100.0%) | $84,320 |
Household Income in Pottawattamie County
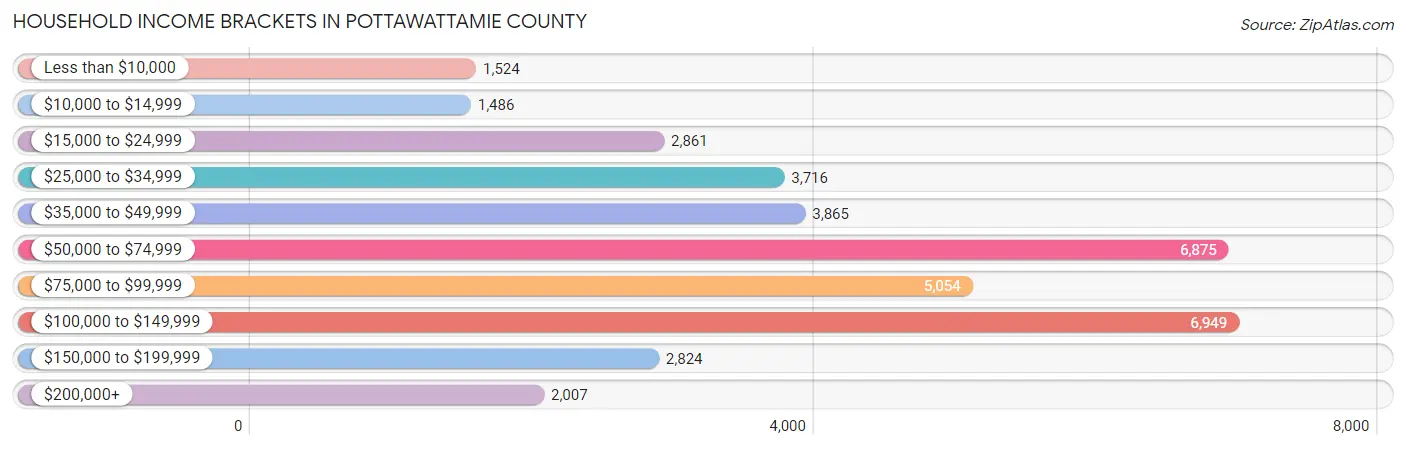
Household Income Brackets in Pottawattamie County
With 6,949 households falling in the category, the $100,000 to $149,999 income range is the most frequent in Pottawattamie County, accounting for 18.7% of all households. In contrast, only 1,486 households (4.0%) fall into the $10,000 to $14,999 income bracket, making it the least populous group.
| Income Bracket | # Households | % Households |
| Less than $10,000 | 1,524 | 4.1% |
| $10,000 to $14,999 | 1,486 | 4.0% |
| $15,000 to $24,999 | 2,861 | 7.7% |
| $25,000 to $34,999 | 3,716 | 10.0% |
| $35,000 to $49,999 | 3,865 | 10.4% |
| $50,000 to $74,999 | 6,875 | 18.5% |
| $75,000 to $99,999 | 5,054 | 13.6% |
| $100,000 to $149,999 | 6,949 | 18.7% |
| $150,000 to $199,999 | 2,824 | 7.6% |
| $200,000+ | 2,007 | 5.4% |
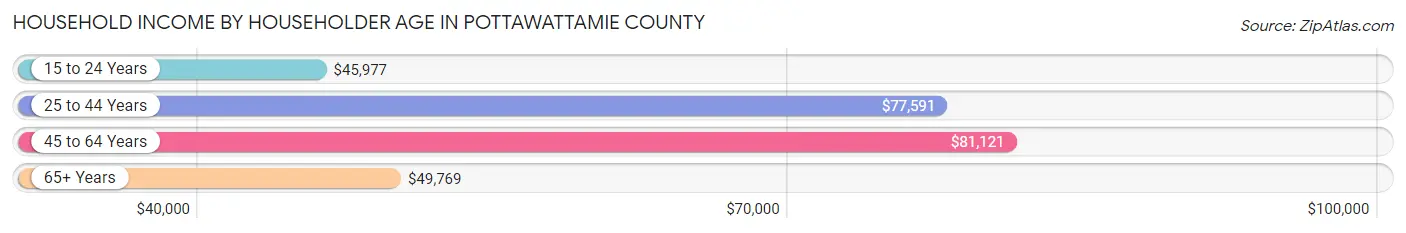
Household Income by Householder Age in Pottawattamie County
The median household income in Pottawattamie County is $68,718, with the highest median household income of $81,121 found in the 45 to 64 years age bracket for the primary householder. A total of 14,101 households (37.9%) fall into this category. Meanwhile, the 15 to 24 years age bracket for the primary householder has the lowest median household income of $45,977, with 1,576 households (4.2%) in this group.
| Income Bracket | # Households | Median Income |
| 15 to 24 Years | 1,576 (4.2%) | $45,977 |
| 25 to 44 Years | 10,929 (29.4%) | $77,591 |
| 45 to 64 Years | 14,101 (37.9%) | $81,121 |
| 65+ Years | 10,556 (28.4%) | $49,769 |
| Total | 37,162 (100.0%) | $68,718 |
Poverty in Pottawattamie County
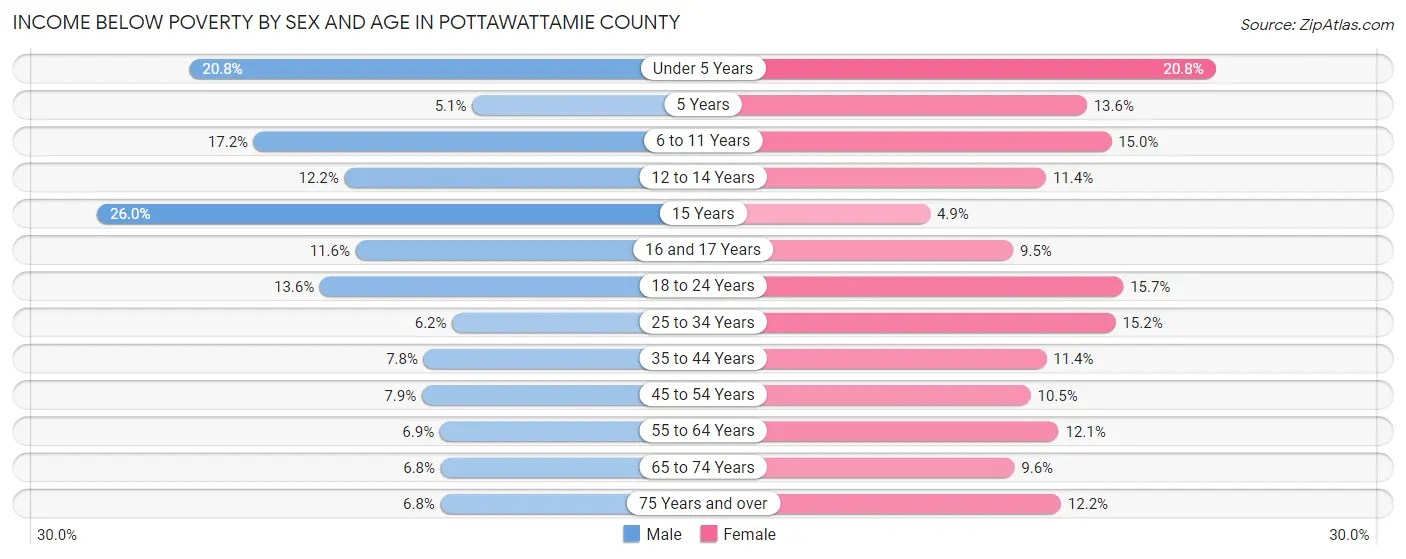
Income Below Poverty by Sex and Age in Pottawattamie County
With 9.9% poverty level for males and 12.8% for females among the residents of Pottawattamie County, 15 year old males and under 5 year old females are the most vulnerable to poverty, with 176 males (26.0%) and 537 females (20.8%) in their respective age groups living below the poverty level.
| Age Bracket | Male | Female |
| Under 5 Years | 545 (20.8%) | 537 (20.8%) |
| 5 Years | 33 (5.1%) | 106 (13.6%) |
| 6 to 11 Years | 742 (17.2%) | 483 (15.0%) |
| 12 to 14 Years | 208 (12.2%) | 192 (11.4%) |
| 15 Years | 176 (26.0%) | 23 (4.9%) |
| 16 and 17 Years | 144 (11.6%) | 132 (9.5%) |
| 18 to 24 Years | 485 (13.6%) | 557 (15.7%) |
| 25 to 34 Years | 345 (6.2%) | 830 (15.2%) |
| 35 to 44 Years | 451 (7.8%) | 651 (11.4%) |
| 45 to 54 Years | 429 (7.9%) | 568 (10.5%) |
| 55 to 64 Years | 439 (6.9%) | 798 (12.1%) |
| 65 to 74 Years | 328 (6.8%) | 489 (9.6%) |
| 75 Years and over | 182 (6.8%) | 444 (12.2%) |
| Total | 4,507 (9.9%) | 5,810 (12.8%) |
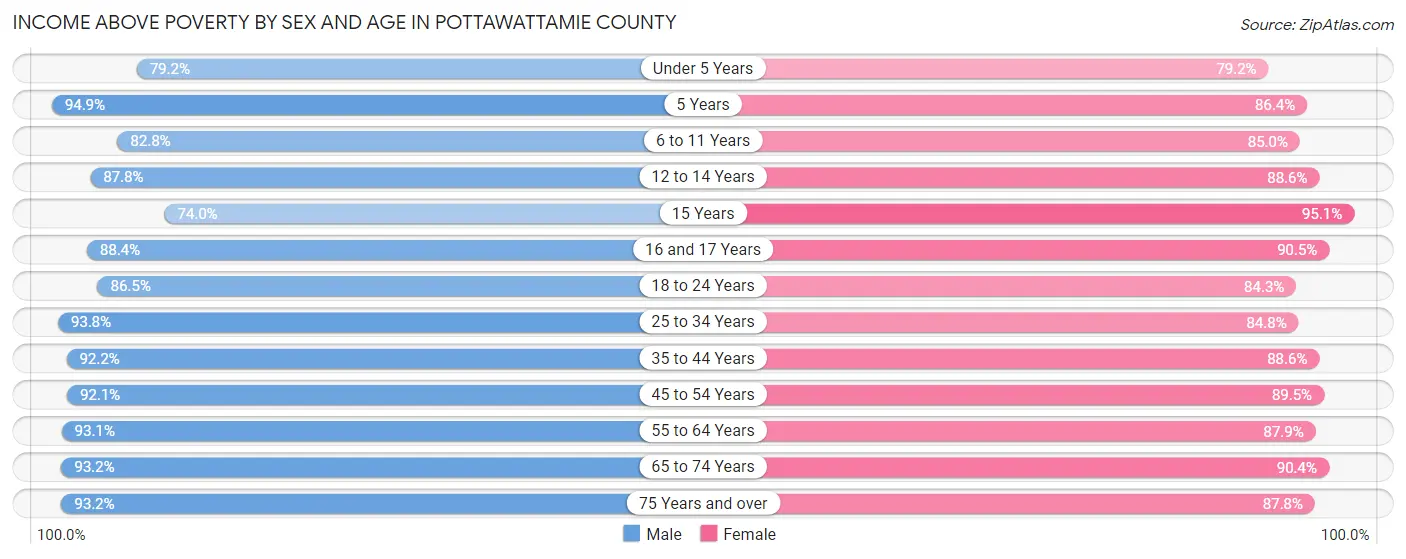
Income Above Poverty by Sex and Age in Pottawattamie County
According to the poverty statistics in Pottawattamie County, males aged 5 years and females aged 15 years are the age groups that are most secure financially, with 94.9% of males and 95.1% of females in these age groups living above the poverty line.
| Age Bracket | Male | Female |
| Under 5 Years | 2,073 (79.2%) | 2,044 (79.2%) |
| 5 Years | 618 (94.9%) | 671 (86.4%) |
| 6 to 11 Years | 3,565 (82.8%) | 2,738 (85.0%) |
| 12 to 14 Years | 1,500 (87.8%) | 1,496 (88.6%) |
| 15 Years | 502 (74.0%) | 445 (95.1%) |
| 16 and 17 Years | 1,102 (88.4%) | 1,252 (90.5%) |
| 18 to 24 Years | 3,095 (86.5%) | 2,997 (84.3%) |
| 25 to 34 Years | 5,234 (93.8%) | 4,617 (84.8%) |
| 35 to 44 Years | 5,355 (92.2%) | 5,064 (88.6%) |
| 45 to 54 Years | 5,021 (92.1%) | 4,838 (89.5%) |
| 55 to 64 Years | 5,955 (93.1%) | 5,811 (87.9%) |
| 65 to 74 Years | 4,481 (93.2%) | 4,597 (90.4%) |
| 75 Years and over | 2,483 (93.2%) | 3,196 (87.8%) |
| Total | 40,984 (90.1%) | 39,766 (87.3%) |
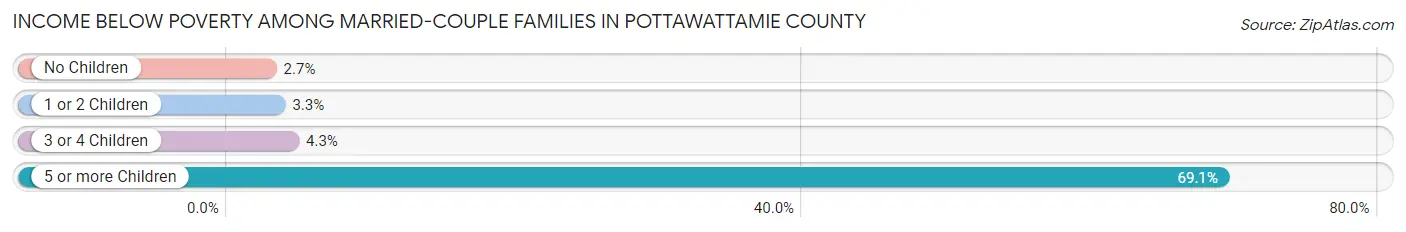
Income Below Poverty Among Married-Couple Families in Pottawattamie County
The poverty statistics for married-couple families in Pottawattamie County show that 3.2% or 540 of the total 17,156 families live below the poverty line. Families with 5 or more children have the highest poverty rate of 69.1%, comprising of 29 families. On the other hand, families with no children have the lowest poverty rate of 2.7%, which includes 298 families.
| Children | Above Poverty | Below Poverty |
| No Children | 10,792 (97.3%) | 298 (2.7%) |
| 1 or 2 Children | 4,369 (96.7%) | 149 (3.3%) |
| 3 or 4 Children | 1,442 (95.8%) | 64 (4.3%) |
| 5 or more Children | 13 (30.9%) | 29 (69.1%) |
| Total | 16,616 (96.9%) | 540 (3.2%) |
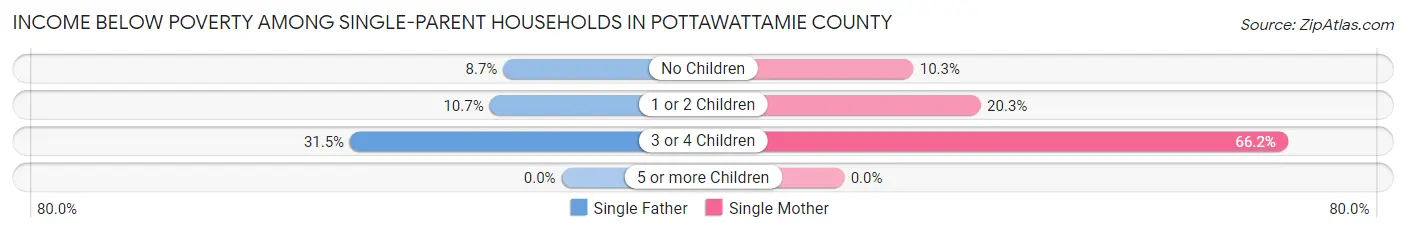
Income Below Poverty Among Single-Parent Households in Pottawattamie County
According to the poverty data in Pottawattamie County, 11.8% or 218 single-father households and 24.3% or 1,130 single-mother households are living below the poverty line. Among single-father households, those with 3 or 4 children have the highest poverty rate, with 58 households (31.5%) experiencing poverty. Likewise, among single-mother households, those with 3 or 4 children have the highest poverty rate, with 471 households (66.1%) falling below the poverty line.
| Children | Single Father | Single Mother |
| No Children | 75 (8.7%) | 146 (10.3%) |
| 1 or 2 Children | 85 (10.7%) | 513 (20.3%) |
| 3 or 4 Children | 58 (31.5%) | 471 (66.1%) |
| 5 or more Children | 0 (0.0%) | 0 (0.0%) |
| Total | 218 (11.8%) | 1,130 (24.3%) |
Income Below Poverty Among Married-Couple vs Single-Parent Households in Pottawattamie County
The poverty data for Pottawattamie County shows that 540 of the married-couple family households (3.2%) and 1,348 of the single-parent households (20.8%) are living below the poverty level. Within the married-couple family households, those with 5 or more children have the highest poverty rate, with 29 households (69.1%) falling below the poverty line. Among the single-parent households, those with 3 or 4 children have the highest poverty rate, with 529 household (59.0%) living below poverty.
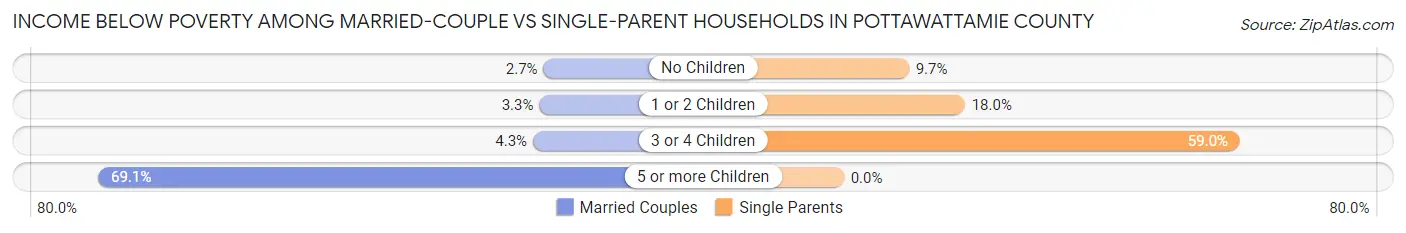
| Children | Married-Couple Families | Single-Parent Households |
| No Children | 298 (2.7%) | 221 (9.7%) |
| 1 or 2 Children | 149 (3.3%) | 598 (18.0%) |
| 3 or 4 Children | 64 (4.3%) | 529 (59.0%) |
| 5 or more Children | 29 (69.1%) | 0 (0.0%) |
| Total | 540 (3.2%) | 1,348 (20.8%) |
Employment Characteristics in Pottawattamie County
Employment by Class of Employer in Pottawattamie County
Among the 45,090 employed individuals in Pottawattamie County, private company employees (31,696 | 70.3%), not-for-profit organizations (4,084 | 9.1%), and local government employees (3,040 | 6.7%) make up the most common classes of employment.
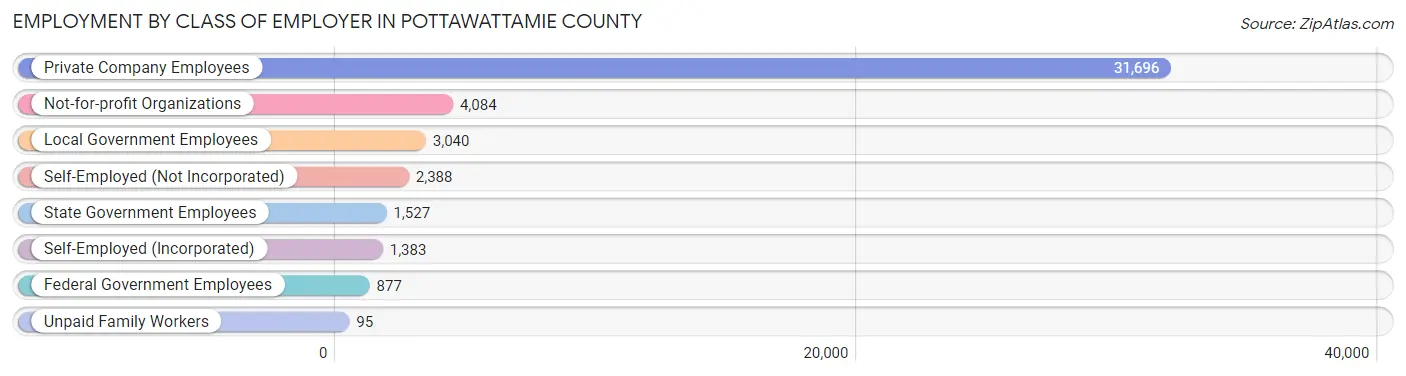
| Employer Class | # Employees | % Employees |
| Private Company Employees | 31,696 | 70.3% |
| Self-Employed (Incorporated) | 1,383 | 3.1% |
| Self-Employed (Not Incorporated) | 2,388 | 5.3% |
| Not-for-profit Organizations | 4,084 | 9.1% |
| Local Government Employees | 3,040 | 6.7% |
| State Government Employees | 1,527 | 3.4% |
| Federal Government Employees | 877 | 1.9% |
| Unpaid Family Workers | 95 | 0.2% |
| Total | 45,090 | 100.0% |
Employment Status by Age in Pottawattamie County
According to the labor force statistics for Pottawattamie County, out of the total population over 16 years of age (74,514), 63.8% or 47,540 individuals are in the labor force, with 3.6% or 1,711 of them unemployed. The age group with the highest labor force participation rate is 35 to 44 years, with 87.0% or 10,082 individuals in the labor force. Within the labor force, the 20 to 24 years age range has the highest percentage of unemployed individuals, with 10.0% or 448 of them being unemployed.
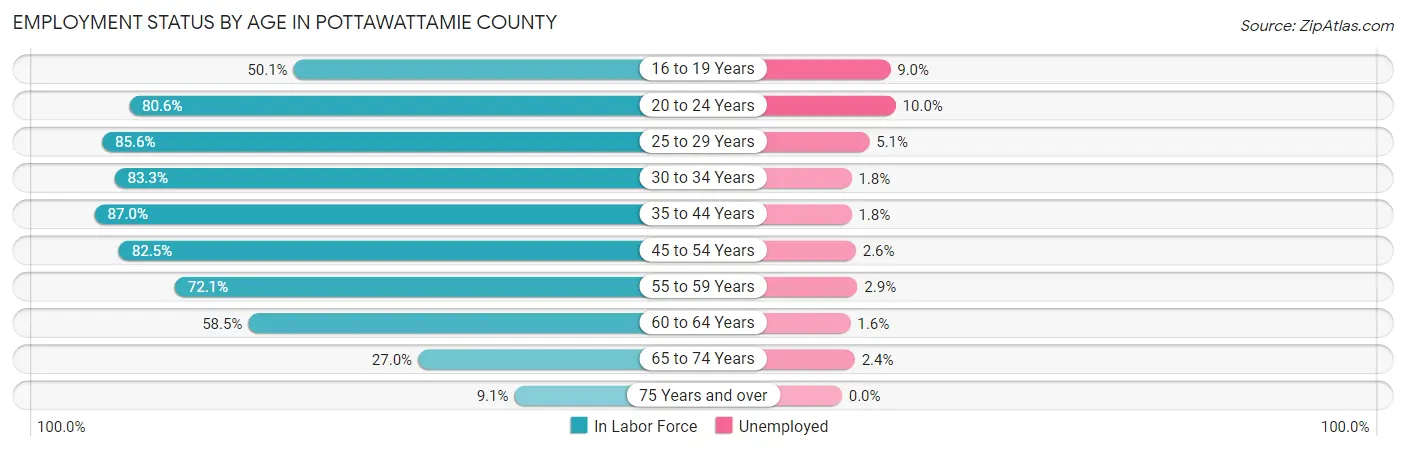
| Age Bracket | In Labor Force | Unemployed |
| 16 to 19 Years | 2,661 (50.1%) | 239 (9.0%) |
| 20 to 24 Years | 4,485 (80.6%) | 448 (10.0%) |
| 25 to 29 Years | 4,734 (85.6%) | 241 (5.1%) |
| 30 to 34 Years | 4,713 (83.3%) | 85 (1.8%) |
| 35 to 44 Years | 10,082 (87.0%) | 181 (1.8%) |
| 45 to 54 Years | 9,038 (82.5%) | 235 (2.6%) |
| 55 to 59 Years | 4,707 (72.1%) | 137 (2.9%) |
| 60 to 64 Years | 3,824 (58.5%) | 61 (1.6%) |
| 65 to 74 Years | 2,718 (27.0%) | 65 (2.4%) |
| 75 Years and over | 617 (9.1%) | 0 (0.0%) |
| Total | 47,540 (63.8%) | 1,711 (3.6%) |
Employment Status by Educational Attainment in Pottawattamie County
According to labor force statistics for Pottawattamie County, 79.3% of individuals (37,110) out of the total population between 25 and 64 years of age (46,797) are in the labor force, with 2.5% or 928 of them being unemployed. The group with the highest labor force participation rate are those with the educational attainment of bachelor's degree or higher, with 88.6% or 10,262 individuals in the labor force. Within the labor force, individuals with less than high school education have the highest percentage of unemployment, with 6.6% or 178 of them being unemployed.
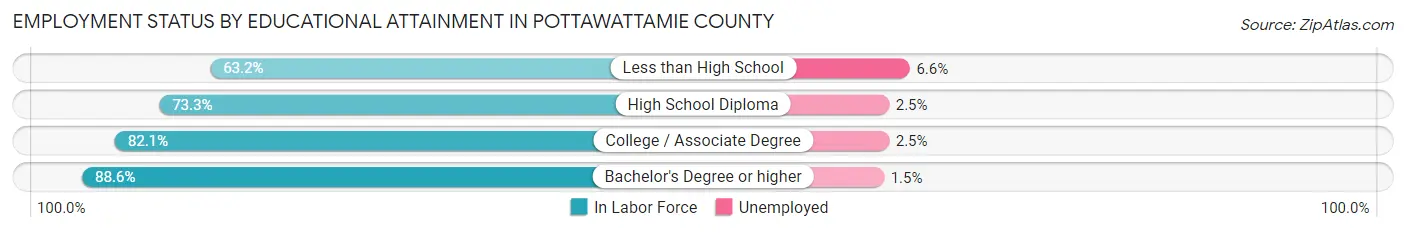
| Educational Attainment | In Labor Force | Unemployed |
| Less than High School | 2,698 (63.2%) | 282 (6.6%) |
| High School Diploma | 10,552 (73.3%) | 360 (2.5%) |
| College / Associate Degree | 13,588 (82.1%) | 414 (2.5%) |
| Bachelor's Degree or higher | 10,262 (88.6%) | 174 (1.5%) |
| Total | 37,110 (79.3%) | 1,170 (2.5%) |
Employment Occupations by Sex in Pottawattamie County
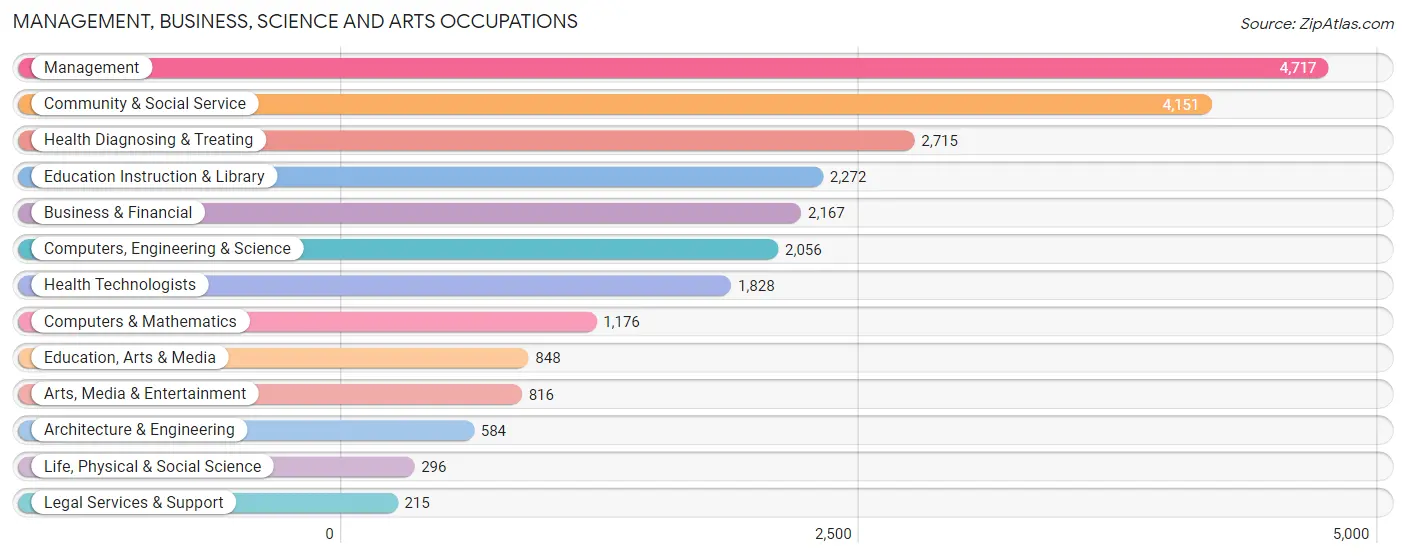
Management, Business, Science and Arts Occupations
The most common Management, Business, Science and Arts occupations in Pottawattamie County are Management (4,717 | 10.3%), Community & Social Service (4,151 | 9.1%), Health Diagnosing & Treating (2,715 | 5.9%), Education Instruction & Library (2,272 | 5.0%), and Business & Financial (2,167 | 4.7%).
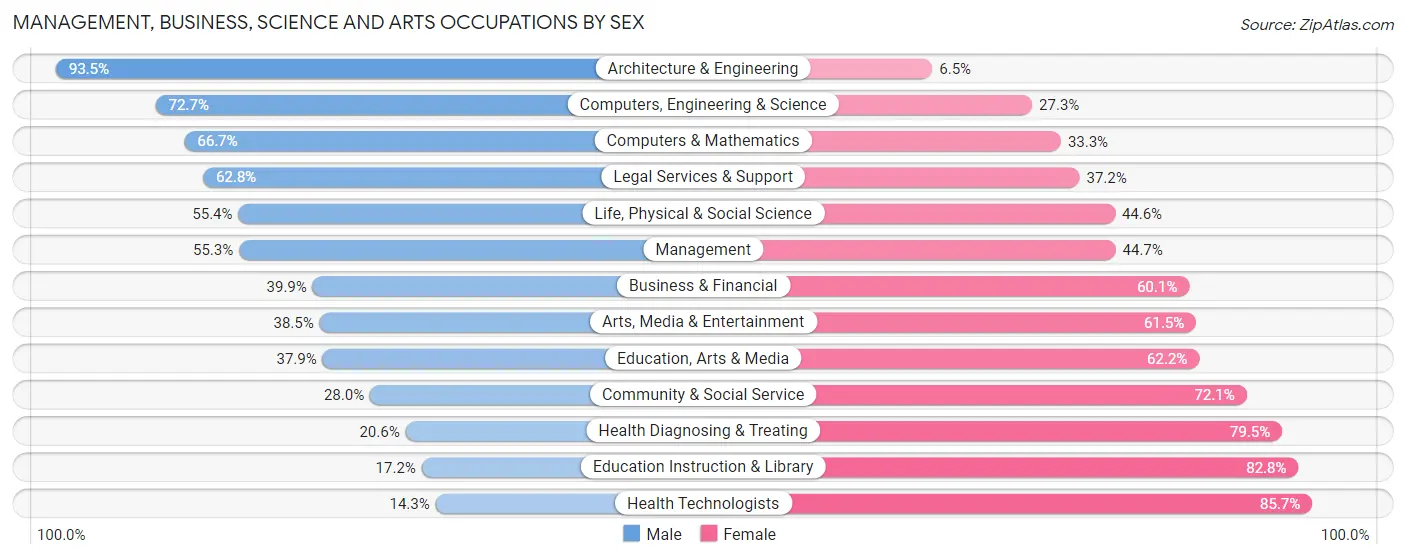
Management, Business, Science and Arts Occupations by Sex
Within the Management, Business, Science and Arts occupations in Pottawattamie County, the most male-oriented occupations are Architecture & Engineering (93.5%), Computers, Engineering & Science (72.7%), and Computers & Mathematics (66.7%), while the most female-oriented occupations are Health Technologists (85.7%), Education Instruction & Library (82.8%), and Health Diagnosing & Treating (79.4%).
| Occupation | Male | Female |
| Management | 2,607 (55.3%) | 2,110 (44.7%) |
| Business & Financial | 865 (39.9%) | 1,302 (60.1%) |
| Computers, Engineering & Science | 1,494 (72.7%) | 562 (27.3%) |
| Computers & Mathematics | 784 (66.7%) | 392 (33.3%) |
| Architecture & Engineering | 546 (93.5%) | 38 (6.5%) |
| Life, Physical & Social Science | 164 (55.4%) | 132 (44.6%) |
| Community & Social Service | 1,160 (28.0%) | 2,991 (72.1%) |
| Education, Arts & Media | 321 (37.9%) | 527 (62.2%) |
| Legal Services & Support | 135 (62.8%) | 80 (37.2%) |
| Education Instruction & Library | 390 (17.2%) | 1,882 (82.8%) |
| Arts, Media & Entertainment | 314 (38.5%) | 502 (61.5%) |
| Health Diagnosing & Treating | 558 (20.5%) | 2,157 (79.4%) |
| Health Technologists | 261 (14.3%) | 1,567 (85.7%) |
| Total (Category) | 6,684 (42.3%) | 9,122 (57.7%) |
| Total (Overall) | 23,822 (52.0%) | 21,993 (48.0%) |
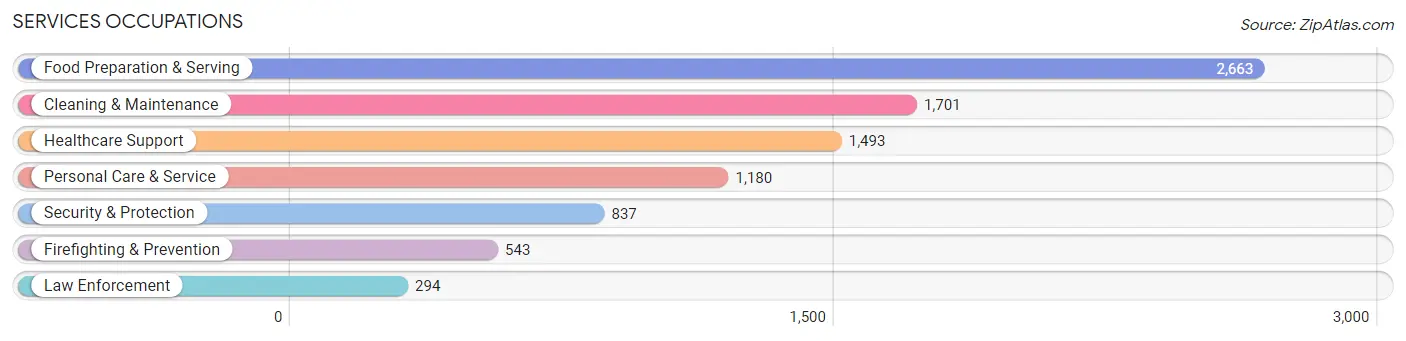
Services Occupations
The most common Services occupations in Pottawattamie County are Food Preparation & Serving (2,663 | 5.8%), Cleaning & Maintenance (1,701 | 3.7%), Healthcare Support (1,493 | 3.3%), Personal Care & Service (1,180 | 2.6%), and Security & Protection (837 | 1.8%).
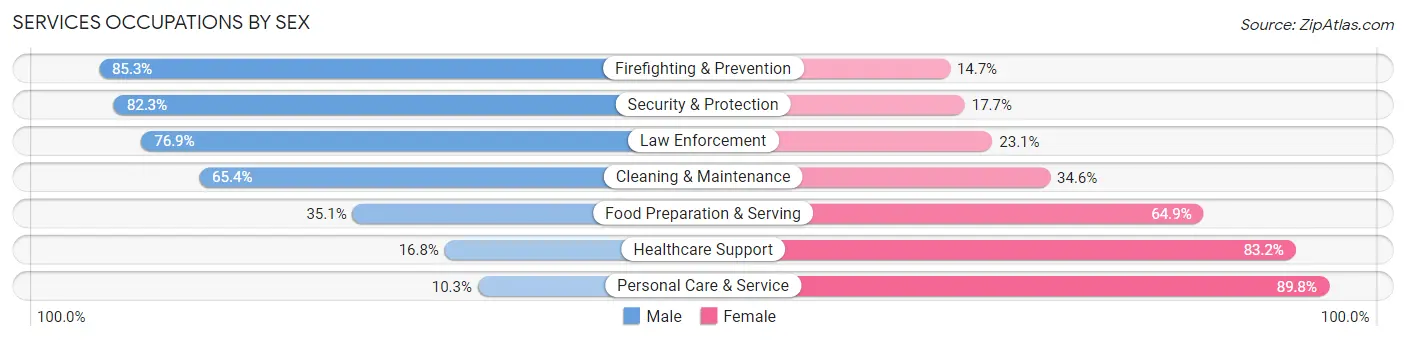
Services Occupations by Sex
Within the Services occupations in Pottawattamie County, the most male-oriented occupations are Firefighting & Prevention (85.3%), Security & Protection (82.3%), and Law Enforcement (76.9%), while the most female-oriented occupations are Personal Care & Service (89.7%), Healthcare Support (83.2%), and Food Preparation & Serving (64.9%).
| Occupation | Male | Female |
| Healthcare Support | 251 (16.8%) | 1,242 (83.2%) |
| Security & Protection | 689 (82.3%) | 148 (17.7%) |
| Firefighting & Prevention | 463 (85.3%) | 80 (14.7%) |
| Law Enforcement | 226 (76.9%) | 68 (23.1%) |
| Food Preparation & Serving | 934 (35.1%) | 1,729 (64.9%) |
| Cleaning & Maintenance | 1,113 (65.4%) | 588 (34.6%) |
| Personal Care & Service | 121 (10.2%) | 1,059 (89.7%) |
| Total (Category) | 3,108 (39.5%) | 4,766 (60.5%) |
| Total (Overall) | 23,822 (52.0%) | 21,993 (48.0%) |
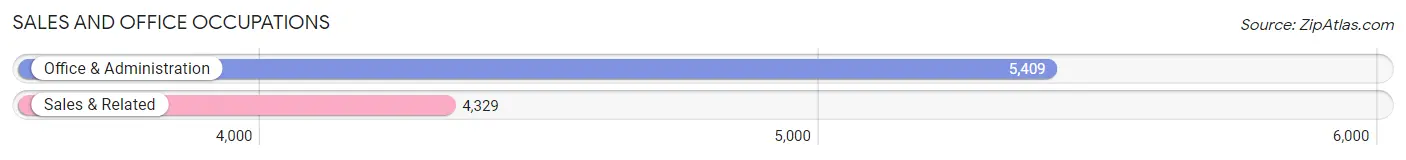
Sales and Office Occupations
The most common Sales and Office occupations in Pottawattamie County are Office & Administration (5,409 | 11.8%), and Sales & Related (4,329 | 9.5%).
Sales and Office Occupations by Sex
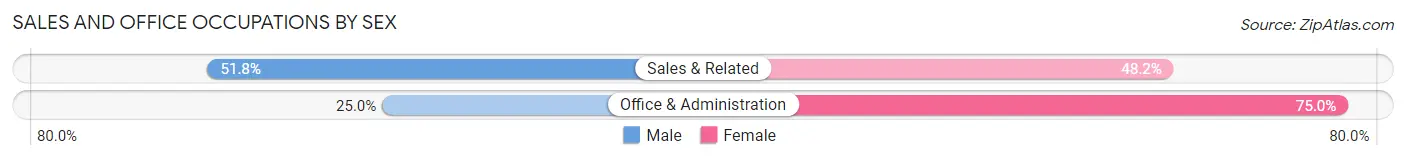
| Occupation | Male | Female |
| Sales & Related | 2,244 (51.8%) | 2,085 (48.2%) |
| Office & Administration | 1,352 (25.0%) | 4,057 (75.0%) |
| Total (Category) | 3,596 (36.9%) | 6,142 (63.1%) |
| Total (Overall) | 23,822 (52.0%) | 21,993 (48.0%) |
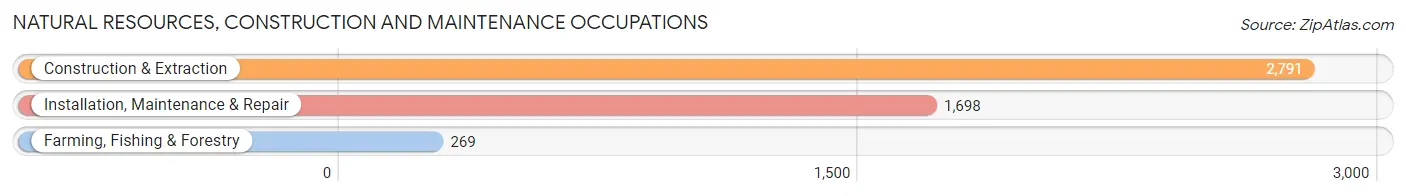
Natural Resources, Construction and Maintenance Occupations
The most common Natural Resources, Construction and Maintenance occupations in Pottawattamie County are Construction & Extraction (2,791 | 6.1%), Installation, Maintenance & Repair (1,698 | 3.7%), and Farming, Fishing & Forestry (269 | 0.6%).
Natural Resources, Construction and Maintenance Occupations by Sex
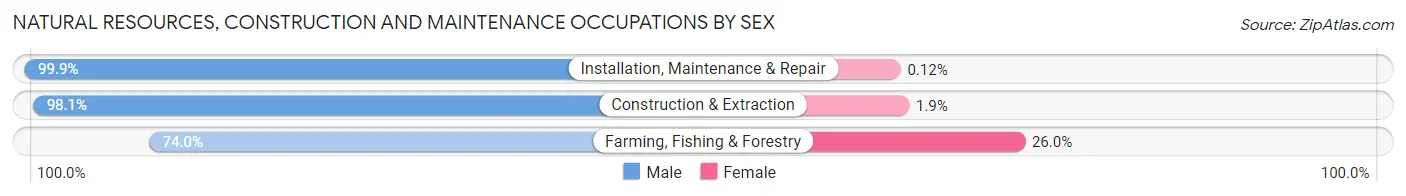
| Occupation | Male | Female |
| Farming, Fishing & Forestry | 199 (74.0%) | 70 (26.0%) |
| Construction & Extraction | 2,738 (98.1%) | 53 (1.9%) |
| Installation, Maintenance & Repair | 1,696 (99.9%) | 2 (0.1%) |
| Total (Category) | 4,633 (97.4%) | 125 (2.6%) |
| Total (Overall) | 23,822 (52.0%) | 21,993 (48.0%) |
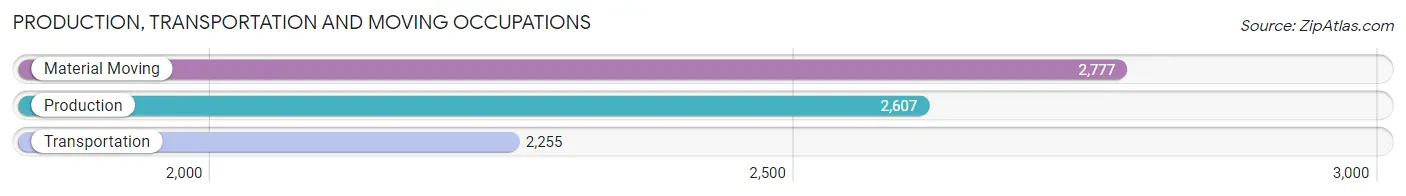
Production, Transportation and Moving Occupations
The most common Production, Transportation and Moving occupations in Pottawattamie County are Material Moving (2,777 | 6.1%), Production (2,607 | 5.7%), and Transportation (2,255 | 4.9%).
Production, Transportation and Moving Occupations by Sex
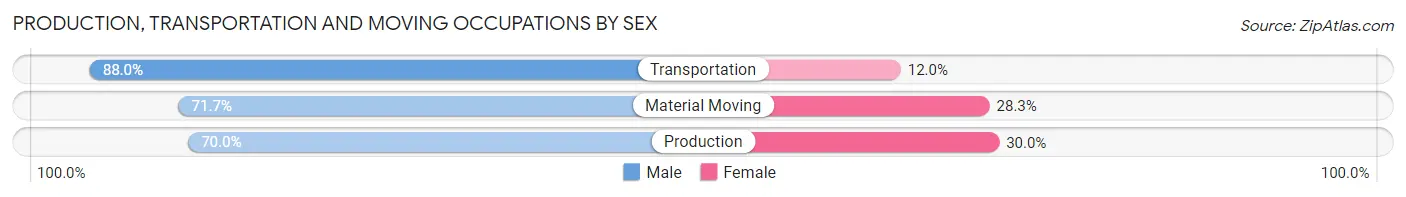
| Occupation | Male | Female |
| Production | 1,824 (70.0%) | 783 (30.0%) |
| Transportation | 1,985 (88.0%) | 270 (12.0%) |
| Material Moving | 1,992 (71.7%) | 785 (28.3%) |
| Total (Category) | 5,801 (75.9%) | 1,838 (24.1%) |
| Total (Overall) | 23,822 (52.0%) | 21,993 (48.0%) |
Employment Industries by Sex in Pottawattamie County
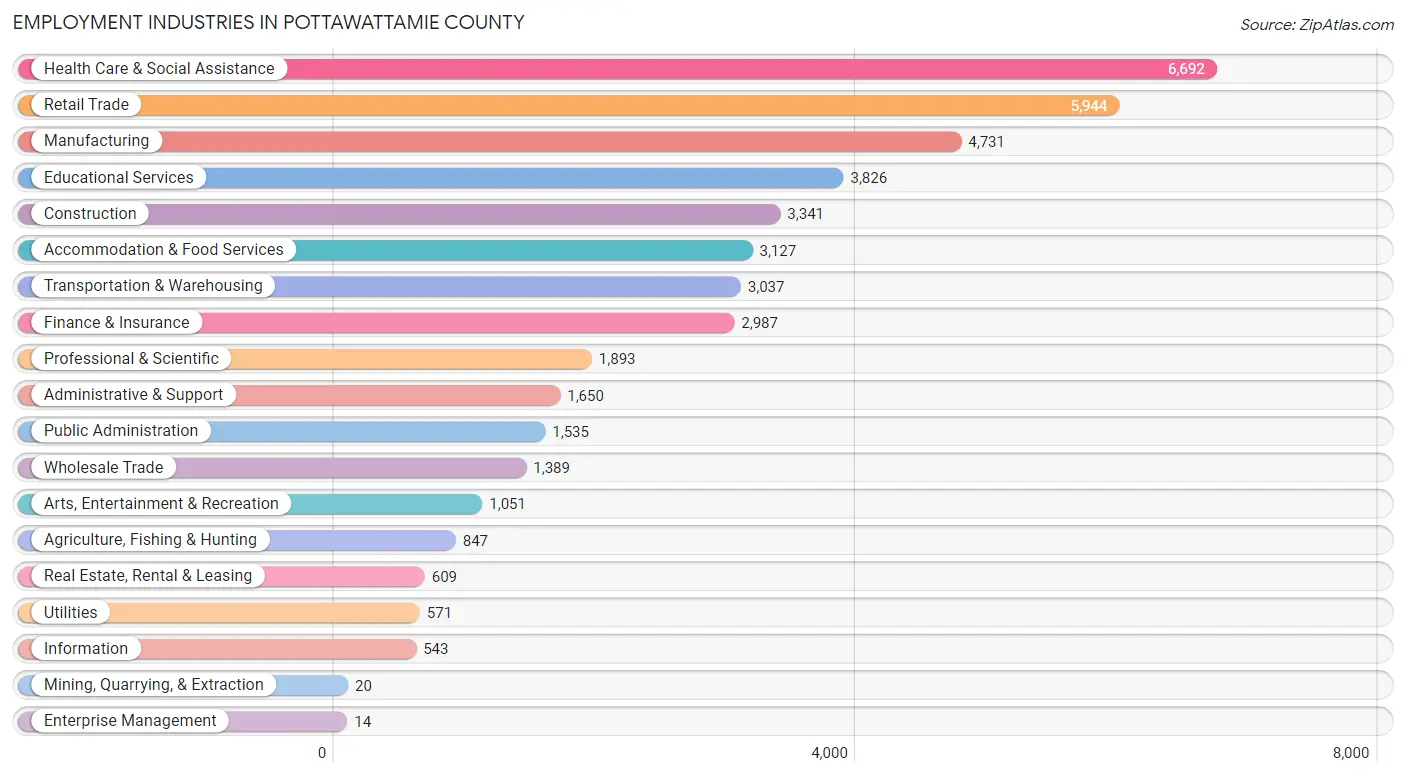
Employment Industries in Pottawattamie County
The major employment industries in Pottawattamie County include Health Care & Social Assistance (6,692 | 14.6%), Retail Trade (5,944 | 13.0%), Manufacturing (4,731 | 10.3%), Educational Services (3,826 | 8.4%), and Construction (3,341 | 7.3%).
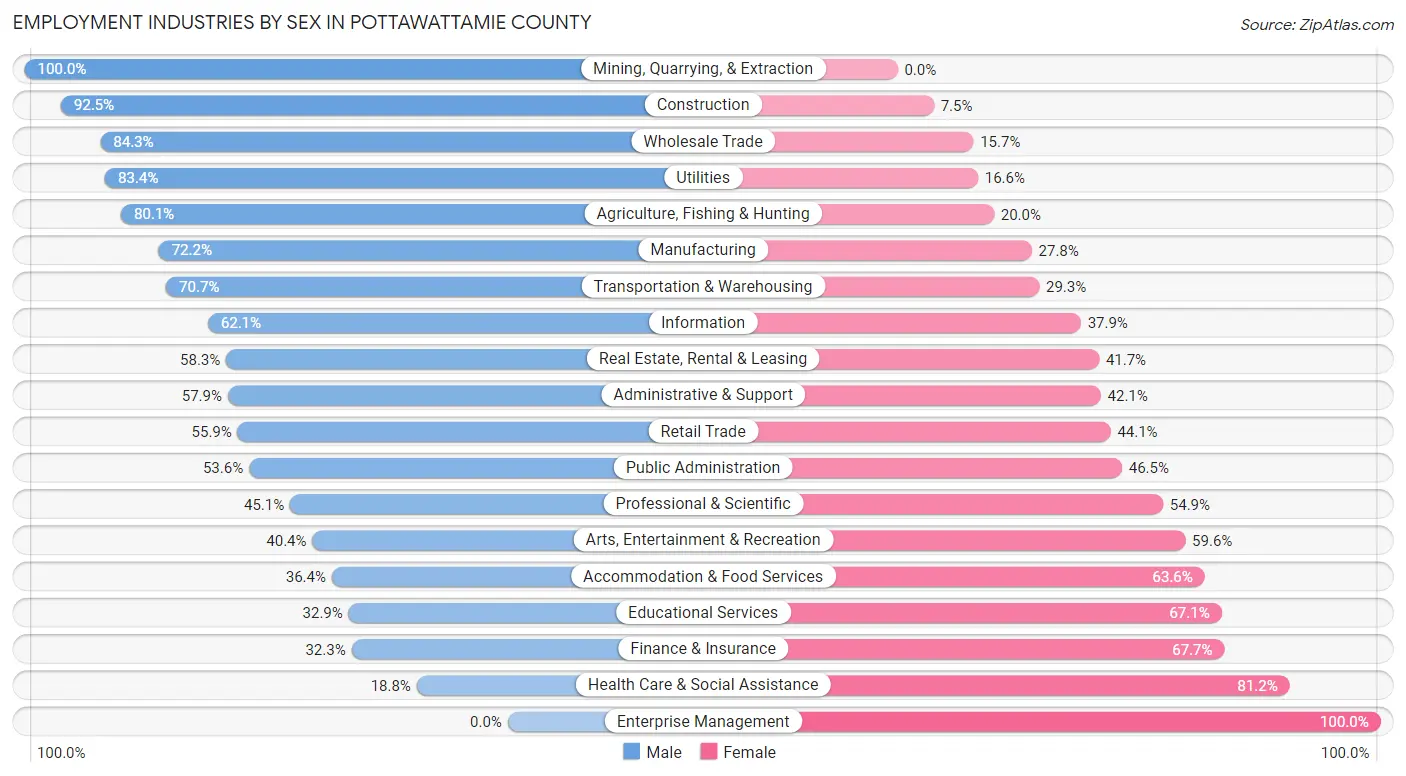
Employment Industries by Sex in Pottawattamie County
The Pottawattamie County industries that see more men than women are Mining, Quarrying, & Extraction (100.0%), Construction (92.5%), and Wholesale Trade (84.3%), whereas the industries that tend to have a higher number of women are Enterprise Management (100.0%), Health Care & Social Assistance (81.2%), and Finance & Insurance (67.7%).
| Industry | Male | Female |
| Agriculture, Fishing & Hunting | 678 (80.0%) | 169 (20.0%) |
| Mining, Quarrying, & Extraction | 20 (100.0%) | 0 (0.0%) |
| Construction | 3,090 (92.5%) | 251 (7.5%) |
| Manufacturing | 3,417 (72.2%) | 1,314 (27.8%) |
| Wholesale Trade | 1,171 (84.3%) | 218 (15.7%) |
| Retail Trade | 3,323 (55.9%) | 2,621 (44.1%) |
| Transportation & Warehousing | 2,147 (70.7%) | 890 (29.3%) |
| Utilities | 476 (83.4%) | 95 (16.6%) |
| Information | 337 (62.1%) | 206 (37.9%) |
| Finance & Insurance | 966 (32.3%) | 2,021 (67.7%) |
| Real Estate, Rental & Leasing | 355 (58.3%) | 254 (41.7%) |
| Professional & Scientific | 853 (45.1%) | 1,040 (54.9%) |
| Enterprise Management | 0 (0.0%) | 14 (100.0%) |
| Administrative & Support | 956 (57.9%) | 694 (42.1%) |
| Educational Services | 1,260 (32.9%) | 2,566 (67.1%) |
| Health Care & Social Assistance | 1,261 (18.8%) | 5,431 (81.2%) |
| Arts, Entertainment & Recreation | 425 (40.4%) | 626 (59.6%) |
| Accommodation & Food Services | 1,139 (36.4%) | 1,988 (63.6%) |
| Public Administration | 822 (53.5%) | 713 (46.5%) |
| Total | 23,822 (52.0%) | 21,993 (48.0%) |
Education in Pottawattamie County
School Enrollment in Pottawattamie County
The most common levels of schooling among the 21,797 students in Pottawattamie County are high school (5,078 | 23.3%), elementary school (4,950 | 22.7%), and middle school (4,547 | 20.9%).
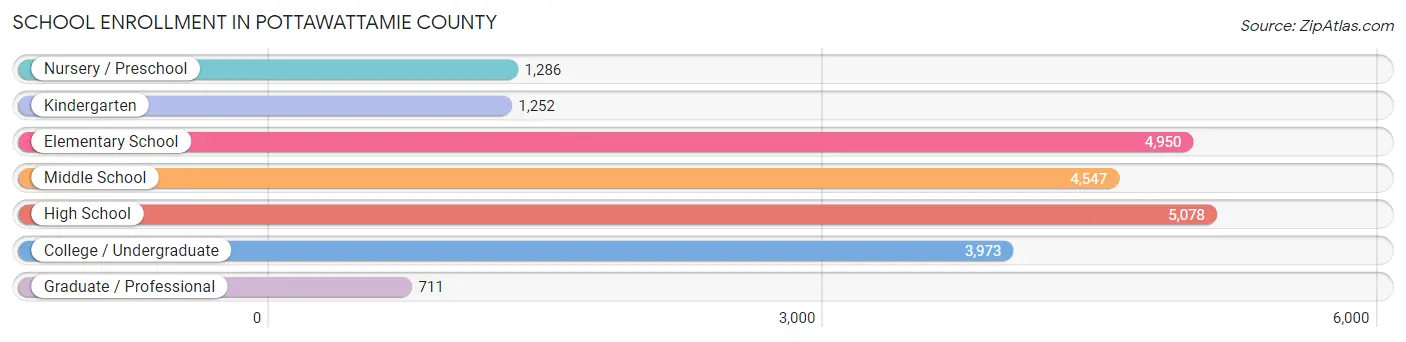
| School Level | # Students | % Students |
| Nursery / Preschool | 1,286 | 5.9% |
| Kindergarten | 1,252 | 5.7% |
| Elementary School | 4,950 | 22.7% |
| Middle School | 4,547 | 20.9% |
| High School | 5,078 | 23.3% |
| College / Undergraduate | 3,973 | 18.2% |
| Graduate / Professional | 711 | 3.3% |
| Total | 21,797 | 100.0% |
School Enrollment by Age by Funding Source in Pottawattamie County
Out of a total of 21,797 students who are enrolled in schools in Pottawattamie County, 2,463 (11.3%) attend a private institution, while the remaining 19,334 (88.7%) are enrolled in public schools. The age group of 3 to 4 year olds has the highest likelihood of being enrolled in private schools, with 241 (28.8% in the age bracket) enrolled. Conversely, the age group of 10 to 14 year olds has the lowest likelihood of being enrolled in a private school, with 5,439 (93.1% in the age bracket) attending a public institution.
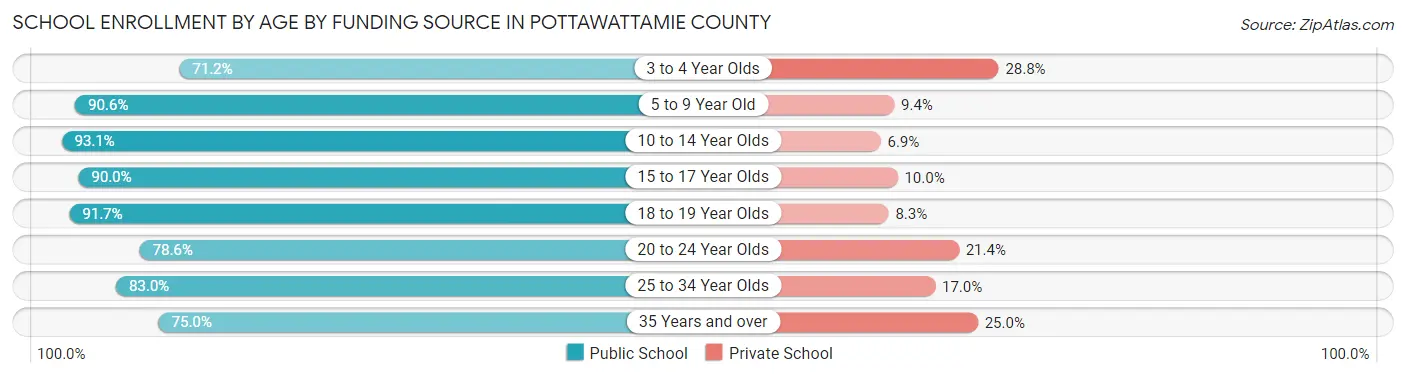
| Age Bracket | Public School | Private School |
| 3 to 4 Year Olds | 595 (71.2%) | 241 (28.8%) |
| 5 to 9 Year Old | 5,361 (90.6%) | 556 (9.4%) |
| 10 to 14 Year Olds | 5,439 (93.1%) | 401 (6.9%) |
| 15 to 17 Year Olds | 3,323 (90.0%) | 370 (10.0%) |
| 18 to 19 Year Olds | 1,824 (91.7%) | 166 (8.3%) |
| 20 to 24 Year Olds | 1,199 (78.6%) | 327 (21.4%) |
| 25 to 34 Year Olds | 931 (83.0%) | 191 (17.0%) |
| 35 Years and over | 655 (75.0%) | 218 (25.0%) |
| Total | 19,334 (88.7%) | 2,463 (11.3%) |
Educational Attainment by Field of Study in Pottawattamie County
Business (3,939 | 24.4%), education (3,058 | 18.9%), science & technology (1,954 | 12.1%), arts & humanities (1,354 | 8.4%), and bio, nature & agricultural (1,043 | 6.5%) are the most common fields of study among 16,169 individuals in Pottawattamie County who have obtained a bachelor's degree or higher.
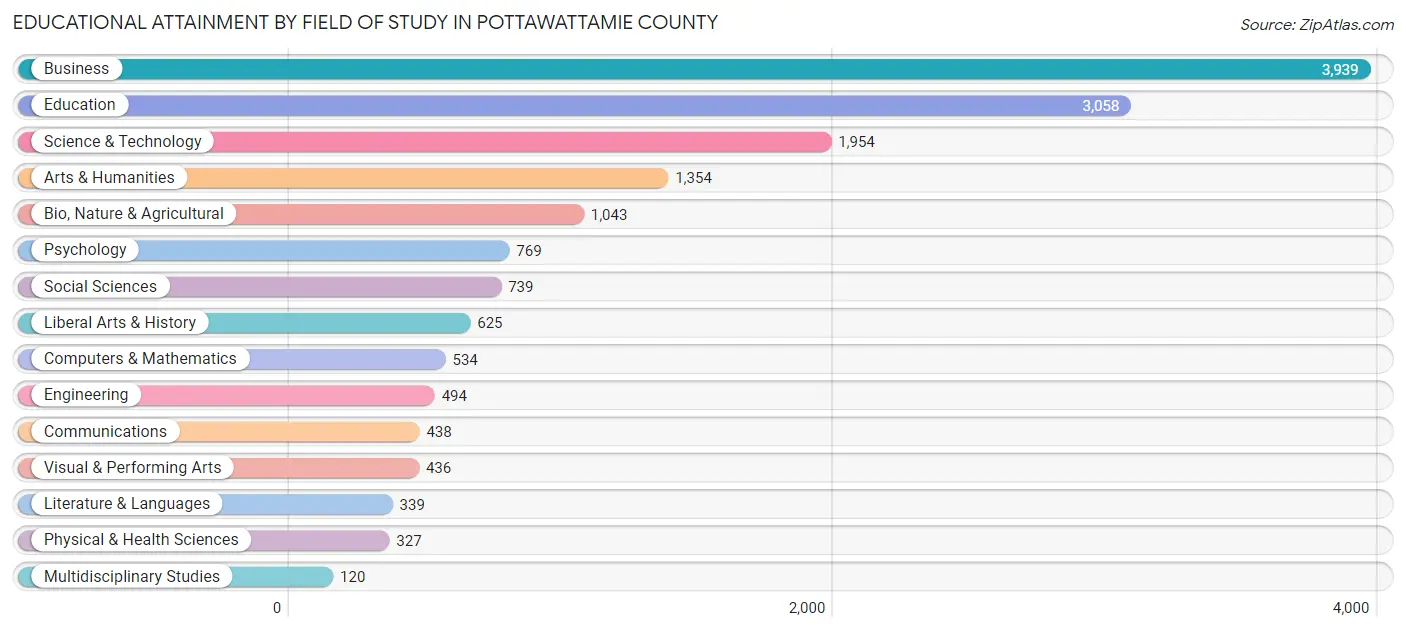
| Field of Study | # Graduates | % Graduates |
| Computers & Mathematics | 534 | 3.3% |
| Bio, Nature & Agricultural | 1,043 | 6.5% |
| Physical & Health Sciences | 327 | 2.0% |
| Psychology | 769 | 4.8% |
| Social Sciences | 739 | 4.6% |
| Engineering | 494 | 3.1% |
| Multidisciplinary Studies | 120 | 0.7% |
| Science & Technology | 1,954 | 12.1% |
| Business | 3,939 | 24.4% |
| Education | 3,058 | 18.9% |
| Literature & Languages | 339 | 2.1% |
| Liberal Arts & History | 625 | 3.9% |
| Visual & Performing Arts | 436 | 2.7% |
| Communications | 438 | 2.7% |
| Arts & Humanities | 1,354 | 8.4% |
| Total | 16,169 | 100.0% |
Transportation & Commute in Pottawattamie County
Vehicle Availability by Sex in Pottawattamie County
The most prevalent vehicle ownership categories in Pottawattamie County are males with 2 vehicles (9,877, accounting for 42.6%) and females with 2 vehicles (8,595, making up 46.1%).
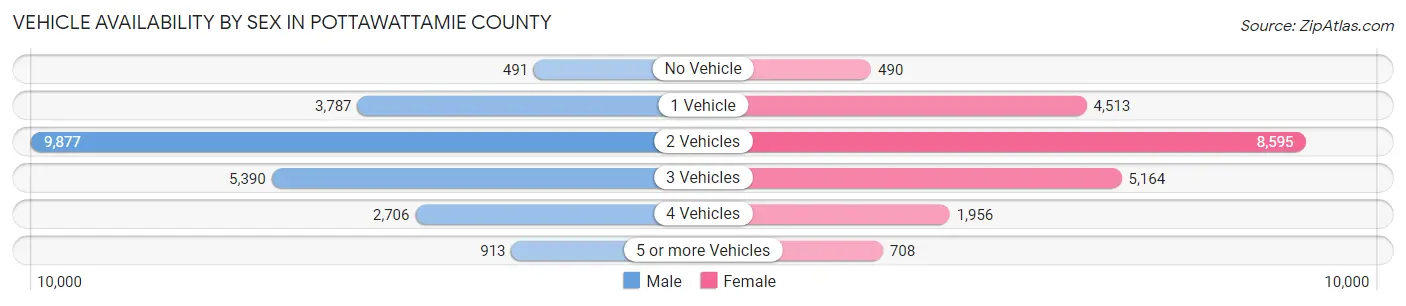
| Vehicles Available | Male | Female |
| No Vehicle | 491 (2.1%) | 490 (2.3%) |
| 1 Vehicle | 3,787 (16.4%) | 4,513 (21.1%) |
| 2 Vehicles | 9,877 (42.6%) | 8,595 (40.1%) |
| 3 Vehicles | 5,390 (23.3%) | 5,164 (24.1%) |
| 4 Vehicles | 2,706 (11.7%) | 1,956 (9.1%) |
| 5 or more Vehicles | 913 (3.9%) | 708 (3.3%) |
| Total | 23,164 (100.0%) | 21,426 (100.0%) |
Commute Time in Pottawattamie County
The most frequently occuring commute durations in Pottawattamie County are 10 to 14 minutes (7,580 commuters, 18.2%), 15 to 19 minutes (7,298 commuters, 17.5%), and 20 to 24 minutes (7,128 commuters, 17.1%).
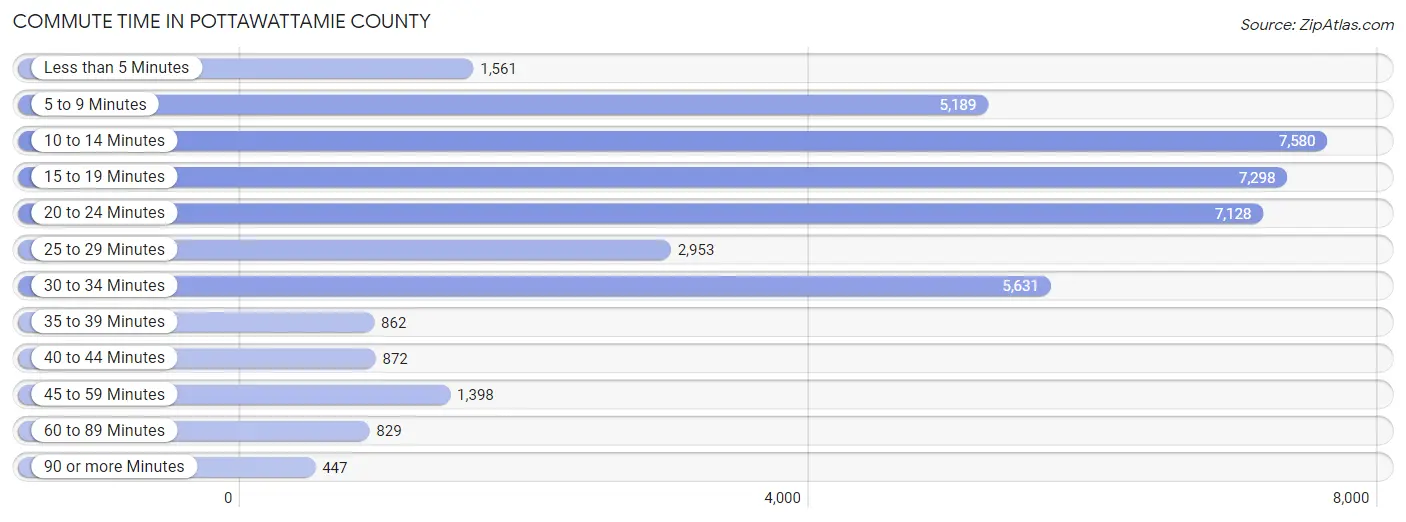
| Commute Time | # Commuters | % Commuters |
| Less than 5 Minutes | 1,561 | 3.7% |
| 5 to 9 Minutes | 5,189 | 12.4% |
| 10 to 14 Minutes | 7,580 | 18.2% |
| 15 to 19 Minutes | 7,298 | 17.5% |
| 20 to 24 Minutes | 7,128 | 17.1% |
| 25 to 29 Minutes | 2,953 | 7.1% |
| 30 to 34 Minutes | 5,631 | 13.5% |
| 35 to 39 Minutes | 862 | 2.1% |
| 40 to 44 Minutes | 872 | 2.1% |
| 45 to 59 Minutes | 1,398 | 3.4% |
| 60 to 89 Minutes | 829 | 2.0% |
| 90 or more Minutes | 447 | 1.1% |
Commute Time by Sex in Pottawattamie County
The most common commute times in Pottawattamie County are 20 to 24 minutes (3,956 commuters, 18.0%) for males and 15 to 19 minutes (3,731 commuters, 18.9%) for females.
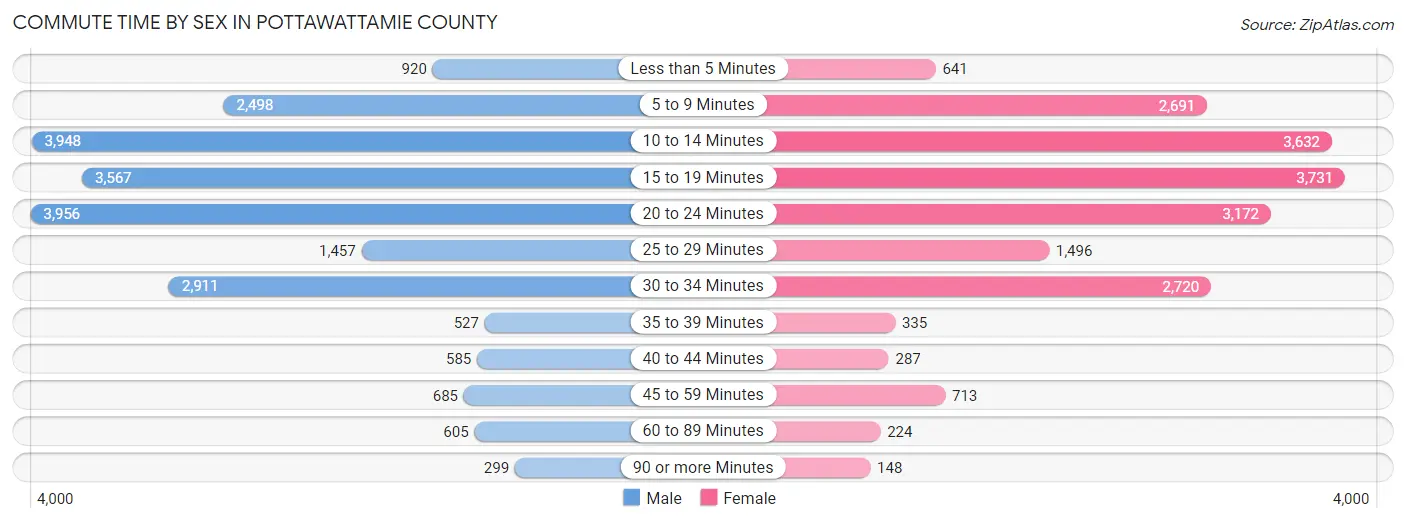
| Commute Time | Male | Female |
| Less than 5 Minutes | 920 (4.2%) | 641 (3.2%) |
| 5 to 9 Minutes | 2,498 (11.4%) | 2,691 (13.6%) |
| 10 to 14 Minutes | 3,948 (18.0%) | 3,632 (18.3%) |
| 15 to 19 Minutes | 3,567 (16.2%) | 3,731 (18.9%) |
| 20 to 24 Minutes | 3,956 (18.0%) | 3,172 (16.0%) |
| 25 to 29 Minutes | 1,457 (6.6%) | 1,496 (7.6%) |
| 30 to 34 Minutes | 2,911 (13.3%) | 2,720 (13.7%) |
| 35 to 39 Minutes | 527 (2.4%) | 335 (1.7%) |
| 40 to 44 Minutes | 585 (2.7%) | 287 (1.5%) |
| 45 to 59 Minutes | 685 (3.1%) | 713 (3.6%) |
| 60 to 89 Minutes | 605 (2.8%) | 224 (1.1%) |
| 90 or more Minutes | 299 (1.4%) | 148 (0.7%) |
Time of Departure to Work by Sex in Pottawattamie County
The most frequent times of departure to work in Pottawattamie County are 7:00 AM to 7:29 AM (3,477, 15.8%) for males and 7:30 AM to 7:59 AM (3,434, 17.3%) for females.
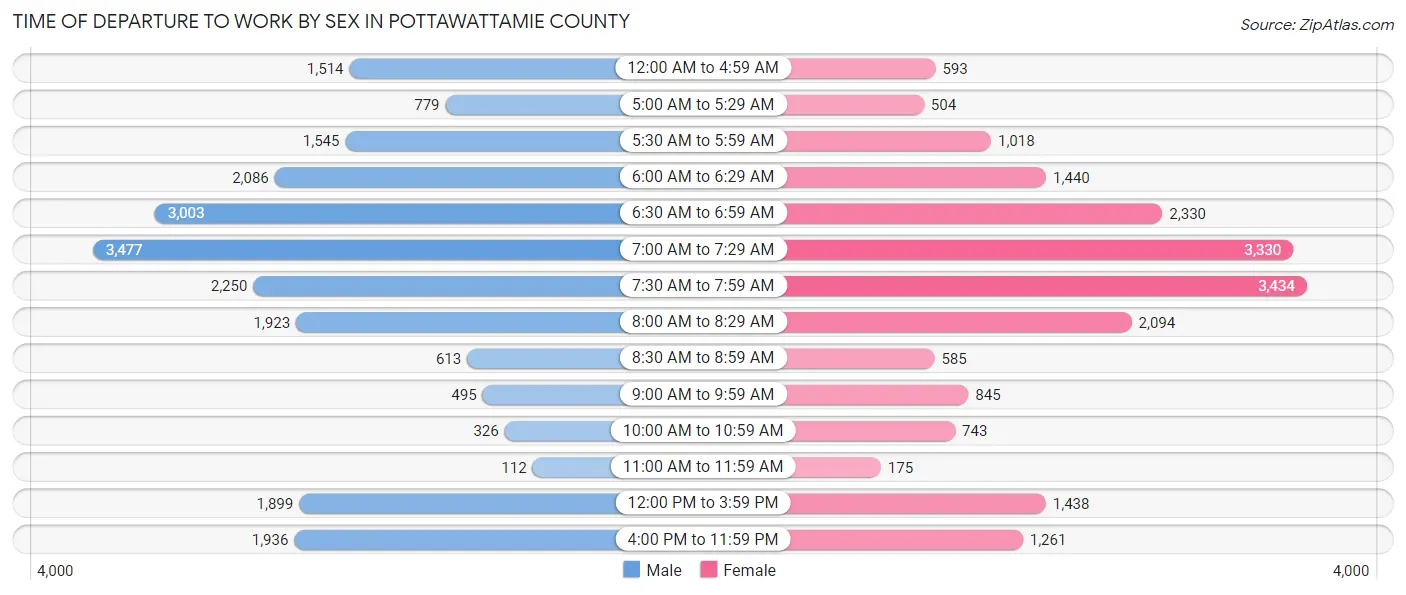
| Time of Departure | Male | Female |
| 12:00 AM to 4:59 AM | 1,514 (6.9%) | 593 (3.0%) |
| 5:00 AM to 5:29 AM | 779 (3.5%) | 504 (2.5%) |
| 5:30 AM to 5:59 AM | 1,545 (7.0%) | 1,018 (5.1%) |
| 6:00 AM to 6:29 AM | 2,086 (9.5%) | 1,440 (7.3%) |
| 6:30 AM to 6:59 AM | 3,003 (13.7%) | 2,330 (11.8%) |
| 7:00 AM to 7:29 AM | 3,477 (15.8%) | 3,330 (16.8%) |
| 7:30 AM to 7:59 AM | 2,250 (10.2%) | 3,434 (17.3%) |
| 8:00 AM to 8:29 AM | 1,923 (8.8%) | 2,094 (10.6%) |
| 8:30 AM to 8:59 AM | 613 (2.8%) | 585 (3.0%) |
| 9:00 AM to 9:59 AM | 495 (2.2%) | 845 (4.3%) |
| 10:00 AM to 10:59 AM | 326 (1.5%) | 743 (3.7%) |
| 11:00 AM to 11:59 AM | 112 (0.5%) | 175 (0.9%) |
| 12:00 PM to 3:59 PM | 1,899 (8.6%) | 1,438 (7.3%) |
| 4:00 PM to 11:59 PM | 1,936 (8.8%) | 1,261 (6.4%) |
| Total | 21,958 (100.0%) | 19,790 (100.0%) |
Housing Occupancy in Pottawattamie County
Occupancy by Ownership in Pottawattamie County
Of the total 37,162 dwellings in Pottawattamie County, owner-occupied units account for 25,868 (69.6%), while renter-occupied units make up 11,294 (30.4%).
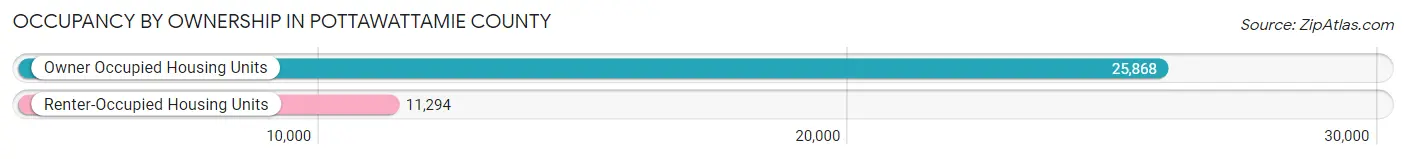
| Occupancy | # Housing Units | % Housing Units |
| Owner Occupied Housing Units | 25,868 | 69.6% |
| Renter-Occupied Housing Units | 11,294 | 30.4% |
| Total Occupied Housing Units | 37,162 | 100.0% |
Occupancy by Household Size in Pottawattamie County
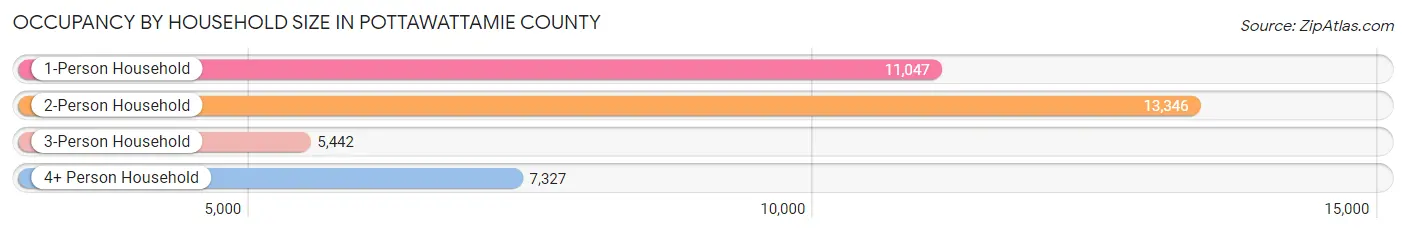
| Household Size | # Housing Units | % Housing Units |
| 1-Person Household | 11,047 | 29.7% |
| 2-Person Household | 13,346 | 35.9% |
| 3-Person Household | 5,442 | 14.6% |
| 4+ Person Household | 7,327 | 19.7% |
| Total Housing Units | 37,162 | 100.0% |
Occupancy by Ownership by Household Size in Pottawattamie County
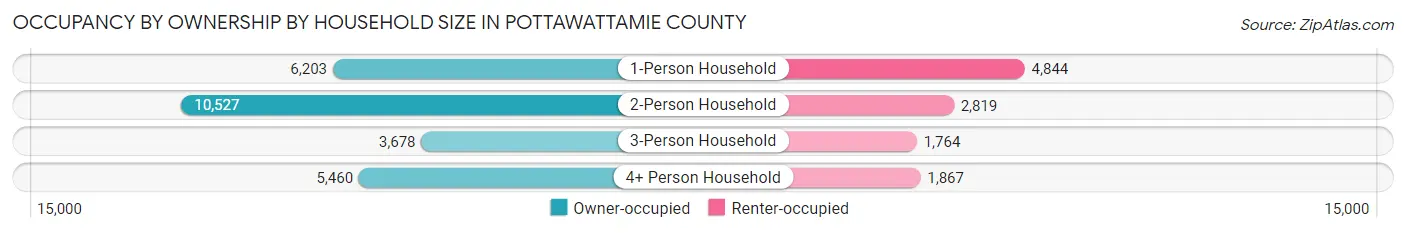
| Household Size | Owner-occupied | Renter-occupied |
| 1-Person Household | 6,203 (56.1%) | 4,844 (43.9%) |
| 2-Person Household | 10,527 (78.9%) | 2,819 (21.1%) |
| 3-Person Household | 3,678 (67.6%) | 1,764 (32.4%) |
| 4+ Person Household | 5,460 (74.5%) | 1,867 (25.5%) |
| Total Housing Units | 25,868 (69.6%) | 11,294 (30.4%) |
Occupancy by Educational Attainment in Pottawattamie County
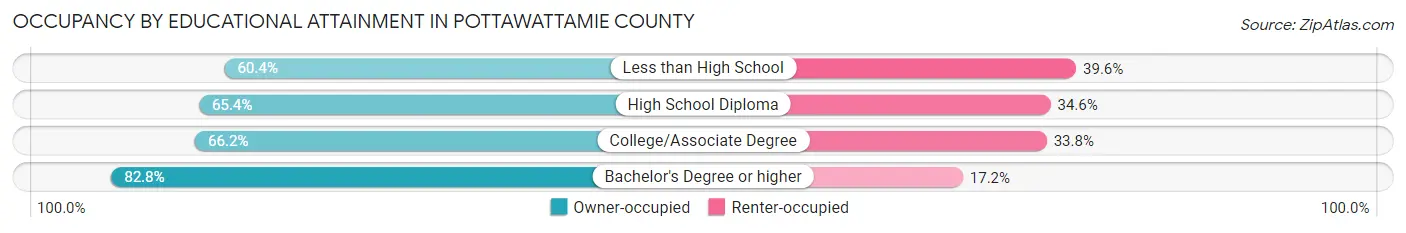
| Household Size | Owner-occupied | Renter-occupied |
| Less than High School | 1,695 (60.4%) | 1,113 (39.6%) |
| High School Diploma | 7,600 (65.4%) | 4,018 (34.6%) |
| College/Associate Degree | 8,973 (66.2%) | 4,585 (33.8%) |
| Bachelor's Degree or higher | 7,600 (82.8%) | 1,578 (17.2%) |
Occupancy by Age of Householder in Pottawattamie County
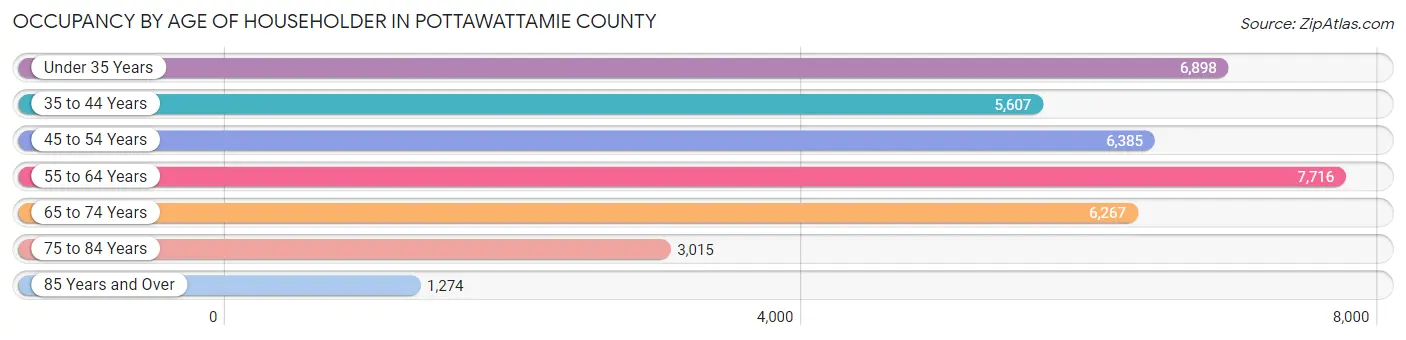
| Age Bracket | # Households | % Households |
| Under 35 Years | 6,898 | 18.6% |
| 35 to 44 Years | 5,607 | 15.1% |
| 45 to 54 Years | 6,385 | 17.2% |
| 55 to 64 Years | 7,716 | 20.8% |
| 65 to 74 Years | 6,267 | 16.9% |
| 75 to 84 Years | 3,015 | 8.1% |
| 85 Years and Over | 1,274 | 3.4% |
| Total | 37,162 | 100.0% |
Housing Finances in Pottawattamie County
Median Income by Occupancy in Pottawattamie County
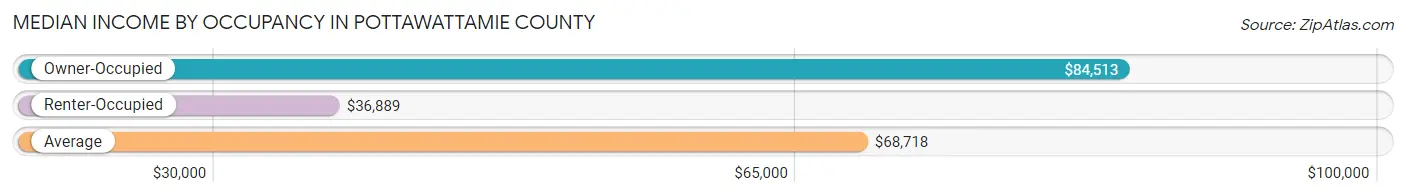
| Occupancy Type | # Households | Median Income |
| Owner-Occupied | 25,868 (69.6%) | $84,513 |
| Renter-Occupied | 11,294 (30.4%) | $36,889 |
| Average | 37,162 (100.0%) | $68,718 |
Occupancy by Householder Income Bracket in Pottawattamie County
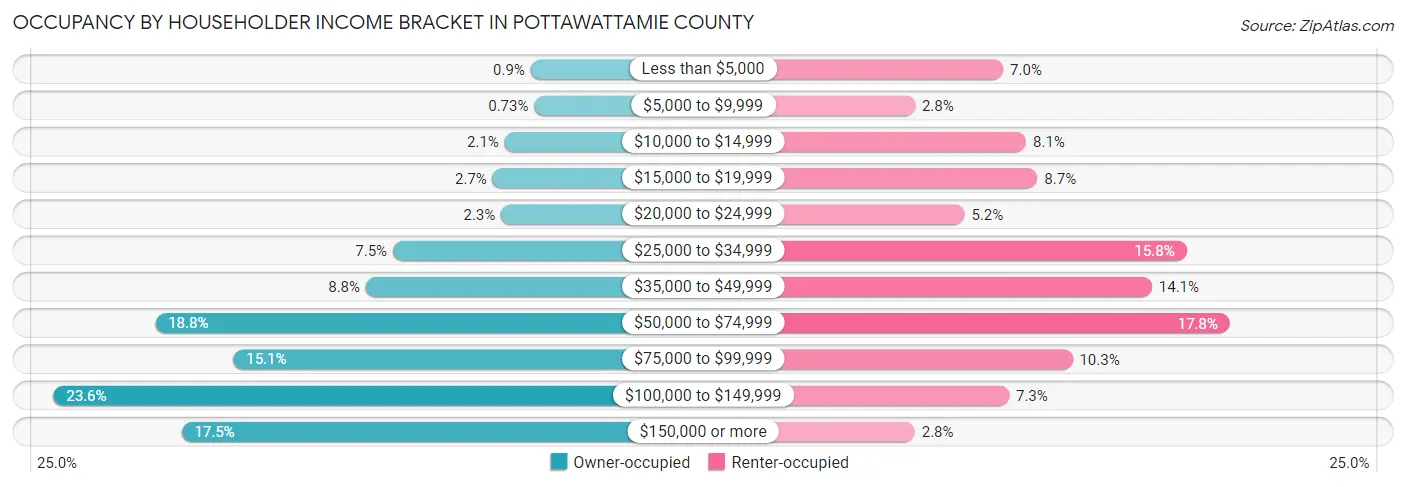
| Income Bracket | Owner-occupied | Renter-occupied |
| Less than $5,000 | 233 (0.9%) | 794 (7.0%) |
| $5,000 to $9,999 | 190 (0.7%) | 320 (2.8%) |
| $10,000 to $14,999 | 554 (2.1%) | 917 (8.1%) |
| $15,000 to $19,999 | 702 (2.7%) | 978 (8.7%) |
| $20,000 to $24,999 | 598 (2.3%) | 586 (5.2%) |
| $25,000 to $34,999 | 1,930 (7.5%) | 1,780 (15.8%) |
| $35,000 to $49,999 | 2,263 (8.7%) | 1,594 (14.1%) |
| $50,000 to $74,999 | 4,857 (18.8%) | 2,013 (17.8%) |
| $75,000 to $99,999 | 3,895 (15.1%) | 1,167 (10.3%) |
| $100,000 to $149,999 | 6,112 (23.6%) | 826 (7.3%) |
| $150,000 or more | 4,534 (17.5%) | 319 (2.8%) |
| Total | 25,868 (100.0%) | 11,294 (100.0%) |
Monthly Housing Cost Tiers in Pottawattamie County
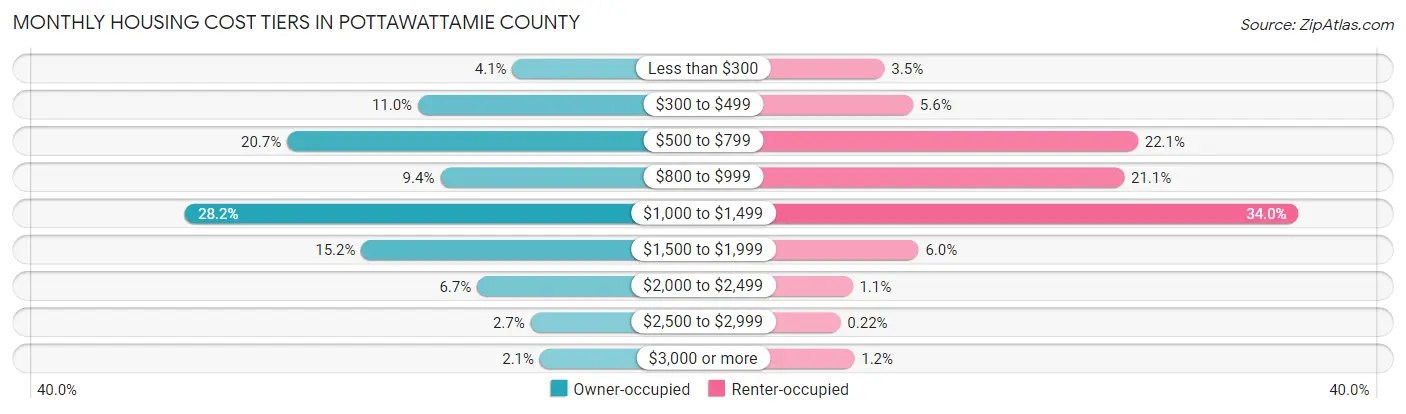
| Monthly Cost | Owner-occupied | Renter-occupied |
| Less than $300 | 1,052 (4.1%) | 391 (3.5%) |
| $300 to $499 | 2,853 (11.0%) | 628 (5.6%) |
| $500 to $799 | 5,346 (20.7%) | 2,498 (22.1%) |
| $800 to $999 | 2,428 (9.4%) | 2,384 (21.1%) |
| $1,000 to $1,499 | 7,289 (28.2%) | 3,834 (34.0%) |
| $1,500 to $1,999 | 3,932 (15.2%) | 674 (6.0%) |
| $2,000 to $2,499 | 1,729 (6.7%) | 125 (1.1%) |
| $2,500 to $2,999 | 708 (2.7%) | 25 (0.2%) |
| $3,000 or more | 531 (2.1%) | 140 (1.2%) |
| Total | 25,868 (100.0%) | 11,294 (100.0%) |
Physical Housing Characteristics in Pottawattamie County
Housing Structures in Pottawattamie County
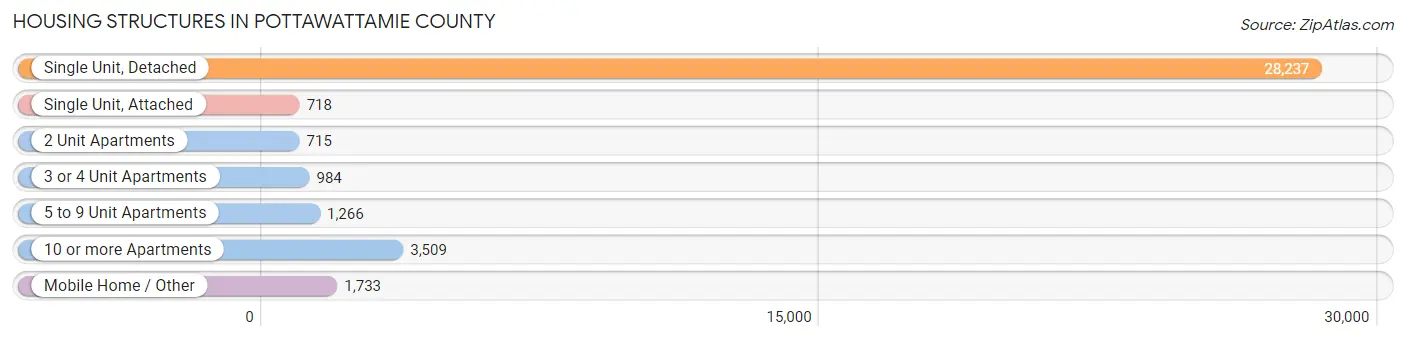
| Structure Type | # Housing Units | % Housing Units |
| Single Unit, Detached | 28,237 | 76.0% |
| Single Unit, Attached | 718 | 1.9% |
| 2 Unit Apartments | 715 | 1.9% |
| 3 or 4 Unit Apartments | 984 | 2.6% |
| 5 to 9 Unit Apartments | 1,266 | 3.4% |
| 10 or more Apartments | 3,509 | 9.4% |
| Mobile Home / Other | 1,733 | 4.7% |
| Total | 37,162 | 100.0% |
Housing Structures by Occupancy in Pottawattamie County
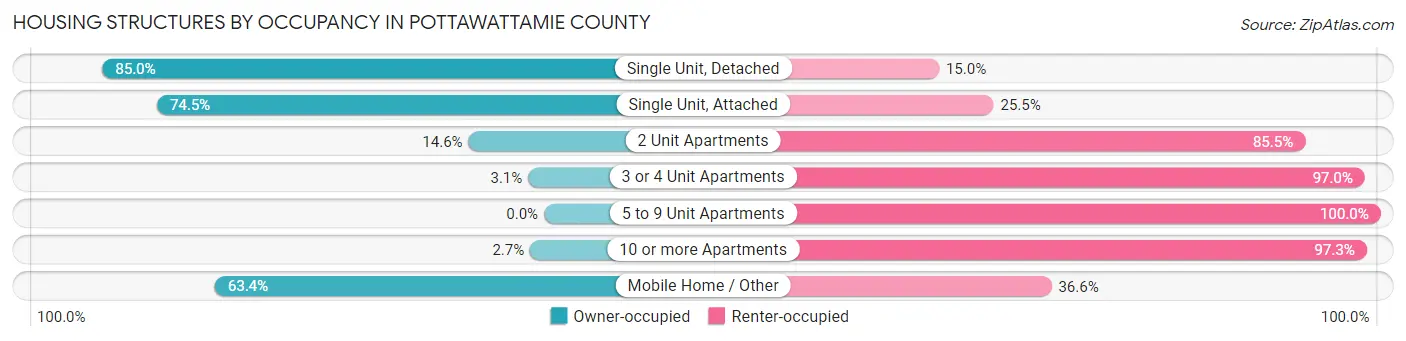
| Structure Type | Owner-occupied | Renter-occupied |
| Single Unit, Detached | 24,007 (85.0%) | 4,230 (15.0%) |
| Single Unit, Attached | 535 (74.5%) | 183 (25.5%) |
| 2 Unit Apartments | 104 (14.5%) | 611 (85.5%) |
| 3 or 4 Unit Apartments | 30 (3.0%) | 954 (97.0%) |
| 5 to 9 Unit Apartments | 0 (0.0%) | 1,266 (100.0%) |
| 10 or more Apartments | 94 (2.7%) | 3,415 (97.3%) |
| Mobile Home / Other | 1,098 (63.4%) | 635 (36.6%) |
| Total | 25,868 (69.6%) | 11,294 (30.4%) |
Housing Structures by Number of Rooms in Pottawattamie County
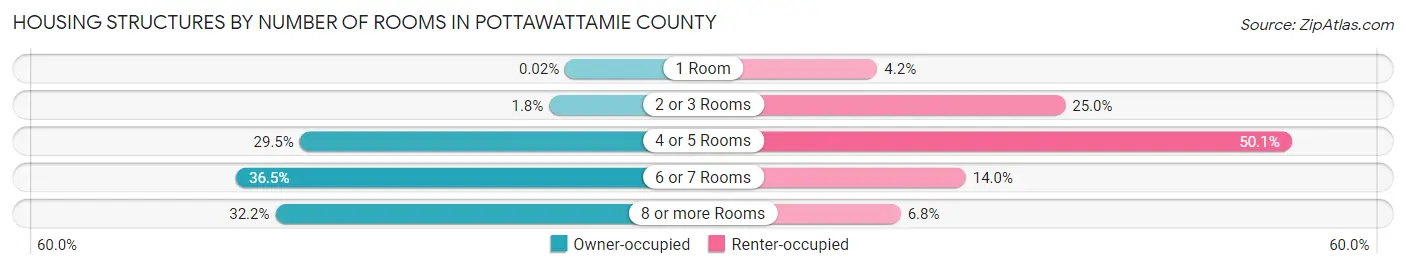
| Number of Rooms | Owner-occupied | Renter-occupied |
| 1 Room | 6 (0.0%) | 470 (4.2%) |
| 2 or 3 Rooms | 462 (1.8%) | 2,825 (25.0%) |
| 4 or 5 Rooms | 7,627 (29.5%) | 5,659 (50.1%) |
| 6 or 7 Rooms | 9,449 (36.5%) | 1,578 (14.0%) |
| 8 or more Rooms | 8,324 (32.2%) | 762 (6.8%) |
| Total | 25,868 (100.0%) | 11,294 (100.0%) |
Housing Structure by Heating Type in Pottawattamie County
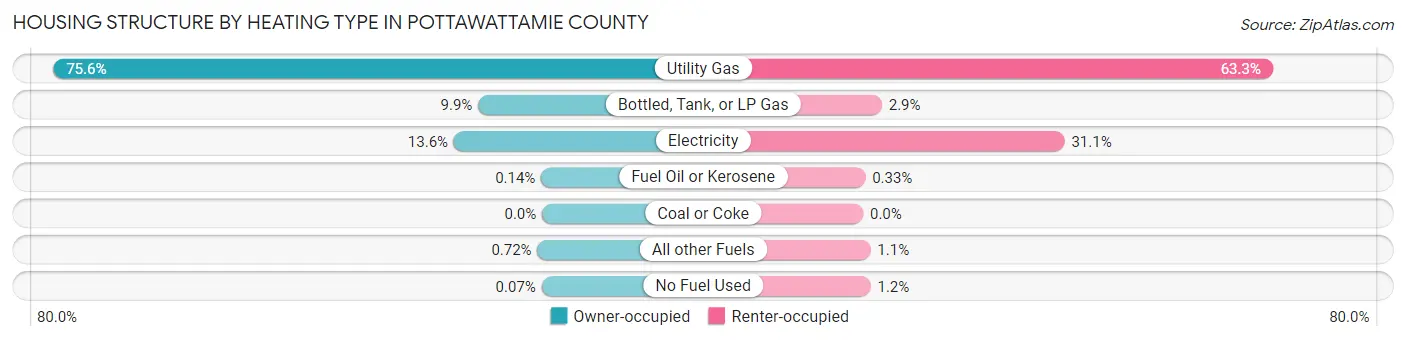
| Heating Type | Owner-occupied | Renter-occupied |
| Utility Gas | 19,549 (75.6%) | 7,153 (63.3%) |
| Bottled, Tank, or LP Gas | 2,556 (9.9%) | 327 (2.9%) |
| Electricity | 3,525 (13.6%) | 3,517 (31.1%) |
| Fuel Oil or Kerosene | 35 (0.1%) | 37 (0.3%) |
| Coal or Coke | 0 (0.0%) | 0 (0.0%) |
| All other Fuels | 186 (0.7%) | 129 (1.1%) |
| No Fuel Used | 17 (0.1%) | 131 (1.2%) |
| Total | 25,868 (100.0%) | 11,294 (100.0%) |
Household Vehicle Usage in Pottawattamie County
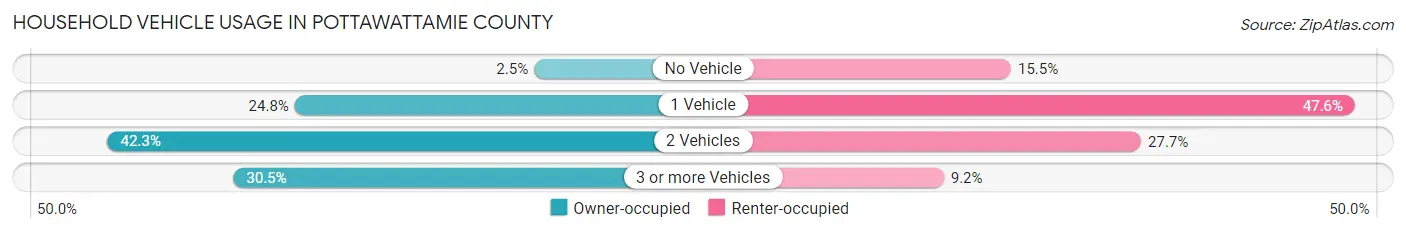
| Vehicles per Household | Owner-occupied | Renter-occupied |
| No Vehicle | 634 (2.5%) | 1,752 (15.5%) |
| 1 Vehicle | 6,412 (24.8%) | 5,376 (47.6%) |
| 2 Vehicles | 10,929 (42.2%) | 3,123 (27.7%) |
| 3 or more Vehicles | 7,893 (30.5%) | 1,043 (9.2%) |
| Total | 25,868 (100.0%) | 11,294 (100.0%) |
Real Estate & Mortgages in Pottawattamie County
Real Estate and Mortgage Overview in Pottawattamie County
| Characteristic | Without Mortgage | With Mortgage |
| Housing Units | 10,492 | 15,376 |
| Median Property Value | $156,900 | $179,000 |
| Median Household Income | $60,691 | $3,291 |
| Monthly Housing Costs | $578 | $524 |
| Real Estate Taxes | $2,635 | $288 |
Property Value by Mortgage Status in Pottawattamie County
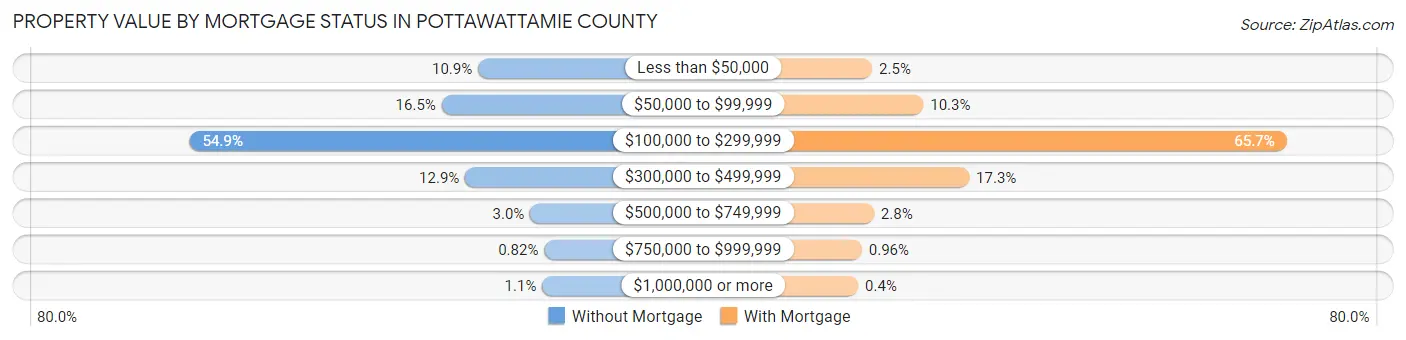
| Property Value | Without Mortgage | With Mortgage |
| Less than $50,000 | 1,145 (10.9%) | 389 (2.5%) |
| $50,000 to $99,999 | 1,726 (16.5%) | 1,587 (10.3%) |
| $100,000 to $299,999 | 5,757 (54.9%) | 10,099 (65.7%) |
| $300,000 to $499,999 | 1,350 (12.9%) | 2,662 (17.3%) |
| $500,000 to $749,999 | 311 (3.0%) | 430 (2.8%) |
| $750,000 to $999,999 | 86 (0.8%) | 148 (1.0%) |
| $1,000,000 or more | 117 (1.1%) | 61 (0.4%) |
| Total | 10,492 (100.0%) | 15,376 (100.0%) |
Household Income by Mortgage Status in Pottawattamie County
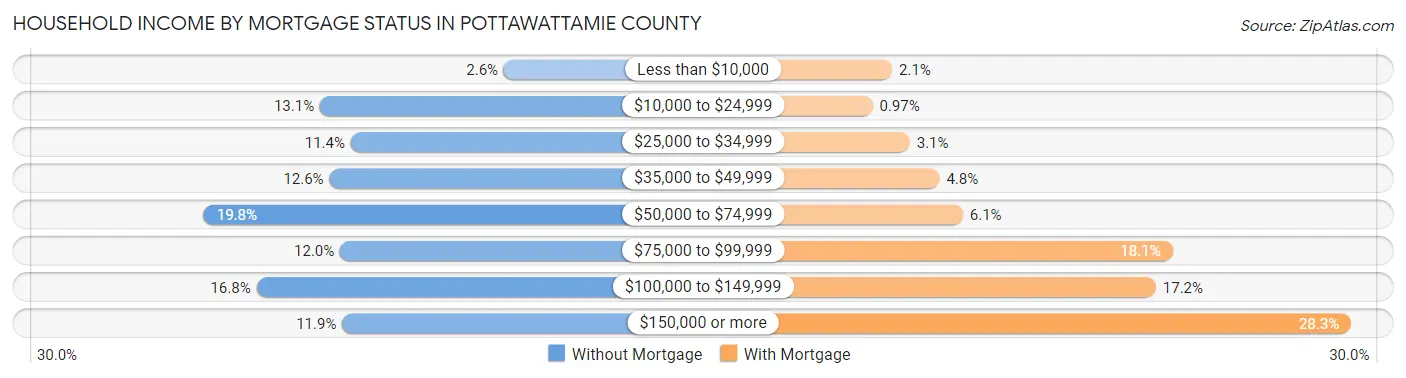
| Household Income | Without Mortgage | With Mortgage |
| Less than $10,000 | 274 (2.6%) | 322 (2.1%) |
| $10,000 to $24,999 | 1,377 (13.1%) | 149 (1.0%) |
| $25,000 to $34,999 | 1,192 (11.4%) | 477 (3.1%) |
| $35,000 to $49,999 | 1,320 (12.6%) | 738 (4.8%) |
| $50,000 to $74,999 | 2,073 (19.8%) | 943 (6.1%) |
| $75,000 to $99,999 | 1,256 (12.0%) | 2,784 (18.1%) |
| $100,000 to $149,999 | 1,757 (16.8%) | 2,639 (17.2%) |
| $150,000 or more | 1,243 (11.8%) | 4,355 (28.3%) |
| Total | 10,492 (100.0%) | 15,376 (100.0%) |
Property Value to Household Income Ratio in Pottawattamie County
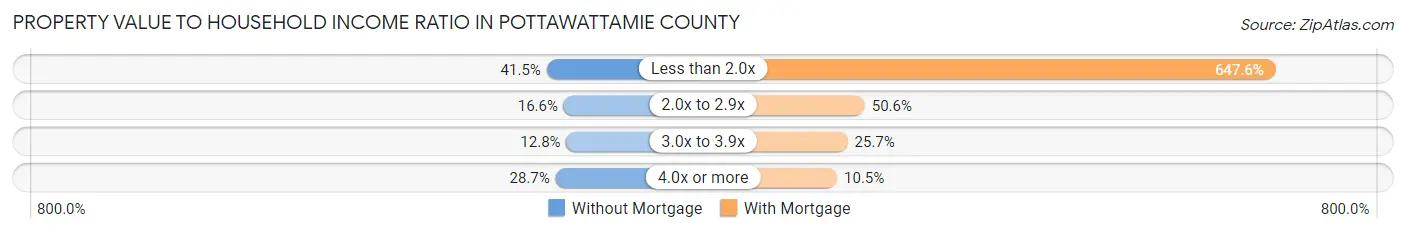
| Value-to-Income Ratio | Without Mortgage | With Mortgage |
| Less than 2.0x | 4,358 (41.5%) | 99,568 (647.6%) |
| 2.0x to 2.9x | 1,736 (16.6%) | 7,786 (50.6%) |
| 3.0x to 3.9x | 1,340 (12.8%) | 3,951 (25.7%) |
| 4.0x or more | 3,006 (28.6%) | 1,607 (10.4%) |
| Total | 10,492 (100.0%) | 15,376 (100.0%) |
Real Estate Taxes by Mortgage Status in Pottawattamie County
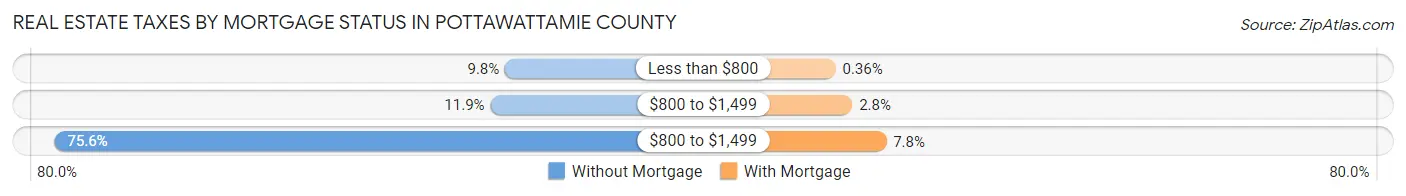
| Property Taxes | Without Mortgage | With Mortgage |
| Less than $800 | 1,027 (9.8%) | 55 (0.4%) |
| $800 to $1,499 | 1,253 (11.9%) | 431 (2.8%) |
| $800 to $1,499 | 7,936 (75.6%) | 1,194 (7.8%) |
| Total | 10,492 (100.0%) | 15,376 (100.0%) |
Health & Disability in Pottawattamie County
Health Insurance Coverage by Age in Pottawattamie County
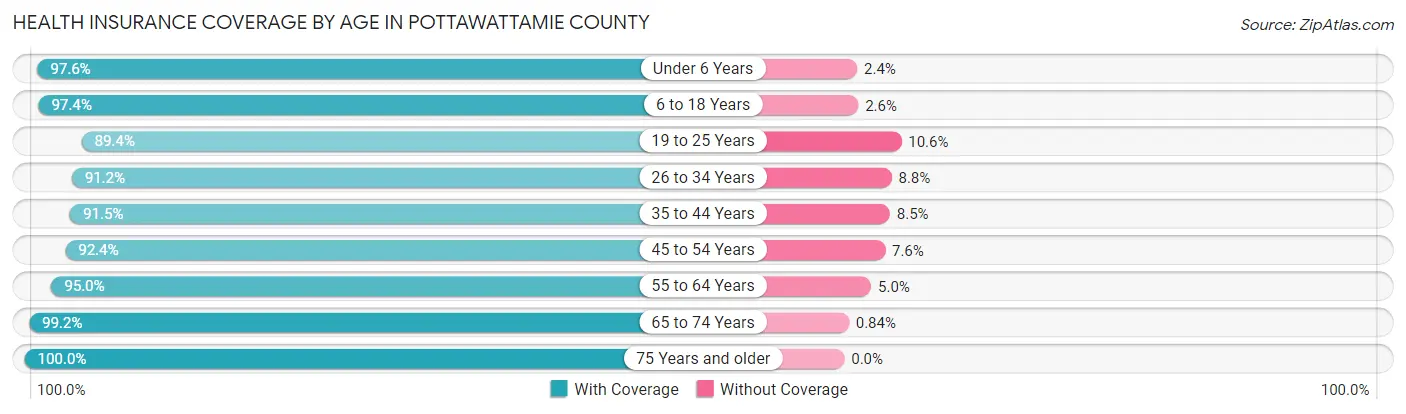
| Age Bracket | With Coverage | Without Coverage |
| Under 6 Years | 6,612 (97.6%) | 162 (2.4%) |
| 6 to 18 Years | 15,968 (97.4%) | 427 (2.6%) |
| 19 to 25 Years | 6,843 (89.4%) | 814 (10.6%) |
| 26 to 34 Years | 9,078 (91.2%) | 877 (8.8%) |
| 35 to 44 Years | 10,538 (91.5%) | 979 (8.5%) |
| 45 to 54 Years | 10,031 (92.4%) | 825 (7.6%) |
| 55 to 64 Years | 12,353 (95.0%) | 650 (5.0%) |
| 65 to 74 Years | 9,812 (99.2%) | 83 (0.8%) |
| 75 Years and older | 6,305 (100.0%) | 0 (0.0%) |
| Total | 87,540 (94.8%) | 4,817 (5.2%) |
Health Insurance Coverage by Citizenship Status in Pottawattamie County
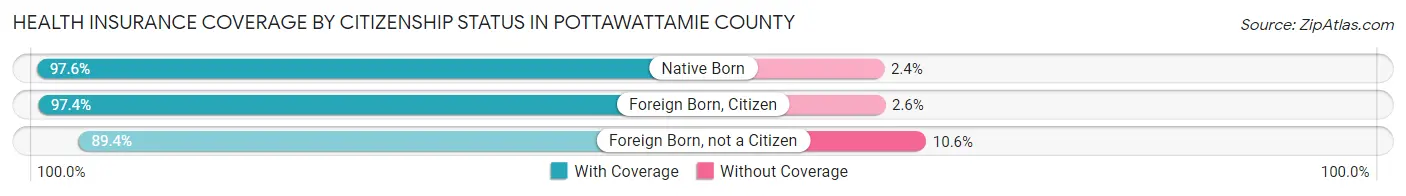
| Citizenship Status | With Coverage | Without Coverage |
| Native Born | 6,612 (97.6%) | 162 (2.4%) |
| Foreign Born, Citizen | 15,968 (97.4%) | 427 (2.6%) |
| Foreign Born, not a Citizen | 6,843 (89.4%) | 814 (10.6%) |
Health Insurance Coverage by Household Income in Pottawattamie County
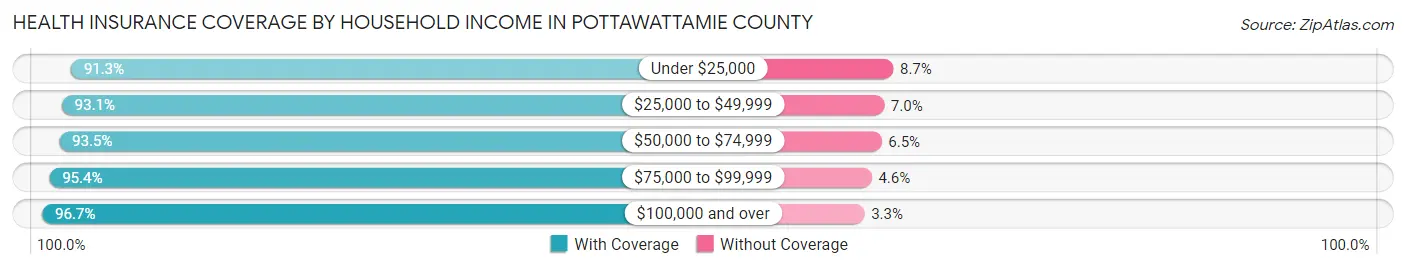
| Household Income | With Coverage | Without Coverage |
| Under $25,000 | 8,478 (91.3%) | 804 (8.7%) |
| $25,000 to $49,999 | 13,738 (93.0%) | 1,026 (7.0%) |
| $50,000 to $74,999 | 15,484 (93.5%) | 1,071 (6.5%) |
| $75,000 to $99,999 | 12,976 (95.4%) | 628 (4.6%) |
| $100,000 and over | 35,689 (96.7%) | 1,207 (3.3%) |
Public vs Private Health Insurance Coverage by Age in Pottawattamie County
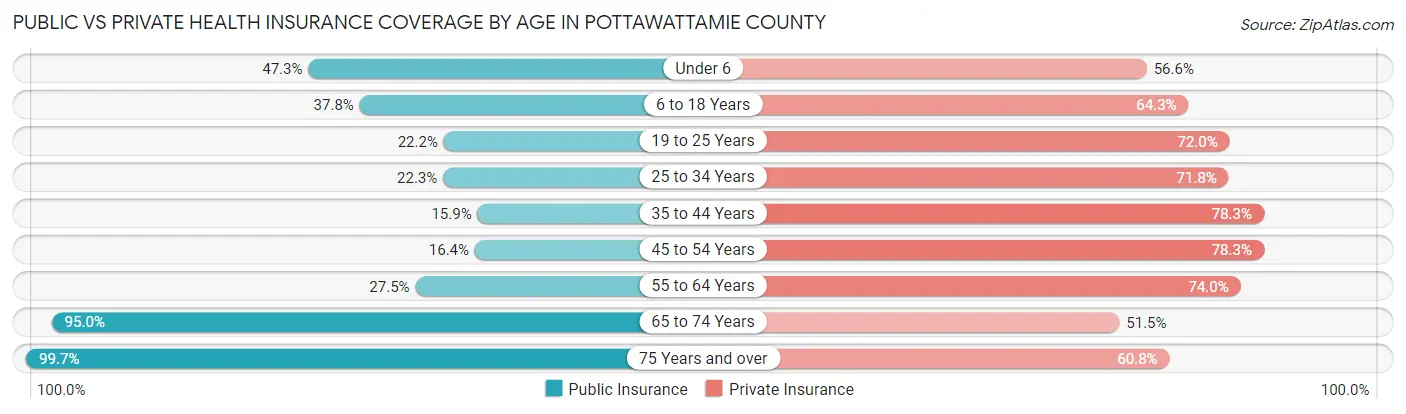
| Age Bracket | Public Insurance | Private Insurance |
| Under 6 | 3,207 (47.3%) | 3,834 (56.6%) |
| 6 to 18 Years | 6,199 (37.8%) | 10,547 (64.3%) |
| 19 to 25 Years | 1,700 (22.2%) | 5,510 (72.0%) |
| 25 to 34 Years | 2,222 (22.3%) | 7,148 (71.8%) |
| 35 to 44 Years | 1,836 (15.9%) | 9,020 (78.3%) |
| 45 to 54 Years | 1,783 (16.4%) | 8,501 (78.3%) |
| 55 to 64 Years | 3,571 (27.5%) | 9,622 (74.0%) |
| 65 to 74 Years | 9,397 (95.0%) | 5,098 (51.5%) |
| 75 Years and over | 6,286 (99.7%) | 3,834 (60.8%) |
| Total | 36,201 (39.2%) | 63,114 (68.3%) |
Disability Status by Sex by Age in Pottawattamie County
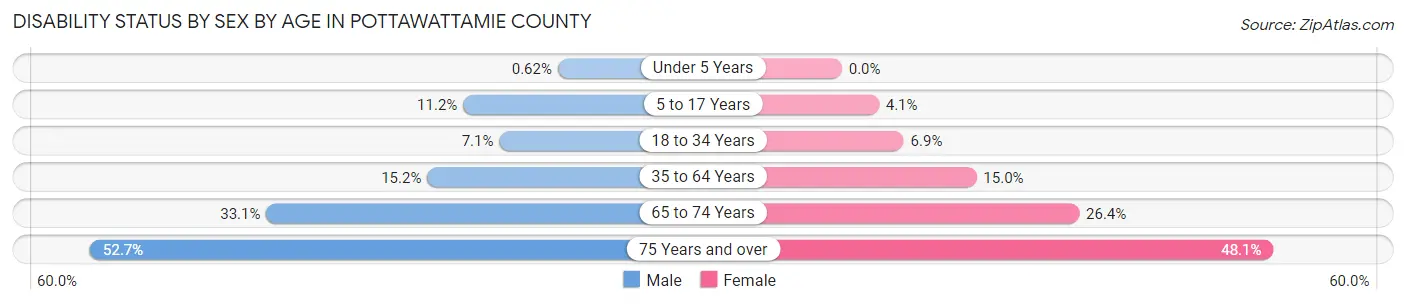
| Age Bracket | Male | Female |
| Under 5 Years | 17 (0.6%) | 0 (0.0%) |
| 5 to 17 Years | 972 (11.2%) | 313 (4.1%) |
| 18 to 34 Years | 699 (7.1%) | 644 (6.9%) |
| 35 to 64 Years | 2,675 (15.2%) | 2,657 (15.0%) |
| 65 to 74 Years | 1,591 (33.1%) | 1,344 (26.4%) |
| 75 Years and over | 1,405 (52.7%) | 1,749 (48.0%) |
Disability Class by Sex by Age in Pottawattamie County
Disability Class: Hearing Difficulty
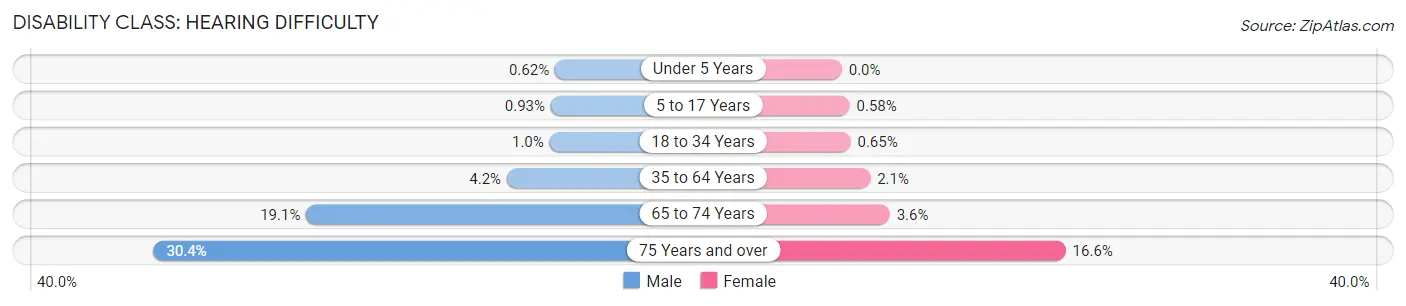
| Age Bracket | Male | Female |
| Under 5 Years | 17 (0.6%) | 0 (0.0%) |
| 5 to 17 Years | 81 (0.9%) | 44 (0.6%) |
| 18 to 34 Years | 100 (1.0%) | 61 (0.6%) |
| 35 to 64 Years | 740 (4.2%) | 374 (2.1%) |
| 65 to 74 Years | 918 (19.1%) | 181 (3.6%) |
| 75 Years and over | 811 (30.4%) | 605 (16.6%) |
Disability Class: Vision Difficulty
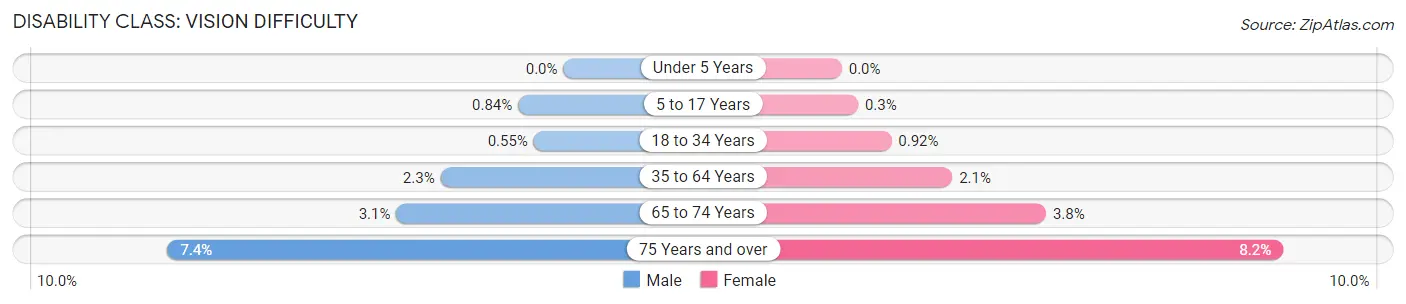
| Age Bracket | Male | Female |
| Under 5 Years | 0 (0.0%) | 0 (0.0%) |
| 5 to 17 Years | 73 (0.8%) | 23 (0.3%) |
| 18 to 34 Years | 54 (0.5%) | 86 (0.9%) |
| 35 to 64 Years | 402 (2.3%) | 364 (2.1%) |
| 65 to 74 Years | 149 (3.1%) | 193 (3.8%) |
| 75 Years and over | 196 (7.3%) | 298 (8.2%) |
Disability Class: Cognitive Difficulty
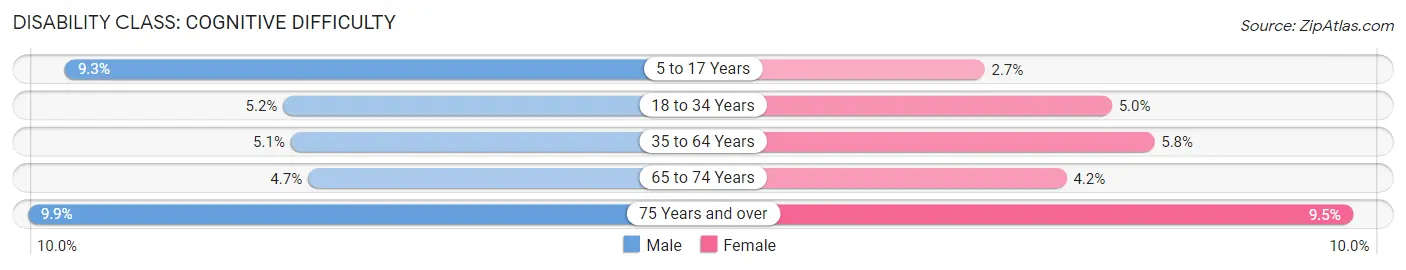
| Age Bracket | Male | Female |
| 5 to 17 Years | 805 (9.2%) | 201 (2.6%) |
| 18 to 34 Years | 510 (5.2%) | 468 (5.0%) |
| 35 to 64 Years | 893 (5.1%) | 1,028 (5.8%) |
| 65 to 74 Years | 228 (4.7%) | 212 (4.2%) |
| 75 Years and over | 265 (9.9%) | 345 (9.5%) |
Disability Class: Ambulatory Difficulty
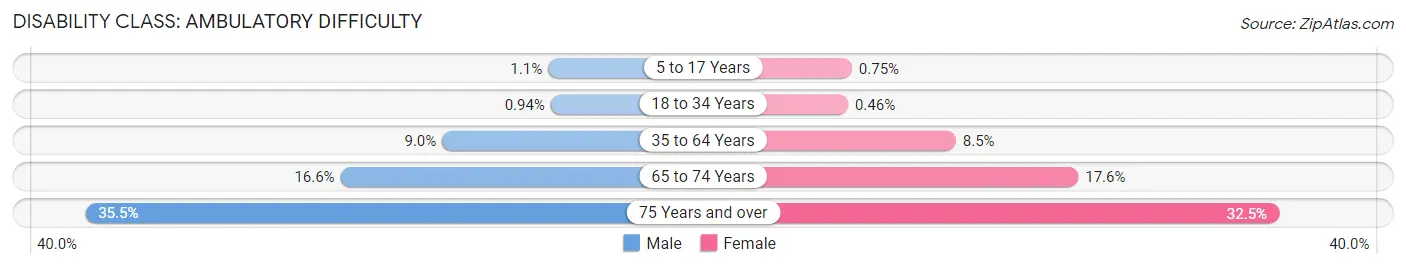
| Age Bracket | Male | Female |
| 5 to 17 Years | 99 (1.1%) | 57 (0.7%) |
| 18 to 34 Years | 92 (0.9%) | 43 (0.5%) |
| 35 to 64 Years | 1,588 (9.0%) | 1,502 (8.5%) |
| 65 to 74 Years | 796 (16.6%) | 893 (17.6%) |
| 75 Years and over | 946 (35.5%) | 1,181 (32.5%) |
Disability Class: Self-Care Difficulty
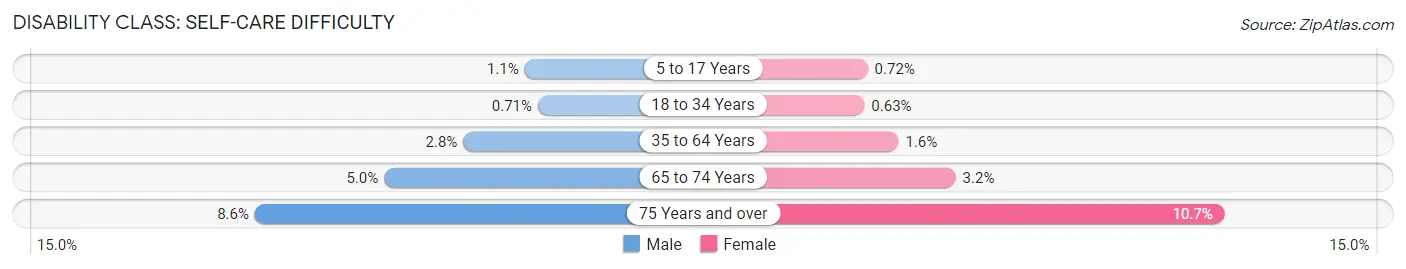
| Age Bracket | Male | Female |
| 5 to 17 Years | 94 (1.1%) | 55 (0.7%) |
| 18 to 34 Years | 70 (0.7%) | 59 (0.6%) |
| 35 to 64 Years | 492 (2.8%) | 280 (1.6%) |
| 65 to 74 Years | 240 (5.0%) | 161 (3.2%) |
| 75 Years and over | 229 (8.6%) | 388 (10.7%) |
Technology Access in Pottawattamie County
Computing Device Access in Pottawattamie County
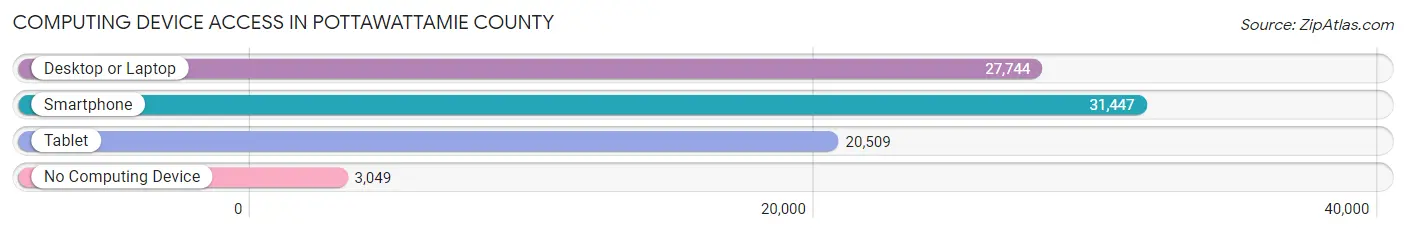
| Device Type | # Households | % Households |
| Desktop or Laptop | 27,744 | 74.7% |
| Smartphone | 31,447 | 84.6% |
| Tablet | 20,509 | 55.2% |
| No Computing Device | 3,049 | 8.2% |
| Total | 37,162 | 100.0% |
Internet Access in Pottawattamie County
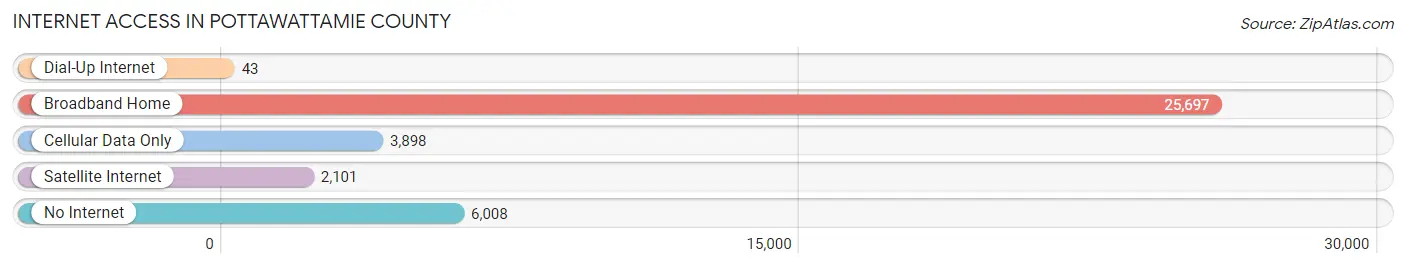
| Internet Type | # Households | % Households |
| Dial-Up Internet | 43 | 0.1% |
| Broadband Home | 25,697 | 69.2% |
| Cellular Data Only | 3,898 | 10.5% |
| Satellite Internet | 2,101 | 5.7% |
| No Internet | 6,008 | 16.2% |
| Total | 37,162 | 100.0% |
Pottawattamie County Summary
Pottawattamie County is located in the southwestern corner of the state of Iowa, in the United States. It is bordered by Mills County to the north, Harrison County to the east, and Shelby County to the south. The county seat is Council Bluffs, which is also the largest city in the county. The county was established in 1847 and named after the Pottawattamie Native American tribe. As of the 2010 census, the population of Pottawattamie County was 93,158.
History
The area that is now Pottawattamie County was originally inhabited by the Pottawattamie Native American tribe. The tribe was part of the larger Sauk-Fox confederacy, and they lived in the area for centuries before the arrival of European settlers. The first Europeans to settle in the area were French fur traders, who arrived in the late 1700s.
In 1846, the United States government negotiated a treaty with the Pottawattamie tribe, which allowed for the establishment of a county in the area. The county was officially established in 1847 and named after the Pottawattamie tribe.
The county was initially sparsely populated, but the arrival of the railroad in the late 1800s led to an influx of settlers. The city of Council Bluffs was established in 1853 and quickly became the county seat. The city was named after a bluff overlooking the Missouri River, which was used by Native Americans as a meeting place.
In the late 1800s, the county experienced a period of rapid growth. The population increased from just over 5,000 in 1880 to over 20,000 in 1900. This growth was largely due to the influx of immigrants from Europe, as well as the establishment of several large industries in the area.
Geography
Pottawattamie County is located in the southwestern corner of the state of Iowa. It is bordered by Mills County to the north, Harrison County to the east, and Shelby County to the south. The county covers an area of 576 square miles, and is mostly flat with some rolling hills. The county is drained by the West Nishnabotna River and the East Nishnabotna River, which both flow into the Missouri River.
The county is home to several parks and recreational areas, including Lake Manawa State Park, Hitchcock Nature Center, and the Loess Hills State Forest. The county also contains several wildlife management areas, including the Pottawattamie County Wildlife Management Area and the Hitchcock Wildlife Management Area.
Economy
The economy of Pottawattamie County is largely based on agriculture and manufacturing. The county is home to several large agricultural operations, including grain and livestock farms. The county is also home to several large manufacturing companies, including Tyson Foods, Cargill, and ConAgra Foods.
The county is also home to several large retail and service businesses, including the Mall of the Bluffs, the Council Bluffs Convention Center, and the Mid-America Center. The county is also home to several large healthcare providers, including the Mercy Medical Center and the Jennie Edmundson Hospital.
Demographics
As of the 2010 census, the population of Pottawattamie County was 93,158. The population is largely white (90.2%), with small percentages of African Americans (3.2%), Asians (2.2%), and Native Americans (0.7%). The median household income in the county is $50,945, and the median age is 38.7 years.
The largest city in the county is Council Bluffs, which has a population of 62,230. Other major cities in the county include Carter Lake (4,717), Avoca (3,717), and Macedonia (1,845).
Conclusion
Pottawattamie County is located in the southwestern corner of the state of Iowa. The county was established in 1847 and named after the Pottawattamie Native American tribe. The county has a population of 93,158, and the largest city is Council Bluffs. The economy of the county is largely based on agriculture and manufacturing, and the median household income is $50,945.
Common Questions
What is the Total Population of Pottawattamie County?
Total Population of Pottawattamie County is 93,543.
What is the Total Male Population of Pottawattamie County?
Total Male Population of Pottawattamie County is 46,861.
What is the Total Female Population of Pottawattamie County?
Total Female Population of Pottawattamie County is 46,682.
What is the Ratio of Males per 100 Females in Pottawattamie County?
There are 100.38 Males per 100 Females in Pottawattamie County.
What is the Ratio of Females per 100 Males in Pottawattamie County?
There are 99.62 Females per 100 Males in Pottawattamie County.
What is the Median Population Age in Pottawattamie County?
Median Population Age in Pottawattamie County is 39.7 Years.
What is the Average Family Size in Pottawattamie County
Average Family Size in Pottawattamie County is 3.0 People.
What is the Average Household Size in Pottawattamie County
Average Household Size in Pottawattamie County is 2.5 People.
What is Per Capita Income in Pottawattamie County?
Per Capita income in Pottawattamie County is $34,701.
What is the Median Family Income in Pottawattamie County?
Median Family Income in Pottawattamie County is $84,320.
What is the Median Household income in Pottawattamie County?
Median Household Income in Pottawattamie County is $68,718.
What is Income or Wage Gap in Pottawattamie County?
Income or Wage Gap in Pottawattamie County is 25.1%.
Women in Pottawattamie County earn 74.9 cents for every dollar earned by a man.
What is Family Income Deficit in Pottawattamie County?
Family Income Deficit in Pottawattamie County is $11,705.
Families that are below poverty line in Pottawattamie County earn $11,705 less on average than the poverty threshold level.
What is Inequality or Gini Index in Pottawattamie County?
Inequality or Gini Index in Pottawattamie County is 0.43.
How Large is the Labor Force in Pottawattamie County?
There are 47,540 People in the Labor Forcein in Pottawattamie County.
What is the Percentage of People in the Labor Force in Pottawattamie County?
63.8% of People are in the Labor Force in Pottawattamie County.
What is the Unemployment Rate in Pottawattamie County?
Unemployment Rate in Pottawattamie County is 3.6%.