Monona County, IA
Monona County Map
Monona County Overview
8,671
TOTAL POPULATION
4,201
MALE POPULATION
4,470
FEMALE POPULATION
93.98
MALES / 100 FEMALES
106.40
FEMALES / 100 MALES
45.9
MEDIAN AGE
2.8
AVG FAMILY SIZE
2.2
AVG HOUSEHOLD SIZE
$33,080
PER CAPITA INCOME
$76,144
AVG FAMILY INCOME
$59,897
AVG HOUSEHOLD INCOME
33.5%
WAGE / INCOME GAP [ % ]
66.5¢/ $1
WAGE / INCOME GAP [ $ ]
$9,519
FAMILY INCOME DEFICIT
0.40
INEQUALITY / GINI INDEX
4,263
LABOR FORCE [ PEOPLE ]
61.0%
PERCENT IN LABOR FORCE
2.6%
UNEMPLOYMENT RATE
Monona County Area Codes
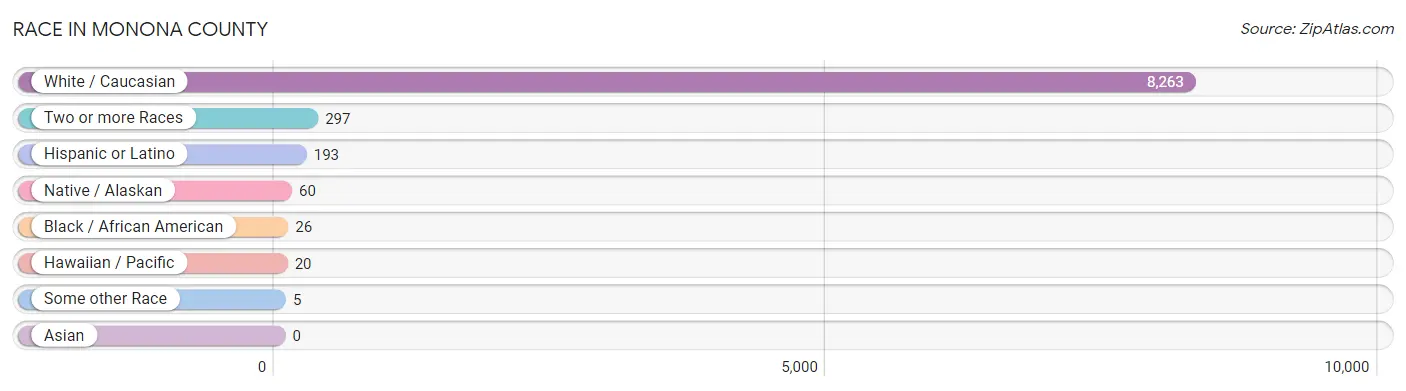
Race in Monona County
The most populous races in Monona County are White / Caucasian (8,263 | 95.3%), Two or more Races (297 | 3.4%), and Hispanic or Latino (193 | 2.2%).
| Race | # Population | % Population |
| Asian | 0 | 0.0% |
| Black / African American | 26 | 0.3% |
| Hawaiian / Pacific | 20 | 0.2% |
| Hispanic or Latino | 193 | 2.2% |
| Native / Alaskan | 60 | 0.7% |
| White / Caucasian | 8,263 | 95.3% |
| Two or more Races | 297 | 3.4% |
| Some other Race | 5 | 0.1% |
| Total | 8,671 | 100.0% |
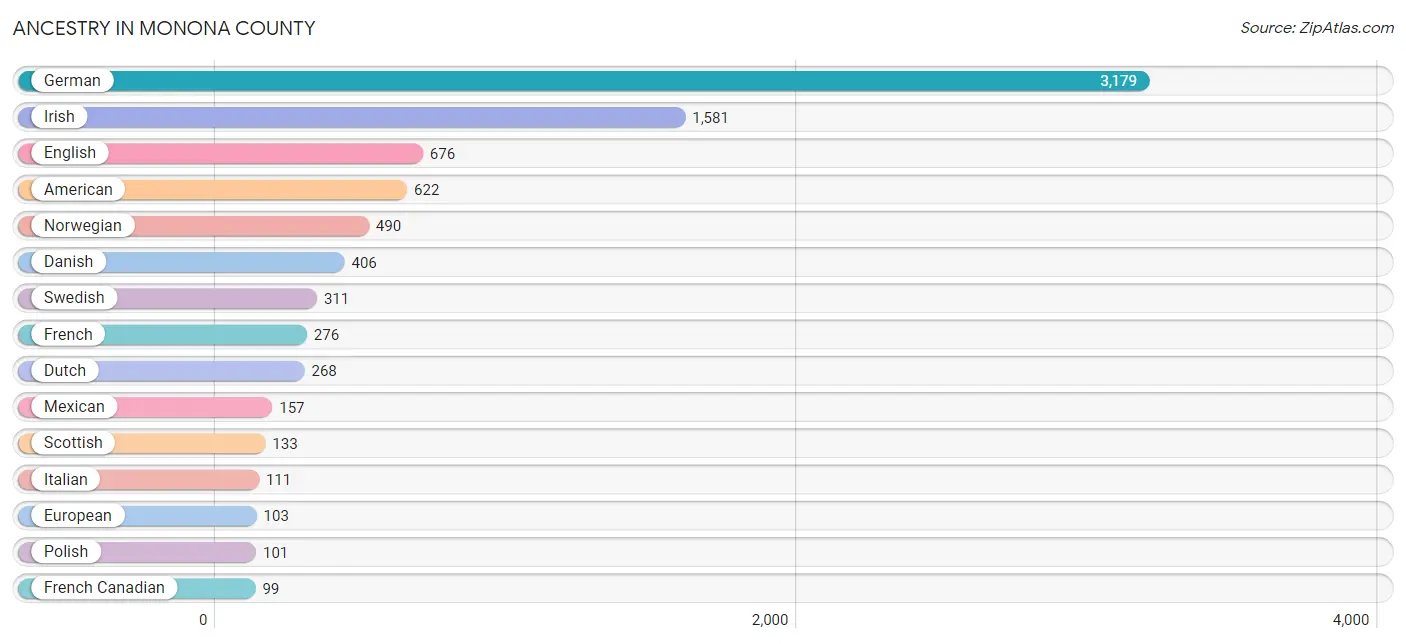
Ancestry in Monona County
The most populous ancestries reported in Monona County are German (3,179 | 36.7%), Irish (1,581 | 18.2%), English (676 | 7.8%), American (622 | 7.2%), and Norwegian (490 | 5.7%), together accounting for 75.5% of all Monona County residents.
| Ancestry | # Population | % Population |
| African | 9 | 0.1% |
| American | 622 | 7.2% |
| Belgian | 1 | 0.0% |
| British | 15 | 0.2% |
| Canadian | 3 | 0.0% |
| Central American | 4 | 0.1% |
| Central American Indian | 4 | 0.1% |
| Cherokee | 1 | 0.0% |
| Chippewa | 3 | 0.0% |
| Colombian | 3 | 0.0% |
| Costa Rican | 3 | 0.0% |
| Croatian | 2 | 0.0% |
| Cuban | 4 | 0.1% |
| Czech | 65 | 0.7% |
| Czechoslovakian | 23 | 0.3% |
| Danish | 406 | 4.7% |
| Delaware | 1 | 0.0% |
| Dutch | 268 | 3.1% |
| English | 676 | 7.8% |
| European | 103 | 1.2% |
| Finnish | 1 | 0.0% |
| French | 276 | 3.2% |
| French Canadian | 99 | 1.1% |
| German | 3,179 | 36.7% |
| Greek | 1 | 0.0% |
| Hungarian | 16 | 0.2% |
| Irish | 1,581 | 18.2% |
| Italian | 111 | 1.3% |
| Lithuanian | 11 | 0.1% |
| Luxembourger | 6 | 0.1% |
| Mexican | 157 | 1.8% |
| Native Hawaiian | 20 | 0.2% |
| Northern European | 5 | 0.1% |
| Norwegian | 490 | 5.7% |
| Pennsylvania German | 1 | 0.0% |
| Polish | 101 | 1.2% |
| Portuguese | 1 | 0.0% |
| Potawatomi | 9 | 0.1% |
| Puerto Rican | 6 | 0.1% |
| Romanian | 1 | 0.0% |
| Russian | 24 | 0.3% |
| Salvadoran | 1 | 0.0% |
| Scandinavian | 68 | 0.8% |
| Scotch-Irish | 29 | 0.3% |
| Scottish | 133 | 1.5% |
| Sioux | 48 | 0.5% |
| South African | 22 | 0.3% |
| South American | 3 | 0.0% |
| Spaniard | 2 | 0.0% |
| Subsaharan African | 31 | 0.4% |
| Swedish | 311 | 3.6% |
| Swiss | 8 | 0.1% |
| Welsh | 24 | 0.3% | View All 53 Rows |
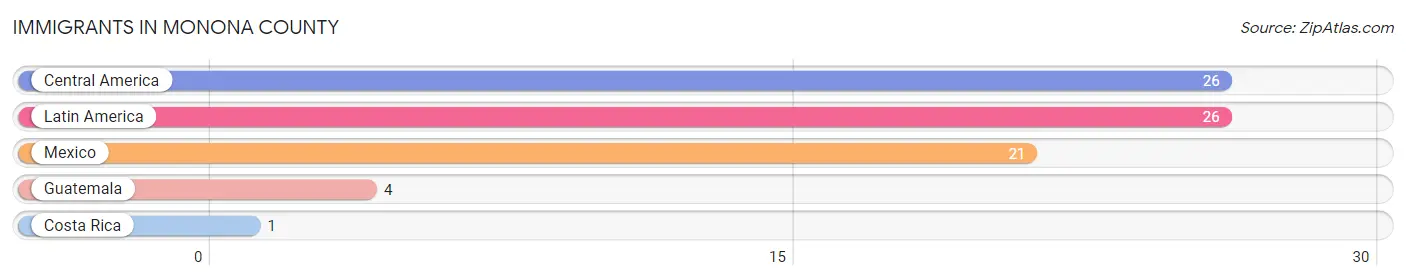
Immigrants in Monona County
The most numerous immigrant groups reported in Monona County came from Central America (26 | 0.3%), Latin America (26 | 0.3%), Mexico (21 | 0.2%), Guatemala (4 | 0.1%), and Costa Rica (1 | 0.0%), together accounting for 0.9% of all Monona County residents.
| Immigration Origin | # Population | % Population |
| Central America | 26 | 0.3% |
| Costa Rica | 1 | 0.0% |
| Guatemala | 4 | 0.1% |
| Latin America | 26 | 0.3% |
| Mexico | 21 | 0.2% | View All 5 Rows |
Sex and Age in Monona County
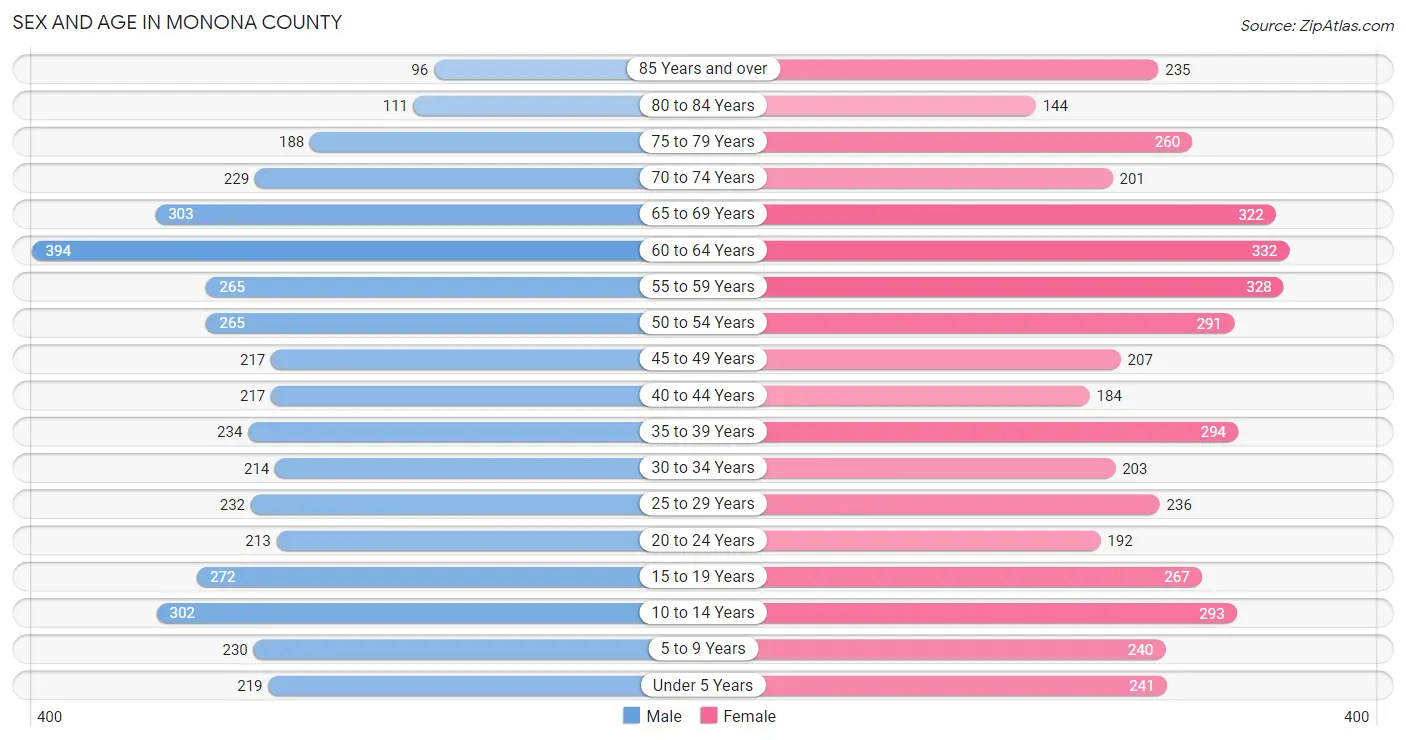
Sex and Age in Monona County
The most populous age groups in Monona County are 60 to 64 Years (394 | 9.4%) for men and 60 to 64 Years (332 | 7.4%) for women.
| Age Bracket | Male | Female |
| Under 5 Years | 219 (5.2%) | 241 (5.4%) |
| 5 to 9 Years | 230 (5.5%) | 240 (5.4%) |
| 10 to 14 Years | 302 (7.2%) | 293 (6.6%) |
| 15 to 19 Years | 272 (6.5%) | 267 (6.0%) |
| 20 to 24 Years | 213 (5.1%) | 192 (4.3%) |
| 25 to 29 Years | 232 (5.5%) | 236 (5.3%) |
| 30 to 34 Years | 214 (5.1%) | 203 (4.5%) |
| 35 to 39 Years | 234 (5.6%) | 294 (6.6%) |
| 40 to 44 Years | 217 (5.2%) | 184 (4.1%) |
| 45 to 49 Years | 217 (5.2%) | 207 (4.6%) |
| 50 to 54 Years | 265 (6.3%) | 291 (6.5%) |
| 55 to 59 Years | 265 (6.3%) | 328 (7.3%) |
| 60 to 64 Years | 394 (9.4%) | 332 (7.4%) |
| 65 to 69 Years | 303 (7.2%) | 322 (7.2%) |
| 70 to 74 Years | 229 (5.4%) | 201 (4.5%) |
| 75 to 79 Years | 188 (4.5%) | 260 (5.8%) |
| 80 to 84 Years | 111 (2.6%) | 144 (3.2%) |
| 85 Years and over | 96 (2.3%) | 235 (5.3%) |
| Total | 4,201 (100.0%) | 4,470 (100.0%) |
Families and Households in Monona County
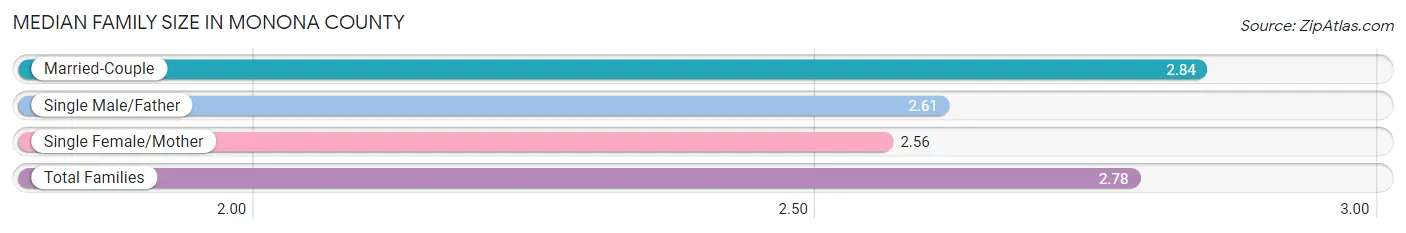
Median Family Size in Monona County
The median family size in Monona County is 2.78 persons per family, with married-couple families (1,833 | 78.2%) accounting for the largest median family size of 2.84 persons per family. On the other hand, single female/mother families (359 | 15.3%) represent the smallest median family size with 2.56 persons per family.
| Family Type | # Families | Family Size |
| Married-Couple | 1,833 (78.2%) | 2.84 |
| Single Male/Father | 153 (6.5%) | 2.61 |
| Single Female/Mother | 359 (15.3%) | 2.56 |
| Total Families | 2,345 (100.0%) | 2.78 |
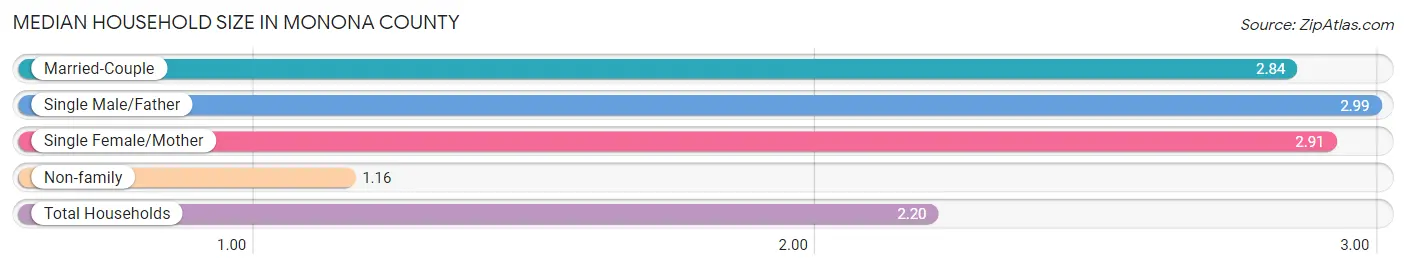
Median Household Size in Monona County
The median household size in Monona County is 2.20 persons per household, with single male/father households (153 | 4.0%) accounting for the largest median household size of 2.99 persons per household. non-family households (1,507 | 39.1%) represent the smallest median household size with 1.16 persons per household.
| Household Type | # Households | Household Size |
| Married-Couple | 1,833 (47.6%) | 2.84 |
| Single Male/Father | 153 (4.0%) | 2.99 |
| Single Female/Mother | 359 (9.3%) | 2.91 |
| Non-family | 1,507 (39.1%) | 1.16 |
| Total Households | 3,852 (100.0%) | 2.20 |
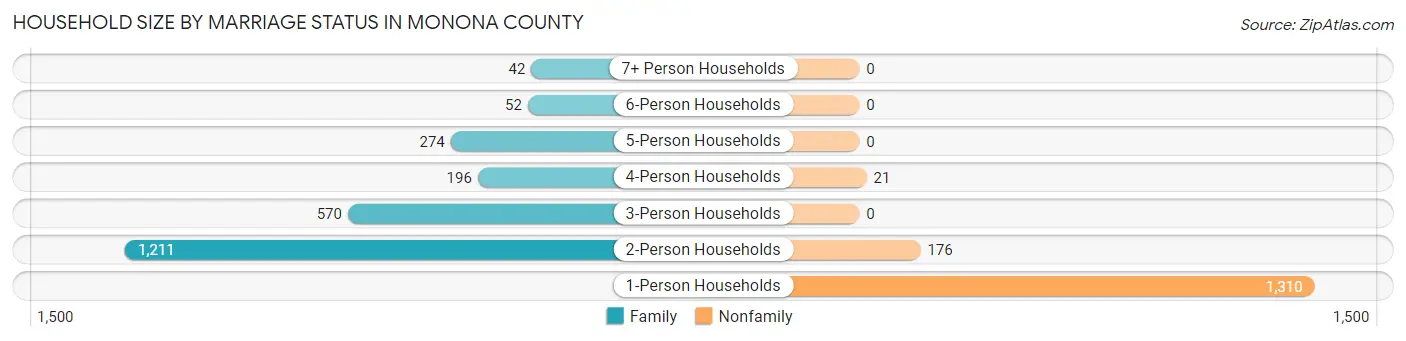
Household Size by Marriage Status in Monona County
Out of a total of 3,852 households in Monona County, 2,345 (60.9%) are family households, while 1,507 (39.1%) are nonfamily households. The most numerous type of family households are 2-person households, comprising 1,211, and the most common type of nonfamily households are 1-person households, comprising 1,310.
| Household Size | Family Households | Nonfamily Households |
| 1-Person Households | - | 1,310 (34.0%) |
| 2-Person Households | 1,211 (31.4%) | 176 (4.6%) |
| 3-Person Households | 570 (14.8%) | 0 (0.0%) |
| 4-Person Households | 196 (5.1%) | 21 (0.5%) |
| 5-Person Households | 274 (7.1%) | 0 (0.0%) |
| 6-Person Households | 52 (1.3%) | 0 (0.0%) |
| 7+ Person Households | 42 (1.1%) | 0 (0.0%) |
| Total | 2,345 (60.9%) | 1,507 (39.1%) |
Female Fertility in Monona County
Fertility by Age in Monona County
Average fertility rate in Monona County is 76.0 births per 1,000 women. Women in the age bracket of 20 to 34 years have the highest fertility rate with 177.0 births per 1,000 women. Women in the age bracket of 20 to 34 years acount for 88.9% of all women with births.

| Age Bracket | Women with Births | Births / 1,000 Women |
| 15 to 19 years | 0 (0.0%) | 0.0 |
| 20 to 34 years | 112 (88.9%) | 177.0 |
| 35 to 50 years | 14 (11.1%) | 18.0 |
| Total | 126 (100.0%) | 76.0 |
Fertility by Age by Marriage Status in Monona County
75.4% of women with births (126) in Monona County are married. The highest percentage of unmarried women with births falls into 20 to 34 years age bracket with 25.9% of them unmarried at the time of birth, while the lowest percentage of unmarried women with births belong to 35 to 50 years age bracket with 14.3% of them unmarried.
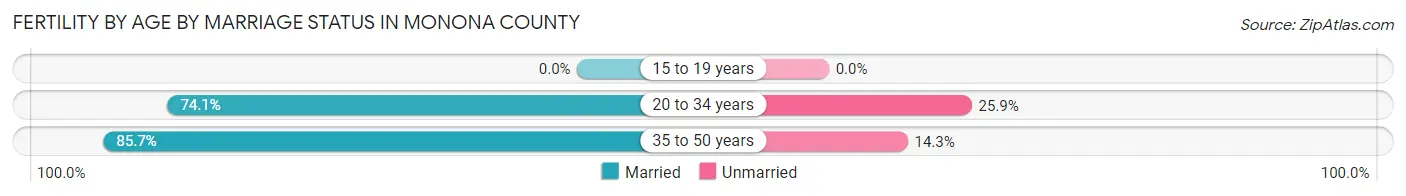
| Age Bracket | Married | Unmarried |
| 15 to 19 years | 0 (0.0%) | 0 (0.0%) |
| 20 to 34 years | 83 (74.1%) | 29 (25.9%) |
| 35 to 50 years | 12 (85.7%) | 2 (14.3%) |
| Total | 95 (75.4%) | 31 (24.6%) |
Fertility by Education in Monona County
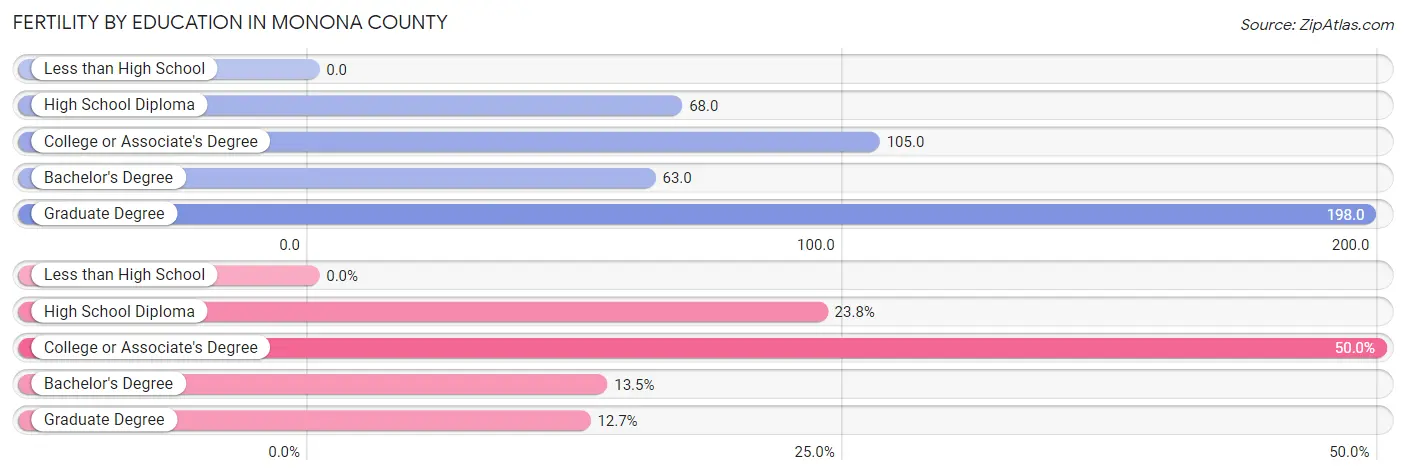
| Educational Attainment | Women with Births | Births / 1,000 Women |
| Less than High School | 0 (0.0%) | 0.0 |
| High School Diploma | 30 (23.8%) | 68.0 |
| College or Associate's Degree | 63 (50.0%) | 105.0 |
| Bachelor's Degree | 17 (13.5%) | 63.0 |
| Graduate Degree | 16 (12.7%) | 198.0 |
| Total | 126 (100.0%) | 76.0 |
Fertility by Education by Marriage Status in Monona County
24.6% of women with births in Monona County are unmarried. Women with the educational attainment of bachelor's degree are most likely to be married with 100.0% of them married at childbirth, while women with the educational attainment of college or associate's degree are least likely to be married with 39.7% of them unmarried at childbirth.
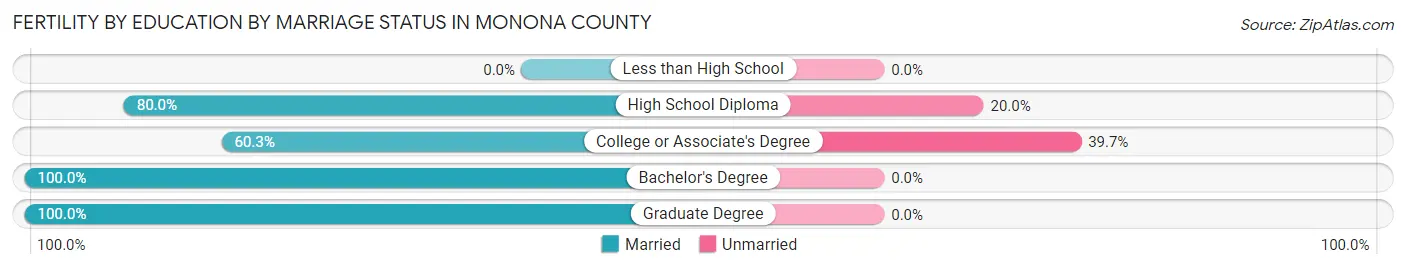
| Educational Attainment | Married | Unmarried |
| Less than High School | 0 (0.0%) | 0 (0.0%) |
| High School Diploma | 24 (80.0%) | 6 (20.0%) |
| College or Associate's Degree | 38 (60.3%) | 25 (39.7%) |
| Bachelor's Degree | 17 (100.0%) | 0 (0.0%) |
| Graduate Degree | 16 (100.0%) | 0 (0.0%) |
| Total | 95 (75.4%) | 31 (24.6%) |
Income in Monona County
Income Overview in Monona County
Per Capita Income in Monona County is $33,080, while median incomes of families and households are $76,144 and $59,897 respectively.
| Characteristic | Number | Measure |
| Per Capita Income | 8,671 | $33,080 |
| Median Family Income | 2,345 | $76,144 |
| Mean Family Income | 2,345 | $88,768 |
| Median Household Income | 3,852 | $59,897 |
| Mean Household Income | 3,852 | $73,609 |
| Income Deficit | 2,345 | $9,519 |
| Wage / Income Gap (%) | 8,671 | 33.48% |
| Wage / Income Gap ($) | 8,671 | 66.52¢ per $1 |
| Gini / Inequality Index | 8,671 | 0.40 |
Earnings by Sex in Monona County
Average Earnings in Monona County are $38,103, $47,089 for men and $31,322 for women, a difference of 33.5%.
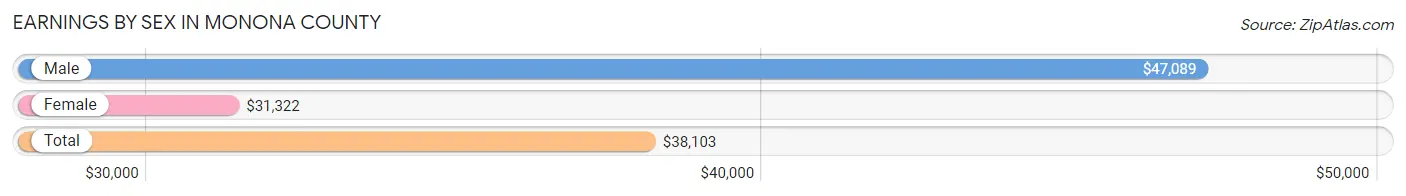
| Sex | Number | Average Earnings |
| Male | 2,302 (51.1%) | $47,089 |
| Female | 2,203 (48.9%) | $31,322 |
| Total | 4,505 (100.0%) | $38,103 |
Earnings by Sex by Income Bracket in Monona County
The most common earnings brackets in Monona County are $100,000+ for men (302 | 13.1%) and $30,000 to $34,999 for women (269 | 12.2%).
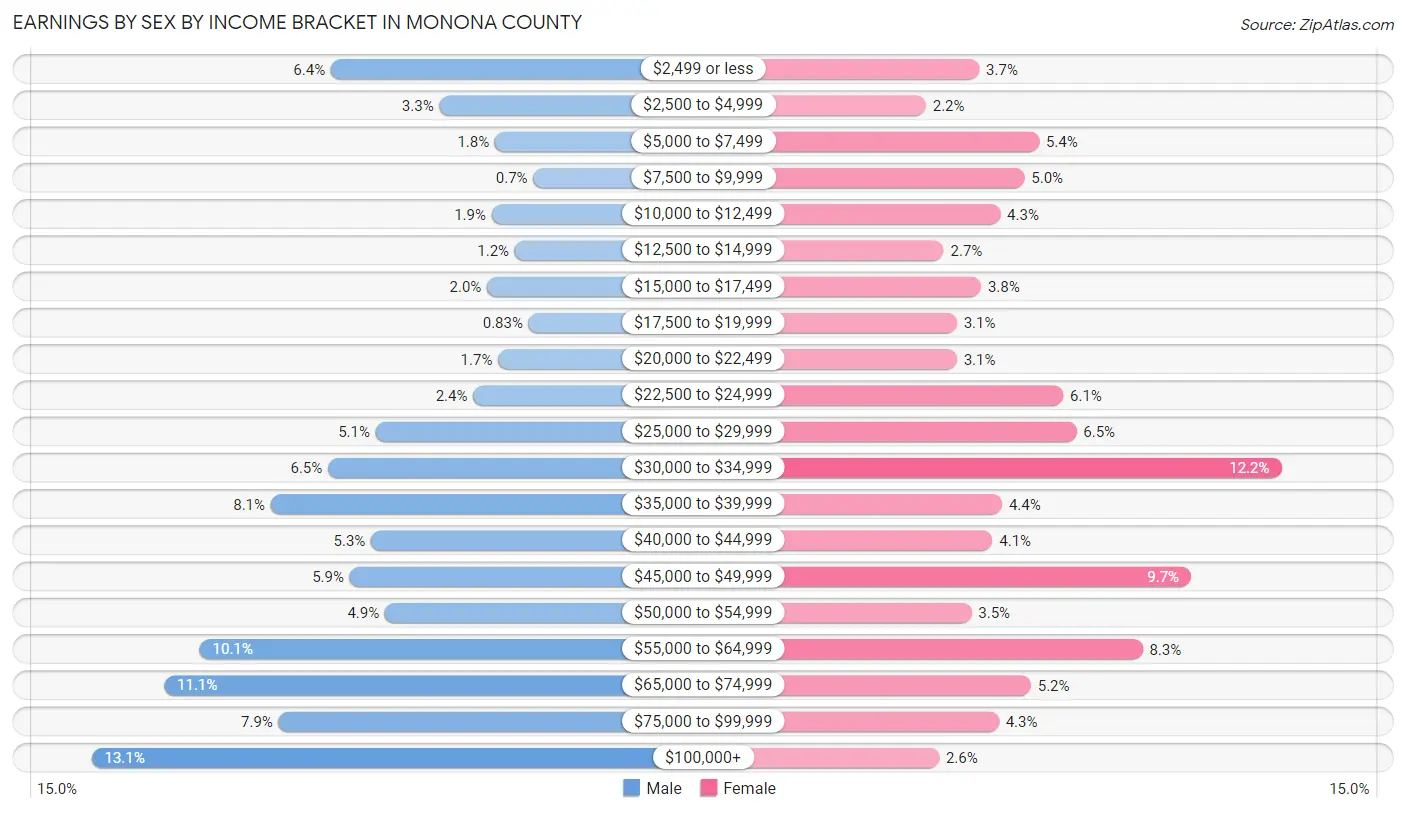
| Income | Male | Female |
| $2,499 or less | 147 (6.4%) | 82 (3.7%) |
| $2,500 to $4,999 | 77 (3.3%) | 49 (2.2%) |
| $5,000 to $7,499 | 41 (1.8%) | 119 (5.4%) |
| $7,500 to $9,999 | 16 (0.7%) | 110 (5.0%) |
| $10,000 to $12,499 | 43 (1.9%) | 95 (4.3%) |
| $12,500 to $14,999 | 28 (1.2%) | 60 (2.7%) |
| $15,000 to $17,499 | 46 (2.0%) | 83 (3.8%) |
| $17,500 to $19,999 | 19 (0.8%) | 68 (3.1%) |
| $20,000 to $22,499 | 39 (1.7%) | 68 (3.1%) |
| $22,500 to $24,999 | 55 (2.4%) | 134 (6.1%) |
| $25,000 to $29,999 | 118 (5.1%) | 142 (6.5%) |
| $30,000 to $34,999 | 149 (6.5%) | 269 (12.2%) |
| $35,000 to $39,999 | 186 (8.1%) | 96 (4.4%) |
| $40,000 to $44,999 | 121 (5.3%) | 90 (4.1%) |
| $45,000 to $49,999 | 135 (5.9%) | 213 (9.7%) |
| $50,000 to $54,999 | 112 (4.9%) | 77 (3.5%) |
| $55,000 to $64,999 | 232 (10.1%) | 183 (8.3%) |
| $65,000 to $74,999 | 255 (11.1%) | 114 (5.2%) |
| $75,000 to $99,999 | 181 (7.9%) | 94 (4.3%) |
| $100,000+ | 302 (13.1%) | 57 (2.6%) |
| Total | 2,302 (100.0%) | 2,203 (100.0%) |
Earnings by Sex by Educational Attainment in Monona County
Average earnings in Monona County are $51,045 for men and $32,898 for women, a difference of 35.5%. Men with an educational attainment of bachelor's degree enjoy the highest average annual earnings of $67,841, while those with college or associate's degree education earn the least with $48,214. Women with an educational attainment of graduate degree earn the most with the average annual earnings of $78,669, while those with less than high school education have the smallest earnings of $12,708.
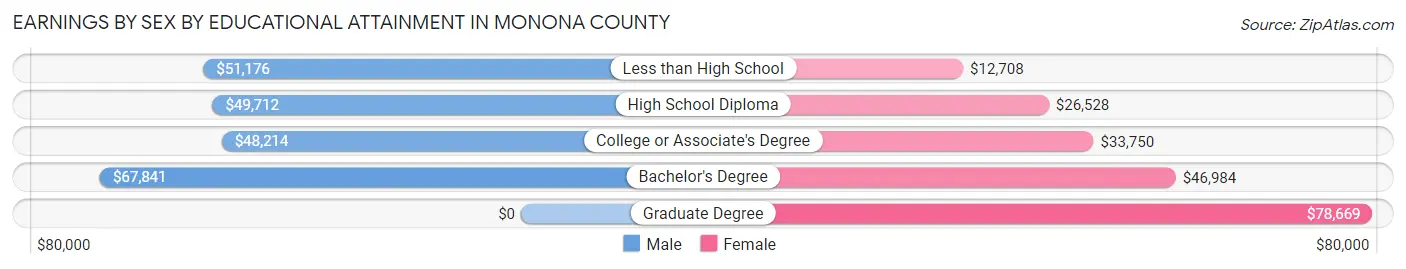
| Educational Attainment | Male Income | Female Income |
| Less than High School | $51,176 | $12,708 |
| High School Diploma | $49,712 | $26,528 |
| College or Associate's Degree | $48,214 | $33,750 |
| Bachelor's Degree | $67,841 | $46,984 |
| Graduate Degree | - | - |
| Total | $51,045 | $32,898 |
Family Income in Monona County
Family Income Brackets in Monona County
According to the Monona County family income data, there are 551 families falling into the $100,000 to $149,999 income range, which is the most common income bracket and makes up 23.5% of all families. Conversely, the $10,000 to $14,999 income bracket is the least frequent group with only 30 families (1.3%) belonging to this category.
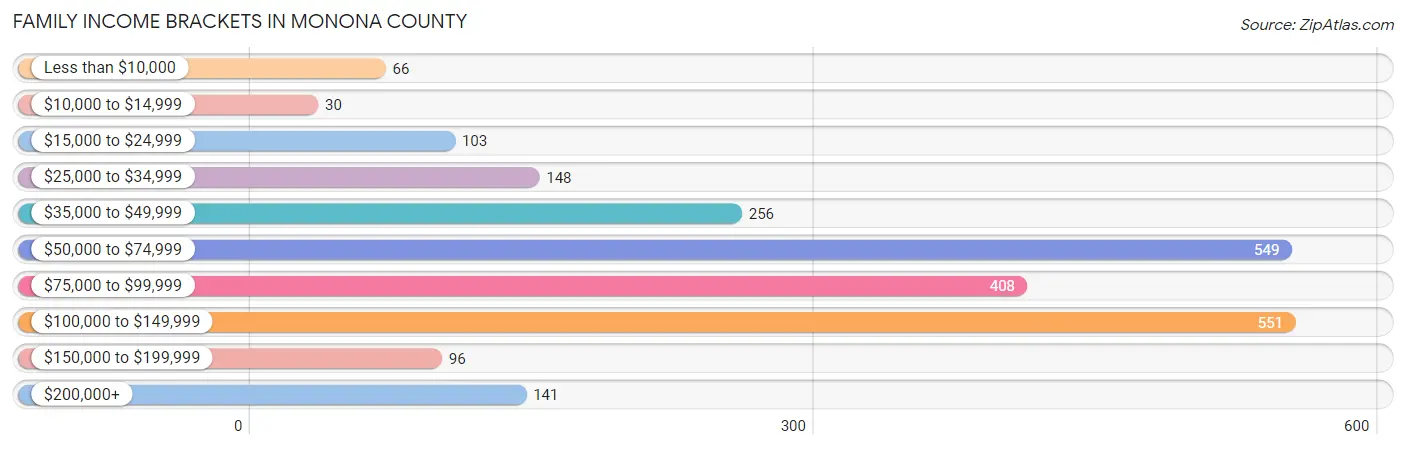
| Income Bracket | # Families | % Families |
| Less than $10,000 | 66 | 2.8% |
| $10,000 to $14,999 | 30 | 1.3% |
| $15,000 to $24,999 | 103 | 4.4% |
| $25,000 to $34,999 | 148 | 6.3% |
| $35,000 to $49,999 | 256 | 10.9% |
| $50,000 to $74,999 | 549 | 23.4% |
| $75,000 to $99,999 | 408 | 17.4% |
| $100,000 to $149,999 | 551 | 23.5% |
| $150,000 to $199,999 | 96 | 4.1% |
| $200,000+ | 141 | 6.0% |
Family Income by Famaliy Size in Monona County
4-person families (203 | 8.7%) account for the highest median family income in Monona County with $125,250 per family, while 2-person families (1,343 | 57.3%) have the highest median income of $32,752 per family member.
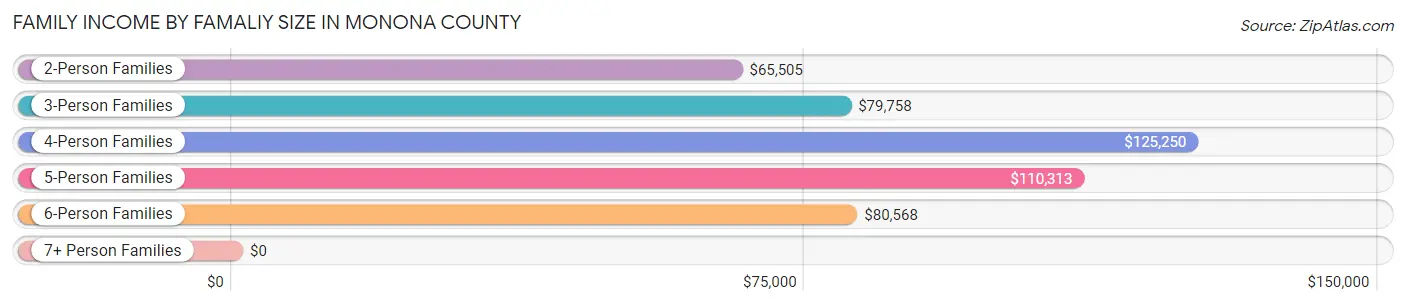
| Income Bracket | # Families | Median Income |
| 2-Person Families | 1,343 (57.3%) | $65,505 |
| 3-Person Families | 472 (20.1%) | $79,758 |
| 4-Person Families | 203 (8.7%) | $125,250 |
| 5-Person Families | 247 (10.5%) | $110,313 |
| 6-Person Families | 49 (2.1%) | $80,568 |
| 7+ Person Families | 31 (1.3%) | $0 |
| Total | 2,345 (100.0%) | $76,144 |
Family Income by Number of Earners in Monona County
The median family income in Monona County is $76,144, with families comprising 3+ earners (199) having the highest median family income of $117,009, while families with no earners (347) have the lowest median family income of $46,875, accounting for 8.5% and 14.8% of families, respectively.
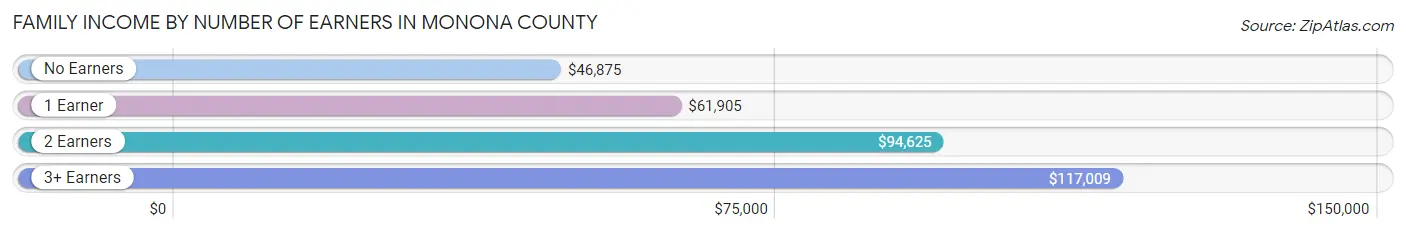
| Number of Earners | # Families | Median Income |
| No Earners | 347 (14.8%) | $46,875 |
| 1 Earner | 646 (27.6%) | $61,905 |
| 2 Earners | 1,153 (49.2%) | $94,625 |
| 3+ Earners | 199 (8.5%) | $117,009 |
| Total | 2,345 (100.0%) | $76,144 |
Household Income in Monona County
Household Income Brackets in Monona County
With 755 households falling in the category, the $50,000 to $74,999 income range is the most frequent in Monona County, accounting for 19.6% of all households. In contrast, only 104 households (2.7%) fall into the $150,000 to $199,999 income bracket, making it the least populous group.
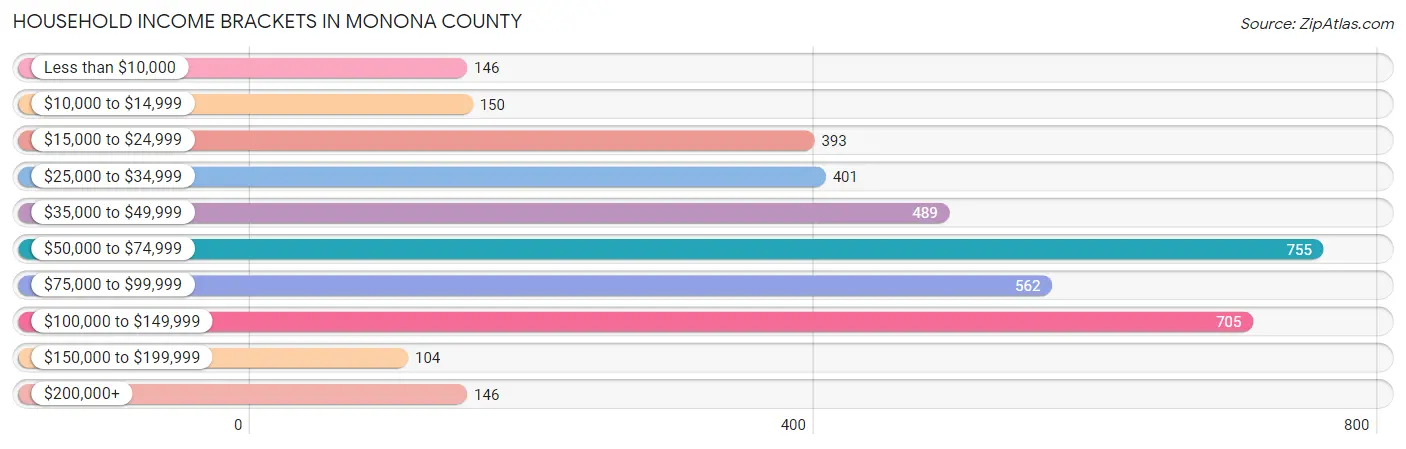
| Income Bracket | # Households | % Households |
| Less than $10,000 | 146 | 3.8% |
| $10,000 to $14,999 | 150 | 3.9% |
| $15,000 to $24,999 | 393 | 10.2% |
| $25,000 to $34,999 | 401 | 10.4% |
| $35,000 to $49,999 | 489 | 12.7% |
| $50,000 to $74,999 | 755 | 19.6% |
| $75,000 to $99,999 | 562 | 14.6% |
| $100,000 to $149,999 | 705 | 18.3% |
| $150,000 to $199,999 | 104 | 2.7% |
| $200,000+ | 146 | 3.8% |
Household Income by Householder Age in Monona County
The median household income in Monona County is $59,897, with the highest median household income of $79,665 found in the 25 to 44 years age bracket for the primary householder. A total of 1,037 households (26.9%) fall into this category. Meanwhile, the 65+ years age bracket for the primary householder has the lowest median household income of $42,054, with 1,359 households (35.3%) in this group.
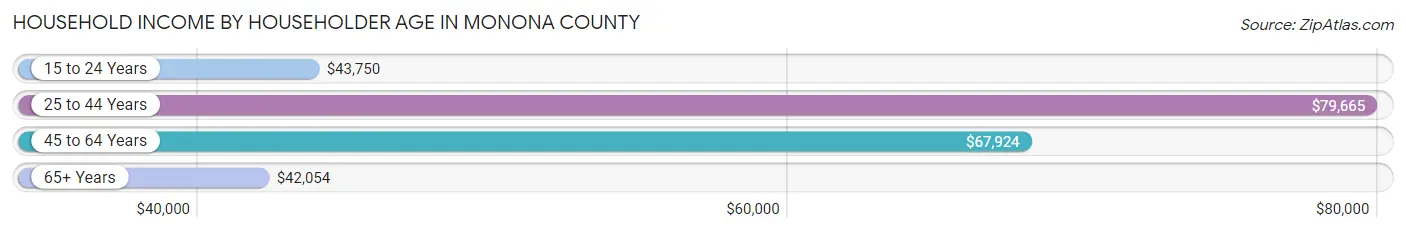
| Income Bracket | # Households | Median Income |
| 15 to 24 Years | 144 (3.7%) | $43,750 |
| 25 to 44 Years | 1,037 (26.9%) | $79,665 |
| 45 to 64 Years | 1,312 (34.1%) | $67,924 |
| 65+ Years | 1,359 (35.3%) | $42,054 |
| Total | 3,852 (100.0%) | $59,897 |
Poverty in Monona County
Income Below Poverty by Sex and Age in Monona County
With 11.8% poverty level for males and 12.8% for females among the residents of Monona County, 18 to 24 year old males and 12 to 14 year old females are the most vulnerable to poverty, with 106 males (35.9%) and 37 females (22.0%) in their respective age groups living below the poverty level.
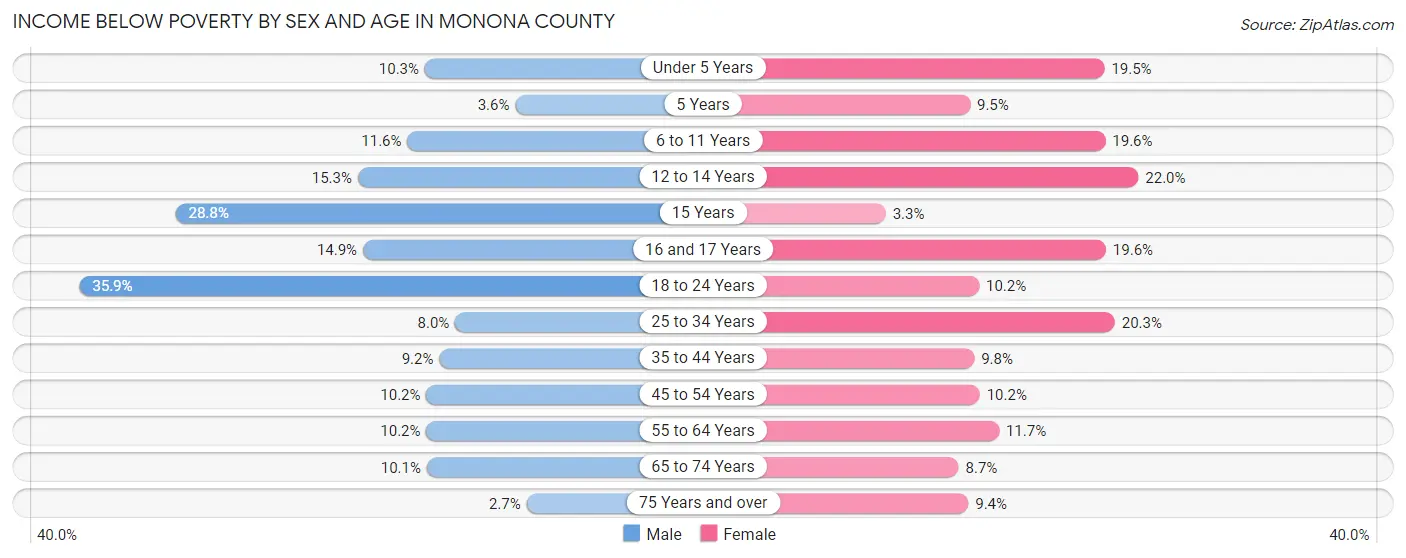
| Age Bracket | Male | Female |
| Under 5 Years | 22 (10.3%) | 47 (19.5%) |
| 5 Years | 1 (3.6%) | 8 (9.5%) |
| 6 to 11 Years | 36 (11.6%) | 55 (19.6%) |
| 12 to 14 Years | 29 (15.3%) | 37 (22.0%) |
| 15 Years | 19 (28.8%) | 3 (3.3%) |
| 16 and 17 Years | 18 (14.9%) | 20 (19.6%) |
| 18 to 24 Years | 106 (35.9%) | 27 (10.2%) |
| 25 to 34 Years | 35 (8.0%) | 89 (20.3%) |
| 35 to 44 Years | 41 (9.2%) | 47 (9.8%) |
| 45 to 54 Years | 48 (10.2%) | 51 (10.2%) |
| 55 to 64 Years | 67 (10.2%) | 77 (11.7%) |
| 65 to 74 Years | 51 (10.1%) | 45 (8.7%) |
| 75 Years and over | 10 (2.7%) | 51 (9.4%) |
| Total | 483 (11.8%) | 557 (12.8%) |
Income Above Poverty by Sex and Age in Monona County
According to the poverty statistics in Monona County, males aged 75 years and over and females aged 15 years are the age groups that are most secure financially, with 97.3% of males and 96.7% of females in these age groups living above the poverty line.
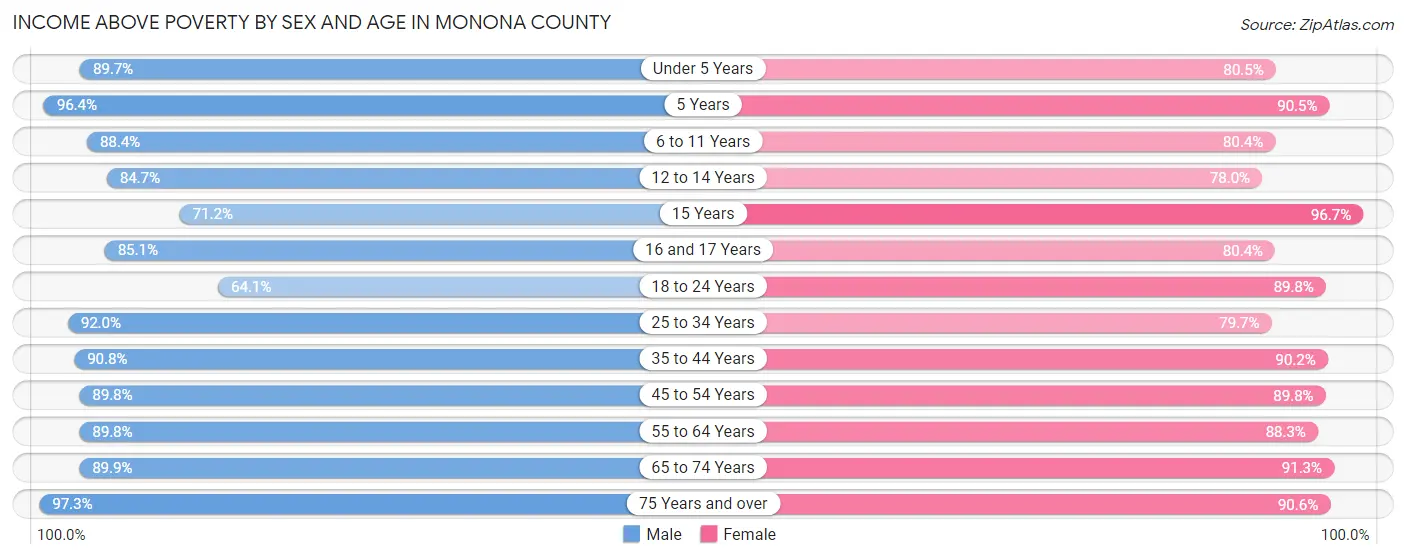
| Age Bracket | Male | Female |
| Under 5 Years | 192 (89.7%) | 194 (80.5%) |
| 5 Years | 27 (96.4%) | 76 (90.5%) |
| 6 to 11 Years | 275 (88.4%) | 226 (80.4%) |
| 12 to 14 Years | 161 (84.7%) | 131 (78.0%) |
| 15 Years | 47 (71.2%) | 89 (96.7%) |
| 16 and 17 Years | 103 (85.1%) | 82 (80.4%) |
| 18 to 24 Years | 189 (64.1%) | 238 (89.8%) |
| 25 to 34 Years | 401 (92.0%) | 350 (79.7%) |
| 35 to 44 Years | 404 (90.8%) | 431 (90.2%) |
| 45 to 54 Years | 424 (89.8%) | 447 (89.8%) |
| 55 to 64 Years | 592 (89.8%) | 583 (88.3%) |
| 65 to 74 Years | 452 (89.9%) | 474 (91.3%) |
| 75 Years and over | 356 (97.3%) | 492 (90.6%) |
| Total | 3,623 (88.2%) | 3,813 (87.3%) |
Income Below Poverty Among Married-Couple Families in Monona County
The poverty statistics for married-couple families in Monona County show that 5.0% or 91 of the total 1,833 families live below the poverty line. Families with 3 or 4 children have the highest poverty rate of 6.0%, comprising of 13 families. On the other hand, families with 5 or more children have the lowest poverty rate of 0.0%, which includes 0 families.
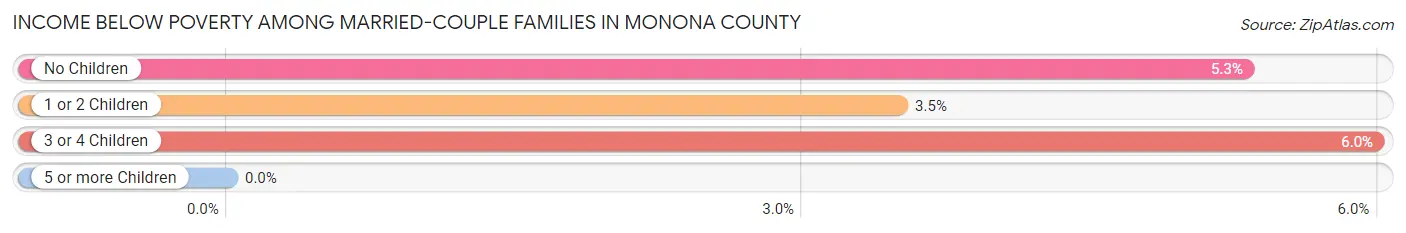
| Children | Above Poverty | Below Poverty |
| No Children | 1,123 (94.7%) | 63 (5.3%) |
| 1 or 2 Children | 414 (96.5%) | 15 (3.5%) |
| 3 or 4 Children | 204 (94.0%) | 13 (6.0%) |
| 5 or more Children | 1 (100.0%) | 0 (0.0%) |
| Total | 1,742 (95.0%) | 91 (5.0%) |
Income Below Poverty Among Single-Parent Households in Monona County
According to the poverty data in Monona County, 9.8% or 15 single-father households and 23.1% or 83 single-mother households are living below the poverty line. Among single-father households, those with 5 or more children have the highest poverty rate, with 4 households (100.0%) experiencing poverty. Likewise, among single-mother households, those with 1 or 2 children have the highest poverty rate, with 70 households (36.3%) falling below the poverty line.
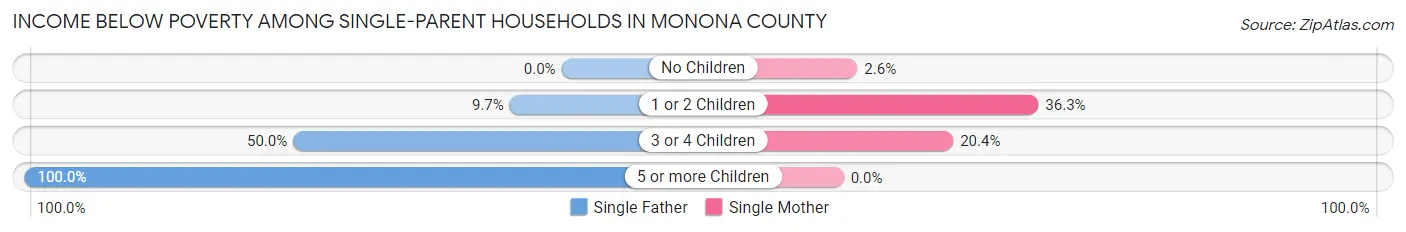
| Children | Single Father | Single Mother |
| No Children | 0 (0.0%) | 3 (2.6%) |
| 1 or 2 Children | 3 (9.7%) | 70 (36.3%) |
| 3 or 4 Children | 8 (50.0%) | 10 (20.4%) |
| 5 or more Children | 4 (100.0%) | 0 (0.0%) |
| Total | 15 (9.8%) | 83 (23.1%) |
Income Below Poverty Among Married-Couple vs Single-Parent Households in Monona County
The poverty data for Monona County shows that 91 of the married-couple family households (5.0%) and 98 of the single-parent households (19.1%) are living below the poverty level. Within the married-couple family households, those with 3 or 4 children have the highest poverty rate, with 13 households (6.0%) falling below the poverty line. Among the single-parent households, those with 5 or more children have the highest poverty rate, with 4 household (100.0%) living below poverty.
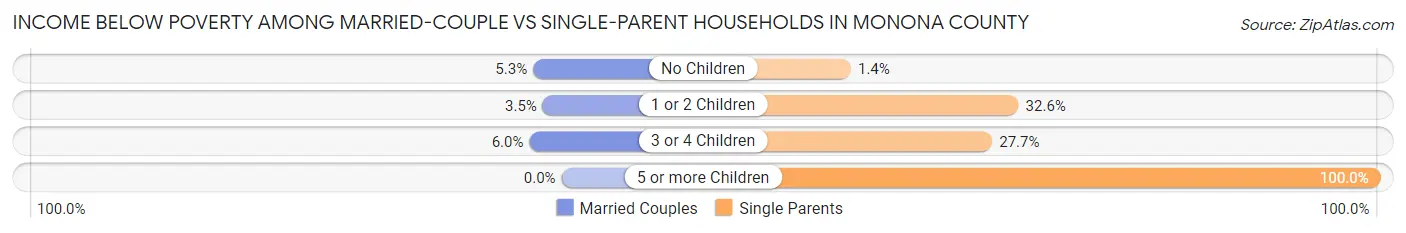
| Children | Married-Couple Families | Single-Parent Households |
| No Children | 63 (5.3%) | 3 (1.4%) |
| 1 or 2 Children | 15 (3.5%) | 73 (32.6%) |
| 3 or 4 Children | 13 (6.0%) | 18 (27.7%) |
| 5 or more Children | 0 (0.0%) | 4 (100.0%) |
| Total | 91 (5.0%) | 98 (19.1%) |
Employment Characteristics in Monona County
Employment by Class of Employer in Monona County
Among the 4,057 employed individuals in Monona County, private company employees (2,498 | 61.6%), self-employed (not incorporated) (460 | 11.3%), and local government employees (334 | 8.2%) make up the most common classes of employment.
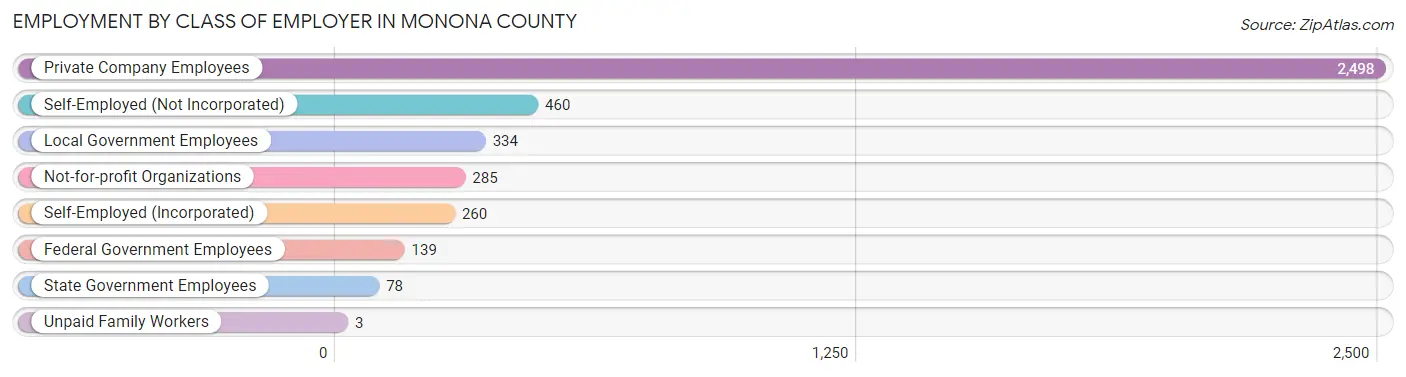
| Employer Class | # Employees | % Employees |
| Private Company Employees | 2,498 | 61.6% |
| Self-Employed (Incorporated) | 260 | 6.4% |
| Self-Employed (Not Incorporated) | 460 | 11.3% |
| Not-for-profit Organizations | 285 | 7.0% |
| Local Government Employees | 334 | 8.2% |
| State Government Employees | 78 | 1.9% |
| Federal Government Employees | 139 | 3.4% |
| Unpaid Family Workers | 3 | 0.1% |
| Total | 4,057 | 100.0% |
Employment Status by Age in Monona County
According to the labor force statistics for Monona County, out of the total population over 16 years of age (6,988), 61.0% or 4,263 individuals are in the labor force, with 2.6% or 111 of them unemployed. The age group with the highest labor force participation rate is 35 to 44 years, with 88.1% or 818 individuals in the labor force. Within the labor force, the 35 to 44 years age range has the highest percentage of unemployed individuals, with 6.7% or 55 of them being unemployed.
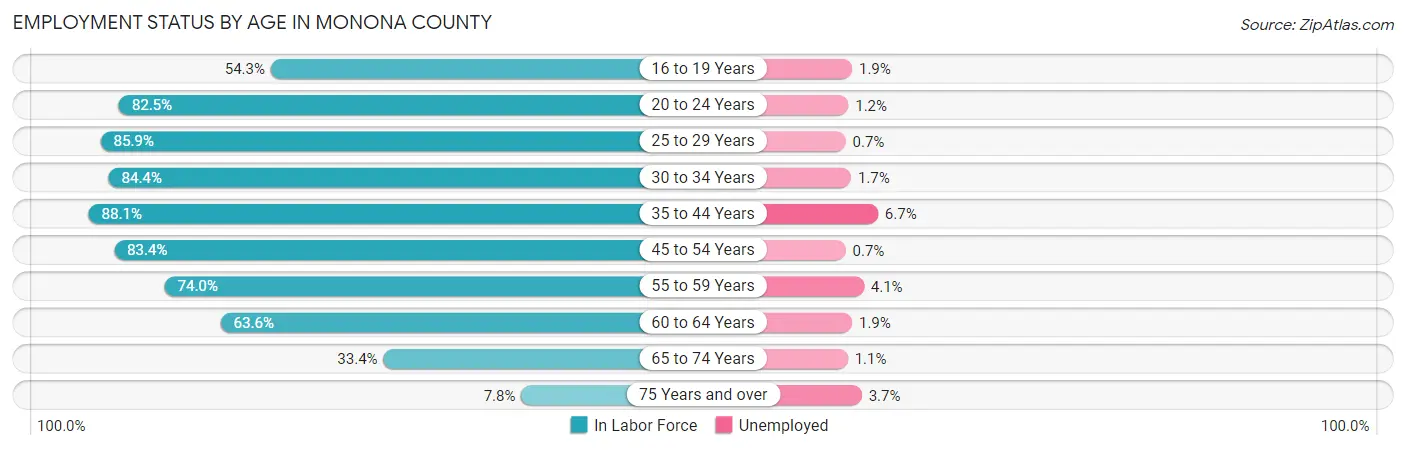
| Age Bracket | In Labor Force | Unemployed |
| 16 to 19 Years | 207 (54.3%) | 4 (1.9%) |
| 20 to 24 Years | 334 (82.5%) | 4 (1.2%) |
| 25 to 29 Years | 402 (85.9%) | 3 (0.7%) |
| 30 to 34 Years | 352 (84.4%) | 6 (1.7%) |
| 35 to 44 Years | 818 (88.1%) | 55 (6.7%) |
| 45 to 54 Years | 817 (83.4%) | 6 (0.7%) |
| 55 to 59 Years | 439 (74.0%) | 18 (4.1%) |
| 60 to 64 Years | 462 (63.6%) | 9 (1.9%) |
| 65 to 74 Years | 352 (33.4%) | 4 (1.1%) |
| 75 Years and over | 81 (7.8%) | 3 (3.7%) |
| Total | 4,263 (61.0%) | 111 (2.6%) |
Employment Status by Educational Attainment in Monona County
According to labor force statistics for Monona County, 80.0% of individuals (3,290) out of the total population between 25 and 64 years of age (4,113) are in the labor force, with 2.9% or 95 of them being unemployed. The group with the highest labor force participation rate are those with the educational attainment of bachelor's degree or higher, with 88.8% or 608 individuals in the labor force. Within the labor force, individuals with high school diploma education have the highest percentage of unemployment, with 4.7% or 47 of them being unemployed.
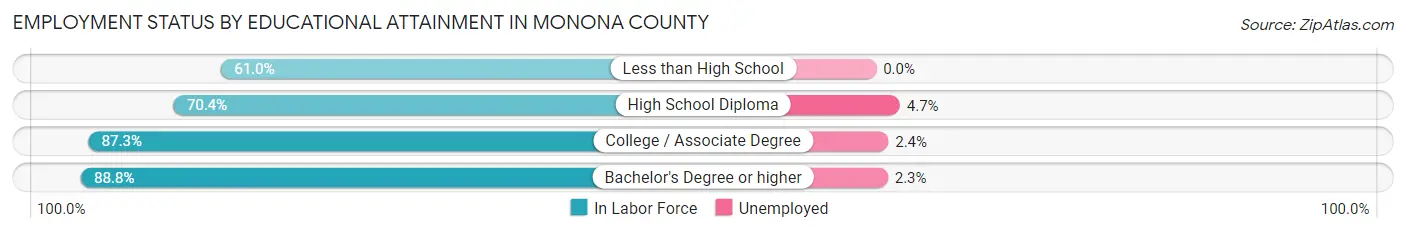
| Educational Attainment | In Labor Force | Unemployed |
| Less than High School | 166 (61.0%) | 0 (0.0%) |
| High School Diploma | 997 (70.4%) | 67 (4.7%) |
| College / Associate Degree | 1,519 (87.3%) | 42 (2.4%) |
| Bachelor's Degree or higher | 608 (88.8%) | 16 (2.3%) |
| Total | 3,290 (80.0%) | 119 (2.9%) |
Employment Occupations by Sex in Monona County
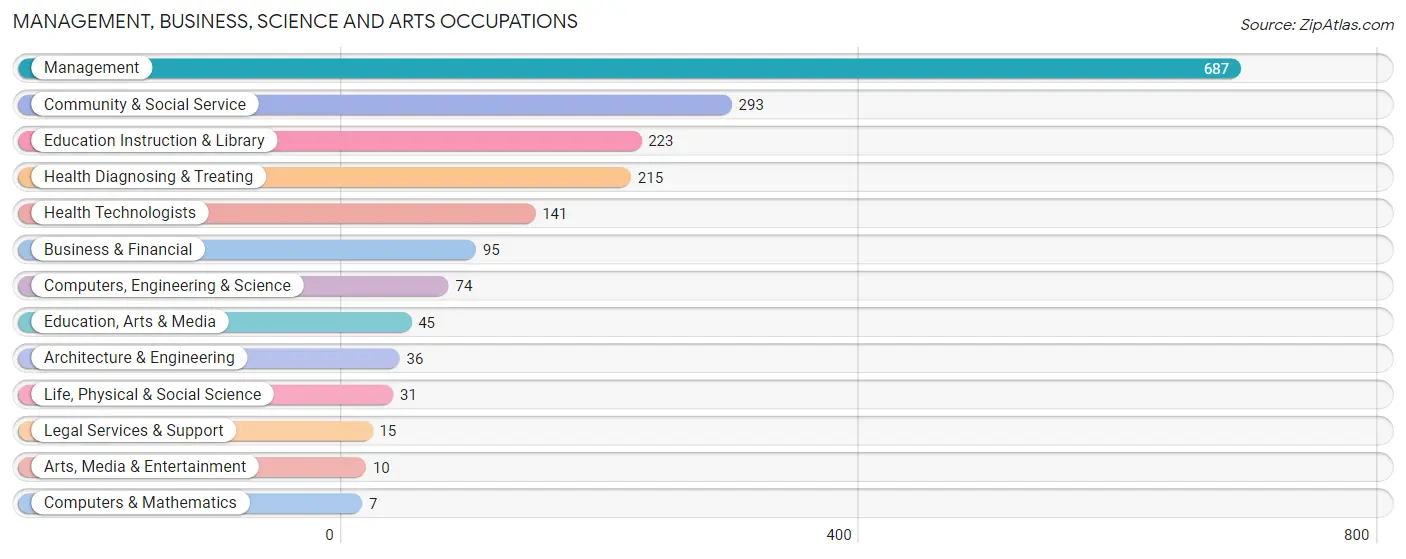
Management, Business, Science and Arts Occupations
The most common Management, Business, Science and Arts occupations in Monona County are Management (687 | 16.6%), Community & Social Service (293 | 7.1%), Education Instruction & Library (223 | 5.4%), Health Diagnosing & Treating (215 | 5.2%), and Health Technologists (141 | 3.4%).
Management, Business, Science and Arts Occupations by Sex
Within the Management, Business, Science and Arts occupations in Monona County, the most male-oriented occupations are Architecture & Engineering (83.3%), Computers, Engineering & Science (73.0%), and Computers & Mathematics (71.4%), while the most female-oriented occupations are Health Technologists (92.9%), Health Diagnosing & Treating (92.6%), and Business & Financial (87.4%).
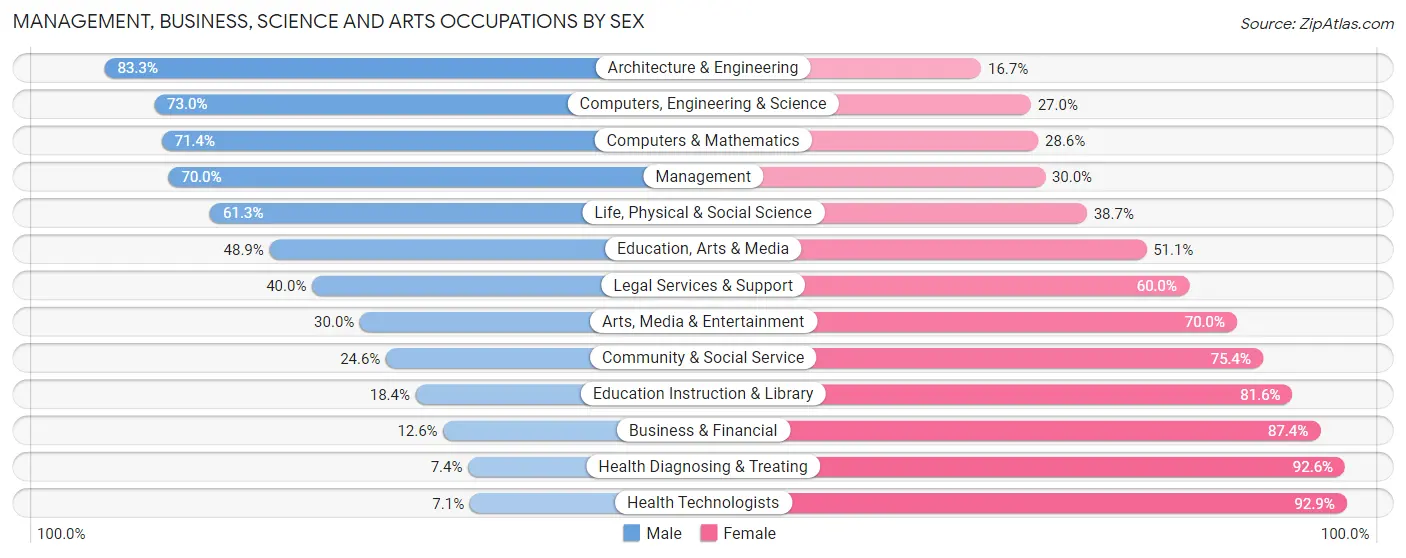
| Occupation | Male | Female |
| Management | 481 (70.0%) | 206 (30.0%) |
| Business & Financial | 12 (12.6%) | 83 (87.4%) |
| Computers, Engineering & Science | 54 (73.0%) | 20 (27.0%) |
| Computers & Mathematics | 5 (71.4%) | 2 (28.6%) |
| Architecture & Engineering | 30 (83.3%) | 6 (16.7%) |
| Life, Physical & Social Science | 19 (61.3%) | 12 (38.7%) |
| Community & Social Service | 72 (24.6%) | 221 (75.4%) |
| Education, Arts & Media | 22 (48.9%) | 23 (51.1%) |
| Legal Services & Support | 6 (40.0%) | 9 (60.0%) |
| Education Instruction & Library | 41 (18.4%) | 182 (81.6%) |
| Arts, Media & Entertainment | 3 (30.0%) | 7 (70.0%) |
| Health Diagnosing & Treating | 16 (7.4%) | 199 (92.6%) |
| Health Technologists | 10 (7.1%) | 131 (92.9%) |
| Total (Category) | 635 (46.6%) | 729 (53.4%) |
| Total (Overall) | 2,120 (51.1%) | 2,032 (48.9%) |
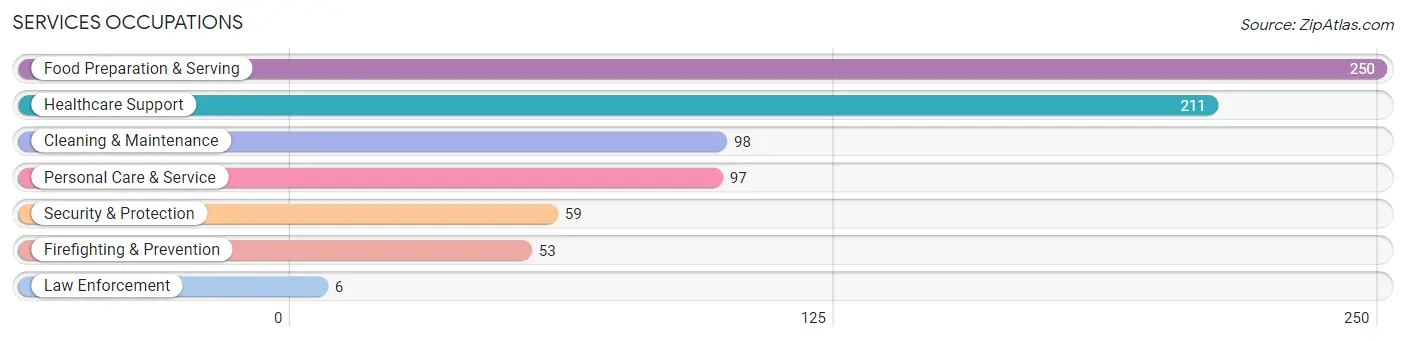
Services Occupations
The most common Services occupations in Monona County are Food Preparation & Serving (250 | 6.0%), Healthcare Support (211 | 5.1%), Cleaning & Maintenance (98 | 2.4%), Personal Care & Service (97 | 2.3%), and Security & Protection (59 | 1.4%).
Services Occupations by Sex
Within the Services occupations in Monona County, the most male-oriented occupations are Law Enforcement (100.0%), Security & Protection (74.6%), and Firefighting & Prevention (71.7%), while the most female-oriented occupations are Personal Care & Service (95.9%), Healthcare Support (91.9%), and Food Preparation & Serving (65.2%).
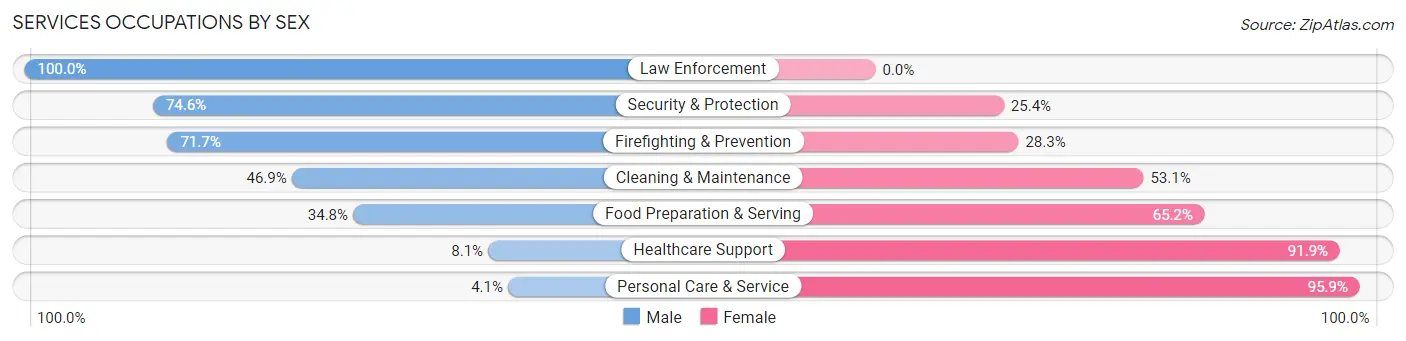
| Occupation | Male | Female |
| Healthcare Support | 17 (8.1%) | 194 (91.9%) |
| Security & Protection | 44 (74.6%) | 15 (25.4%) |
| Firefighting & Prevention | 38 (71.7%) | 15 (28.3%) |
| Law Enforcement | 6 (100.0%) | 0 (0.0%) |
| Food Preparation & Serving | 87 (34.8%) | 163 (65.2%) |
| Cleaning & Maintenance | 46 (46.9%) | 52 (53.1%) |
| Personal Care & Service | 4 (4.1%) | 93 (95.9%) |
| Total (Category) | 198 (27.7%) | 517 (72.3%) |
| Total (Overall) | 2,120 (51.1%) | 2,032 (48.9%) |
Sales and Office Occupations
The most common Sales and Office occupations in Monona County are Office & Administration (475 | 11.4%), and Sales & Related (364 | 8.8%).

Sales and Office Occupations by Sex
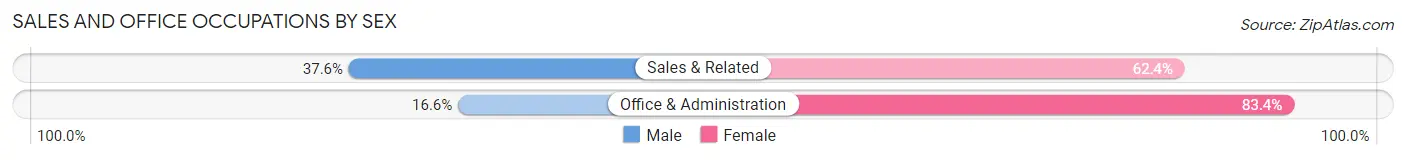
| Occupation | Male | Female |
| Sales & Related | 137 (37.6%) | 227 (62.4%) |
| Office & Administration | 79 (16.6%) | 396 (83.4%) |
| Total (Category) | 216 (25.7%) | 623 (74.3%) |
| Total (Overall) | 2,120 (51.1%) | 2,032 (48.9%) |
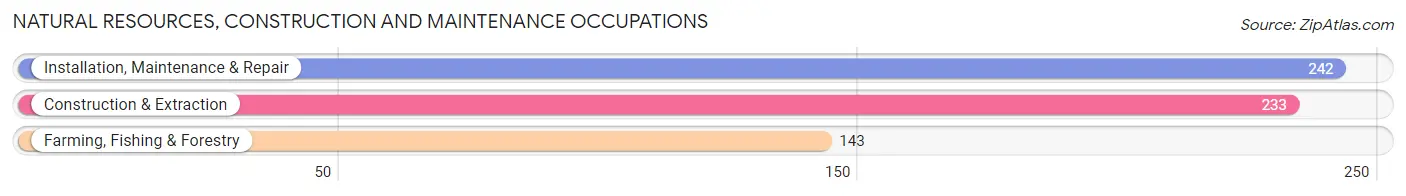
Natural Resources, Construction and Maintenance Occupations
The most common Natural Resources, Construction and Maintenance occupations in Monona County are Installation, Maintenance & Repair (242 | 5.8%), Construction & Extraction (233 | 5.6%), and Farming, Fishing & Forestry (143 | 3.4%).
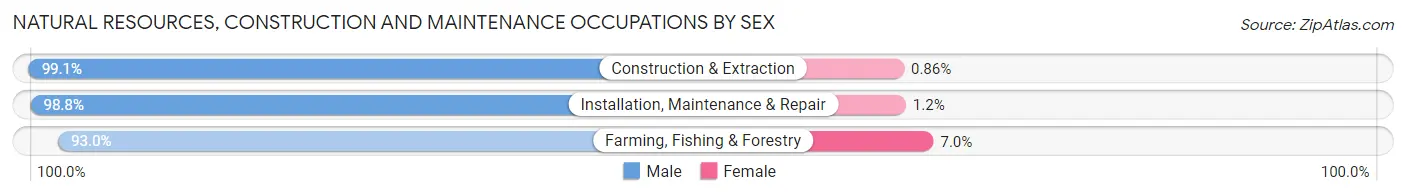
Natural Resources, Construction and Maintenance Occupations by Sex
| Occupation | Male | Female |
| Farming, Fishing & Forestry | 133 (93.0%) | 10 (7.0%) |
| Construction & Extraction | 231 (99.1%) | 2 (0.9%) |
| Installation, Maintenance & Repair | 239 (98.8%) | 3 (1.2%) |
| Total (Category) | 603 (97.6%) | 15 (2.4%) |
| Total (Overall) | 2,120 (51.1%) | 2,032 (48.9%) |
Production, Transportation and Moving Occupations
The most common Production, Transportation and Moving occupations in Monona County are Transportation (257 | 6.2%), Production (215 | 5.2%), and Material Moving (144 | 3.5%).

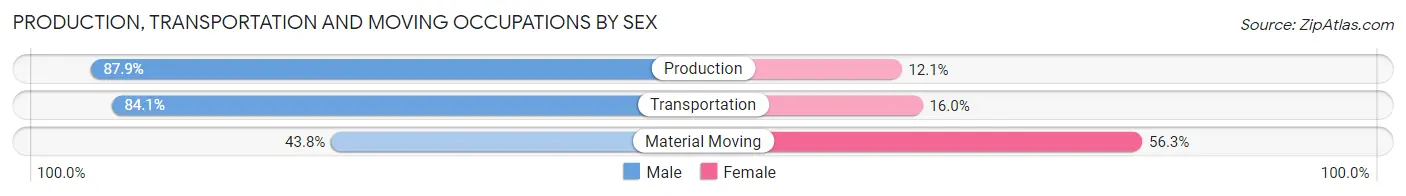
Production, Transportation and Moving Occupations by Sex
| Occupation | Male | Female |
| Production | 189 (87.9%) | 26 (12.1%) |
| Transportation | 216 (84.1%) | 41 (16.0%) |
| Material Moving | 63 (43.8%) | 81 (56.2%) |
| Total (Category) | 468 (76.0%) | 148 (24.0%) |
| Total (Overall) | 2,120 (51.1%) | 2,032 (48.9%) |
Employment Industries by Sex in Monona County
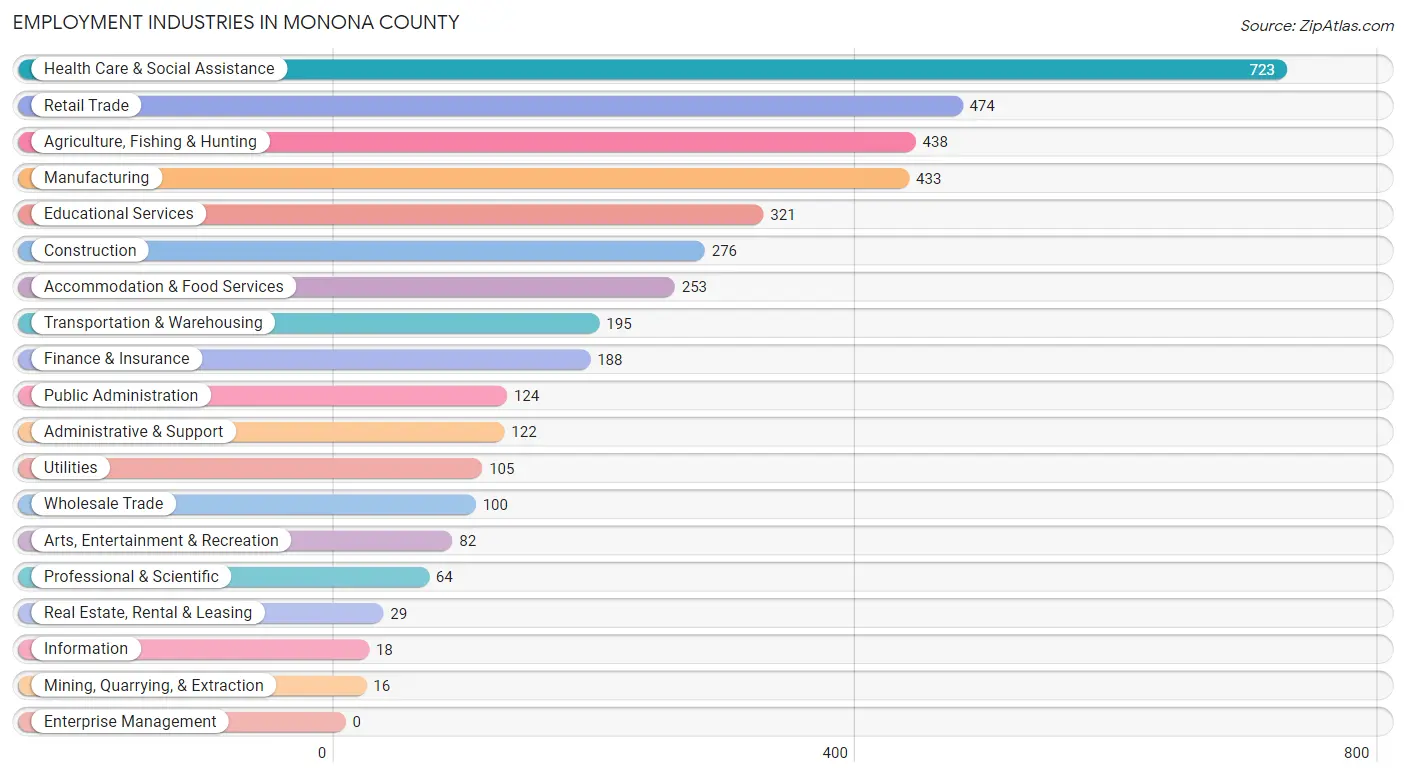
Employment Industries in Monona County
The major employment industries in Monona County include Health Care & Social Assistance (723 | 17.4%), Retail Trade (474 | 11.4%), Agriculture, Fishing & Hunting (438 | 10.5%), Manufacturing (433 | 10.4%), and Educational Services (321 | 7.7%).
Employment Industries by Sex in Monona County
The Monona County industries that see more men than women are Utilities (100.0%), Construction (98.9%), and Mining, Quarrying, & Extraction (93.8%), whereas the industries that tend to have a higher number of women are Arts, Entertainment & Recreation (89.0%), Public Administration (84.7%), and Health Care & Social Assistance (83.8%).

| Industry | Male | Female |
| Agriculture, Fishing & Hunting | 369 (84.3%) | 69 (15.8%) |
| Mining, Quarrying, & Extraction | 15 (93.8%) | 1 (6.2%) |
| Construction | 273 (98.9%) | 3 (1.1%) |
| Manufacturing | 327 (75.5%) | 106 (24.5%) |
| Wholesale Trade | 59 (59.0%) | 41 (41.0%) |
| Retail Trade | 176 (37.1%) | 298 (62.9%) |
| Transportation & Warehousing | 167 (85.6%) | 28 (14.4%) |
| Utilities | 105 (100.0%) | 0 (0.0%) |
| Information | 5 (27.8%) | 13 (72.2%) |
| Finance & Insurance | 41 (21.8%) | 147 (78.2%) |
| Real Estate, Rental & Leasing | 24 (82.8%) | 5 (17.2%) |
| Professional & Scientific | 19 (29.7%) | 45 (70.3%) |
| Enterprise Management | 0 (0.0%) | 0 (0.0%) |
| Administrative & Support | 67 (54.9%) | 55 (45.1%) |
| Educational Services | 89 (27.7%) | 232 (72.3%) |
| Health Care & Social Assistance | 117 (16.2%) | 606 (83.8%) |
| Arts, Entertainment & Recreation | 9 (11.0%) | 73 (89.0%) |
| Accommodation & Food Services | 85 (33.6%) | 168 (66.4%) |
| Public Administration | 19 (15.3%) | 105 (84.7%) |
| Total | 2,120 (51.1%) | 2,032 (48.9%) |
Education in Monona County
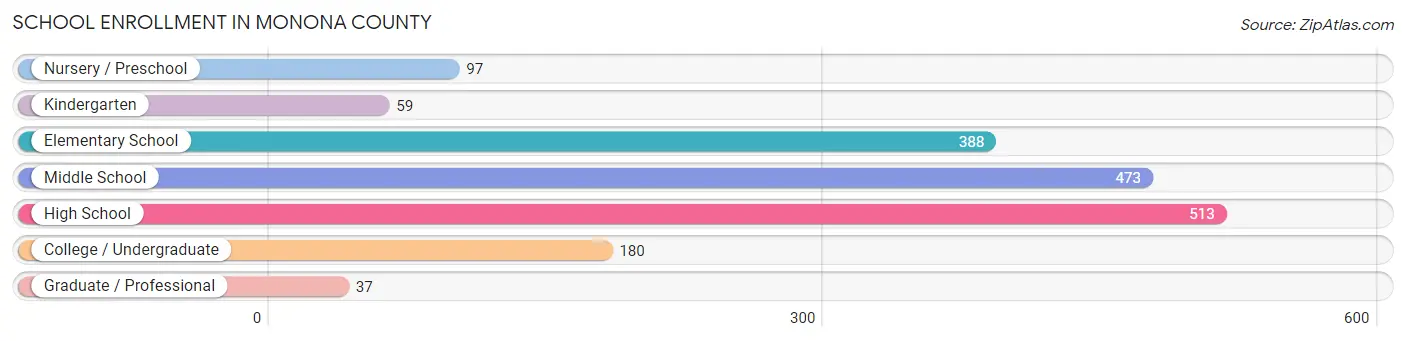
School Enrollment in Monona County
The most common levels of schooling among the 1,747 students in Monona County are high school (513 | 29.4%), middle school (473 | 27.1%), and elementary school (388 | 22.2%).
| School Level | # Students | % Students |
| Nursery / Preschool | 97 | 5.6% |
| Kindergarten | 59 | 3.4% |
| Elementary School | 388 | 22.2% |
| Middle School | 473 | 27.1% |
| High School | 513 | 29.4% |
| College / Undergraduate | 180 | 10.3% |
| Graduate / Professional | 37 | 2.1% |
| Total | 1,747 | 100.0% |
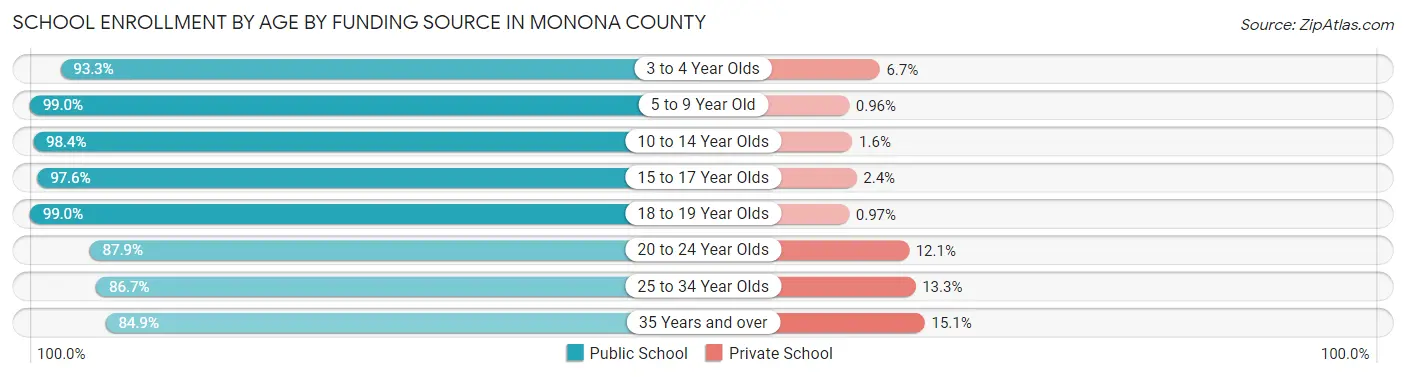
School Enrollment by Age by Funding Source in Monona County
Out of a total of 1,747 students who are enrolled in schools in Monona County, 54 (3.1%) attend a private institution, while the remaining 1,693 (96.9%) are enrolled in public schools. The age group of 35 years and over has the highest likelihood of being enrolled in private schools, with 11 (15.1% in the age bracket) enrolled. Conversely, the age group of 5 to 9 year old has the lowest likelihood of being enrolled in a private school, with 413 (99.0% in the age bracket) attending a public institution.
| Age Bracket | Public School | Private School |
| 3 to 4 Year Olds | 70 (93.3%) | 5 (6.7%) |
| 5 to 9 Year Old | 413 (99.0%) | 4 (1.0%) |
| 10 to 14 Year Olds | 562 (98.4%) | 9 (1.6%) |
| 15 to 17 Year Olds | 373 (97.6%) | 9 (2.4%) |
| 18 to 19 Year Olds | 102 (99.0%) | 1 (1.0%) |
| 20 to 24 Year Olds | 58 (87.9%) | 8 (12.1%) |
| 25 to 34 Year Olds | 52 (86.7%) | 8 (13.3%) |
| 35 Years and over | 62 (84.9%) | 11 (15.1%) |
| Total | 1,693 (96.9%) | 54 (3.1%) |
Educational Attainment by Field of Study in Monona County
Education (287 | 27.2%), business (213 | 20.2%), science & technology (124 | 11.7%), bio, nature & agricultural (103 | 9.8%), and arts & humanities (60 | 5.7%) are the most common fields of study among 1,055 individuals in Monona County who have obtained a bachelor's degree or higher.
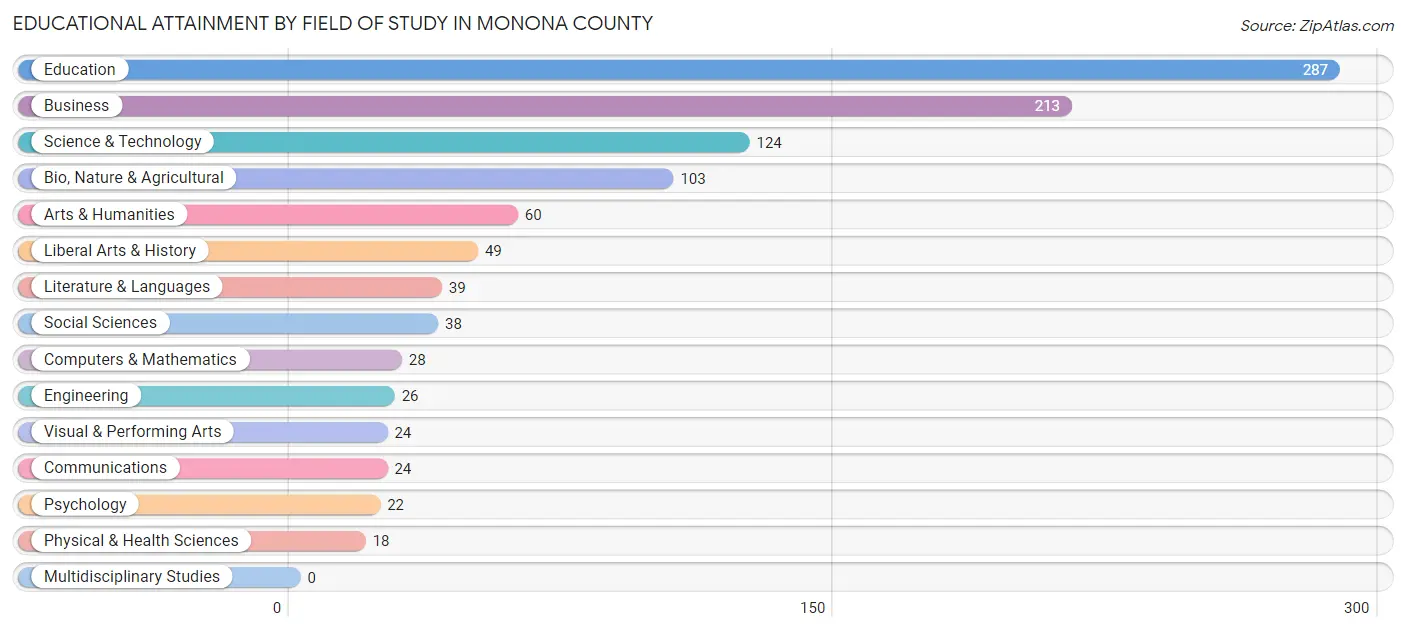
| Field of Study | # Graduates | % Graduates |
| Computers & Mathematics | 28 | 2.6% |
| Bio, Nature & Agricultural | 103 | 9.8% |
| Physical & Health Sciences | 18 | 1.7% |
| Psychology | 22 | 2.1% |
| Social Sciences | 38 | 3.6% |
| Engineering | 26 | 2.5% |
| Multidisciplinary Studies | 0 | 0.0% |
| Science & Technology | 124 | 11.7% |
| Business | 213 | 20.2% |
| Education | 287 | 27.2% |
| Literature & Languages | 39 | 3.7% |
| Liberal Arts & History | 49 | 4.6% |
| Visual & Performing Arts | 24 | 2.3% |
| Communications | 24 | 2.3% |
| Arts & Humanities | 60 | 5.7% |
| Total | 1,055 | 100.0% |
Transportation & Commute in Monona County
Vehicle Availability by Sex in Monona County
The most prevalent vehicle ownership categories in Monona County are males with 2 vehicles (711, accounting for 34.2%) and females with 2 vehicles (700, making up 36.0%).
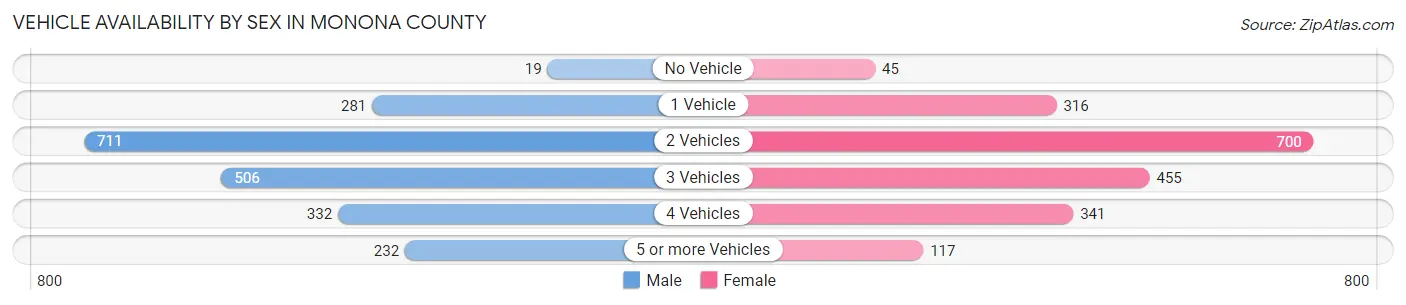
| Vehicles Available | Male | Female |
| No Vehicle | 19 (0.9%) | 45 (2.3%) |
| 1 Vehicle | 281 (13.5%) | 316 (16.0%) |
| 2 Vehicles | 711 (34.2%) | 700 (35.5%) |
| 3 Vehicles | 506 (24.3%) | 455 (23.1%) |
| 4 Vehicles | 332 (16.0%) | 341 (17.3%) |
| 5 or more Vehicles | 232 (11.2%) | 117 (5.9%) |
| Total | 2,081 (100.0%) | 1,974 (100.0%) |
Commute Time in Monona County
The most frequently occuring commute durations in Monona County are 5 to 9 minutes (628 commuters, 17.3%), less than 5 minutes (560 commuters, 15.4%), and 10 to 14 minutes (483 commuters, 13.3%).

| Commute Time | # Commuters | % Commuters |
| Less than 5 Minutes | 560 | 15.4% |
| 5 to 9 Minutes | 628 | 17.3% |
| 10 to 14 Minutes | 483 | 13.3% |
| 15 to 19 Minutes | 452 | 12.4% |
| 20 to 24 Minutes | 280 | 7.7% |
| 25 to 29 Minutes | 233 | 6.4% |
| 30 to 34 Minutes | 181 | 5.0% |
| 35 to 39 Minutes | 110 | 3.0% |
| 40 to 44 Minutes | 155 | 4.3% |
| 45 to 59 Minutes | 241 | 6.6% |
| 60 to 89 Minutes | 215 | 5.9% |
| 90 or more Minutes | 93 | 2.6% |
Commute Time by Sex in Monona County
The most common commute times in Monona County are less than 5 minutes (323 commuters, 17.1%) for males and 5 to 9 minutes (308 commuters, 17.6%) for females.
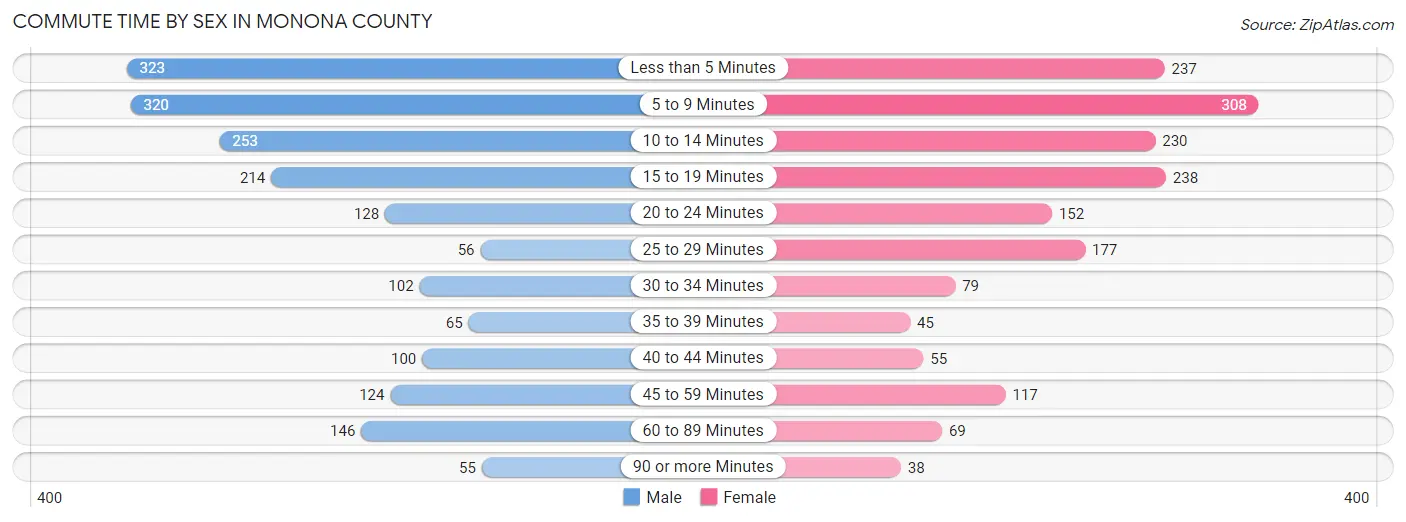
| Commute Time | Male | Female |
| Less than 5 Minutes | 323 (17.1%) | 237 (13.6%) |
| 5 to 9 Minutes | 320 (17.0%) | 308 (17.6%) |
| 10 to 14 Minutes | 253 (13.4%) | 230 (13.2%) |
| 15 to 19 Minutes | 214 (11.4%) | 238 (13.6%) |
| 20 to 24 Minutes | 128 (6.8%) | 152 (8.7%) |
| 25 to 29 Minutes | 56 (3.0%) | 177 (10.1%) |
| 30 to 34 Minutes | 102 (5.4%) | 79 (4.5%) |
| 35 to 39 Minutes | 65 (3.5%) | 45 (2.6%) |
| 40 to 44 Minutes | 100 (5.3%) | 55 (3.2%) |
| 45 to 59 Minutes | 124 (6.6%) | 117 (6.7%) |
| 60 to 89 Minutes | 146 (7.7%) | 69 (4.0%) |
| 90 or more Minutes | 55 (2.9%) | 38 (2.2%) |
Time of Departure to Work by Sex in Monona County
The most frequent times of departure to work in Monona County are 7:00 AM to 7:29 AM (352, 18.7%) for males and 7:30 AM to 7:59 AM (465, 26.7%) for females.
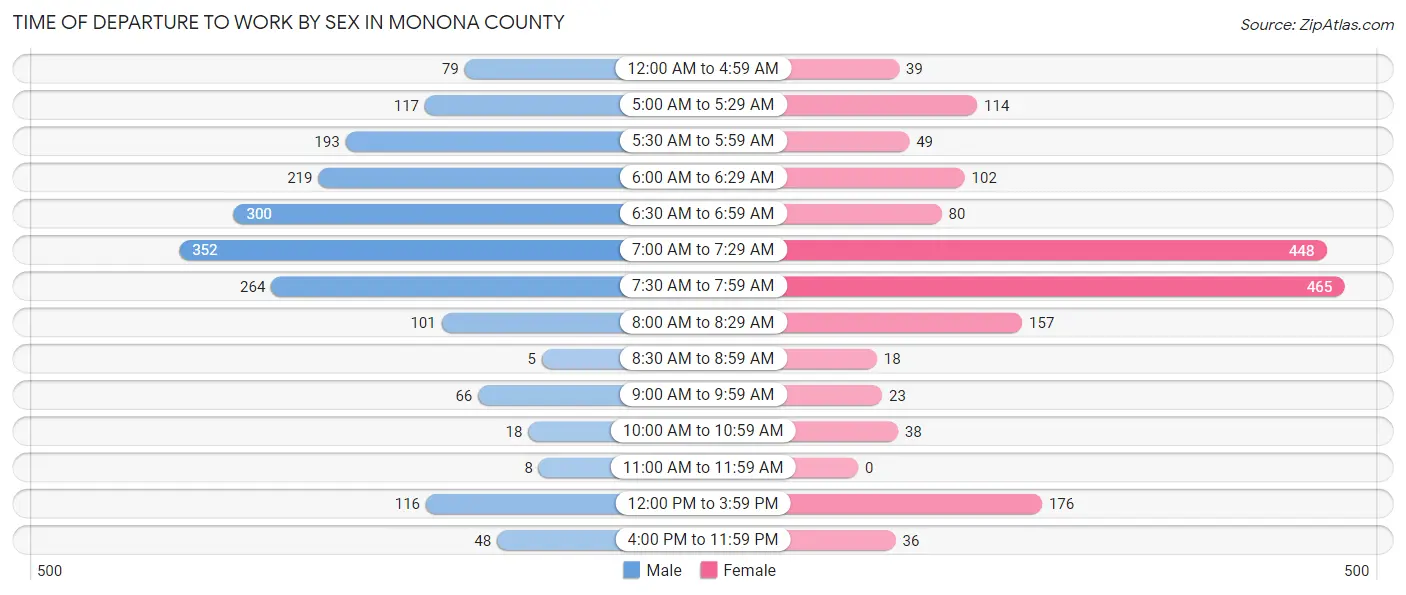
| Time of Departure | Male | Female |
| 12:00 AM to 4:59 AM | 79 (4.2%) | 39 (2.2%) |
| 5:00 AM to 5:29 AM | 117 (6.2%) | 114 (6.5%) |
| 5:30 AM to 5:59 AM | 193 (10.2%) | 49 (2.8%) |
| 6:00 AM to 6:29 AM | 219 (11.6%) | 102 (5.9%) |
| 6:30 AM to 6:59 AM | 300 (15.9%) | 80 (4.6%) |
| 7:00 AM to 7:29 AM | 352 (18.7%) | 448 (25.7%) |
| 7:30 AM to 7:59 AM | 264 (14.0%) | 465 (26.7%) |
| 8:00 AM to 8:29 AM | 101 (5.4%) | 157 (9.0%) |
| 8:30 AM to 8:59 AM | 5 (0.3%) | 18 (1.0%) |
| 9:00 AM to 9:59 AM | 66 (3.5%) | 23 (1.3%) |
| 10:00 AM to 10:59 AM | 18 (0.9%) | 38 (2.2%) |
| 11:00 AM to 11:59 AM | 8 (0.4%) | 0 (0.0%) |
| 12:00 PM to 3:59 PM | 116 (6.1%) | 176 (10.1%) |
| 4:00 PM to 11:59 PM | 48 (2.5%) | 36 (2.1%) |
| Total | 1,886 (100.0%) | 1,745 (100.0%) |
Housing Occupancy in Monona County
Occupancy by Ownership in Monona County
Of the total 3,852 dwellings in Monona County, owner-occupied units account for 3,013 (78.2%), while renter-occupied units make up 839 (21.8%).
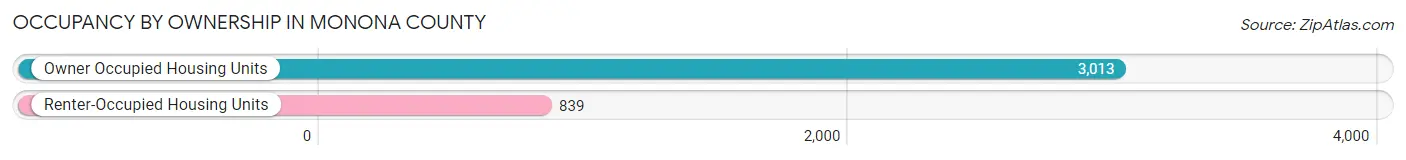
| Occupancy | # Housing Units | % Housing Units |
| Owner Occupied Housing Units | 3,013 | 78.2% |
| Renter-Occupied Housing Units | 839 | 21.8% |
| Total Occupied Housing Units | 3,852 | 100.0% |
Occupancy by Household Size in Monona County

| Household Size | # Housing Units | % Housing Units |
| 1-Person Household | 1,310 | 34.0% |
| 2-Person Household | 1,387 | 36.0% |
| 3-Person Household | 570 | 14.8% |
| 4+ Person Household | 585 | 15.2% |
| Total Housing Units | 3,852 | 100.0% |
Occupancy by Ownership by Household Size in Monona County
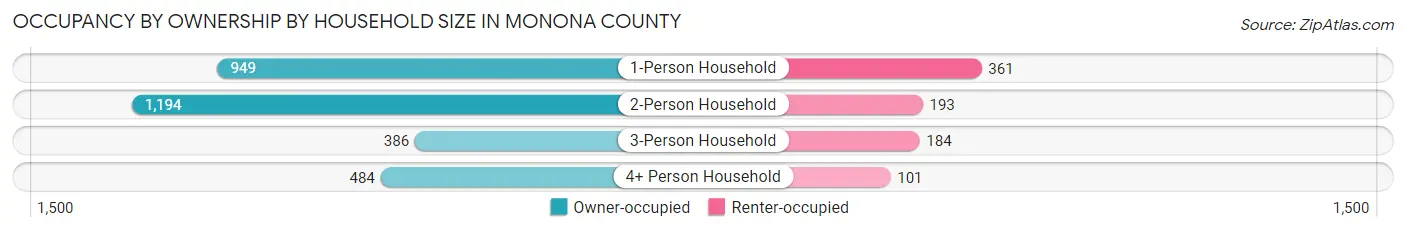
| Household Size | Owner-occupied | Renter-occupied |
| 1-Person Household | 949 (72.4%) | 361 (27.6%) |
| 2-Person Household | 1,194 (86.1%) | 193 (13.9%) |
| 3-Person Household | 386 (67.7%) | 184 (32.3%) |
| 4+ Person Household | 484 (82.7%) | 101 (17.3%) |
| Total Housing Units | 3,013 (78.2%) | 839 (21.8%) |
Occupancy by Educational Attainment in Monona County
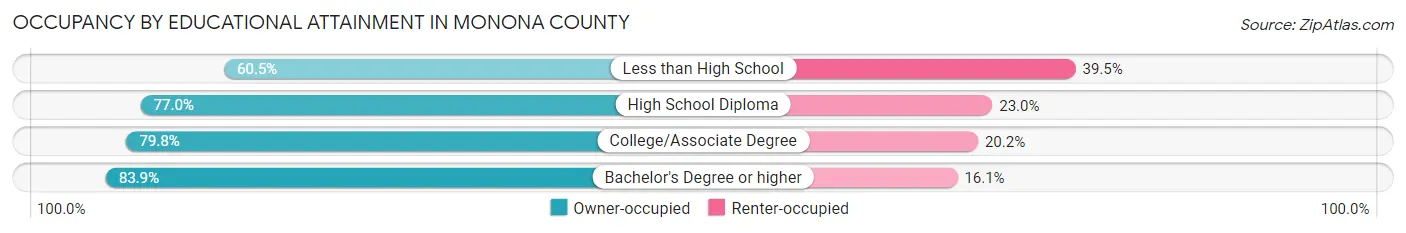
| Household Size | Owner-occupied | Renter-occupied |
| Less than High School | 153 (60.5%) | 100 (39.5%) |
| High School Diploma | 1,100 (77.0%) | 329 (23.0%) |
| College/Associate Degree | 1,182 (79.8%) | 299 (20.2%) |
| Bachelor's Degree or higher | 578 (83.9%) | 111 (16.1%) |
Occupancy by Age of Householder in Monona County
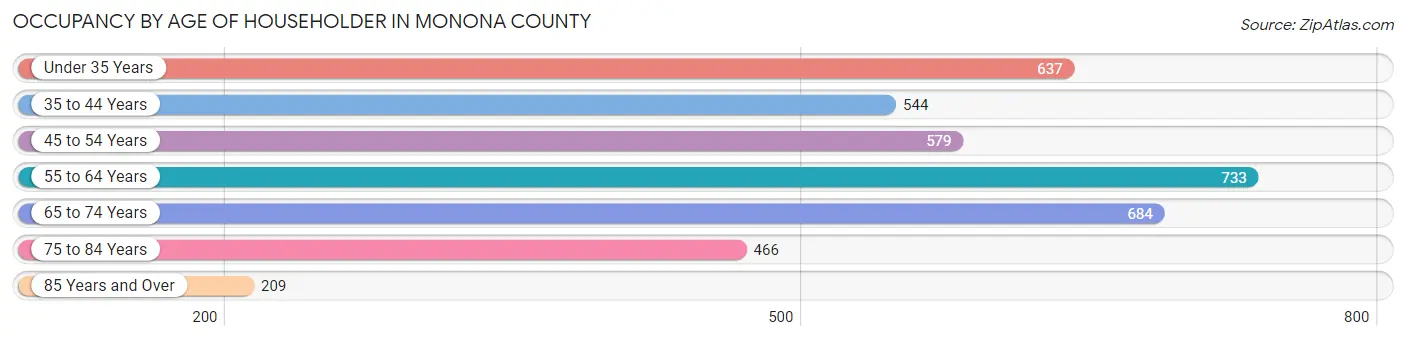
| Age Bracket | # Households | % Households |
| Under 35 Years | 637 | 16.5% |
| 35 to 44 Years | 544 | 14.1% |
| 45 to 54 Years | 579 | 15.0% |
| 55 to 64 Years | 733 | 19.0% |
| 65 to 74 Years | 684 | 17.8% |
| 75 to 84 Years | 466 | 12.1% |
| 85 Years and Over | 209 | 5.4% |
| Total | 3,852 | 100.0% |
Housing Finances in Monona County
Median Income by Occupancy in Monona County
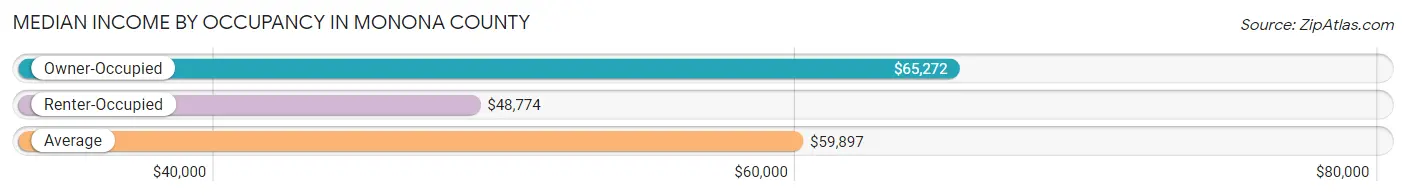
| Occupancy Type | # Households | Median Income |
| Owner-Occupied | 3,013 (78.2%) | $65,272 |
| Renter-Occupied | 839 (21.8%) | $48,774 |
| Average | 3,852 (100.0%) | $59,897 |
Occupancy by Householder Income Bracket in Monona County
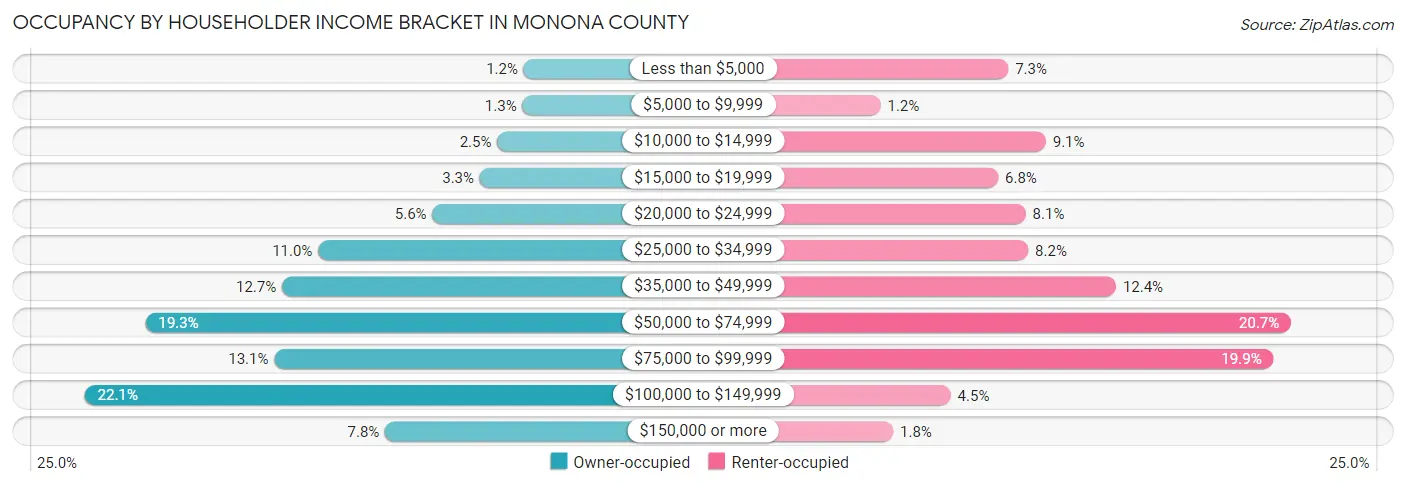
| Income Bracket | Owner-occupied | Renter-occupied |
| Less than $5,000 | 37 (1.2%) | 61 (7.3%) |
| $5,000 to $9,999 | 39 (1.3%) | 10 (1.2%) |
| $10,000 to $14,999 | 75 (2.5%) | 76 (9.1%) |
| $15,000 to $19,999 | 100 (3.3%) | 57 (6.8%) |
| $20,000 to $24,999 | 168 (5.6%) | 68 (8.1%) |
| $25,000 to $34,999 | 332 (11.0%) | 69 (8.2%) |
| $35,000 to $49,999 | 384 (12.7%) | 104 (12.4%) |
| $50,000 to $74,999 | 580 (19.3%) | 174 (20.7%) |
| $75,000 to $99,999 | 395 (13.1%) | 167 (19.9%) |
| $100,000 to $149,999 | 667 (22.1%) | 38 (4.5%) |
| $150,000 or more | 236 (7.8%) | 15 (1.8%) |
| Total | 3,013 (100.0%) | 839 (100.0%) |
Monthly Housing Cost Tiers in Monona County
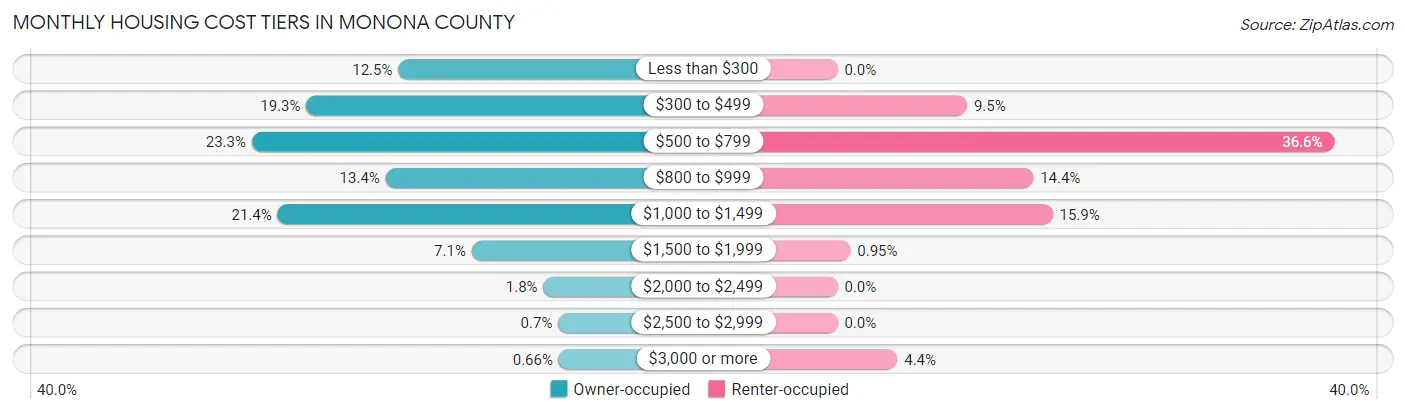
| Monthly Cost | Owner-occupied | Renter-occupied |
| Less than $300 | 376 (12.5%) | 0 (0.0%) |
| $300 to $499 | 580 (19.3%) | 80 (9.5%) |
| $500 to $799 | 701 (23.3%) | 307 (36.6%) |
| $800 to $999 | 404 (13.4%) | 121 (14.4%) |
| $1,000 to $1,499 | 644 (21.4%) | 133 (15.9%) |
| $1,500 to $1,999 | 213 (7.1%) | 8 (0.9%) |
| $2,000 to $2,499 | 54 (1.8%) | 0 (0.0%) |
| $2,500 to $2,999 | 21 (0.7%) | 0 (0.0%) |
| $3,000 or more | 20 (0.7%) | 37 (4.4%) |
| Total | 3,013 (100.0%) | 839 (100.0%) |
Physical Housing Characteristics in Monona County
Housing Structures in Monona County
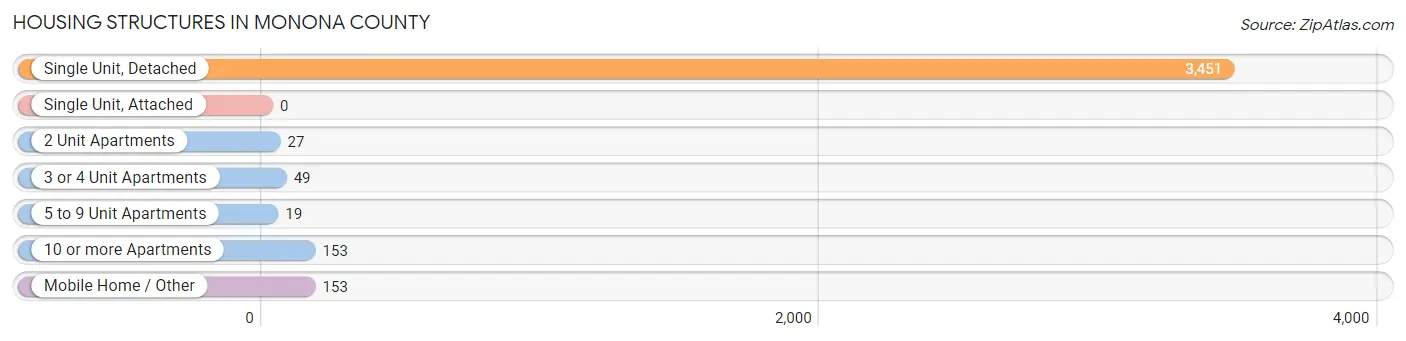
| Structure Type | # Housing Units | % Housing Units |
| Single Unit, Detached | 3,451 | 89.6% |
| Single Unit, Attached | 0 | 0.0% |
| 2 Unit Apartments | 27 | 0.7% |
| 3 or 4 Unit Apartments | 49 | 1.3% |
| 5 to 9 Unit Apartments | 19 | 0.5% |
| 10 or more Apartments | 153 | 4.0% |
| Mobile Home / Other | 153 | 4.0% |
| Total | 3,852 | 100.0% |
Housing Structures by Occupancy in Monona County
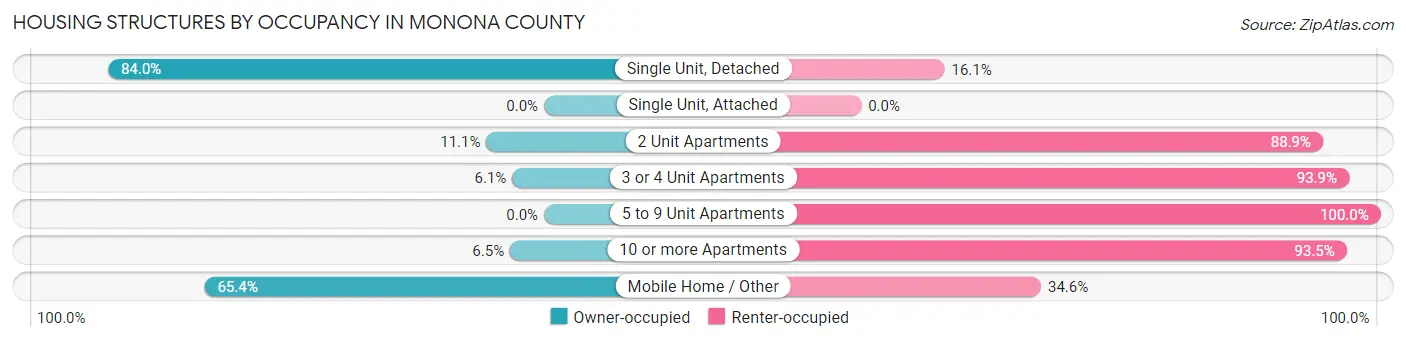
| Structure Type | Owner-occupied | Renter-occupied |
| Single Unit, Detached | 2,897 (84.0%) | 554 (16.1%) |
| Single Unit, Attached | 0 (0.0%) | 0 (0.0%) |
| 2 Unit Apartments | 3 (11.1%) | 24 (88.9%) |
| 3 or 4 Unit Apartments | 3 (6.1%) | 46 (93.9%) |
| 5 to 9 Unit Apartments | 0 (0.0%) | 19 (100.0%) |
| 10 or more Apartments | 10 (6.5%) | 143 (93.5%) |
| Mobile Home / Other | 100 (65.4%) | 53 (34.6%) |
| Total | 3,013 (78.2%) | 839 (21.8%) |
Housing Structures by Number of Rooms in Monona County
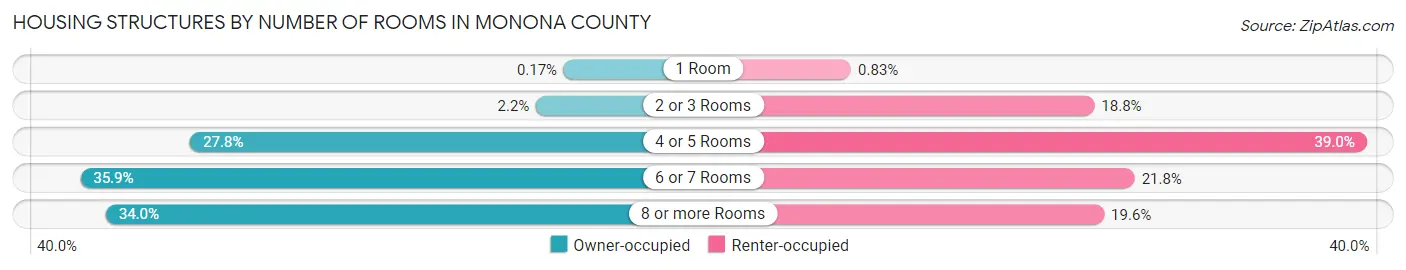
| Number of Rooms | Owner-occupied | Renter-occupied |
| 1 Room | 5 (0.2%) | 7 (0.8%) |
| 2 or 3 Rooms | 67 (2.2%) | 158 (18.8%) |
| 4 or 5 Rooms | 836 (27.8%) | 327 (39.0%) |
| 6 or 7 Rooms | 1,081 (35.9%) | 183 (21.8%) |
| 8 or more Rooms | 1,024 (34.0%) | 164 (19.6%) |
| Total | 3,013 (100.0%) | 839 (100.0%) |
Housing Structure by Heating Type in Monona County
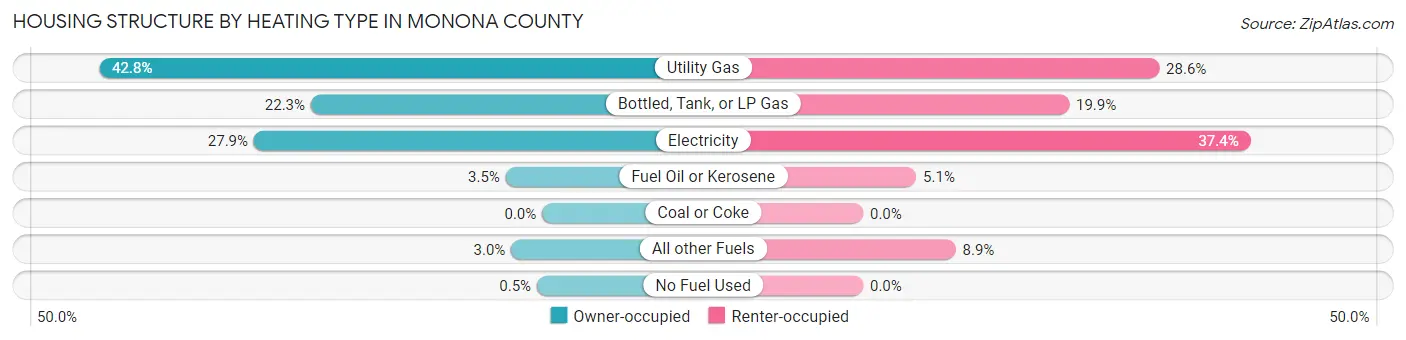
| Heating Type | Owner-occupied | Renter-occupied |
| Utility Gas | 1,290 (42.8%) | 240 (28.6%) |
| Bottled, Tank, or LP Gas | 673 (22.3%) | 167 (19.9%) |
| Electricity | 839 (27.9%) | 314 (37.4%) |
| Fuel Oil or Kerosene | 106 (3.5%) | 43 (5.1%) |
| Coal or Coke | 0 (0.0%) | 0 (0.0%) |
| All other Fuels | 90 (3.0%) | 75 (8.9%) |
| No Fuel Used | 15 (0.5%) | 0 (0.0%) |
| Total | 3,013 (100.0%) | 839 (100.0%) |
Household Vehicle Usage in Monona County
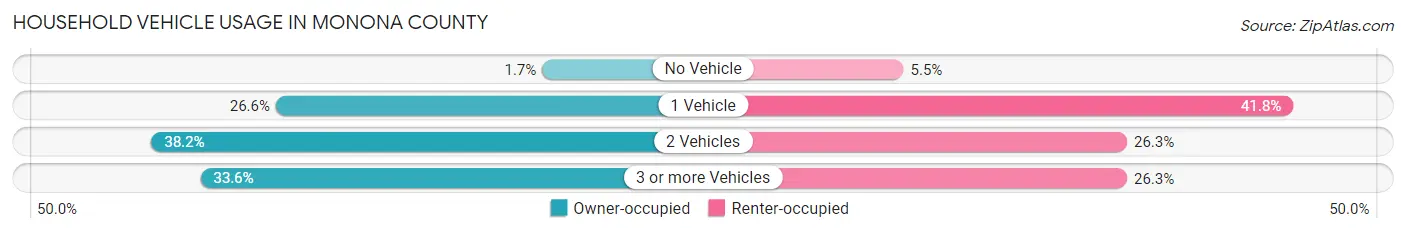
| Vehicles per Household | Owner-occupied | Renter-occupied |
| No Vehicle | 51 (1.7%) | 46 (5.5%) |
| 1 Vehicle | 800 (26.6%) | 351 (41.8%) |
| 2 Vehicles | 1,150 (38.2%) | 221 (26.3%) |
| 3 or more Vehicles | 1,012 (33.6%) | 221 (26.3%) |
| Total | 3,013 (100.0%) | 839 (100.0%) |
Real Estate & Mortgages in Monona County
Real Estate and Mortgage Overview in Monona County
| Characteristic | Without Mortgage | With Mortgage |
| Housing Units | 1,574 | 1,439 |
| Median Property Value | $93,400 | $121,100 |
| Median Household Income | $56,316 | $111 |
| Monthly Housing Costs | $450 | $20 |
| Real Estate Taxes | $1,171 | $27 |
Property Value by Mortgage Status in Monona County
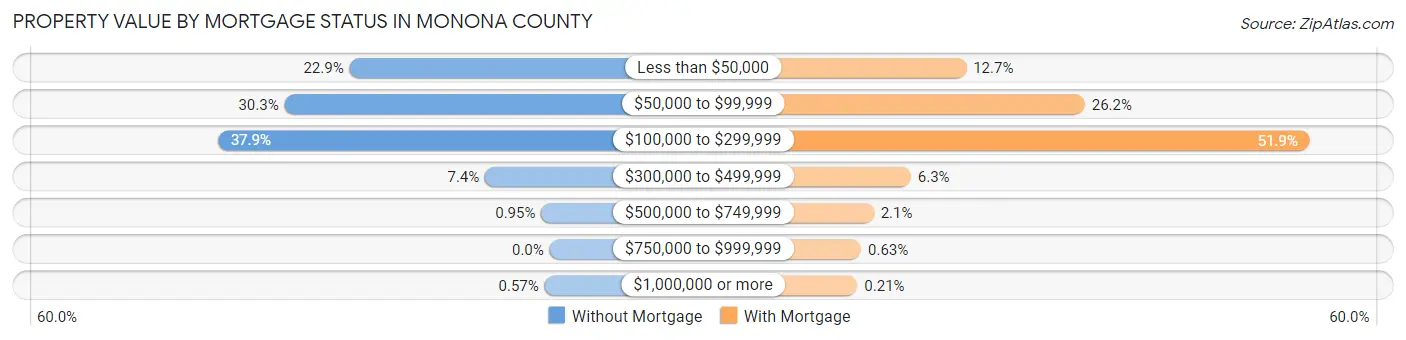
| Property Value | Without Mortgage | With Mortgage |
| Less than $50,000 | 360 (22.9%) | 182 (12.7%) |
| $50,000 to $99,999 | 477 (30.3%) | 377 (26.2%) |
| $100,000 to $299,999 | 597 (37.9%) | 747 (51.9%) |
| $300,000 to $499,999 | 116 (7.4%) | 91 (6.3%) |
| $500,000 to $749,999 | 15 (0.9%) | 30 (2.1%) |
| $750,000 to $999,999 | 0 (0.0%) | 9 (0.6%) |
| $1,000,000 or more | 9 (0.6%) | 3 (0.2%) |
| Total | 1,574 (100.0%) | 1,439 (100.0%) |
Household Income by Mortgage Status in Monona County
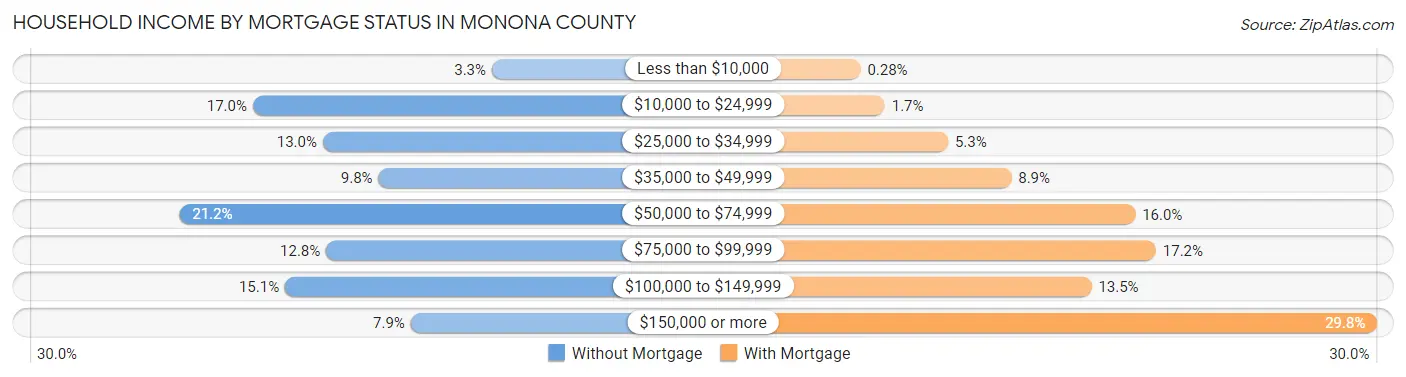
| Household Income | Without Mortgage | With Mortgage |
| Less than $10,000 | 52 (3.3%) | 4 (0.3%) |
| $10,000 to $24,999 | 267 (17.0%) | 24 (1.7%) |
| $25,000 to $34,999 | 204 (13.0%) | 76 (5.3%) |
| $35,000 to $49,999 | 154 (9.8%) | 128 (8.9%) |
| $50,000 to $74,999 | 333 (21.2%) | 230 (16.0%) |
| $75,000 to $99,999 | 201 (12.8%) | 247 (17.2%) |
| $100,000 to $149,999 | 238 (15.1%) | 194 (13.5%) |
| $150,000 or more | 125 (7.9%) | 429 (29.8%) |
| Total | 1,574 (100.0%) | 1,439 (100.0%) |
Property Value to Household Income Ratio in Monona County
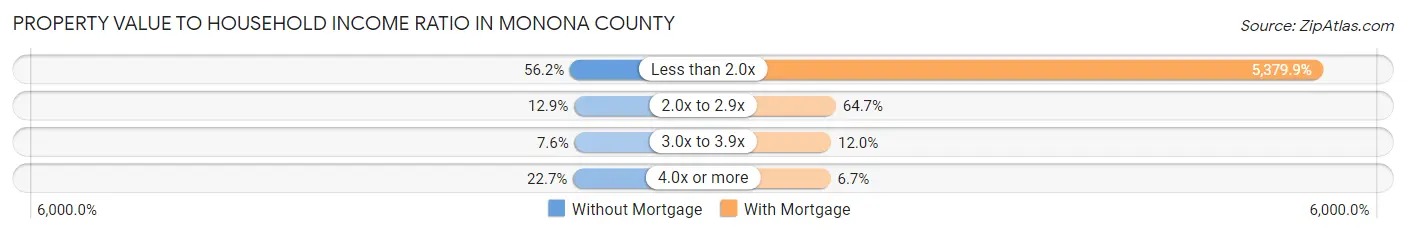
| Value-to-Income Ratio | Without Mortgage | With Mortgage |
| Less than 2.0x | 884 (56.2%) | 77,417 (5,379.9%) |
| 2.0x to 2.9x | 203 (12.9%) | 931 (64.7%) |
| 3.0x to 3.9x | 120 (7.6%) | 173 (12.0%) |
| 4.0x or more | 357 (22.7%) | 96 (6.7%) |
| Total | 1,574 (100.0%) | 1,439 (100.0%) |
Real Estate Taxes by Mortgage Status in Monona County
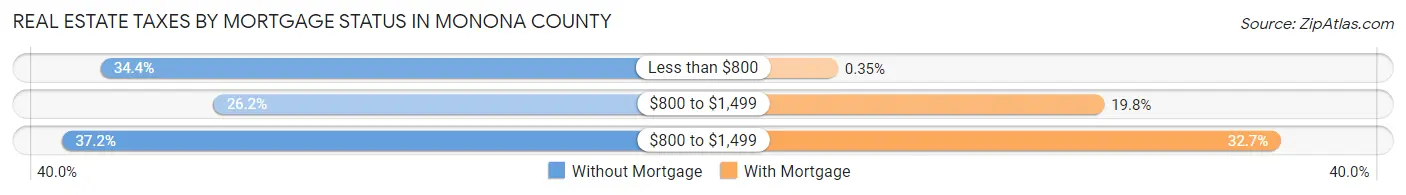
| Property Taxes | Without Mortgage | With Mortgage |
| Less than $800 | 542 (34.4%) | 5 (0.4%) |
| $800 to $1,499 | 412 (26.2%) | 285 (19.8%) |
| $800 to $1,499 | 586 (37.2%) | 470 (32.7%) |
| Total | 1,574 (100.0%) | 1,439 (100.0%) |
Health & Disability in Monona County
Health Insurance Coverage by Age in Monona County

| Age Bracket | With Coverage | Without Coverage |
| Under 6 Years | 568 (99.3%) | 4 (0.7%) |
| 6 to 18 Years | 1,376 (98.9%) | 16 (1.1%) |
| 19 to 25 Years | 487 (88.7%) | 62 (11.3%) |
| 26 to 34 Years | 791 (95.5%) | 37 (4.5%) |
| 35 to 44 Years | 838 (90.8%) | 85 (9.2%) |
| 45 to 54 Years | 884 (91.1%) | 86 (8.9%) |
| 55 to 64 Years | 1,261 (95.6%) | 58 (4.4%) |
| 65 to 74 Years | 1,022 (100.0%) | 0 (0.0%) |
| 75 Years and older | 909 (100.0%) | 0 (0.0%) |
| Total | 8,136 (95.9%) | 348 (4.1%) |
Health Insurance Coverage by Citizenship Status in Monona County
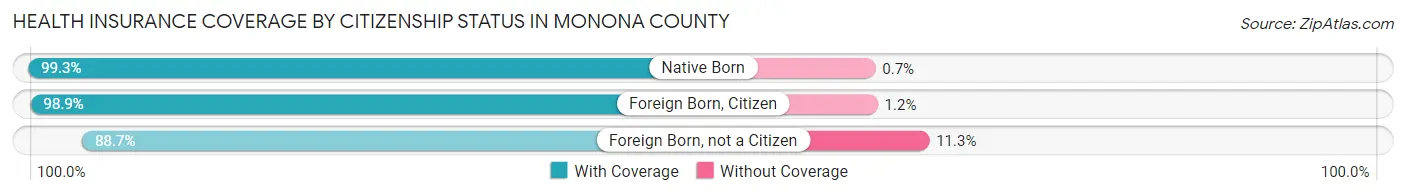
| Citizenship Status | With Coverage | Without Coverage |
| Native Born | 568 (99.3%) | 4 (0.7%) |
| Foreign Born, Citizen | 1,376 (98.9%) | 16 (1.1%) |
| Foreign Born, not a Citizen | 487 (88.7%) | 62 (11.3%) |
Health Insurance Coverage by Household Income in Monona County

| Household Income | With Coverage | Without Coverage |
| Under $25,000 | 940 (95.7%) | 42 (4.3%) |
| $25,000 to $49,999 | 1,446 (92.1%) | 124 (7.9%) |
| $50,000 to $74,999 | 1,656 (95.6%) | 76 (4.4%) |
| $75,000 to $99,999 | 1,435 (97.4%) | 39 (2.6%) |
| $100,000 and over | 2,639 (97.5%) | 67 (2.5%) |
Public vs Private Health Insurance Coverage by Age in Monona County
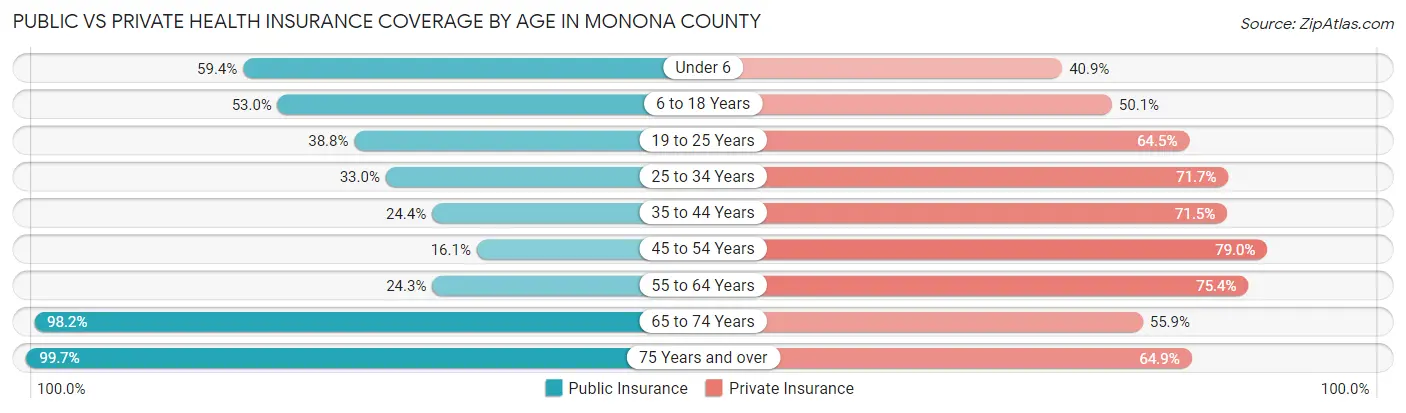
| Age Bracket | Public Insurance | Private Insurance |
| Under 6 | 340 (59.4%) | 234 (40.9%) |
| 6 to 18 Years | 738 (53.0%) | 698 (50.1%) |
| 19 to 25 Years | 213 (38.8%) | 354 (64.5%) |
| 25 to 34 Years | 273 (33.0%) | 594 (71.7%) |
| 35 to 44 Years | 225 (24.4%) | 660 (71.5%) |
| 45 to 54 Years | 156 (16.1%) | 766 (79.0%) |
| 55 to 64 Years | 321 (24.3%) | 995 (75.4%) |
| 65 to 74 Years | 1,004 (98.2%) | 571 (55.9%) |
| 75 Years and over | 906 (99.7%) | 590 (64.9%) |
| Total | 4,176 (49.2%) | 5,462 (64.4%) |
Disability Status by Sex by Age in Monona County
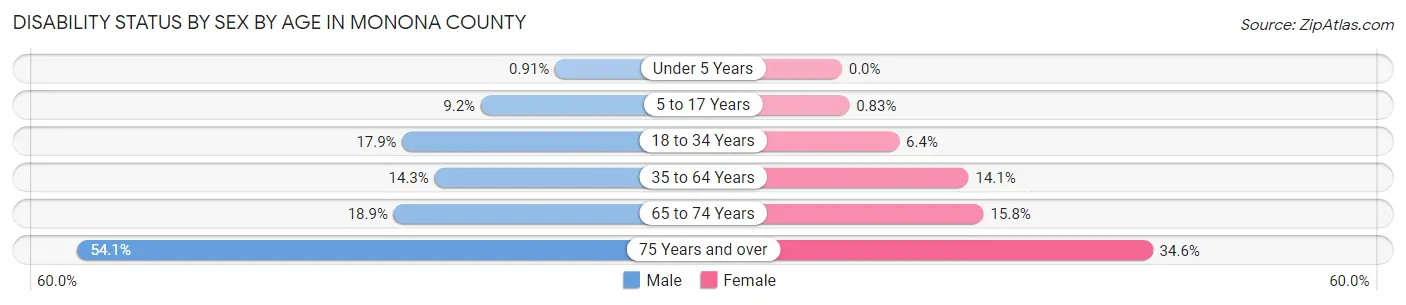
| Age Bracket | Male | Female |
| Under 5 Years | 2 (0.9%) | 0 (0.0%) |
| 5 to 17 Years | 66 (9.2%) | 6 (0.8%) |
| 18 to 34 Years | 131 (17.9%) | 45 (6.4%) |
| 35 to 64 Years | 226 (14.3%) | 231 (14.1%) |
| 65 to 74 Years | 95 (18.9%) | 82 (15.8%) |
| 75 Years and over | 198 (54.1%) | 188 (34.6%) |
Disability Class by Sex by Age in Monona County
Disability Class: Hearing Difficulty
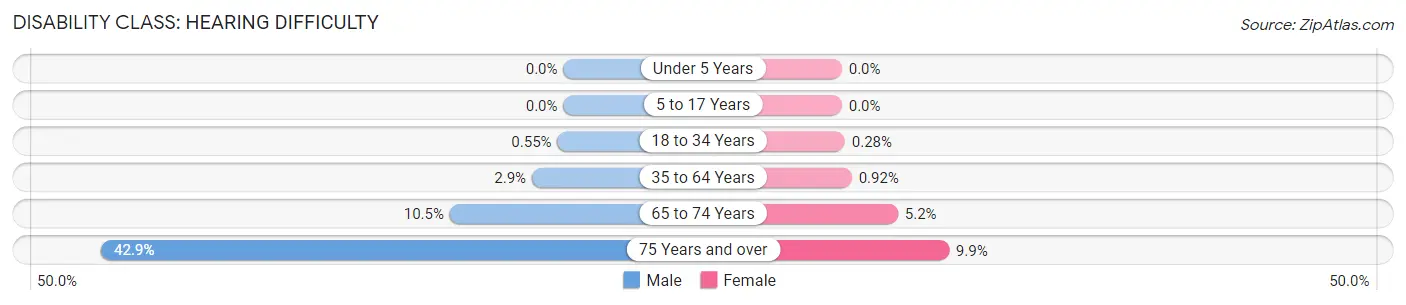
| Age Bracket | Male | Female |
| Under 5 Years | 0 (0.0%) | 0 (0.0%) |
| 5 to 17 Years | 0 (0.0%) | 0 (0.0%) |
| 18 to 34 Years | 4 (0.5%) | 2 (0.3%) |
| 35 to 64 Years | 46 (2.9%) | 15 (0.9%) |
| 65 to 74 Years | 53 (10.5%) | 27 (5.2%) |
| 75 Years and over | 157 (42.9%) | 54 (9.9%) |
Disability Class: Vision Difficulty
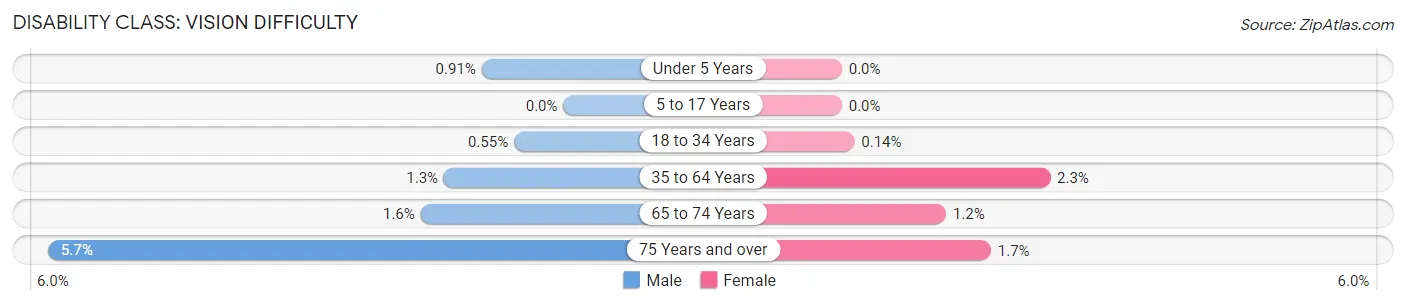
| Age Bracket | Male | Female |
| Under 5 Years | 2 (0.9%) | 0 (0.0%) |
| 5 to 17 Years | 0 (0.0%) | 0 (0.0%) |
| 18 to 34 Years | 4 (0.5%) | 1 (0.1%) |
| 35 to 64 Years | 21 (1.3%) | 38 (2.3%) |
| 65 to 74 Years | 8 (1.6%) | 6 (1.2%) |
| 75 Years and over | 21 (5.7%) | 9 (1.7%) |
Disability Class: Cognitive Difficulty
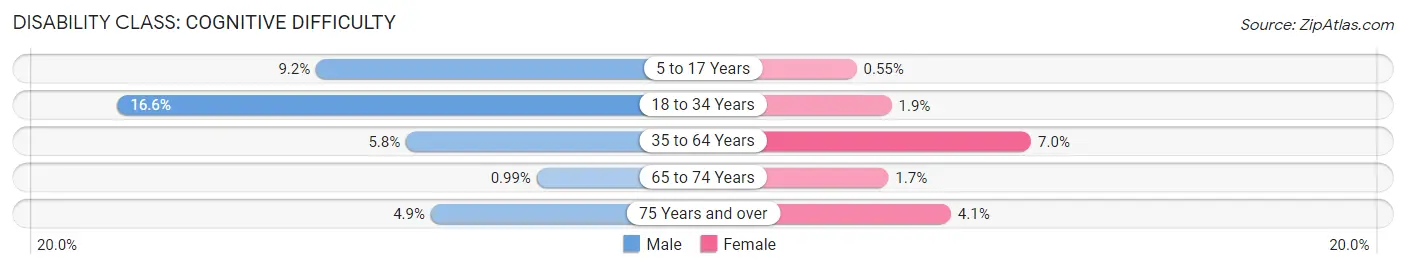
| Age Bracket | Male | Female |
| 5 to 17 Years | 66 (9.2%) | 4 (0.5%) |
| 18 to 34 Years | 121 (16.6%) | 13 (1.8%) |
| 35 to 64 Years | 92 (5.8%) | 115 (7.0%) |
| 65 to 74 Years | 5 (1.0%) | 9 (1.7%) |
| 75 Years and over | 18 (4.9%) | 22 (4.1%) |
Disability Class: Ambulatory Difficulty
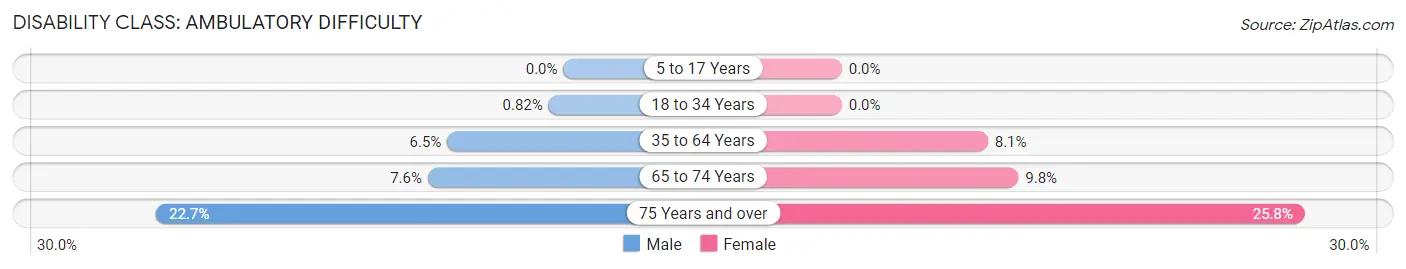
| Age Bracket | Male | Female |
| 5 to 17 Years | 0 (0.0%) | 0 (0.0%) |
| 18 to 34 Years | 6 (0.8%) | 0 (0.0%) |
| 35 to 64 Years | 102 (6.5%) | 133 (8.1%) |
| 65 to 74 Years | 38 (7.5%) | 51 (9.8%) |
| 75 Years and over | 83 (22.7%) | 140 (25.8%) |
Disability Class: Self-Care Difficulty
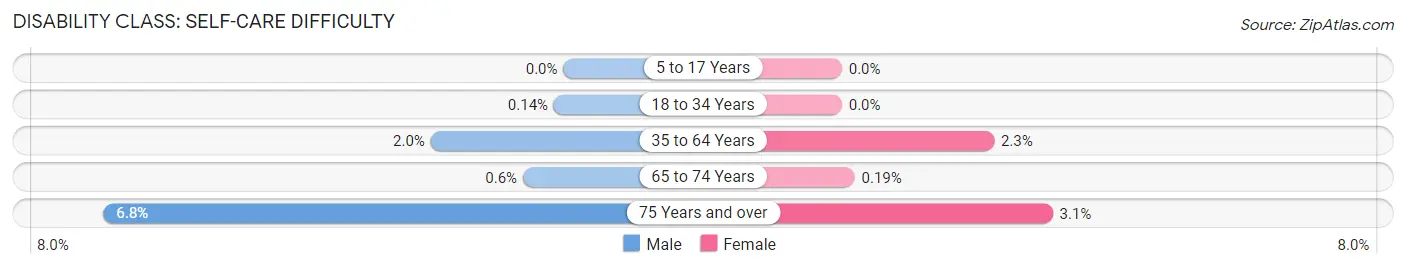
| Age Bracket | Male | Female |
| 5 to 17 Years | 0 (0.0%) | 0 (0.0%) |
| 18 to 34 Years | 1 (0.1%) | 0 (0.0%) |
| 35 to 64 Years | 31 (2.0%) | 37 (2.3%) |
| 65 to 74 Years | 3 (0.6%) | 1 (0.2%) |
| 75 Years and over | 25 (6.8%) | 17 (3.1%) |
Technology Access in Monona County
Computing Device Access in Monona County

| Device Type | # Households | % Households |
| Desktop or Laptop | 2,628 | 68.2% |
| Smartphone | 3,031 | 78.7% |
| Tablet | 1,936 | 50.3% |
| No Computing Device | 414 | 10.7% |
| Total | 3,852 | 100.0% |
Internet Access in Monona County
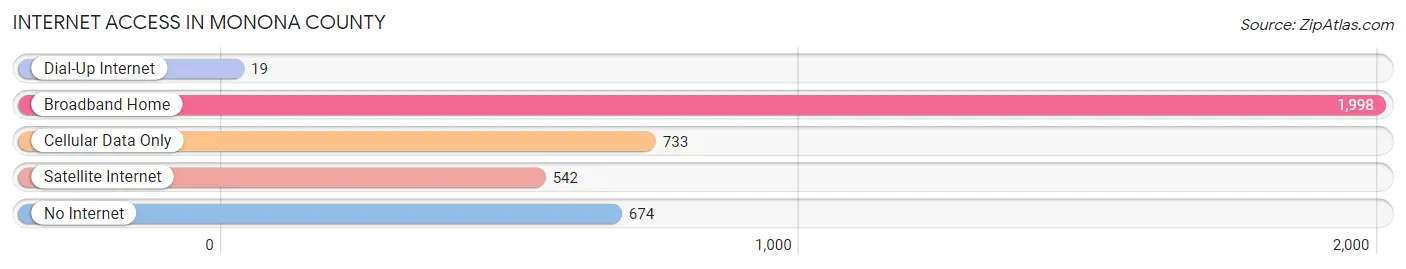
| Internet Type | # Households | % Households |
| Dial-Up Internet | 19 | 0.5% |
| Broadband Home | 1,998 | 51.9% |
| Cellular Data Only | 733 | 19.0% |
| Satellite Internet | 542 | 14.1% |
| No Internet | 674 | 17.5% |
| Total | 3,852 | 100.0% |
Monona County Summary
Monona County is located in the state of Iowa, in the Midwestern United States. It is bordered by Woodbury County to the north, Plymouth County to the east, Crawford County to the south, and Harrison County to the west. The county seat is Onawa, and the largest city is Mapleton. As of the 2010 census, the population was 9,243.
Geography
Monona County is located in the Loess Hills region of Iowa. The county is mostly rural, with rolling hills and small towns. The terrain is mostly flat, with some areas of higher elevation in the northwest. The county is drained by the Little Sioux River, which flows through the center of the county. The county has a total area of 576 square miles, of which 575 square miles is land and 1.2 square miles is water.
Climate
Monona County has a humid continental climate, with cold winters and hot, humid summers. The average annual temperature is 48°F, and the average annual precipitation is 33 inches.
Demographics
As of the 2010 census, there were 9,243 people, 3,717 households, and 2,521 families living in the county. The population density was 16 people per square mile. The racial makeup of the county was 97.3% White, 0.3% African American, 0.3% Native American, 0.3% Asian, 0.1% Pacific Islander, 0.7% from other races, and 0.9% from two or more races. Hispanic or Latino of any race were 2.2% of the population.
Economy
Monona County is largely agricultural, with corn, soybeans, and hogs being the main crops. The county also has a strong manufacturing sector, with companies such as John Deere, Case IH, and Caterpillar having plants in the county. The county also has a strong tourism industry, with the Loess Hills National Scenic Byway and the Lewis and Clark State Park being popular attractions.
History
Monona County was established in 1851, and was named for the Native American word for “beautiful”. The county was originally populated by Native American tribes, including the Omaha, Oto, and Iowa. The first European settlers arrived in the area in the 1830s, and the county was organized in 1851. The county seat was originally located in the town of Monona, but was moved to Onawa in 1856.
The county experienced rapid growth in the late 19th and early 20th centuries, with the population increasing from 4,000 in 1880 to over 10,000 by 1910. The county was largely agricultural, with corn, soybeans, and hogs being the main crops. The county also had a strong manufacturing sector, with companies such as John Deere, Case IH, and Caterpillar having plants in the county.
Monona County experienced a decline in population in the mid-20th century, as many people moved away from rural areas in search of better economic opportunities. The population has been slowly increasing since the 1990s, as people have been drawn to the area by its scenic beauty and outdoor recreation opportunities.
Monona County is a rural county with a strong agricultural and manufacturing base. The county has a rich history, and is home to many scenic attractions. The county is also home to a diverse population, with a mix of Native American, European, and Hispanic cultures. The county is a great place to live, work, and play, and is a great place to call home.
Common Questions
What is the Total Population of Monona County?
Total Population of Monona County is 8,671.
What is the Total Male Population of Monona County?
Total Male Population of Monona County is 4,201.
What is the Total Female Population of Monona County?
Total Female Population of Monona County is 4,470.
What is the Ratio of Males per 100 Females in Monona County?
There are 93.98 Males per 100 Females in Monona County.
What is the Ratio of Females per 100 Males in Monona County?
There are 106.40 Females per 100 Males in Monona County.
What is the Median Population Age in Monona County?
Median Population Age in Monona County is 45.9 Years.
What is the Average Family Size in Monona County
Average Family Size in Monona County is 2.8 People.
What is the Average Household Size in Monona County
Average Household Size in Monona County is 2.2 People.
What is Per Capita Income in Monona County?
Per Capita income in Monona County is $33,080.
What is the Median Family Income in Monona County?
Median Family Income in Monona County is $76,144.
What is the Median Household income in Monona County?
Median Household Income in Monona County is $59,897.
What is Income or Wage Gap in Monona County?
Income or Wage Gap in Monona County is 33.5%.
Women in Monona County earn 66.5 cents for every dollar earned by a man.
What is Family Income Deficit in Monona County?
Family Income Deficit in Monona County is $9,519.
Families that are below poverty line in Monona County earn $9,519 less on average than the poverty threshold level.
What is Inequality or Gini Index in Monona County?
Inequality or Gini Index in Monona County is 0.40.
How Large is the Labor Force in Monona County?
There are 4,263 People in the Labor Forcein in Monona County.
What is the Percentage of People in the Labor Force in Monona County?
61.0% of People are in the Labor Force in Monona County.
What is the Unemployment Rate in Monona County?
Unemployment Rate in Monona County is 2.6%.