Lyon County, IA
Lyon County Map

Lyon County Overview
12,023
TOTAL POPULATION
6,161
MALE POPULATION
5,862
FEMALE POPULATION
105.10
MALES / 100 FEMALES
95.15
FEMALES / 100 MALES
38.3
MEDIAN AGE
3.3
AVG FAMILY SIZE
2.7
AVG HOUSEHOLD SIZE
$33,428
PER CAPITA INCOME
$86,215
AVG FAMILY INCOME
$73,735
AVG HOUSEHOLD INCOME
33.8%
WAGE / INCOME GAP [ % ]
66.2¢/ $1
WAGE / INCOME GAP [ $ ]
0.39
INEQUALITY / GINI INDEX
5,997
LABOR FORCE [ PEOPLE ]
66.8%
PERCENT IN LABOR FORCE
2.4%
UNEMPLOYMENT RATE
Lyon County Area Codes
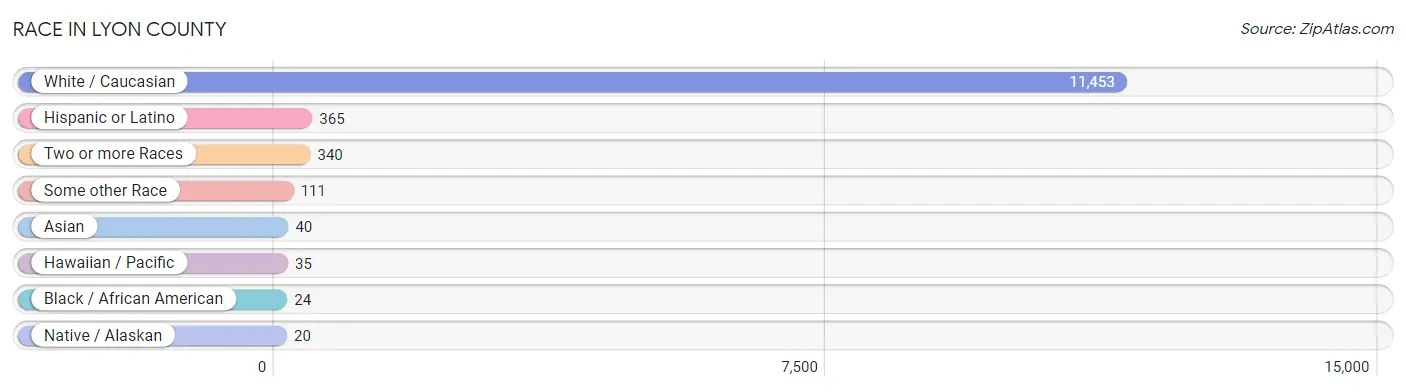
Race in Lyon County
The most populous races in Lyon County are White / Caucasian (11,453 | 95.3%), Hispanic or Latino (365 | 3.0%), and Two or more Races (340 | 2.8%).
| Race | # Population | % Population |
| Asian | 40 | 0.3% |
| Black / African American | 24 | 0.2% |
| Hawaiian / Pacific | 35 | 0.3% |
| Hispanic or Latino | 365 | 3.0% |
| Native / Alaskan | 20 | 0.2% |
| White / Caucasian | 11,453 | 95.3% |
| Two or more Races | 340 | 2.8% |
| Some other Race | 111 | 0.9% |
| Total | 12,023 | 100.0% |
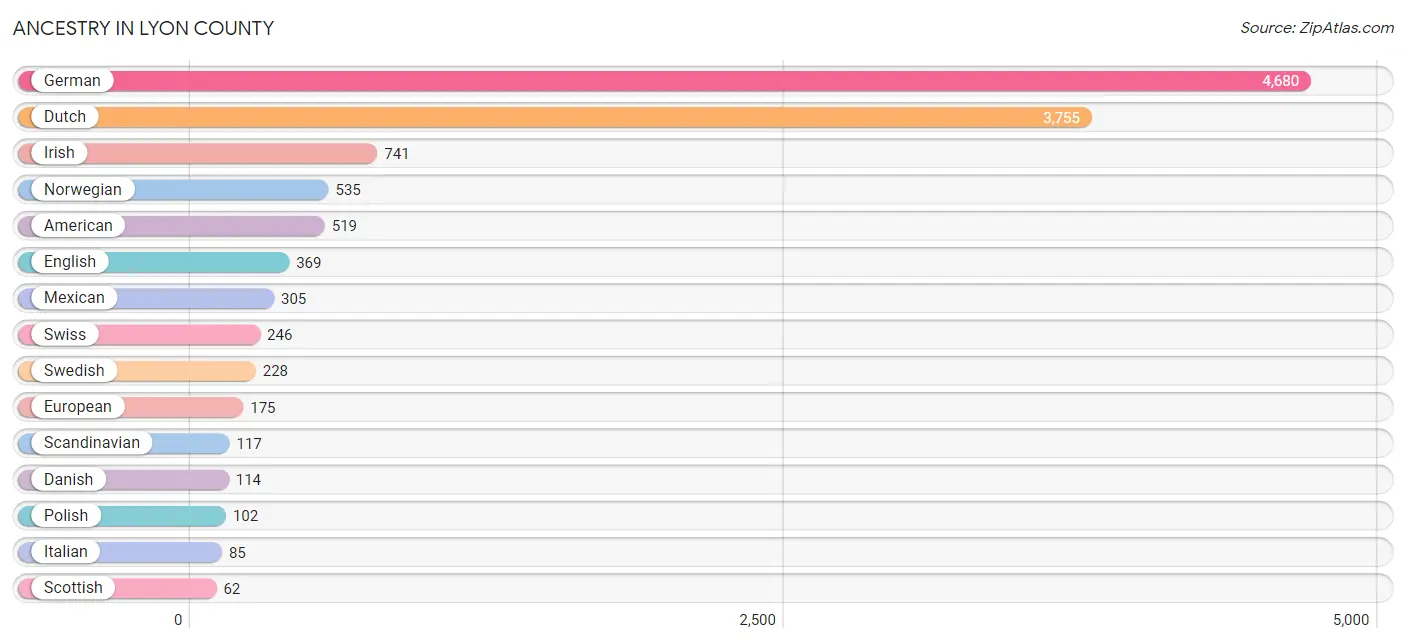
Ancestry in Lyon County
The most populous ancestries reported in Lyon County are German (4,680 | 38.9%), Dutch (3,755 | 31.2%), Irish (741 | 6.2%), Norwegian (535 | 4.4%), and American (519 | 4.3%), together accounting for 85.1% of all Lyon County residents.
| Ancestry | # Population | % Population |
| African | 4 | 0.0% |
| Alaska Native | 6 | 0.1% |
| American | 519 | 4.3% |
| Austrian | 39 | 0.3% |
| Belgian | 2 | 0.0% |
| Brazilian | 4 | 0.0% |
| British | 19 | 0.2% |
| Central American | 25 | 0.2% |
| Cherokee | 5 | 0.0% |
| Chippewa | 6 | 0.1% |
| Cuban | 7 | 0.1% |
| Czech | 49 | 0.4% |
| Czechoslovakian | 3 | 0.0% |
| Danish | 114 | 0.9% |
| Dutch | 3,755 | 31.2% |
| Eastern European | 7 | 0.1% |
| English | 369 | 3.1% |
| European | 175 | 1.5% |
| French | 45 | 0.4% |
| French Canadian | 9 | 0.1% |
| German | 4,680 | 38.9% |
| Greek | 11 | 0.1% |
| Guamanian / Chamorro | 22 | 0.2% |
| Hungarian | 3 | 0.0% |
| Indian (Asian) | 34 | 0.3% |
| Irish | 741 | 6.2% |
| Italian | 85 | 0.7% |
| Korean | 11 | 0.1% |
| Lithuanian | 1 | 0.0% |
| Luxembourger | 30 | 0.3% |
| Malaysian | 3 | 0.0% |
| Mexican | 305 | 2.5% |
| Mexican American Indian | 7 | 0.1% |
| Norwegian | 535 | 4.4% |
| Pakistani | 28 | 0.2% |
| Polish | 102 | 0.9% |
| Portuguese | 11 | 0.1% |
| Puerto Rican | 7 | 0.1% |
| Russian | 2 | 0.0% |
| Salvadoran | 25 | 0.2% |
| Scandinavian | 117 | 1.0% |
| Scotch-Irish | 4 | 0.0% |
| Scottish | 62 | 0.5% |
| Sioux | 6 | 0.1% |
| Spanish | 15 | 0.1% |
| Sri Lankan | 3 | 0.0% |
| Subsaharan African | 4 | 0.0% |
| Swedish | 228 | 1.9% |
| Swiss | 246 | 2.1% |
| Ukrainian | 8 | 0.1% |
| Welsh | 31 | 0.3% | View All 51 Rows |
Immigrants in Lyon County
The most numerous immigrant groups reported in Lyon County came from Latin America (121 | 1.0%), Central America (117 | 1.0%), Mexico (106 | 0.9%), Asia (35 | 0.3%), and China (29 | 0.2%), together accounting for 3.4% of all Lyon County residents.

| Immigration Origin | # Population | % Population |
| Asia | 35 | 0.3% |
| Brazil | 2 | 0.0% |
| Canada | 6 | 0.1% |
| Central America | 117 | 1.0% |
| China | 29 | 0.2% |
| Eastern Asia | 29 | 0.2% |
| El Salvador | 11 | 0.1% |
| Europe | 24 | 0.2% |
| Germany | 7 | 0.1% |
| India | 2 | 0.0% |
| Laos | 4 | 0.0% |
| Latin America | 121 | 1.0% |
| Mexico | 106 | 0.9% |
| Micronesia | 13 | 0.1% |
| Netherlands | 17 | 0.1% |
| Oceania | 13 | 0.1% |
| South America | 4 | 0.0% |
| South Central Asia | 2 | 0.0% |
| South Eastern Asia | 4 | 0.0% |
| Western Europe | 24 | 0.2% | View All 20 Rows |
Sex and Age in Lyon County
Sex and Age in Lyon County
The most populous age groups in Lyon County are 10 to 14 Years (549 | 8.9%) for men and 5 to 9 Years (493 | 8.4%) for women.

| Age Bracket | Male | Female |
| Under 5 Years | 413 (6.7%) | 435 (7.4%) |
| 5 to 9 Years | 509 (8.3%) | 493 (8.4%) |
| 10 to 14 Years | 549 (8.9%) | 372 (6.4%) |
| 15 to 19 Years | 480 (7.8%) | 421 (7.2%) |
| 20 to 24 Years | 343 (5.6%) | 284 (4.8%) |
| 25 to 29 Years | 339 (5.5%) | 284 (4.8%) |
| 30 to 34 Years | 293 (4.8%) | 297 (5.1%) |
| 35 to 39 Years | 353 (5.7%) | 418 (7.1%) |
| 40 to 44 Years | 431 (7.0%) | 321 (5.5%) |
| 45 to 49 Years | 337 (5.5%) | 295 (5.0%) |
| 50 to 54 Years | 309 (5.0%) | 291 (5.0%) |
| 55 to 59 Years | 359 (5.8%) | 302 (5.1%) |
| 60 to 64 Years | 425 (6.9%) | 391 (6.7%) |
| 65 to 69 Years | 261 (4.2%) | 278 (4.7%) |
| 70 to 74 Years | 344 (5.6%) | 328 (5.6%) |
| 75 to 79 Years | 238 (3.9%) | 205 (3.5%) |
| 80 to 84 Years | 57 (0.9%) | 138 (2.4%) |
| 85 Years and over | 121 (2.0%) | 309 (5.3%) |
| Total | 6,161 (100.0%) | 5,862 (100.0%) |
Families and Households in Lyon County
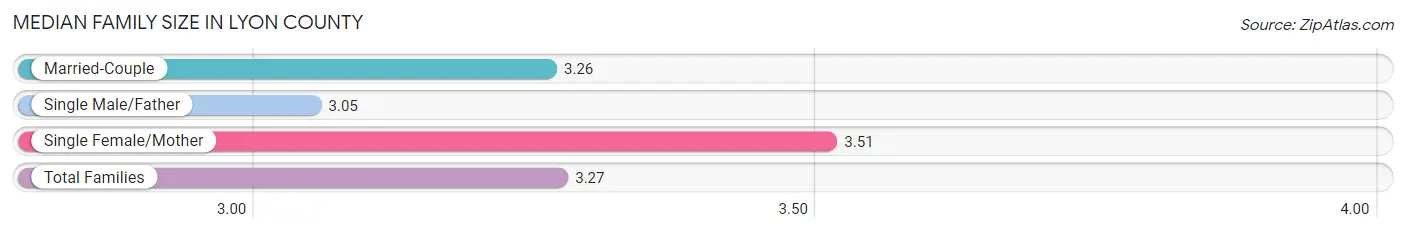
Median Family Size in Lyon County
The median family size in Lyon County is 3.27 persons per family, with single female/mother families (179 | 5.7%) accounting for the largest median family size of 3.51 persons per family. On the other hand, single male/father families (141 | 4.5%) represent the smallest median family size with 3.05 persons per family.
| Family Type | # Families | Family Size |
| Married-Couple | 2,839 (89.9%) | 3.26 |
| Single Male/Father | 141 (4.5%) | 3.05 |
| Single Female/Mother | 179 (5.7%) | 3.51 |
| Total Families | 3,159 (100.0%) | 3.27 |
Median Household Size in Lyon County
The median household size in Lyon County is 2.68 persons per household, with single female/mother households (179 | 4.1%) accounting for the largest median household size of 3.68 persons per household. non-family households (1,253 | 28.4%) represent the smallest median household size with 1.16 persons per household.

| Household Type | # Households | Household Size |
| Married-Couple | 2,839 (64.3%) | 3.27 |
| Single Male/Father | 141 (3.2%) | 3.29 |
| Single Female/Mother | 179 (4.1%) | 3.68 |
| Non-family | 1,253 (28.4%) | 1.16 |
| Total Households | 4,412 (100.0%) | 2.68 |
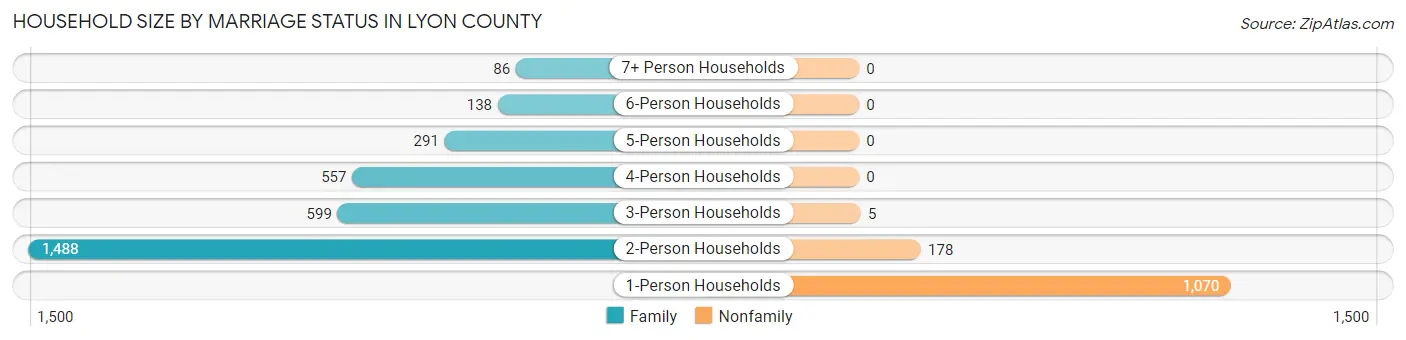
Household Size by Marriage Status in Lyon County
Out of a total of 4,412 households in Lyon County, 3,159 (71.6%) are family households, while 1,253 (28.4%) are nonfamily households. The most numerous type of family households are 2-person households, comprising 1,488, and the most common type of nonfamily households are 1-person households, comprising 1,070.
| Household Size | Family Households | Nonfamily Households |
| 1-Person Households | - | 1,070 (24.2%) |
| 2-Person Households | 1,488 (33.7%) | 178 (4.0%) |
| 3-Person Households | 599 (13.6%) | 5 (0.1%) |
| 4-Person Households | 557 (12.6%) | 0 (0.0%) |
| 5-Person Households | 291 (6.6%) | 0 (0.0%) |
| 6-Person Households | 138 (3.1%) | 0 (0.0%) |
| 7+ Person Households | 86 (1.9%) | 0 (0.0%) |
| Total | 3,159 (71.6%) | 1,253 (28.4%) |
Female Fertility in Lyon County
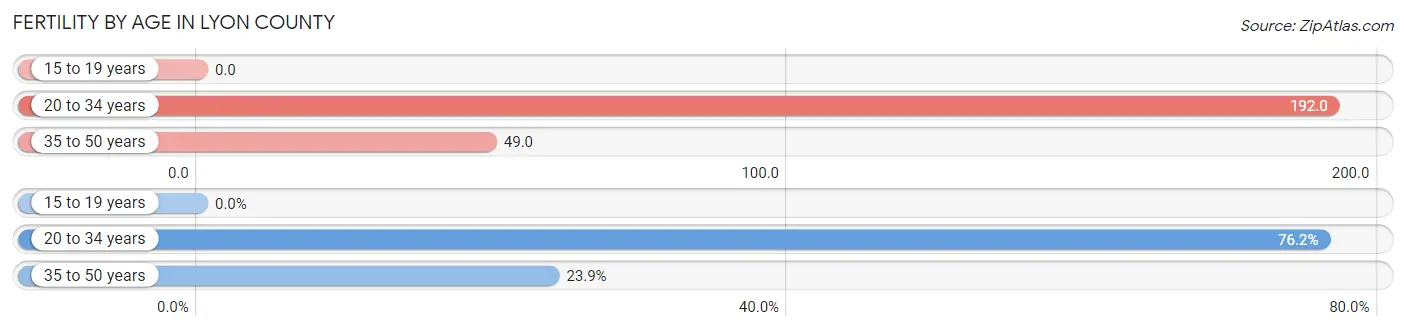
Fertility by Age in Lyon County
Average fertility rate in Lyon County is 93.0 births per 1,000 women. Women in the age bracket of 20 to 34 years have the highest fertility rate with 192.0 births per 1,000 women. Women in the age bracket of 20 to 34 years acount for 76.1% of all women with births.
| Age Bracket | Women with Births | Births / 1,000 Women |
| 15 to 19 years | 0 (0.0%) | 0.0 |
| 20 to 34 years | 166 (76.1%) | 192.0 |
| 35 to 50 years | 52 (23.8%) | 49.0 |
| Total | 218 (100.0%) | 93.0 |
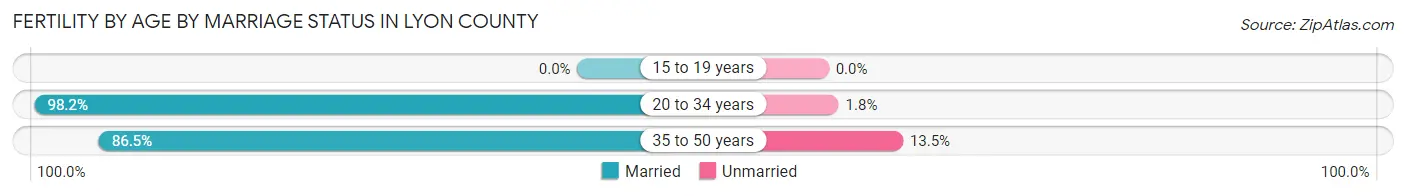
Fertility by Age by Marriage Status in Lyon County
95.4% of women with births (218) in Lyon County are married. The highest percentage of unmarried women with births falls into 35 to 50 years age bracket with 13.5% of them unmarried at the time of birth, while the lowest percentage of unmarried women with births belong to 20 to 34 years age bracket with 1.8% of them unmarried.
| Age Bracket | Married | Unmarried |
| 15 to 19 years | 0 (0.0%) | 0 (0.0%) |
| 20 to 34 years | 163 (98.2%) | 3 (1.8%) |
| 35 to 50 years | 45 (86.5%) | 7 (13.5%) |
| Total | 208 (95.4%) | 10 (4.6%) |
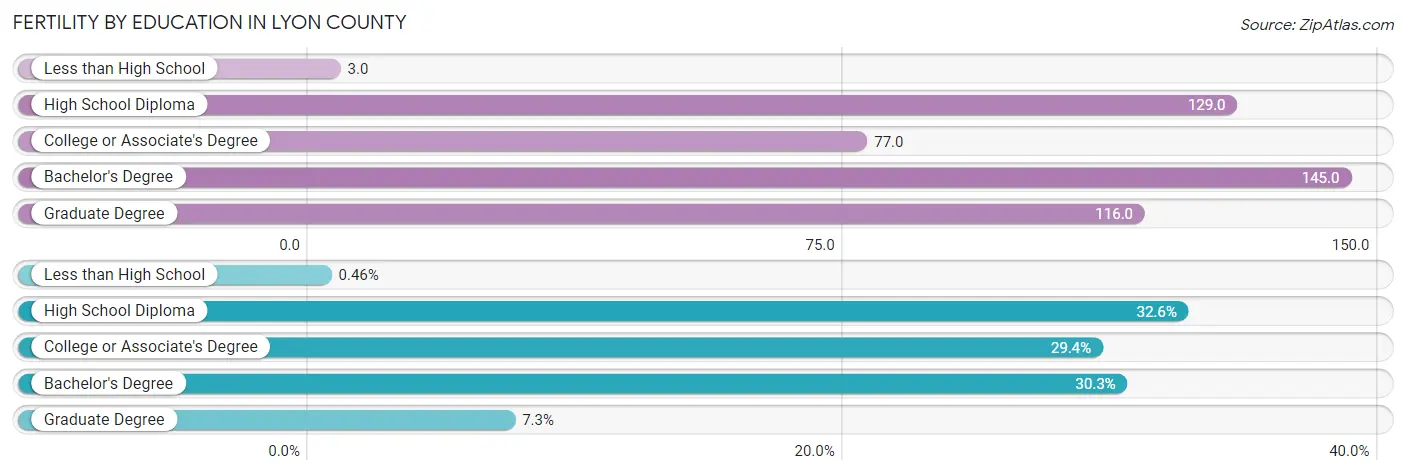
Fertility by Education in Lyon County
Average fertility rate in Lyon County is 93.0 births per 1,000 women. Women with the education attainment of bachelor's degree have the highest fertility rate of 145.0 births per 1,000 women, while women with the education attainment of less than high school have the lowest fertility at 3.0 births per 1,000 women. Women with the education attainment of high school diploma represent 32.6% of all women with births.
| Educational Attainment | Women with Births | Births / 1,000 Women |
| Less than High School | 1 (0.5%) | 3.0 |
| High School Diploma | 71 (32.6%) | 129.0 |
| College or Associate's Degree | 64 (29.4%) | 77.0 |
| Bachelor's Degree | 66 (30.3%) | 145.0 |
| Graduate Degree | 16 (7.3%) | 116.0 |
| Total | 218 (100.0%) | 93.0 |
Fertility by Education by Marriage Status in Lyon County
4.6% of women with births in Lyon County are unmarried. Women with the educational attainment of less than high school are most likely to be married with 100.0% of them married at childbirth, while women with the educational attainment of high school diploma are least likely to be married with 9.9% of them unmarried at childbirth.

| Educational Attainment | Married | Unmarried |
| Less than High School | 1 (100.0%) | 0 (0.0%) |
| High School Diploma | 64 (90.1%) | 7 (9.9%) |
| College or Associate's Degree | 61 (95.3%) | 3 (4.7%) |
| Bachelor's Degree | 66 (100.0%) | 0 (0.0%) |
| Graduate Degree | 16 (100.0%) | 0 (0.0%) |
| Total | 208 (95.4%) | 10 (4.6%) |
Income in Lyon County
Income Overview in Lyon County
Per Capita Income in Lyon County is $33,428, while median incomes of families and households are $86,215 and $73,735 respectively.
| Characteristic | Number | Measure |
| Per Capita Income | 12,023 | $33,428 |
| Median Family Income | 3,159 | $86,215 |
| Mean Family Income | 3,159 | $103,496 |
| Median Household Income | 4,412 | $73,735 |
| Mean Household Income | 4,412 | $89,292 |
| Income Deficit | 3,159 | $0 |
| Wage / Income Gap (%) | 12,023 | 33.83% |
| Wage / Income Gap ($) | 12,023 | 66.17¢ per $1 |
| Gini / Inequality Index | 12,023 | 0.39 |
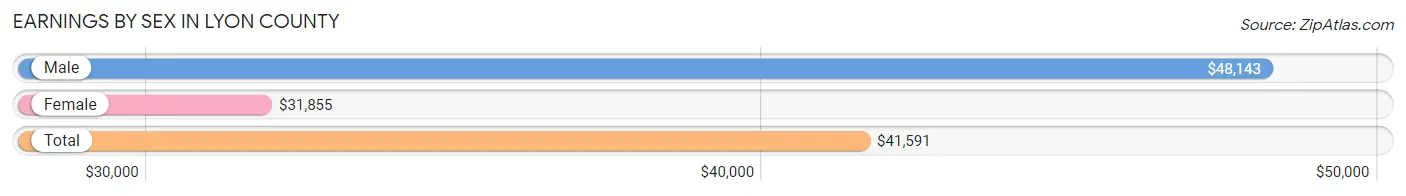
Earnings by Sex in Lyon County
Average Earnings in Lyon County are $41,591, $48,143 for men and $31,855 for women, a difference of 33.8%.
| Sex | Number | Average Earnings |
| Male | 3,521 (55.2%) | $48,143 |
| Female | 2,857 (44.8%) | $31,855 |
| Total | 6,378 (100.0%) | $41,591 |
Earnings by Sex by Income Bracket in Lyon County
The most common earnings brackets in Lyon County are $55,000 to $64,999 for men (468 | 13.3%) and $25,000 to $29,999 for women (254 | 8.9%).
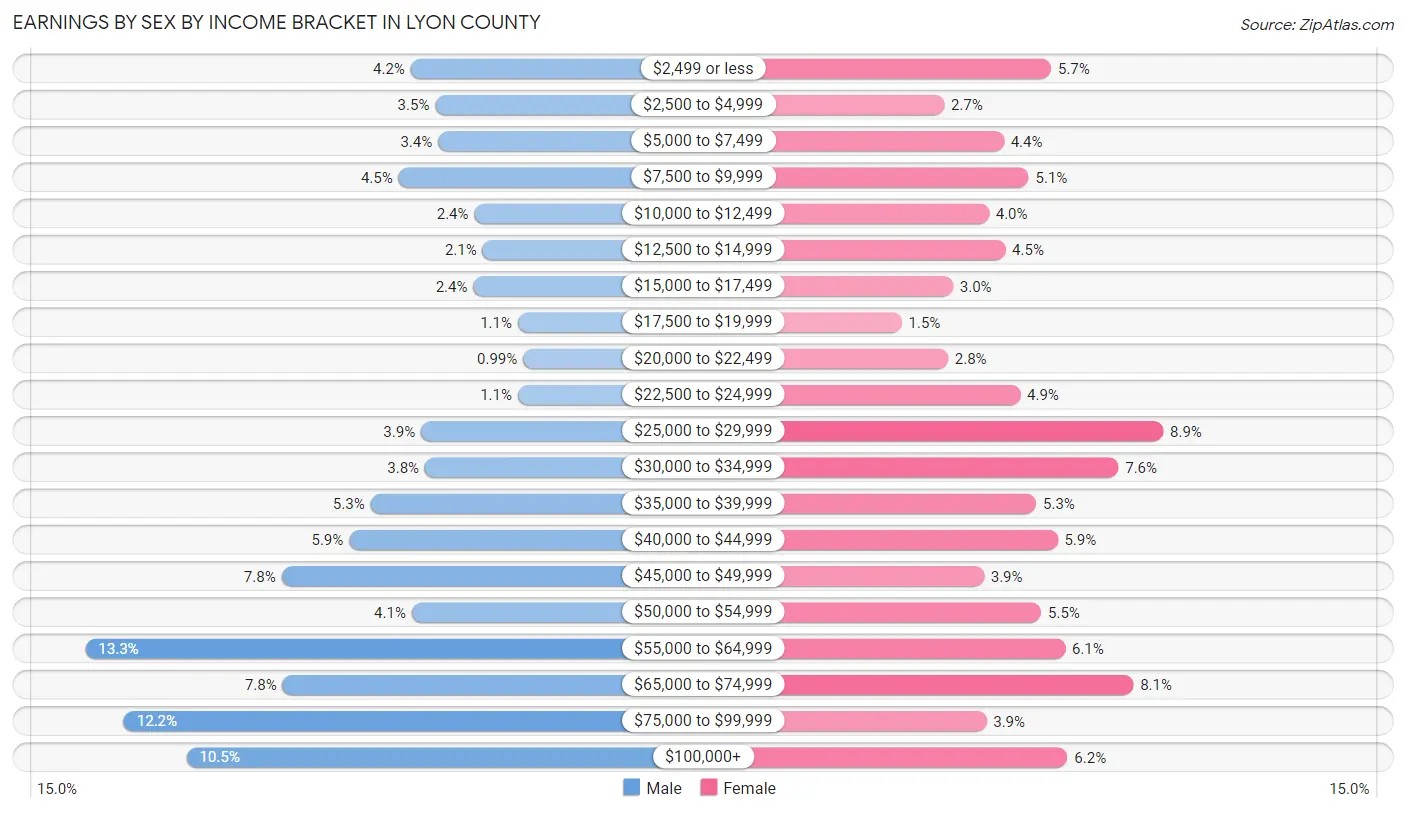
| Income | Male | Female |
| $2,499 or less | 146 (4.2%) | 164 (5.7%) |
| $2,500 to $4,999 | 122 (3.5%) | 78 (2.7%) |
| $5,000 to $7,499 | 119 (3.4%) | 126 (4.4%) |
| $7,500 to $9,999 | 158 (4.5%) | 146 (5.1%) |
| $10,000 to $12,499 | 83 (2.4%) | 114 (4.0%) |
| $12,500 to $14,999 | 75 (2.1%) | 127 (4.4%) |
| $15,000 to $17,499 | 84 (2.4%) | 85 (3.0%) |
| $17,500 to $19,999 | 40 (1.1%) | 44 (1.5%) |
| $20,000 to $22,499 | 35 (1.0%) | 81 (2.8%) |
| $22,500 to $24,999 | 40 (1.1%) | 139 (4.9%) |
| $25,000 to $29,999 | 136 (3.9%) | 254 (8.9%) |
| $30,000 to $34,999 | 132 (3.7%) | 218 (7.6%) |
| $35,000 to $39,999 | 186 (5.3%) | 152 (5.3%) |
| $40,000 to $44,999 | 207 (5.9%) | 169 (5.9%) |
| $45,000 to $49,999 | 274 (7.8%) | 110 (3.8%) |
| $50,000 to $54,999 | 145 (4.1%) | 156 (5.5%) |
| $55,000 to $64,999 | 468 (13.3%) | 175 (6.1%) |
| $65,000 to $74,999 | 273 (7.7%) | 230 (8.1%) |
| $75,000 to $99,999 | 430 (12.2%) | 112 (3.9%) |
| $100,000+ | 368 (10.4%) | 177 (6.2%) |
| Total | 3,521 (100.0%) | 2,857 (100.0%) |
Earnings by Sex by Educational Attainment in Lyon County
Average earnings in Lyon County are $54,026 for men and $35,156 for women, a difference of 34.9%. Men with an educational attainment of bachelor's degree enjoy the highest average annual earnings of $84,583, while those with less than high school education earn the least with $29,702. Women with an educational attainment of graduate degree earn the most with the average annual earnings of $67,443, while those with less than high school education have the smallest earnings of $24,167.

| Educational Attainment | Male Income | Female Income |
| Less than High School | $29,702 | $24,167 |
| High School Diploma | $44,792 | $29,083 |
| College or Associate's Degree | $62,701 | $31,667 |
| Bachelor's Degree | $84,583 | $58,333 |
| Graduate Degree | $59,886 | $67,443 |
| Total | $54,026 | $35,156 |
Family Income in Lyon County
Family Income Brackets in Lyon County
According to the Lyon County family income data, there are 711 families falling into the $100,000 to $149,999 income range, which is the most common income bracket and makes up 22.5% of all families. Conversely, the $10,000 to $14,999 income bracket is the least frequent group with only 9 families (0.3%) belonging to this category.
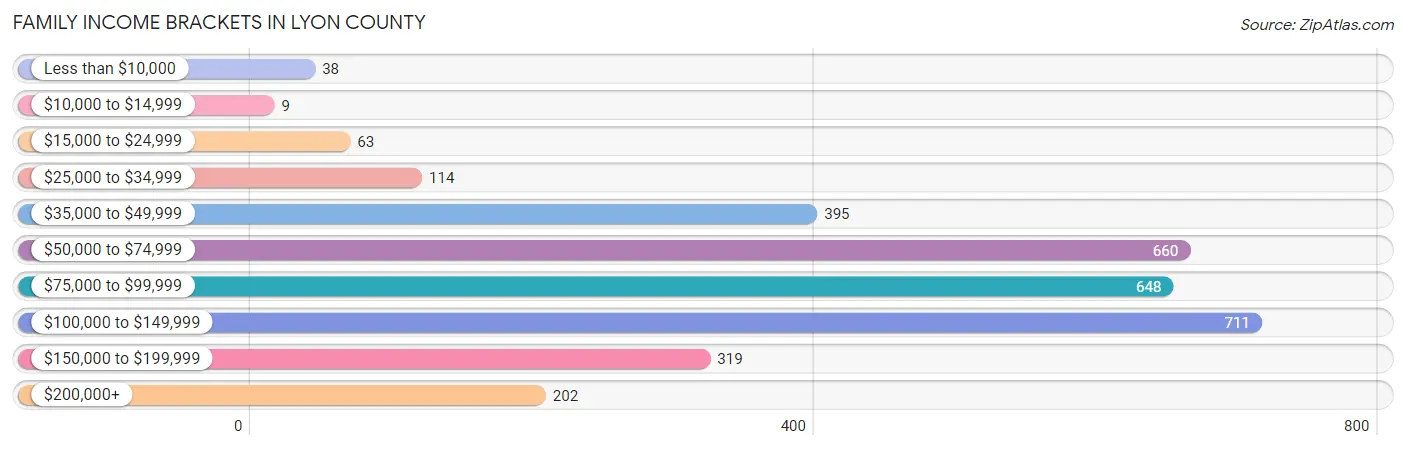
| Income Bracket | # Families | % Families |
| Less than $10,000 | 38 | 1.2% |
| $10,000 to $14,999 | 9 | 0.3% |
| $15,000 to $24,999 | 63 | 2.0% |
| $25,000 to $34,999 | 114 | 3.6% |
| $35,000 to $49,999 | 395 | 12.5% |
| $50,000 to $74,999 | 660 | 20.9% |
| $75,000 to $99,999 | 648 | 20.5% |
| $100,000 to $149,999 | 711 | 22.5% |
| $150,000 to $199,999 | 319 | 10.1% |
| $200,000+ | 202 | 6.4% |
Family Income by Famaliy Size in Lyon County
5-person families (283 | 9.0%) account for the highest median family income in Lyon County with $114,141 per family, while 2-person families (1,519 | 48.1%) have the highest median income of $36,894 per family member.
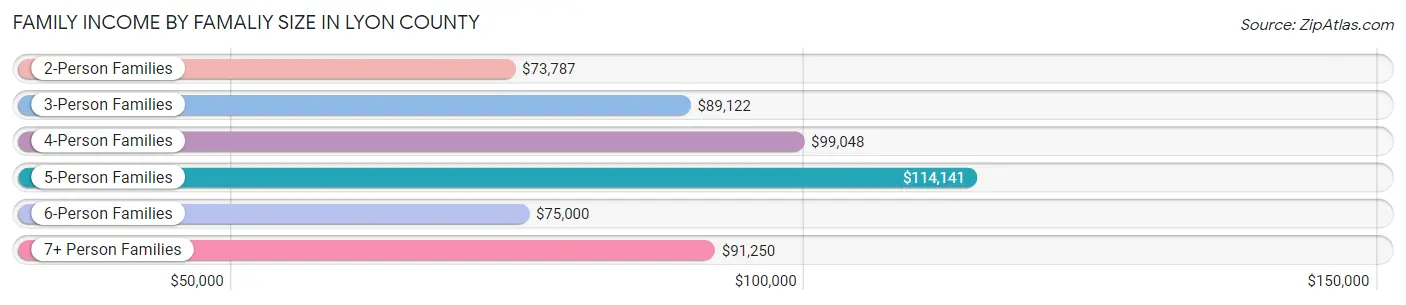
| Income Bracket | # Families | Median Income |
| 2-Person Families | 1,519 (48.1%) | $73,787 |
| 3-Person Families | 597 (18.9%) | $89,122 |
| 4-Person Families | 536 (17.0%) | $99,048 |
| 5-Person Families | 283 (9.0%) | $114,141 |
| 6-Person Families | 138 (4.4%) | $75,000 |
| 7+ Person Families | 86 (2.7%) | $91,250 |
| Total | 3,159 (100.0%) | $86,215 |
Family Income by Number of Earners in Lyon County
The median family income in Lyon County is $86,215, with families comprising 3+ earners (262) having the highest median family income of $112,069, while families with no earners (425) have the lowest median family income of $47,802, accounting for 8.3% and 13.5% of families, respectively.

| Number of Earners | # Families | Median Income |
| No Earners | 425 (13.5%) | $47,802 |
| 1 Earner | 748 (23.7%) | $58,462 |
| 2 Earners | 1,724 (54.6%) | $100,205 |
| 3+ Earners | 262 (8.3%) | $112,069 |
| Total | 3,159 (100.0%) | $86,215 |
Household Income in Lyon County
Household Income Brackets in Lyon County
With 900 households falling in the category, the $50,000 to $74,999 income range is the most frequent in Lyon County, accounting for 20.4% of all households. In contrast, only 97 households (2.2%) fall into the less than $10,000 income bracket, making it the least populous group.
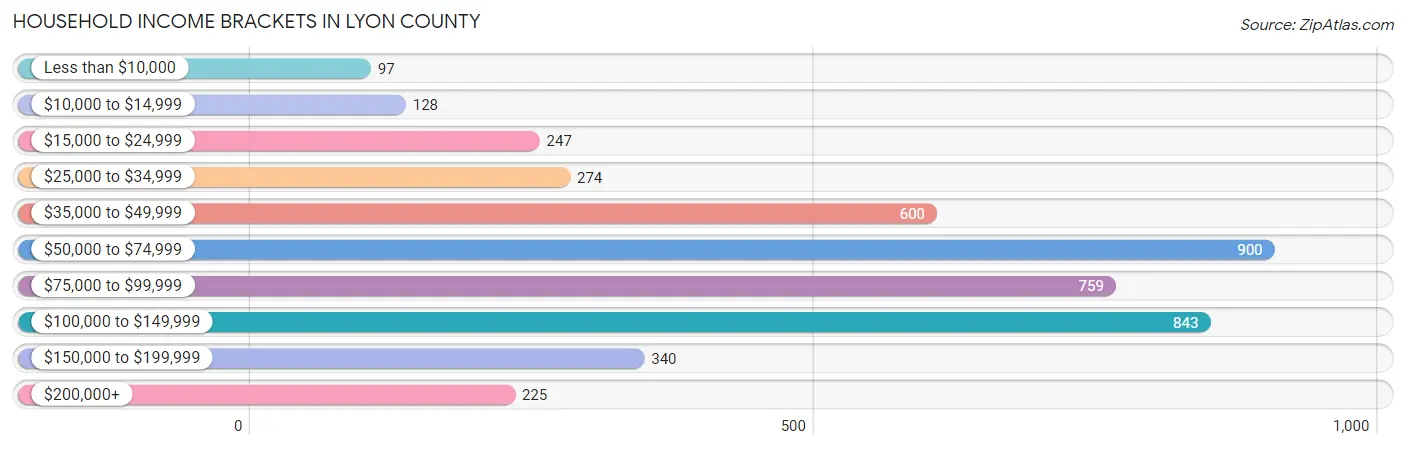
| Income Bracket | # Households | % Households |
| Less than $10,000 | 97 | 2.2% |
| $10,000 to $14,999 | 128 | 2.9% |
| $15,000 to $24,999 | 247 | 5.6% |
| $25,000 to $34,999 | 274 | 6.2% |
| $35,000 to $49,999 | 600 | 13.6% |
| $50,000 to $74,999 | 900 | 20.4% |
| $75,000 to $99,999 | 759 | 17.2% |
| $100,000 to $149,999 | 843 | 19.1% |
| $150,000 to $199,999 | 340 | 7.7% |
| $200,000+ | 225 | 5.1% |
Household Income by Householder Age in Lyon County
The median household income in Lyon County is $73,735, with the highest median household income of $89,684 found in the 45 to 64 years age bracket for the primary householder. A total of 1,496 households (33.9%) fall into this category. Meanwhile, the 65+ years age bracket for the primary householder has the lowest median household income of $43,144, with 1,381 households (31.3%) in this group.
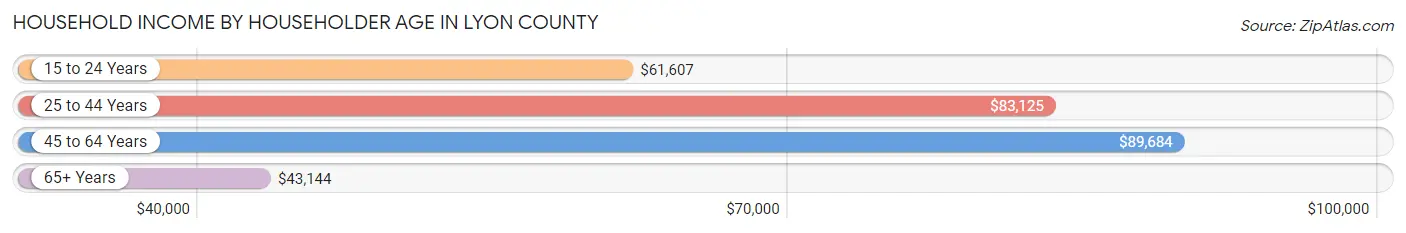
| Income Bracket | # Households | Median Income |
| 15 to 24 Years | 134 (3.0%) | $61,607 |
| 25 to 44 Years | 1,401 (31.8%) | $83,125 |
| 45 to 64 Years | 1,496 (33.9%) | $89,684 |
| 65+ Years | 1,381 (31.3%) | $43,144 |
| Total | 4,412 (100.0%) | $73,735 |
Poverty in Lyon County
Income Below Poverty by Sex and Age in Lyon County
With 3.3% poverty level for males and 4.5% for females among the residents of Lyon County, 18 to 24 year old males and 75 year old and over females are the most vulnerable to poverty, with 32 males (6.3%) and 81 females (14.9%) in their respective age groups living below the poverty level.
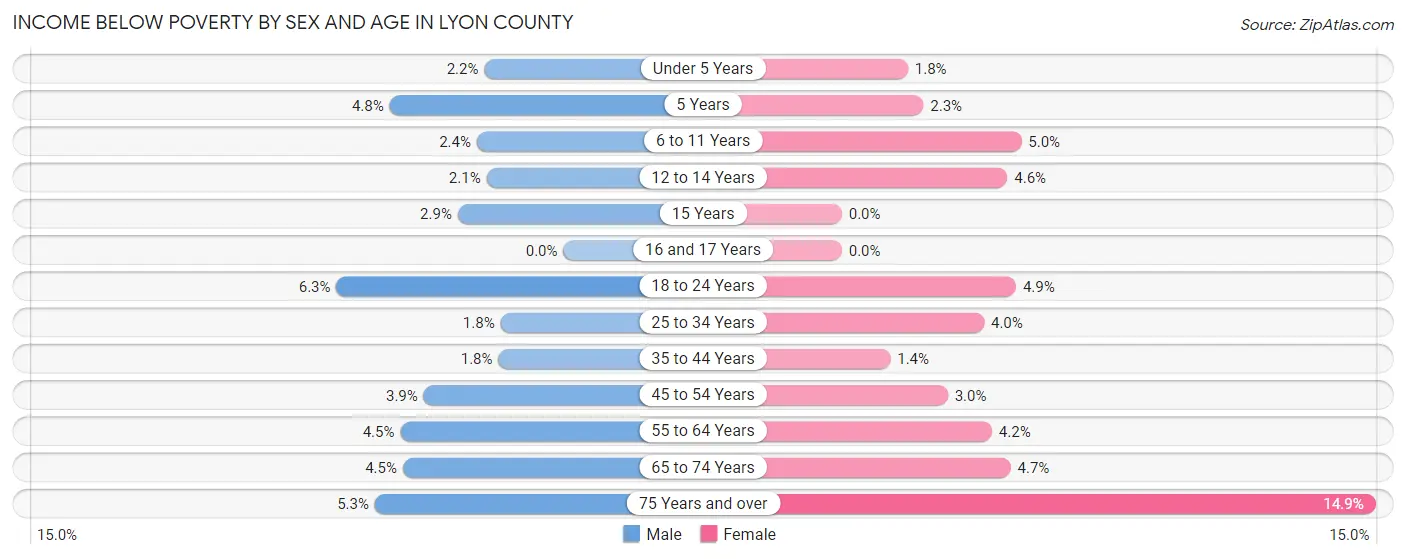
| Age Bracket | Male | Female |
| Under 5 Years | 9 (2.2%) | 8 (1.8%) |
| 5 Years | 3 (4.8%) | 2 (2.3%) |
| 6 to 11 Years | 16 (2.4%) | 28 (5.0%) |
| 12 to 14 Years | 7 (2.1%) | 10 (4.6%) |
| 15 Years | 3 (2.9%) | 0 (0.0%) |
| 16 and 17 Years | 0 (0.0%) | 0 (0.0%) |
| 18 to 24 Years | 32 (6.3%) | 20 (4.9%) |
| 25 to 34 Years | 11 (1.8%) | 23 (4.0%) |
| 35 to 44 Years | 14 (1.8%) | 10 (1.3%) |
| 45 to 54 Years | 25 (3.9%) | 17 (2.9%) |
| 55 to 64 Years | 35 (4.5%) | 29 (4.2%) |
| 65 to 74 Years | 27 (4.5%) | 28 (4.7%) |
| 75 Years and over | 21 (5.2%) | 81 (14.9%) |
| Total | 203 (3.3%) | 256 (4.5%) |
Income Above Poverty by Sex and Age in Lyon County
According to the poverty statistics in Lyon County, males aged 16 and 17 years and females aged 15 years are the age groups that are most secure financially, with 100.0% of males and 100.0% of females in these age groups living above the poverty line.
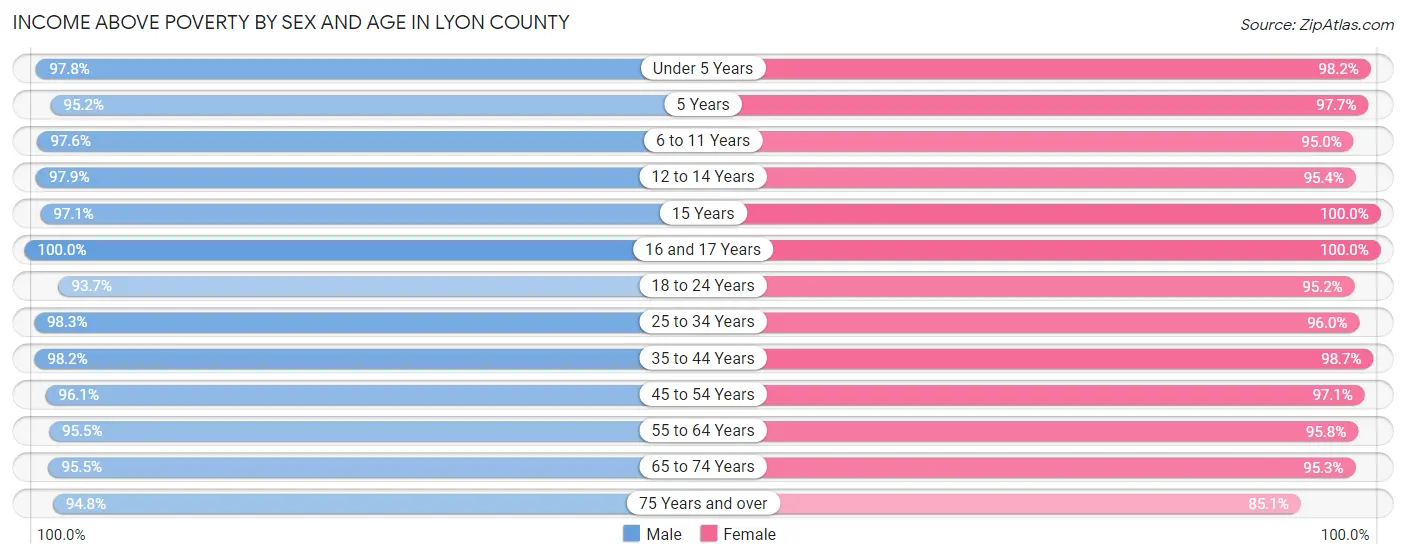
| Age Bracket | Male | Female |
| Under 5 Years | 400 (97.8%) | 427 (98.2%) |
| 5 Years | 59 (95.2%) | 86 (97.7%) |
| 6 to 11 Years | 649 (97.6%) | 532 (95.0%) |
| 12 to 14 Years | 320 (97.9%) | 207 (95.4%) |
| 15 Years | 99 (97.1%) | 173 (100.0%) |
| 16 and 17 Years | 215 (100.0%) | 120 (100.0%) |
| 18 to 24 Years | 474 (93.7%) | 392 (95.2%) |
| 25 to 34 Years | 616 (98.3%) | 558 (96.0%) |
| 35 to 44 Years | 758 (98.2%) | 729 (98.7%) |
| 45 to 54 Years | 618 (96.1%) | 559 (97.1%) |
| 55 to 64 Years | 736 (95.5%) | 664 (95.8%) |
| 65 to 74 Years | 577 (95.5%) | 568 (95.3%) |
| 75 Years and over | 379 (94.8%) | 464 (85.1%) |
| Total | 5,900 (96.7%) | 5,479 (95.5%) |
Income Below Poverty Among Married-Couple Families in Lyon County
The poverty statistics for married-couple families in Lyon County show that 1.7% or 48 of the total 2,839 families live below the poverty line. Families with 3 or 4 children have the highest poverty rate of 2.3%, comprising of 8 families. On the other hand, families with 5 or more children have the lowest poverty rate of 0.0%, which includes 0 families.
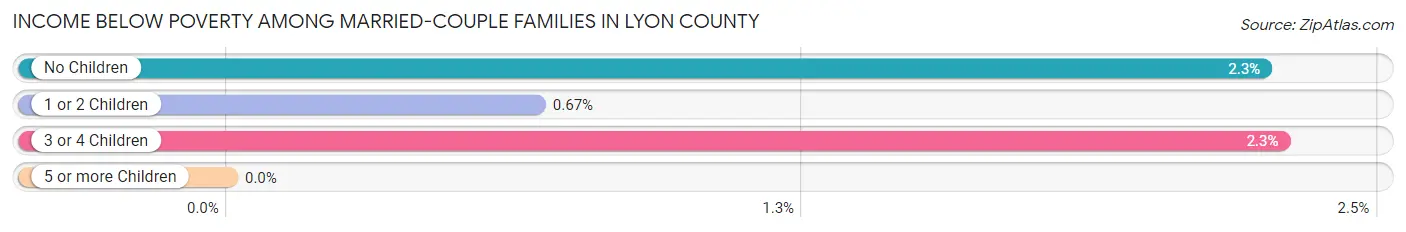
| Children | Above Poverty | Below Poverty |
| No Children | 1,477 (97.8%) | 34 (2.2%) |
| 1 or 2 Children | 888 (99.3%) | 6 (0.7%) |
| 3 or 4 Children | 342 (97.7%) | 8 (2.3%) |
| 5 or more Children | 84 (100.0%) | 0 (0.0%) |
| Total | 2,791 (98.3%) | 48 (1.7%) |
Income Below Poverty Among Single-Parent Households in Lyon County
According to the poverty data in Lyon County, 2.1% or 3 single-father households and 15.1% or 27 single-mother households are living below the poverty line. Among single-father households, those with 1 or 2 children have the highest poverty rate, with 3 households (4.6%) experiencing poverty. Likewise, among single-mother households, those with no children have the highest poverty rate, with 10 households (17.9%) falling below the poverty line.
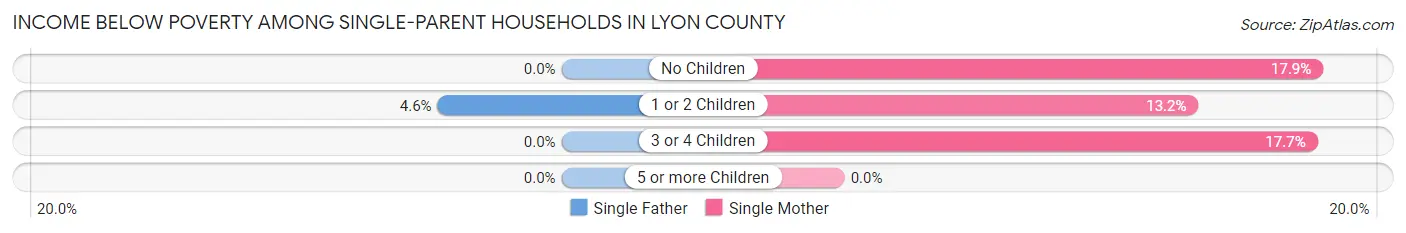
| Children | Single Father | Single Mother |
| No Children | 0 (0.0%) | 10 (17.9%) |
| 1 or 2 Children | 3 (4.6%) | 14 (13.2%) |
| 3 or 4 Children | 0 (0.0%) | 3 (17.6%) |
| 5 or more Children | 0 (0.0%) | 0 (0.0%) |
| Total | 3 (2.1%) | 27 (15.1%) |
Income Below Poverty Among Married-Couple vs Single-Parent Households in Lyon County
The poverty data for Lyon County shows that 48 of the married-couple family households (1.7%) and 30 of the single-parent households (9.4%) are living below the poverty level. Within the married-couple family households, those with 3 or 4 children have the highest poverty rate, with 8 households (2.3%) falling below the poverty line. Among the single-parent households, those with 3 or 4 children have the highest poverty rate, with 3 household (12.5%) living below poverty.
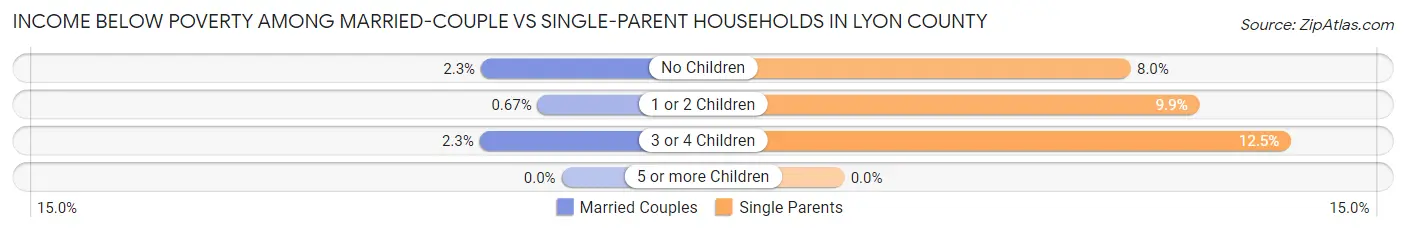
| Children | Married-Couple Families | Single-Parent Households |
| No Children | 34 (2.2%) | 10 (8.0%) |
| 1 or 2 Children | 6 (0.7%) | 17 (9.9%) |
| 3 or 4 Children | 8 (2.3%) | 3 (12.5%) |
| 5 or more Children | 0 (0.0%) | 0 (0.0%) |
| Total | 48 (1.7%) | 30 (9.4%) |
Employment Characteristics in Lyon County
Employment by Class of Employer in Lyon County
Among the 5,790 employed individuals in Lyon County, private company employees (3,220 | 55.6%), self-employed (not incorporated) (639 | 11.0%), and not-for-profit organizations (603 | 10.4%) make up the most common classes of employment.

| Employer Class | # Employees | % Employees |
| Private Company Employees | 3,220 | 55.6% |
| Self-Employed (Incorporated) | 414 | 7.1% |
| Self-Employed (Not Incorporated) | 639 | 11.0% |
| Not-for-profit Organizations | 603 | 10.4% |
| Local Government Employees | 573 | 9.9% |
| State Government Employees | 255 | 4.4% |
| Federal Government Employees | 79 | 1.4% |
| Unpaid Family Workers | 7 | 0.1% |
| Total | 5,790 | 100.0% |
Employment Status by Age in Lyon County
According to the labor force statistics for Lyon County, out of the total population over 16 years of age (8,977), 66.8% or 5,997 individuals are in the labor force, with 2.4% or 144 of them unemployed. The age group with the highest labor force participation rate is 45 to 54 years, with 95.7% or 1,179 individuals in the labor force. Within the labor force, the 20 to 24 years age range has the highest percentage of unemployed individuals, with 13.5% or 58 of them being unemployed.
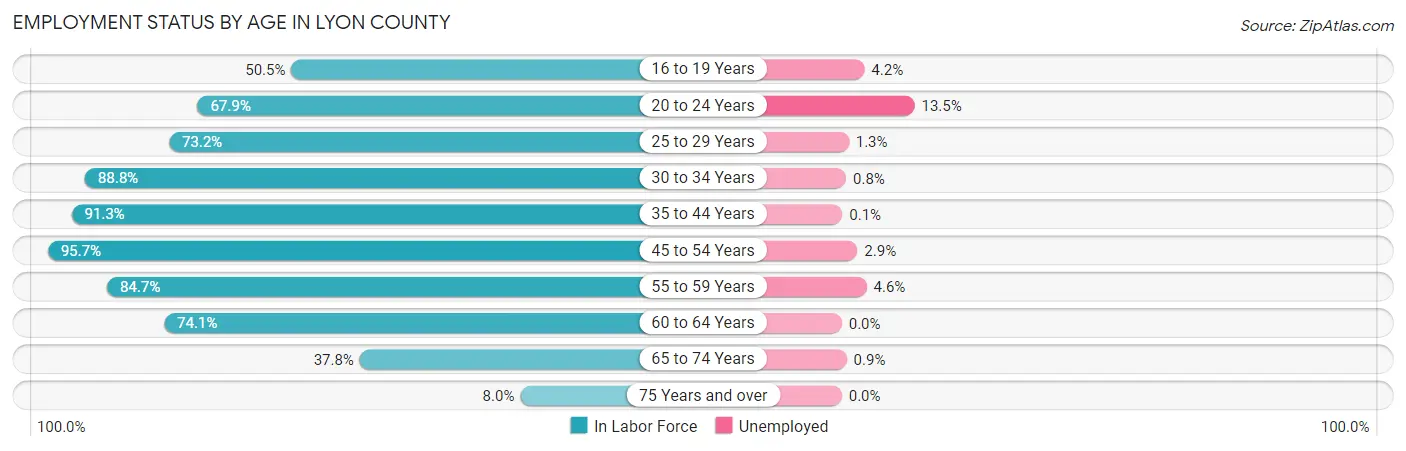
| Age Bracket | In Labor Force | Unemployed |
| 16 to 19 Years | 316 (50.5%) | 13 (4.2%) |
| 20 to 24 Years | 426 (67.9%) | 58 (13.5%) |
| 25 to 29 Years | 456 (73.2%) | 6 (1.3%) |
| 30 to 34 Years | 524 (88.8%) | 4 (0.8%) |
| 35 to 44 Years | 1,390 (91.3%) | 1 (0.1%) |
| 45 to 54 Years | 1,179 (95.7%) | 34 (2.9%) |
| 55 to 59 Years | 560 (84.7%) | 26 (4.6%) |
| 60 to 64 Years | 605 (74.1%) | 0 (0.0%) |
| 65 to 74 Years | 458 (37.8%) | 4 (0.9%) |
| 75 Years and over | 85 (8.0%) | 0 (0.0%) |
| Total | 5,997 (66.8%) | 144 (2.4%) |
Employment Status by Educational Attainment in Lyon County
According to labor force statistics for Lyon County, 86.6% of individuals (4,715) out of the total population between 25 and 64 years of age (5,445) are in the labor force, with 1.5% or 71 of them being unemployed. The group with the highest labor force participation rate are those with the educational attainment of bachelor's degree or higher, with 89.1% or 1,078 individuals in the labor force. Within the labor force, individuals with college / associate degree education have the highest percentage of unemployment, with 2.0% or 36 of them being unemployed.
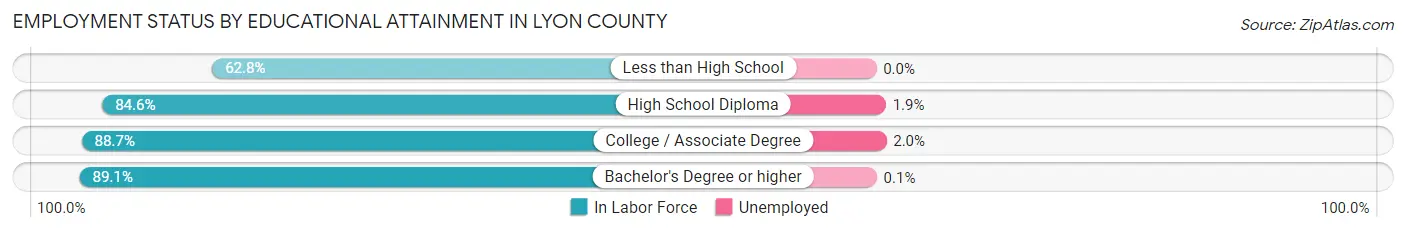
| Educational Attainment | In Labor Force | Unemployed |
| Less than High School | 86 (62.8%) | 0 (0.0%) |
| High School Diploma | 1,731 (84.6%) | 39 (1.9%) |
| College / Associate Degree | 1,820 (88.7%) | 41 (2.0%) |
| Bachelor's Degree or higher | 1,078 (89.1%) | 1 (0.1%) |
| Total | 4,715 (86.6%) | 82 (1.5%) |
Employment Occupations by Sex in Lyon County
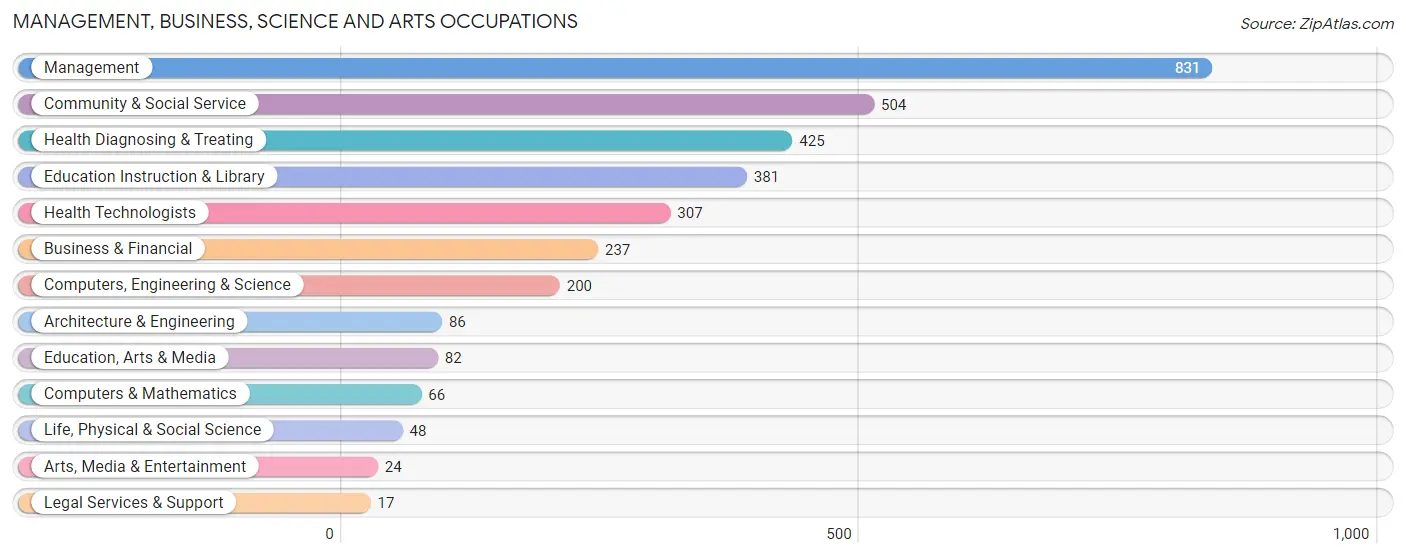
Management, Business, Science and Arts Occupations
The most common Management, Business, Science and Arts occupations in Lyon County are Management (831 | 14.2%), Community & Social Service (504 | 8.6%), Health Diagnosing & Treating (425 | 7.3%), Education Instruction & Library (381 | 6.5%), and Health Technologists (307 | 5.2%).
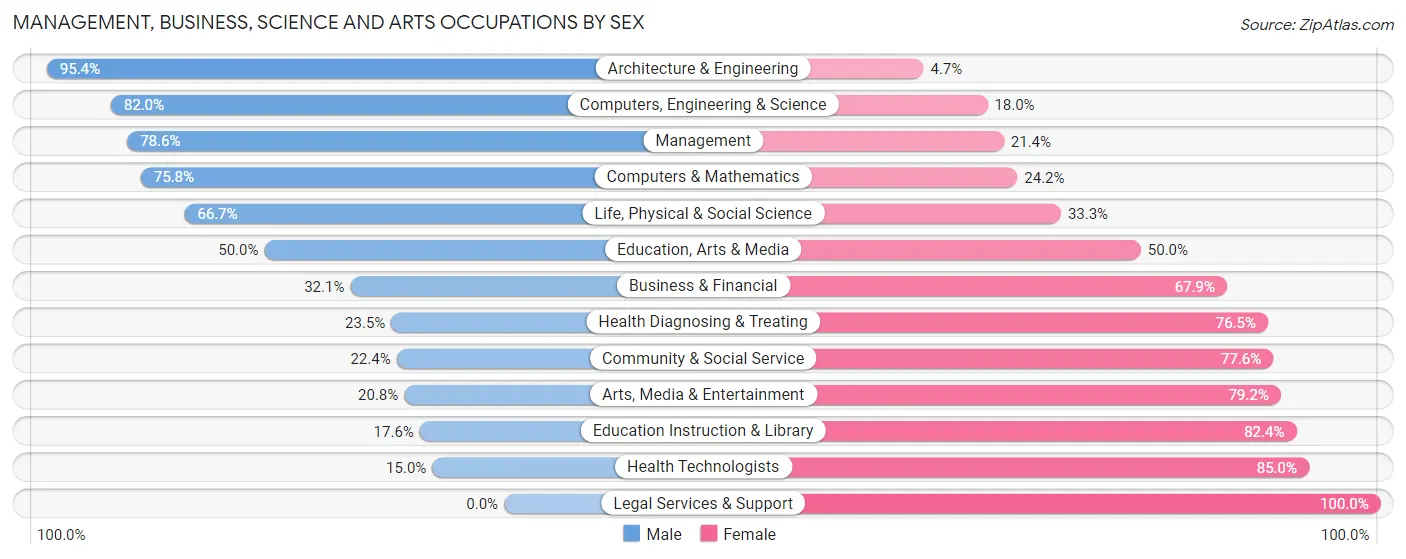
Management, Business, Science and Arts Occupations by Sex
Within the Management, Business, Science and Arts occupations in Lyon County, the most male-oriented occupations are Architecture & Engineering (95.4%), Computers, Engineering & Science (82.0%), and Management (78.6%), while the most female-oriented occupations are Legal Services & Support (100.0%), Health Technologists (85.0%), and Education Instruction & Library (82.4%).
| Occupation | Male | Female |
| Management | 653 (78.6%) | 178 (21.4%) |
| Business & Financial | 76 (32.1%) | 161 (67.9%) |
| Computers, Engineering & Science | 164 (82.0%) | 36 (18.0%) |
| Computers & Mathematics | 50 (75.8%) | 16 (24.2%) |
| Architecture & Engineering | 82 (95.4%) | 4 (4.6%) |
| Life, Physical & Social Science | 32 (66.7%) | 16 (33.3%) |
| Community & Social Service | 113 (22.4%) | 391 (77.6%) |
| Education, Arts & Media | 41 (50.0%) | 41 (50.0%) |
| Legal Services & Support | 0 (0.0%) | 17 (100.0%) |
| Education Instruction & Library | 67 (17.6%) | 314 (82.4%) |
| Arts, Media & Entertainment | 5 (20.8%) | 19 (79.2%) |
| Health Diagnosing & Treating | 100 (23.5%) | 325 (76.5%) |
| Health Technologists | 46 (15.0%) | 261 (85.0%) |
| Total (Category) | 1,106 (50.3%) | 1,091 (49.7%) |
| Total (Overall) | 3,251 (55.6%) | 2,594 (44.4%) |
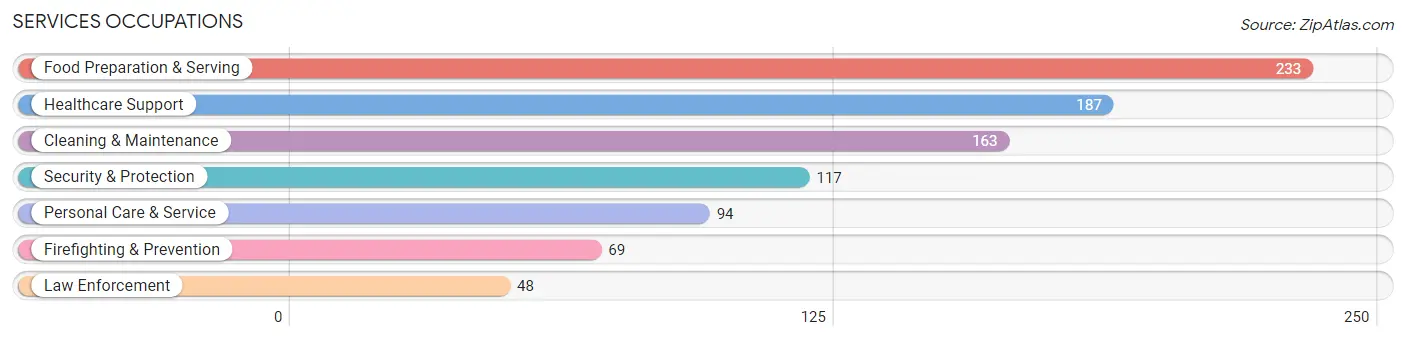
Services Occupations
The most common Services occupations in Lyon County are Food Preparation & Serving (233 | 4.0%), Healthcare Support (187 | 3.2%), Cleaning & Maintenance (163 | 2.8%), Security & Protection (117 | 2.0%), and Personal Care & Service (94 | 1.6%).
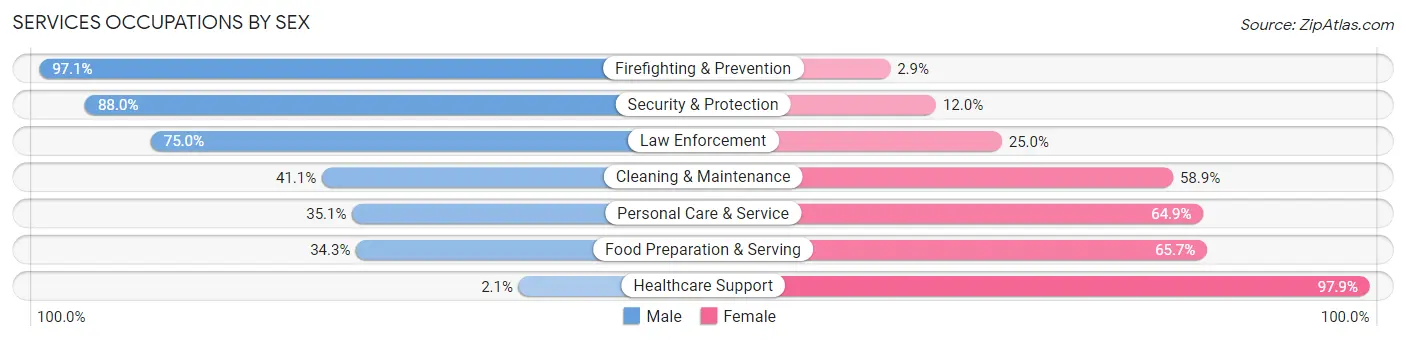
Services Occupations by Sex
Within the Services occupations in Lyon County, the most male-oriented occupations are Firefighting & Prevention (97.1%), Security & Protection (88.0%), and Law Enforcement (75.0%), while the most female-oriented occupations are Healthcare Support (97.9%), Food Preparation & Serving (65.7%), and Personal Care & Service (64.9%).
| Occupation | Male | Female |
| Healthcare Support | 4 (2.1%) | 183 (97.9%) |
| Security & Protection | 103 (88.0%) | 14 (12.0%) |
| Firefighting & Prevention | 67 (97.1%) | 2 (2.9%) |
| Law Enforcement | 36 (75.0%) | 12 (25.0%) |
| Food Preparation & Serving | 80 (34.3%) | 153 (65.7%) |
| Cleaning & Maintenance | 67 (41.1%) | 96 (58.9%) |
| Personal Care & Service | 33 (35.1%) | 61 (64.9%) |
| Total (Category) | 287 (36.1%) | 507 (63.8%) |
| Total (Overall) | 3,251 (55.6%) | 2,594 (44.4%) |
Sales and Office Occupations
The most common Sales and Office occupations in Lyon County are Office & Administration (699 | 12.0%), and Sales & Related (496 | 8.5%).

Sales and Office Occupations by Sex
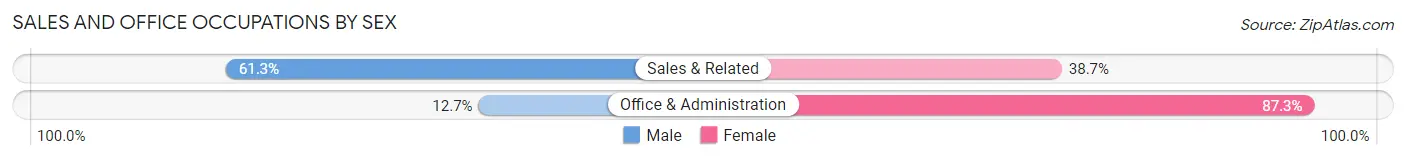
| Occupation | Male | Female |
| Sales & Related | 304 (61.3%) | 192 (38.7%) |
| Office & Administration | 89 (12.7%) | 610 (87.3%) |
| Total (Category) | 393 (32.9%) | 802 (67.1%) |
| Total (Overall) | 3,251 (55.6%) | 2,594 (44.4%) |
Natural Resources, Construction and Maintenance Occupations
The most common Natural Resources, Construction and Maintenance occupations in Lyon County are Construction & Extraction (249 | 4.3%), Installation, Maintenance & Repair (246 | 4.2%), and Farming, Fishing & Forestry (129 | 2.2%).

Natural Resources, Construction and Maintenance Occupations by Sex
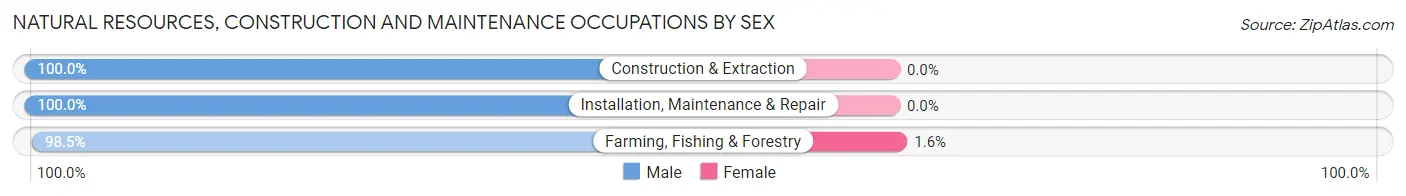
| Occupation | Male | Female |
| Farming, Fishing & Forestry | 127 (98.5%) | 2 (1.5%) |
| Construction & Extraction | 249 (100.0%) | 0 (0.0%) |
| Installation, Maintenance & Repair | 246 (100.0%) | 0 (0.0%) |
| Total (Category) | 622 (99.7%) | 2 (0.3%) |
| Total (Overall) | 3,251 (55.6%) | 2,594 (44.4%) |
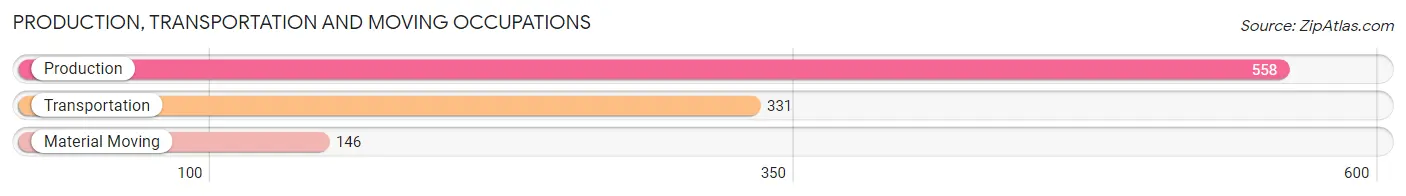
Production, Transportation and Moving Occupations
The most common Production, Transportation and Moving occupations in Lyon County are Production (558 | 9.6%), Transportation (331 | 5.7%), and Material Moving (146 | 2.5%).
Production, Transportation and Moving Occupations by Sex
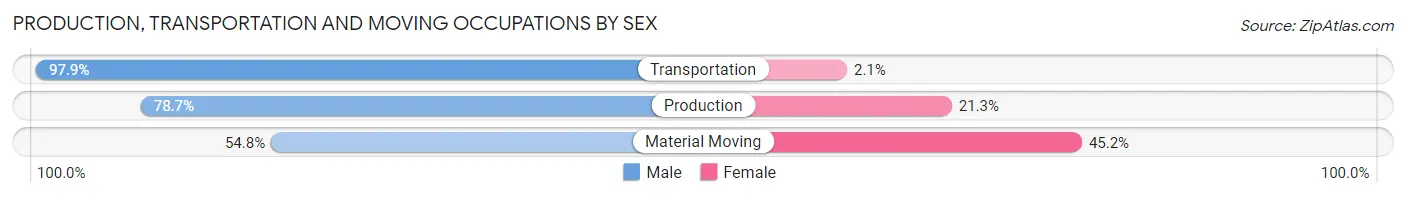
| Occupation | Male | Female |
| Production | 439 (78.7%) | 119 (21.3%) |
| Transportation | 324 (97.9%) | 7 (2.1%) |
| Material Moving | 80 (54.8%) | 66 (45.2%) |
| Total (Category) | 843 (81.5%) | 192 (18.5%) |
| Total (Overall) | 3,251 (55.6%) | 2,594 (44.4%) |
Employment Industries by Sex in Lyon County
Employment Industries in Lyon County
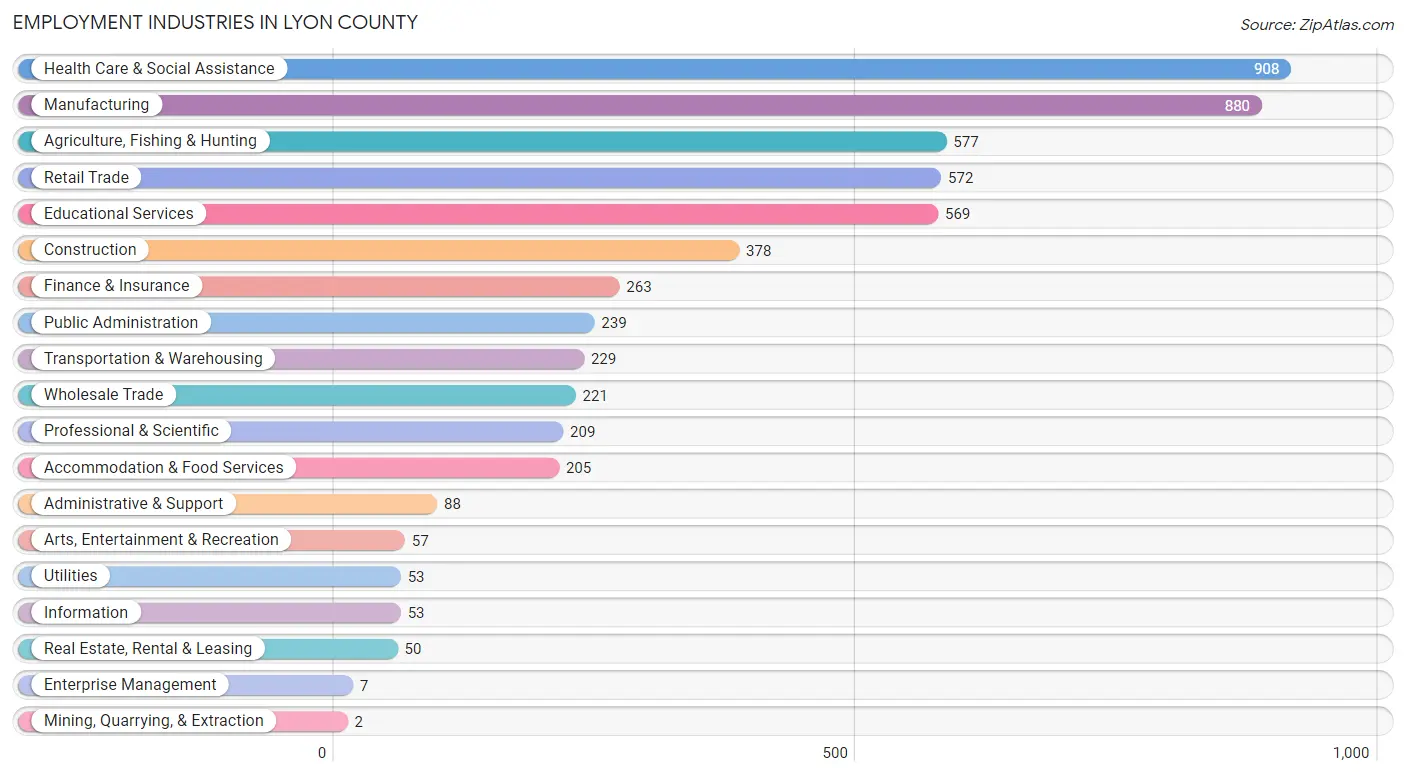
The major employment industries in Lyon County include Health Care & Social Assistance (908 | 15.5%), Manufacturing (880 | 15.1%), Agriculture, Fishing & Hunting (577 | 9.9%), Retail Trade (572 | 9.8%), and Educational Services (569 | 9.7%).
Employment Industries by Sex in Lyon County
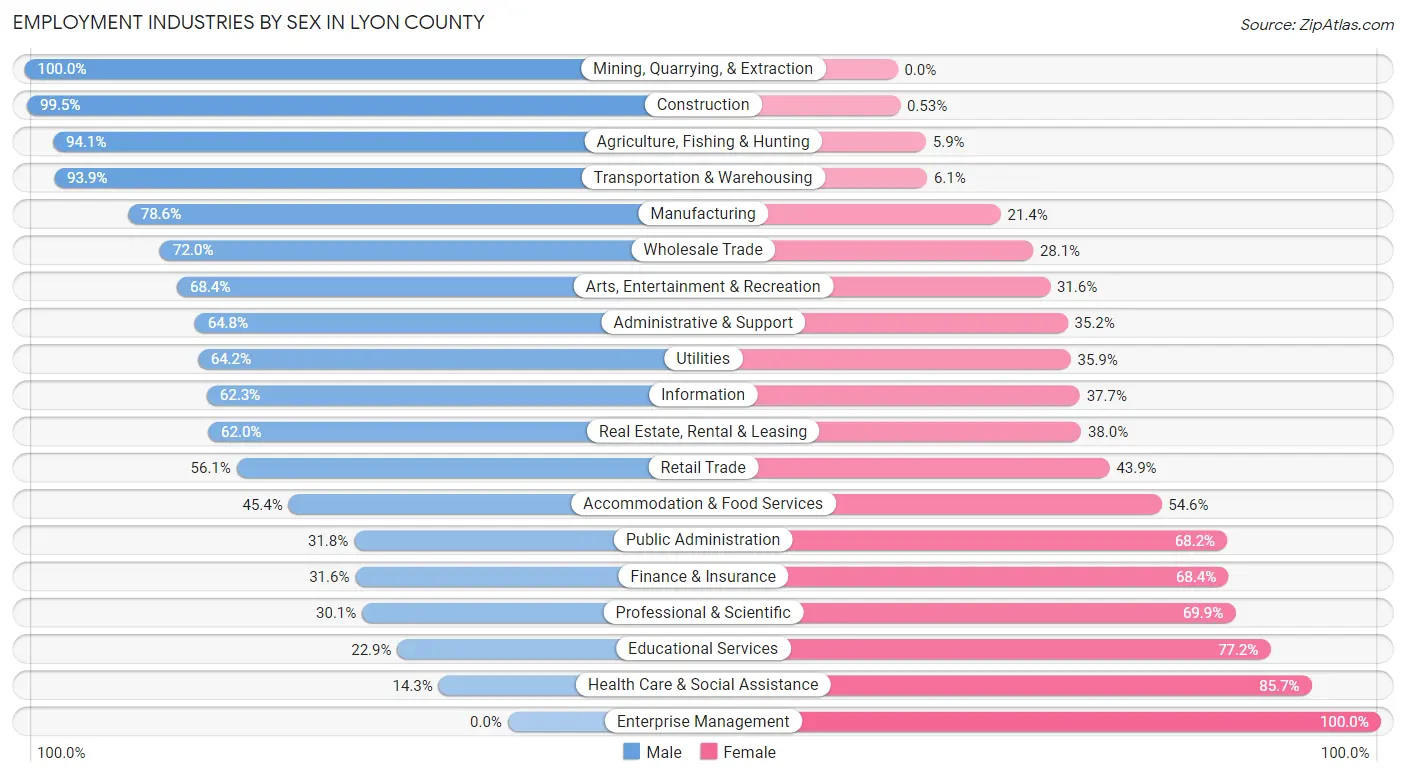
The Lyon County industries that see more men than women are Mining, Quarrying, & Extraction (100.0%), Construction (99.5%), and Agriculture, Fishing & Hunting (94.1%), whereas the industries that tend to have a higher number of women are Enterprise Management (100.0%), Health Care & Social Assistance (85.7%), and Educational Services (77.1%).
| Industry | Male | Female |
| Agriculture, Fishing & Hunting | 543 (94.1%) | 34 (5.9%) |
| Mining, Quarrying, & Extraction | 2 (100.0%) | 0 (0.0%) |
| Construction | 376 (99.5%) | 2 (0.5%) |
| Manufacturing | 692 (78.6%) | 188 (21.4%) |
| Wholesale Trade | 159 (72.0%) | 62 (28.1%) |
| Retail Trade | 321 (56.1%) | 251 (43.9%) |
| Transportation & Warehousing | 215 (93.9%) | 14 (6.1%) |
| Utilities | 34 (64.1%) | 19 (35.8%) |
| Information | 33 (62.3%) | 20 (37.7%) |
| Finance & Insurance | 83 (31.6%) | 180 (68.4%) |
| Real Estate, Rental & Leasing | 31 (62.0%) | 19 (38.0%) |
| Professional & Scientific | 63 (30.1%) | 146 (69.9%) |
| Enterprise Management | 0 (0.0%) | 7 (100.0%) |
| Administrative & Support | 57 (64.8%) | 31 (35.2%) |
| Educational Services | 130 (22.9%) | 439 (77.1%) |
| Health Care & Social Assistance | 130 (14.3%) | 778 (85.7%) |
| Arts, Entertainment & Recreation | 39 (68.4%) | 18 (31.6%) |
| Accommodation & Food Services | 93 (45.4%) | 112 (54.6%) |
| Public Administration | 76 (31.8%) | 163 (68.2%) |
| Total | 3,251 (55.6%) | 2,594 (44.4%) |
Education in Lyon County
School Enrollment in Lyon County
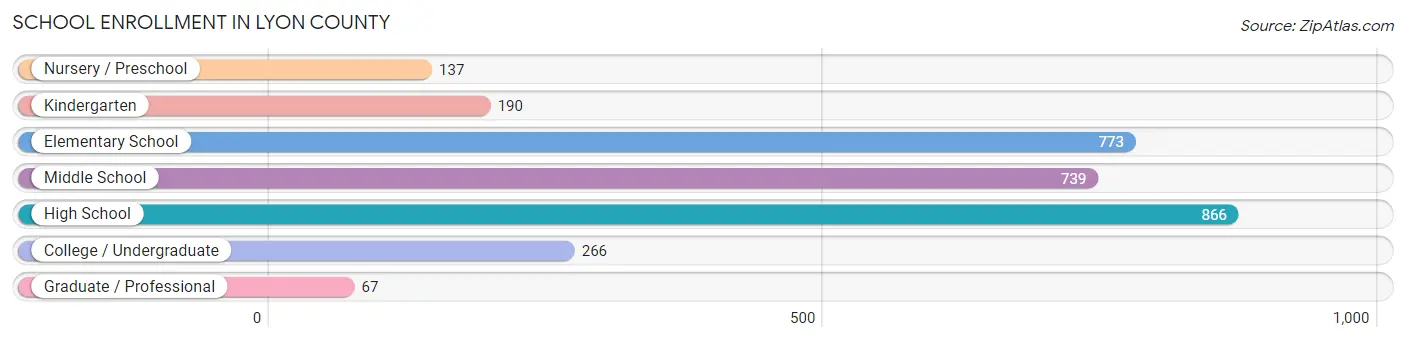
The most common levels of schooling among the 3,038 students in Lyon County are high school (866 | 28.5%), elementary school (773 | 25.4%), and middle school (739 | 24.3%).
| School Level | # Students | % Students |
| Nursery / Preschool | 137 | 4.5% |
| Kindergarten | 190 | 6.2% |
| Elementary School | 773 | 25.4% |
| Middle School | 739 | 24.3% |
| High School | 866 | 28.5% |
| College / Undergraduate | 266 | 8.8% |
| Graduate / Professional | 67 | 2.2% |
| Total | 3,038 | 100.0% |
School Enrollment by Age by Funding Source in Lyon County
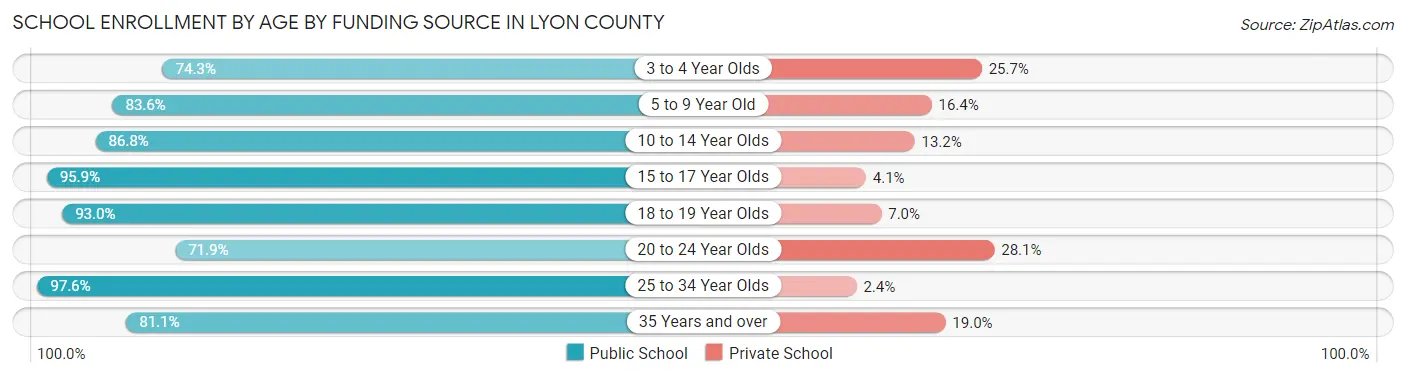
Out of a total of 3,038 students who are enrolled in schools in Lyon County, 401 (13.2%) attend a private institution, while the remaining 2,637 (86.8%) are enrolled in public schools. The age group of 20 to 24 year olds has the highest likelihood of being enrolled in private schools, with 55 (28.1% in the age bracket) enrolled. Conversely, the age group of 25 to 34 year olds has the lowest likelihood of being enrolled in a private school, with 41 (97.6% in the age bracket) attending a public institution.
| Age Bracket | Public School | Private School |
| 3 to 4 Year Olds | 52 (74.3%) | 18 (25.7%) |
| 5 to 9 Year Old | 751 (83.6%) | 147 (16.4%) |
| 10 to 14 Year Olds | 796 (86.8%) | 121 (13.2%) |
| 15 to 17 Year Olds | 581 (95.9%) | 25 (4.1%) |
| 18 to 19 Year Olds | 199 (93.0%) | 15 (7.0%) |
| 20 to 24 Year Olds | 141 (71.9%) | 55 (28.1%) |
| 25 to 34 Year Olds | 41 (97.6%) | 1 (2.4%) |
| 35 Years and over | 77 (81.0%) | 18 (19.0%) |
| Total | 2,637 (86.8%) | 401 (13.2%) |
Educational Attainment by Field of Study in Lyon County
Education (454 | 28.5%), business (259 | 16.3%), science & technology (243 | 15.3%), bio, nature & agricultural (143 | 9.0%), and arts & humanities (138 | 8.7%) are the most common fields of study among 1,590 individuals in Lyon County who have obtained a bachelor's degree or higher.
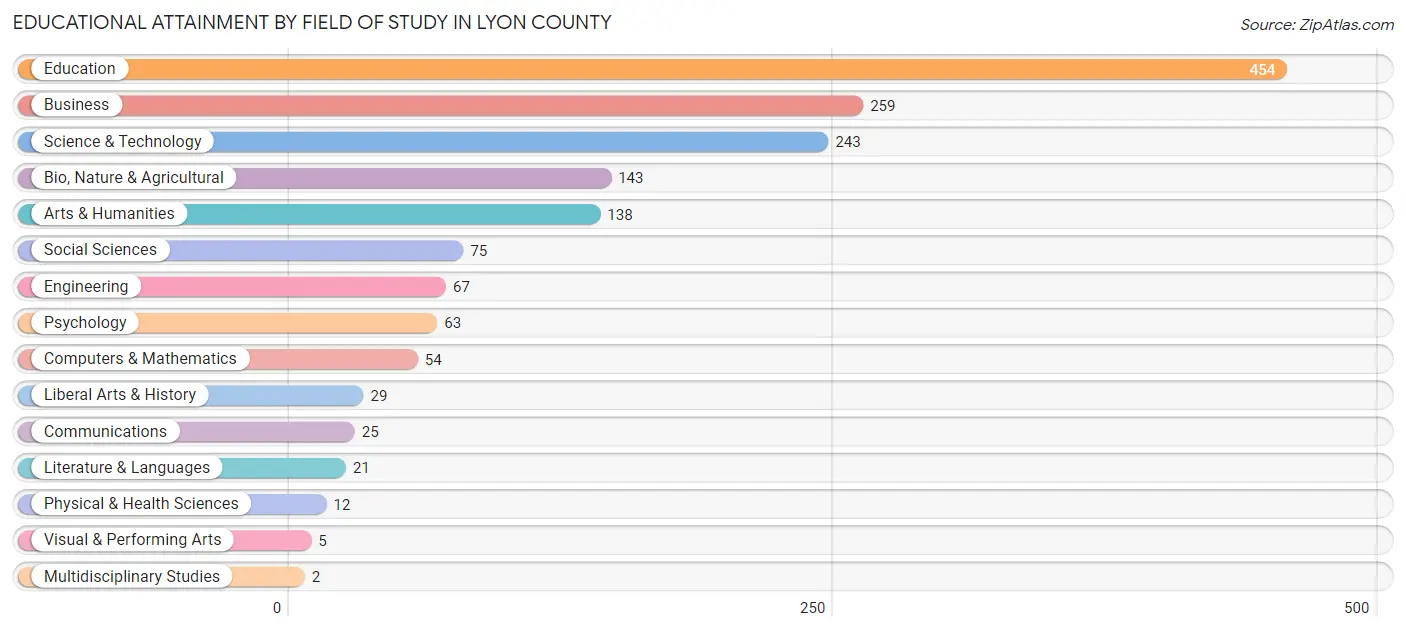
| Field of Study | # Graduates | % Graduates |
| Computers & Mathematics | 54 | 3.4% |
| Bio, Nature & Agricultural | 143 | 9.0% |
| Physical & Health Sciences | 12 | 0.7% |
| Psychology | 63 | 4.0% |
| Social Sciences | 75 | 4.7% |
| Engineering | 67 | 4.2% |
| Multidisciplinary Studies | 2 | 0.1% |
| Science & Technology | 243 | 15.3% |
| Business | 259 | 16.3% |
| Education | 454 | 28.5% |
| Literature & Languages | 21 | 1.3% |
| Liberal Arts & History | 29 | 1.8% |
| Visual & Performing Arts | 5 | 0.3% |
| Communications | 25 | 1.6% |
| Arts & Humanities | 138 | 8.7% |
| Total | 1,590 | 100.0% |
Transportation & Commute in Lyon County
Vehicle Availability by Sex in Lyon County
The most prevalent vehicle ownership categories in Lyon County are males with 2 vehicles (1,123, accounting for 34.6%) and females with 2 vehicles (765, making up 44.1%).
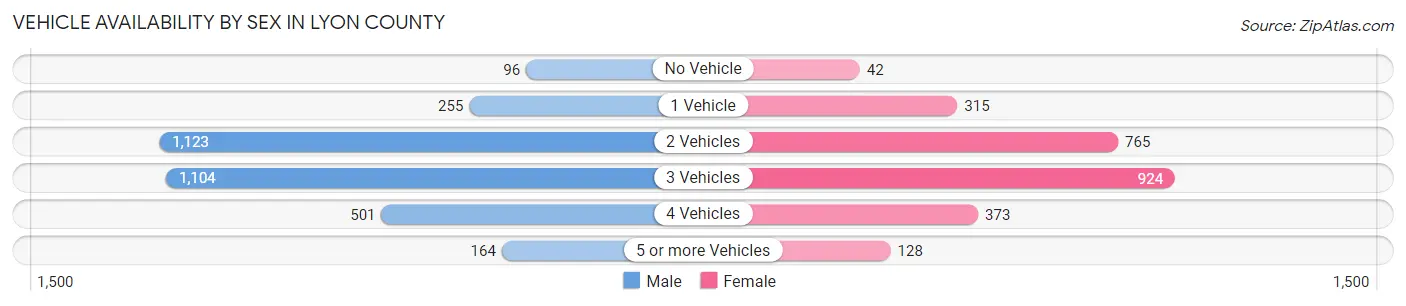
| Vehicles Available | Male | Female |
| No Vehicle | 96 (3.0%) | 42 (1.7%) |
| 1 Vehicle | 255 (7.9%) | 315 (12.4%) |
| 2 Vehicles | 1,123 (34.6%) | 765 (30.0%) |
| 3 Vehicles | 1,104 (34.0%) | 924 (36.3%) |
| 4 Vehicles | 501 (15.4%) | 373 (14.6%) |
| 5 or more Vehicles | 164 (5.1%) | 128 (5.0%) |
| Total | 3,243 (100.0%) | 2,547 (100.0%) |
Commute Time in Lyon County
The most frequently occuring commute durations in Lyon County are 5 to 9 minutes (1,016 commuters, 19.6%), less than 5 minutes (787 commuters, 15.2%), and 20 to 24 minutes (740 commuters, 14.3%).
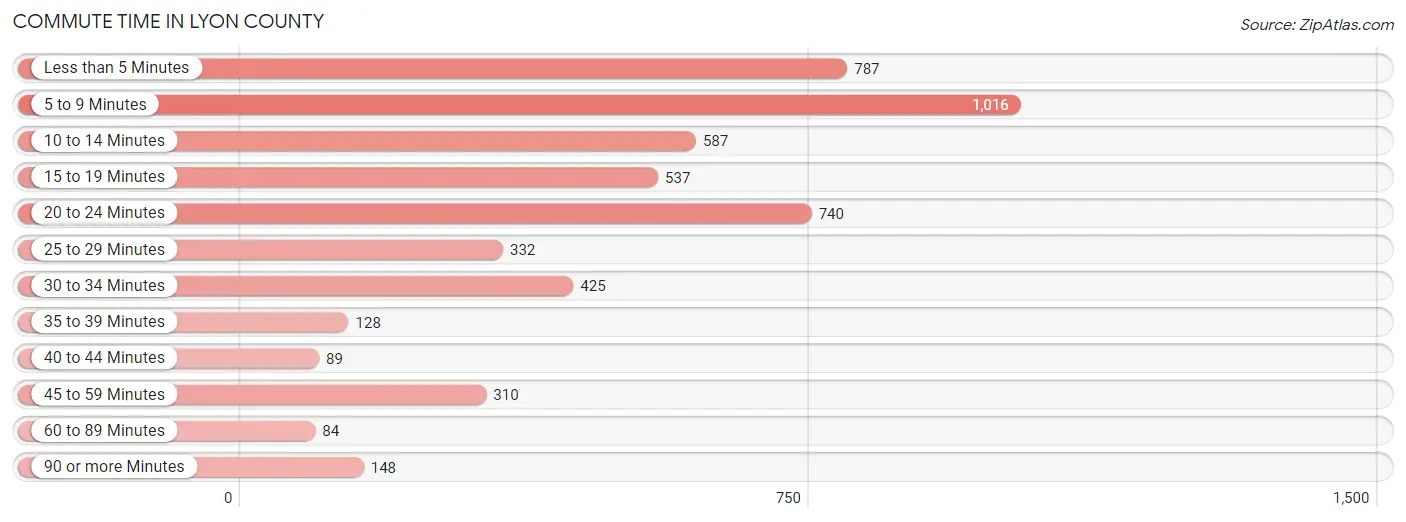
| Commute Time | # Commuters | % Commuters |
| Less than 5 Minutes | 787 | 15.2% |
| 5 to 9 Minutes | 1,016 | 19.6% |
| 10 to 14 Minutes | 587 | 11.3% |
| 15 to 19 Minutes | 537 | 10.4% |
| 20 to 24 Minutes | 740 | 14.3% |
| 25 to 29 Minutes | 332 | 6.4% |
| 30 to 34 Minutes | 425 | 8.2% |
| 35 to 39 Minutes | 128 | 2.5% |
| 40 to 44 Minutes | 89 | 1.7% |
| 45 to 59 Minutes | 310 | 6.0% |
| 60 to 89 Minutes | 84 | 1.6% |
| 90 or more Minutes | 148 | 2.9% |
Commute Time by Sex in Lyon County
The most common commute times in Lyon County are 5 to 9 minutes (554 commuters, 19.2%) for males and 5 to 9 minutes (462 commuters, 20.2%) for females.
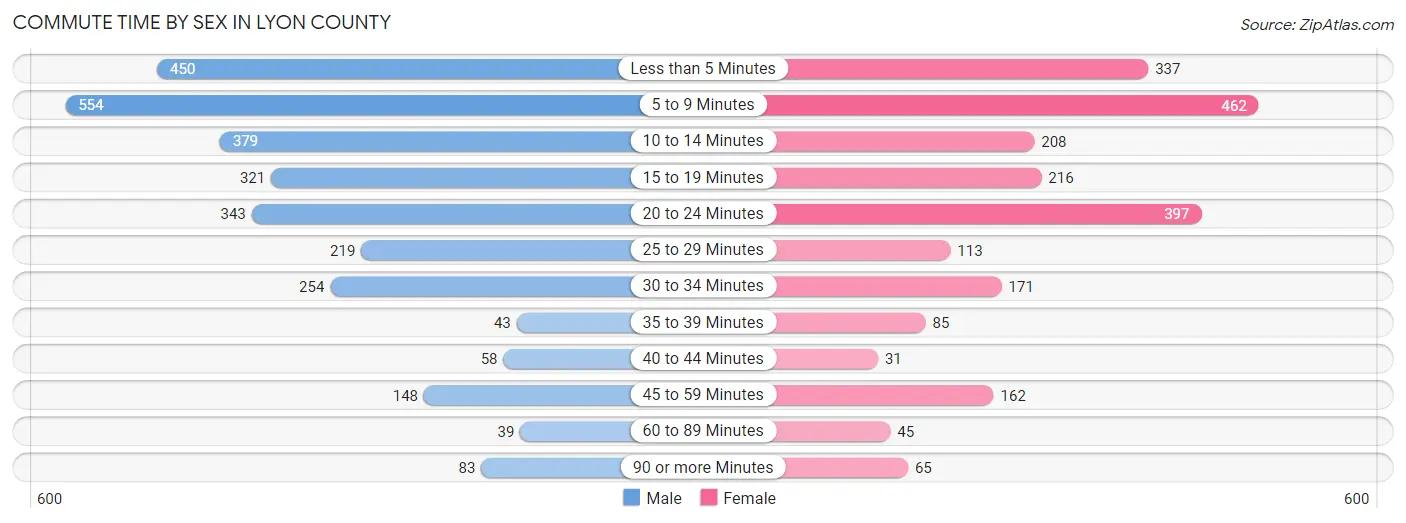
| Commute Time | Male | Female |
| Less than 5 Minutes | 450 (15.6%) | 337 (14.7%) |
| 5 to 9 Minutes | 554 (19.2%) | 462 (20.2%) |
| 10 to 14 Minutes | 379 (13.1%) | 208 (9.1%) |
| 15 to 19 Minutes | 321 (11.1%) | 216 (9.4%) |
| 20 to 24 Minutes | 343 (11.9%) | 397 (17.3%) |
| 25 to 29 Minutes | 219 (7.6%) | 113 (4.9%) |
| 30 to 34 Minutes | 254 (8.8%) | 171 (7.5%) |
| 35 to 39 Minutes | 43 (1.5%) | 85 (3.7%) |
| 40 to 44 Minutes | 58 (2.0%) | 31 (1.3%) |
| 45 to 59 Minutes | 148 (5.1%) | 162 (7.1%) |
| 60 to 89 Minutes | 39 (1.3%) | 45 (2.0%) |
| 90 or more Minutes | 83 (2.9%) | 65 (2.8%) |
Time of Departure to Work by Sex in Lyon County
The most frequent times of departure to work in Lyon County are 6:30 AM to 6:59 AM (628, 21.7%) for males and 7:30 AM to 7:59 AM (572, 25.0%) for females.
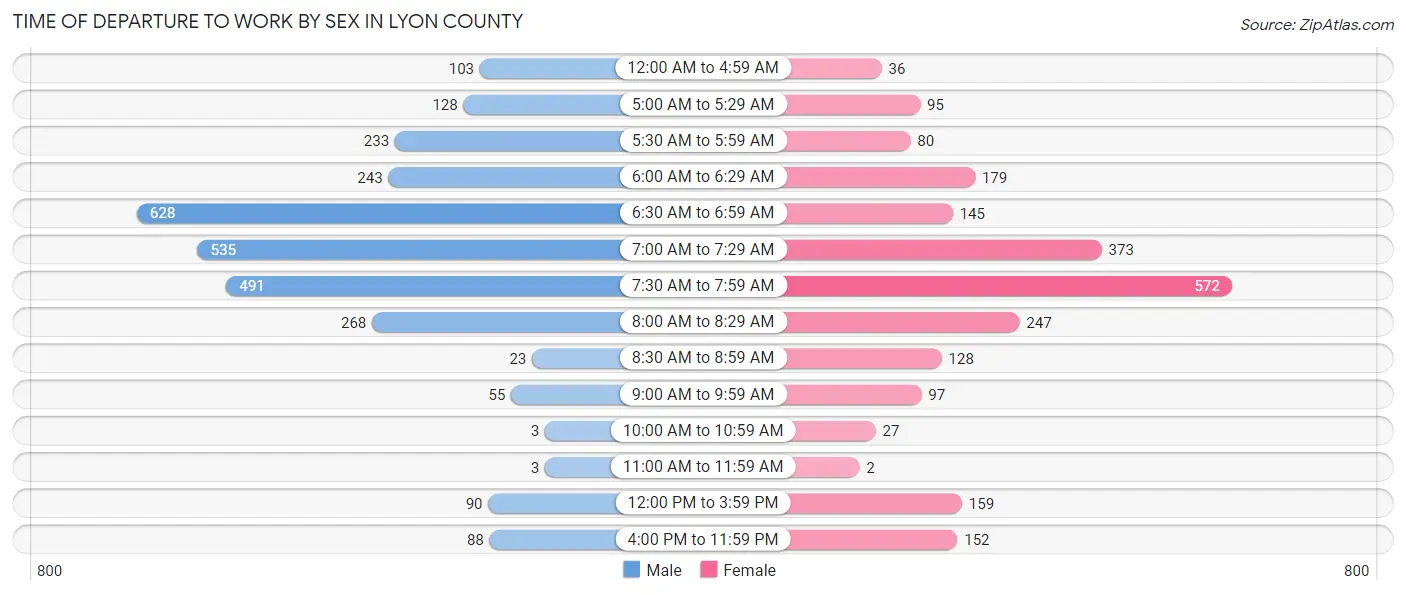
| Time of Departure | Male | Female |
| 12:00 AM to 4:59 AM | 103 (3.6%) | 36 (1.6%) |
| 5:00 AM to 5:29 AM | 128 (4.4%) | 95 (4.1%) |
| 5:30 AM to 5:59 AM | 233 (8.1%) | 80 (3.5%) |
| 6:00 AM to 6:29 AM | 243 (8.4%) | 179 (7.8%) |
| 6:30 AM to 6:59 AM | 628 (21.7%) | 145 (6.3%) |
| 7:00 AM to 7:29 AM | 535 (18.5%) | 373 (16.3%) |
| 7:30 AM to 7:59 AM | 491 (17.0%) | 572 (25.0%) |
| 8:00 AM to 8:29 AM | 268 (9.3%) | 247 (10.8%) |
| 8:30 AM to 8:59 AM | 23 (0.8%) | 128 (5.6%) |
| 9:00 AM to 9:59 AM | 55 (1.9%) | 97 (4.2%) |
| 10:00 AM to 10:59 AM | 3 (0.1%) | 27 (1.2%) |
| 11:00 AM to 11:59 AM | 3 (0.1%) | 2 (0.1%) |
| 12:00 PM to 3:59 PM | 90 (3.1%) | 159 (6.9%) |
| 4:00 PM to 11:59 PM | 88 (3.0%) | 152 (6.6%) |
| Total | 2,891 (100.0%) | 2,292 (100.0%) |
Housing Occupancy in Lyon County
Occupancy by Ownership in Lyon County
Of the total 4,412 dwellings in Lyon County, owner-occupied units account for 3,700 (83.9%), while renter-occupied units make up 712 (16.1%).
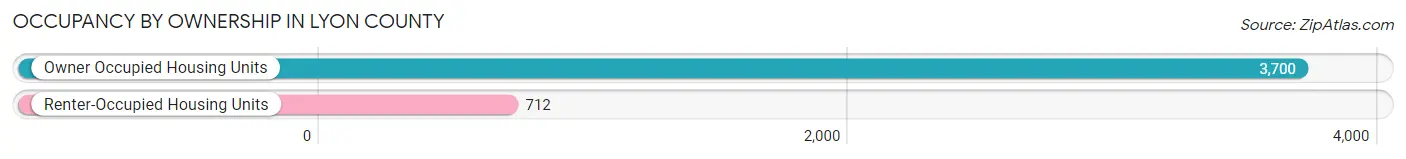
| Occupancy | # Housing Units | % Housing Units |
| Owner Occupied Housing Units | 3,700 | 83.9% |
| Renter-Occupied Housing Units | 712 | 16.1% |
| Total Occupied Housing Units | 4,412 | 100.0% |
Occupancy by Household Size in Lyon County
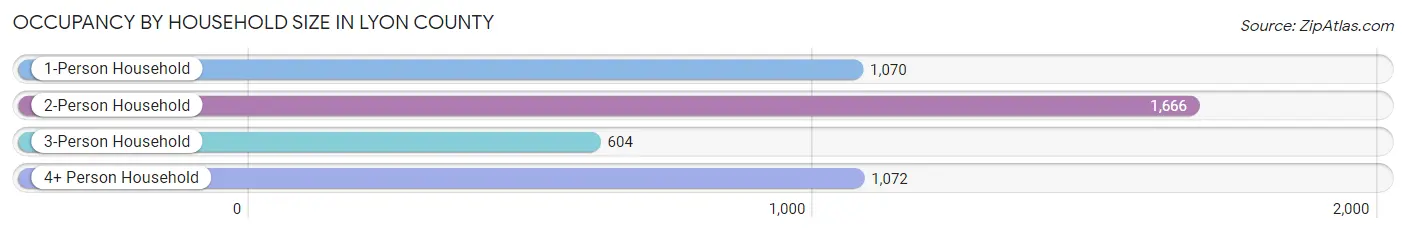
| Household Size | # Housing Units | % Housing Units |
| 1-Person Household | 1,070 | 24.2% |
| 2-Person Household | 1,666 | 37.8% |
| 3-Person Household | 604 | 13.7% |
| 4+ Person Household | 1,072 | 24.3% |
| Total Housing Units | 4,412 | 100.0% |
Occupancy by Ownership by Household Size in Lyon County

| Household Size | Owner-occupied | Renter-occupied |
| 1-Person Household | 762 (71.2%) | 308 (28.8%) |
| 2-Person Household | 1,459 (87.6%) | 207 (12.4%) |
| 3-Person Household | 500 (82.8%) | 104 (17.2%) |
| 4+ Person Household | 979 (91.3%) | 93 (8.7%) |
| Total Housing Units | 3,700 (83.9%) | 712 (16.1%) |
Occupancy by Educational Attainment in Lyon County
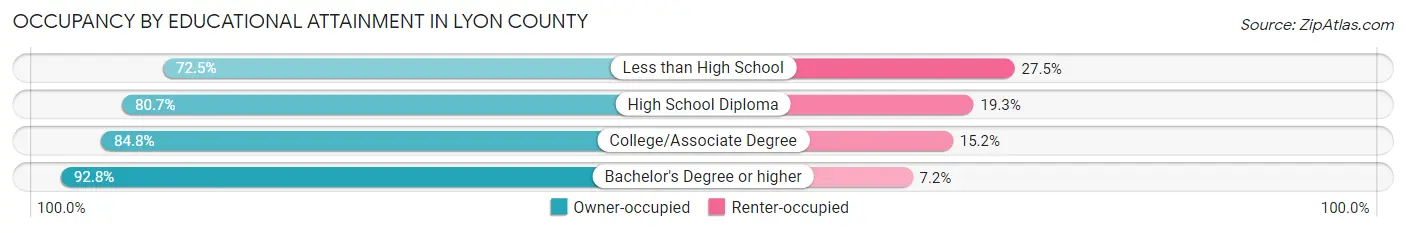
| Household Size | Owner-occupied | Renter-occupied |
| Less than High School | 177 (72.5%) | 67 (27.5%) |
| High School Diploma | 1,487 (80.7%) | 356 (19.3%) |
| College/Associate Degree | 1,290 (84.8%) | 231 (15.2%) |
| Bachelor's Degree or higher | 746 (92.8%) | 58 (7.2%) |
Occupancy by Age of Householder in Lyon County
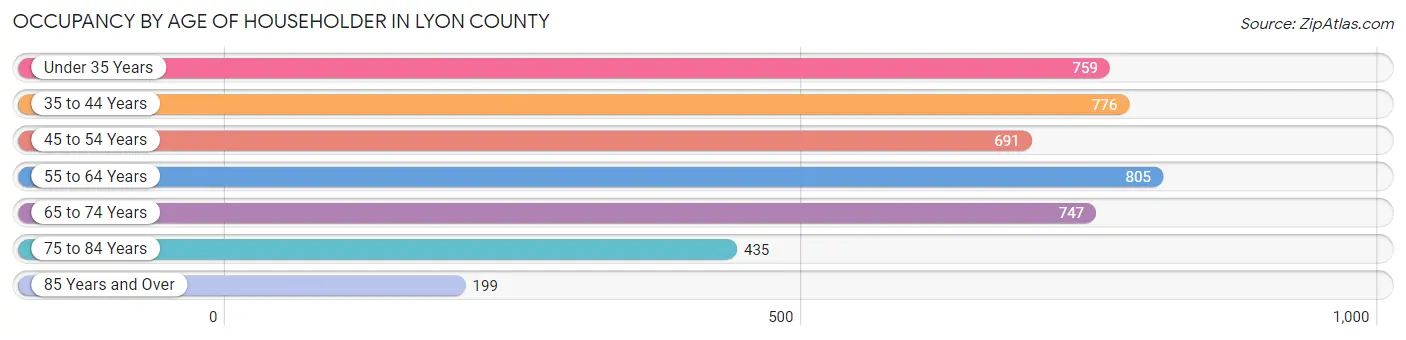
| Age Bracket | # Households | % Households |
| Under 35 Years | 759 | 17.2% |
| 35 to 44 Years | 776 | 17.6% |
| 45 to 54 Years | 691 | 15.7% |
| 55 to 64 Years | 805 | 18.2% |
| 65 to 74 Years | 747 | 16.9% |
| 75 to 84 Years | 435 | 9.9% |
| 85 Years and Over | 199 | 4.5% |
| Total | 4,412 | 100.0% |
Housing Finances in Lyon County
Median Income by Occupancy in Lyon County
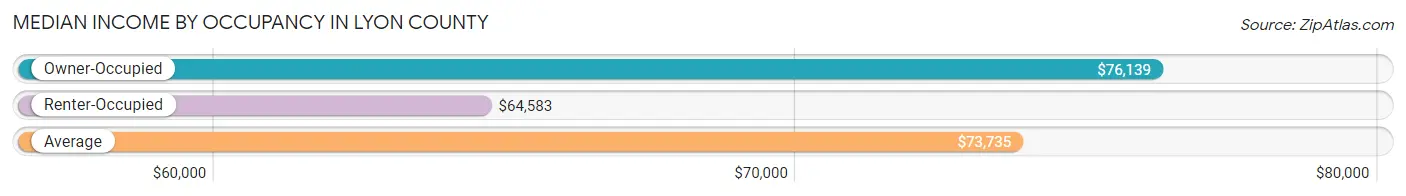
| Occupancy Type | # Households | Median Income |
| Owner-Occupied | 3,700 (83.9%) | $76,139 |
| Renter-Occupied | 712 (16.1%) | $64,583 |
| Average | 4,412 (100.0%) | $73,735 |
Occupancy by Householder Income Bracket in Lyon County

| Income Bracket | Owner-occupied | Renter-occupied |
| Less than $5,000 | 57 (1.5%) | 4 (0.6%) |
| $5,000 to $9,999 | 30 (0.8%) | 5 (0.7%) |
| $10,000 to $14,999 | 87 (2.4%) | 43 (6.0%) |
| $15,000 to $19,999 | 98 (2.6%) | 52 (7.3%) |
| $20,000 to $24,999 | 72 (1.9%) | 27 (3.8%) |
| $25,000 to $34,999 | 212 (5.7%) | 62 (8.7%) |
| $35,000 to $49,999 | 511 (13.8%) | 87 (12.2%) |
| $50,000 to $74,999 | 742 (20.1%) | 160 (22.5%) |
| $75,000 to $99,999 | 668 (18.0%) | 92 (12.9%) |
| $100,000 to $149,999 | 696 (18.8%) | 145 (20.4%) |
| $150,000 or more | 527 (14.2%) | 35 (4.9%) |
| Total | 3,700 (100.0%) | 712 (100.0%) |
Monthly Housing Cost Tiers in Lyon County
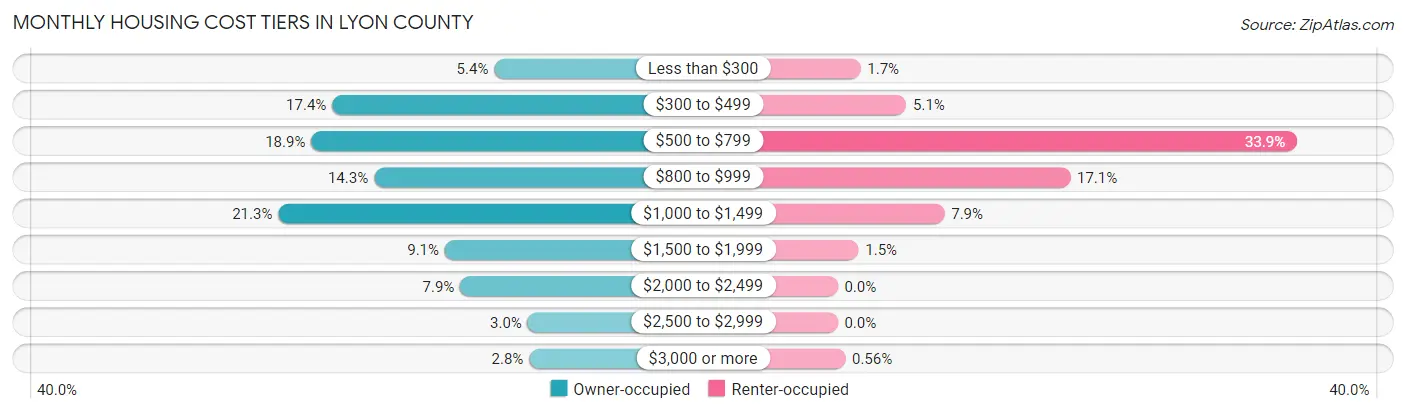
| Monthly Cost | Owner-occupied | Renter-occupied |
| Less than $300 | 200 (5.4%) | 12 (1.7%) |
| $300 to $499 | 642 (17.3%) | 36 (5.1%) |
| $500 to $799 | 699 (18.9%) | 241 (33.9%) |
| $800 to $999 | 528 (14.3%) | 122 (17.1%) |
| $1,000 to $1,499 | 789 (21.3%) | 56 (7.9%) |
| $1,500 to $1,999 | 335 (9.0%) | 11 (1.5%) |
| $2,000 to $2,499 | 293 (7.9%) | 0 (0.0%) |
| $2,500 to $2,999 | 109 (2.9%) | 0 (0.0%) |
| $3,000 or more | 105 (2.8%) | 4 (0.6%) |
| Total | 3,700 (100.0%) | 712 (100.0%) |
Physical Housing Characteristics in Lyon County
Housing Structures in Lyon County
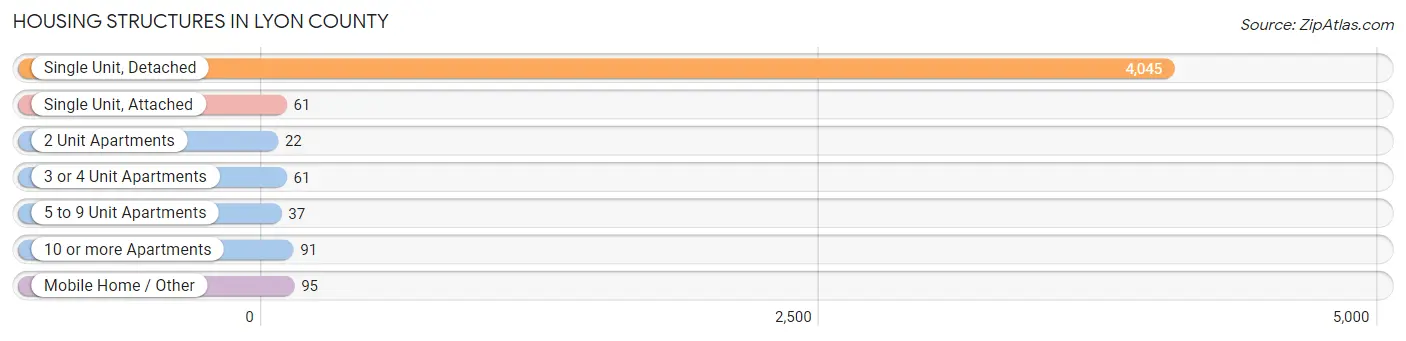
| Structure Type | # Housing Units | % Housing Units |
| Single Unit, Detached | 4,045 | 91.7% |
| Single Unit, Attached | 61 | 1.4% |
| 2 Unit Apartments | 22 | 0.5% |
| 3 or 4 Unit Apartments | 61 | 1.4% |
| 5 to 9 Unit Apartments | 37 | 0.8% |
| 10 or more Apartments | 91 | 2.1% |
| Mobile Home / Other | 95 | 2.1% |
| Total | 4,412 | 100.0% |
Housing Structures by Occupancy in Lyon County

| Structure Type | Owner-occupied | Renter-occupied |
| Single Unit, Detached | 3,559 (88.0%) | 486 (12.0%) |
| Single Unit, Attached | 38 (62.3%) | 23 (37.7%) |
| 2 Unit Apartments | 0 (0.0%) | 22 (100.0%) |
| 3 or 4 Unit Apartments | 8 (13.1%) | 53 (86.9%) |
| 5 to 9 Unit Apartments | 5 (13.5%) | 32 (86.5%) |
| 10 or more Apartments | 15 (16.5%) | 76 (83.5%) |
| Mobile Home / Other | 75 (78.9%) | 20 (21.0%) |
| Total | 3,700 (83.9%) | 712 (16.1%) |
Housing Structures by Number of Rooms in Lyon County
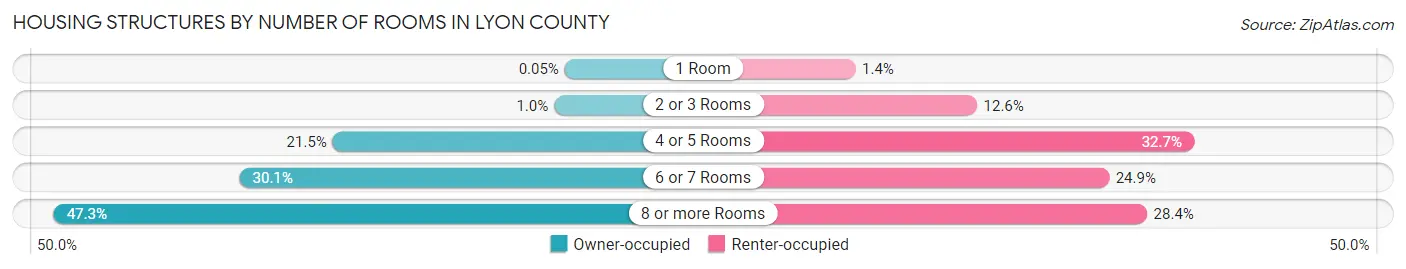
| Number of Rooms | Owner-occupied | Renter-occupied |
| 1 Room | 2 (0.1%) | 10 (1.4%) |
| 2 or 3 Rooms | 38 (1.0%) | 90 (12.6%) |
| 4 or 5 Rooms | 796 (21.5%) | 233 (32.7%) |
| 6 or 7 Rooms | 1,114 (30.1%) | 177 (24.9%) |
| 8 or more Rooms | 1,750 (47.3%) | 202 (28.4%) |
| Total | 3,700 (100.0%) | 712 (100.0%) |
Housing Structure by Heating Type in Lyon County
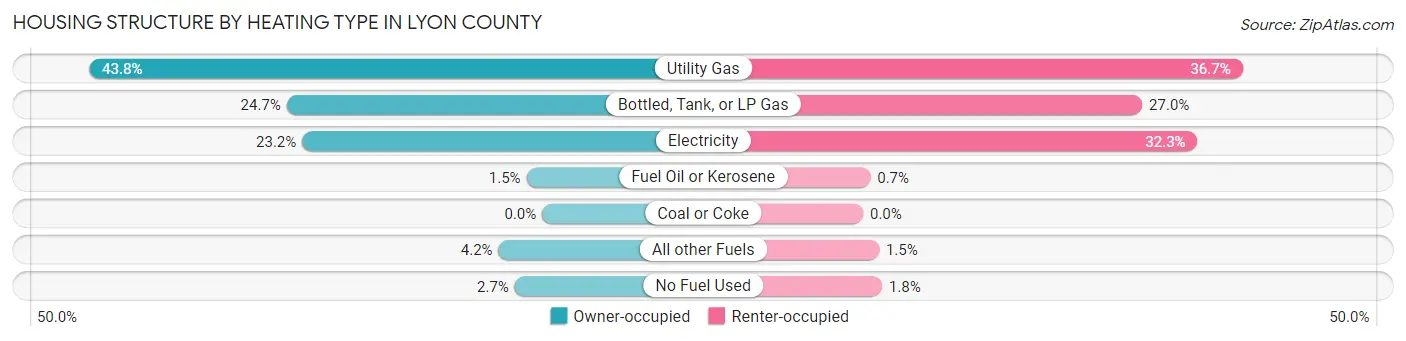
| Heating Type | Owner-occupied | Renter-occupied |
| Utility Gas | 1,619 (43.8%) | 261 (36.7%) |
| Bottled, Tank, or LP Gas | 913 (24.7%) | 192 (27.0%) |
| Electricity | 858 (23.2%) | 230 (32.3%) |
| Fuel Oil or Kerosene | 56 (1.5%) | 5 (0.7%) |
| Coal or Coke | 0 (0.0%) | 0 (0.0%) |
| All other Fuels | 156 (4.2%) | 11 (1.5%) |
| No Fuel Used | 98 (2.6%) | 13 (1.8%) |
| Total | 3,700 (100.0%) | 712 (100.0%) |
Household Vehicle Usage in Lyon County
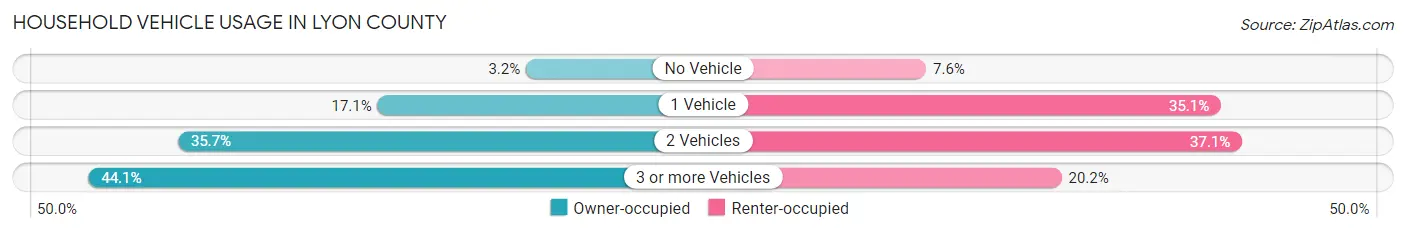
| Vehicles per Household | Owner-occupied | Renter-occupied |
| No Vehicle | 118 (3.2%) | 54 (7.6%) |
| 1 Vehicle | 631 (17.1%) | 250 (35.1%) |
| 2 Vehicles | 1,321 (35.7%) | 264 (37.1%) |
| 3 or more Vehicles | 1,630 (44.1%) | 144 (20.2%) |
| Total | 3,700 (100.0%) | 712 (100.0%) |
Real Estate & Mortgages in Lyon County
Real Estate and Mortgage Overview in Lyon County
| Characteristic | Without Mortgage | With Mortgage |
| Housing Units | 1,582 | 2,118 |
| Median Property Value | $165,400 | $209,600 |
| Median Household Income | $62,358 | $382 |
| Monthly Housing Costs | $493 | $105 |
| Real Estate Taxes | $1,760 | $43 |
Property Value by Mortgage Status in Lyon County
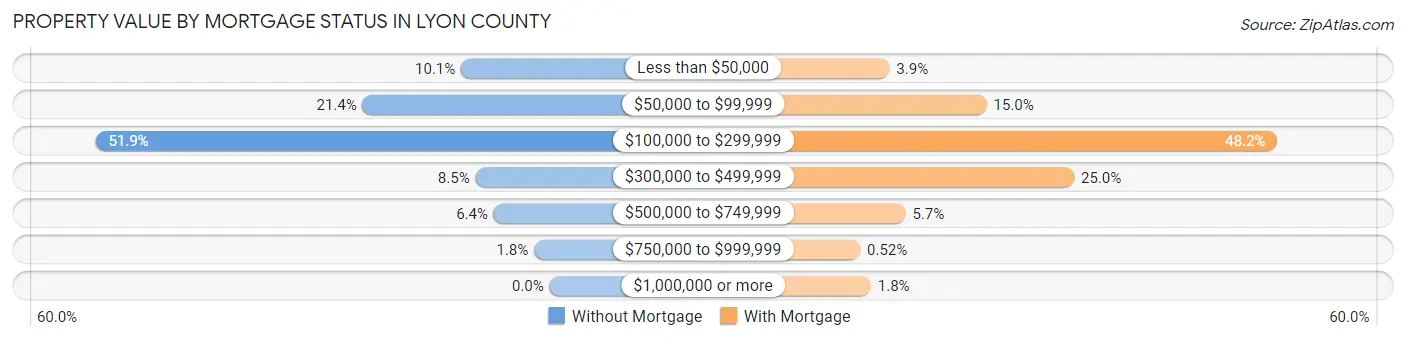
| Property Value | Without Mortgage | With Mortgage |
| Less than $50,000 | 160 (10.1%) | 82 (3.9%) |
| $50,000 to $99,999 | 338 (21.4%) | 317 (15.0%) |
| $100,000 to $299,999 | 821 (51.9%) | 1,021 (48.2%) |
| $300,000 to $499,999 | 134 (8.5%) | 529 (25.0%) |
| $500,000 to $749,999 | 101 (6.4%) | 121 (5.7%) |
| $750,000 to $999,999 | 28 (1.8%) | 11 (0.5%) |
| $1,000,000 or more | 0 (0.0%) | 37 (1.8%) |
| Total | 1,582 (100.0%) | 2,118 (100.0%) |
Household Income by Mortgage Status in Lyon County
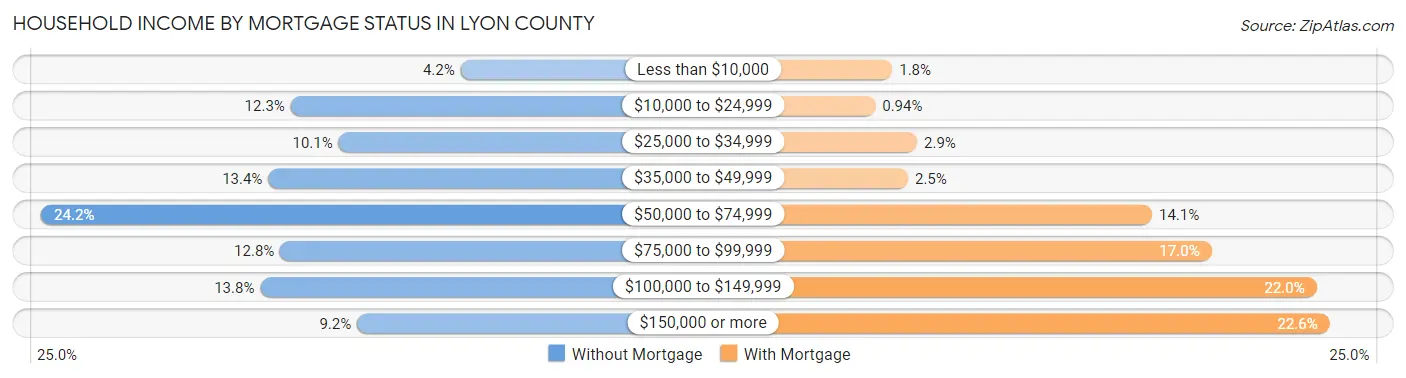
| Household Income | Without Mortgage | With Mortgage |
| Less than $10,000 | 67 (4.2%) | 37 (1.8%) |
| $10,000 to $24,999 | 195 (12.3%) | 20 (0.9%) |
| $25,000 to $34,999 | 159 (10.1%) | 62 (2.9%) |
| $35,000 to $49,999 | 212 (13.4%) | 53 (2.5%) |
| $50,000 to $74,999 | 383 (24.2%) | 299 (14.1%) |
| $75,000 to $99,999 | 203 (12.8%) | 359 (17.0%) |
| $100,000 to $149,999 | 218 (13.8%) | 465 (22.0%) |
| $150,000 or more | 145 (9.2%) | 478 (22.6%) |
| Total | 1,582 (100.0%) | 2,118 (100.0%) |
Property Value to Household Income Ratio in Lyon County
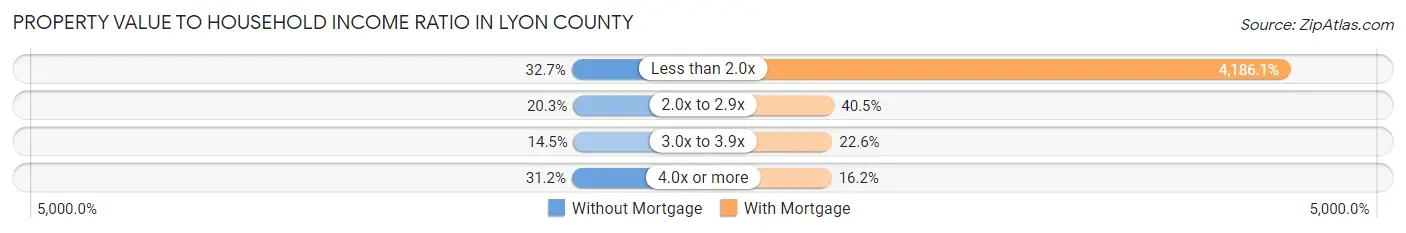
| Value-to-Income Ratio | Without Mortgage | With Mortgage |
| Less than 2.0x | 518 (32.7%) | 88,661 (4,186.1%) |
| 2.0x to 2.9x | 321 (20.3%) | 857 (40.5%) |
| 3.0x to 3.9x | 230 (14.5%) | 478 (22.6%) |
| 4.0x or more | 494 (31.2%) | 343 (16.2%) |
| Total | 1,582 (100.0%) | 2,118 (100.0%) |
Real Estate Taxes by Mortgage Status in Lyon County
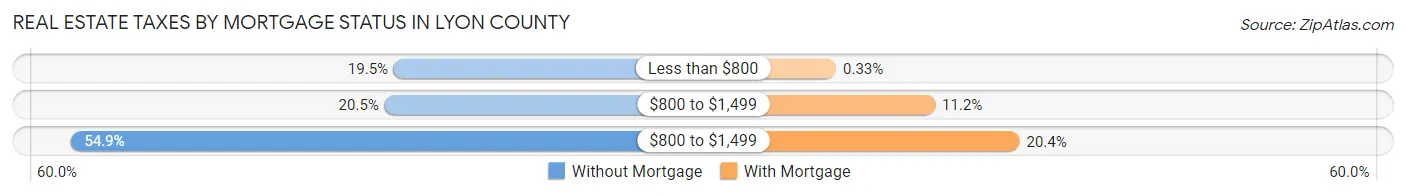
| Property Taxes | Without Mortgage | With Mortgage |
| Less than $800 | 309 (19.5%) | 7 (0.3%) |
| $800 to $1,499 | 325 (20.5%) | 237 (11.2%) |
| $800 to $1,499 | 868 (54.9%) | 433 (20.4%) |
| Total | 1,582 (100.0%) | 2,118 (100.0%) |
Health & Disability in Lyon County
Health Insurance Coverage by Age in Lyon County
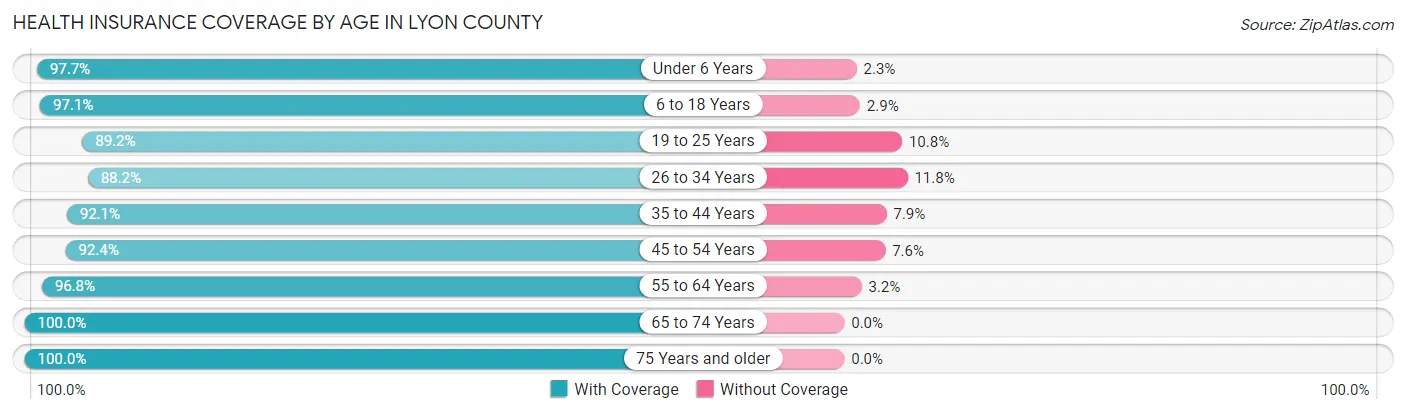
| Age Bracket | With Coverage | Without Coverage |
| Under 6 Years | 975 (97.7%) | 23 (2.3%) |
| 6 to 18 Years | 2,538 (97.1%) | 76 (2.9%) |
| 19 to 25 Years | 713 (89.2%) | 86 (10.8%) |
| 26 to 34 Years | 959 (88.2%) | 128 (11.8%) |
| 35 to 44 Years | 1,392 (92.1%) | 119 (7.9%) |
| 45 to 54 Years | 1,126 (92.4%) | 93 (7.6%) |
| 55 to 64 Years | 1,417 (96.8%) | 47 (3.2%) |
| 65 to 74 Years | 1,200 (100.0%) | 0 (0.0%) |
| 75 Years and older | 945 (100.0%) | 0 (0.0%) |
| Total | 11,265 (95.2%) | 572 (4.8%) |
Health Insurance Coverage by Citizenship Status in Lyon County

| Citizenship Status | With Coverage | Without Coverage |
| Native Born | 975 (97.7%) | 23 (2.3%) |
| Foreign Born, Citizen | 2,538 (97.1%) | 76 (2.9%) |
| Foreign Born, not a Citizen | 713 (89.2%) | 86 (10.8%) |
Health Insurance Coverage by Household Income in Lyon County
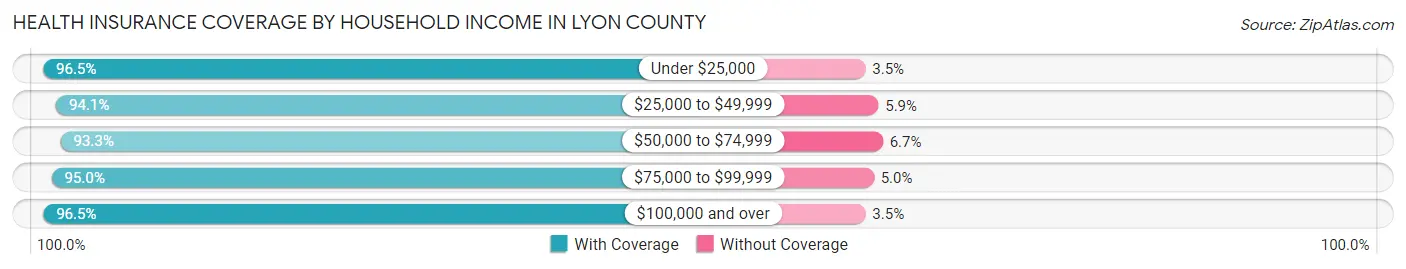
| Household Income | With Coverage | Without Coverage |
| Under $25,000 | 639 (96.5%) | 23 (3.5%) |
| $25,000 to $49,999 | 1,721 (94.1%) | 108 (5.9%) |
| $50,000 to $74,999 | 2,233 (93.3%) | 161 (6.7%) |
| $75,000 to $99,999 | 2,301 (95.0%) | 122 (5.0%) |
| $100,000 and over | 4,369 (96.5%) | 158 (3.5%) |
Public vs Private Health Insurance Coverage by Age in Lyon County
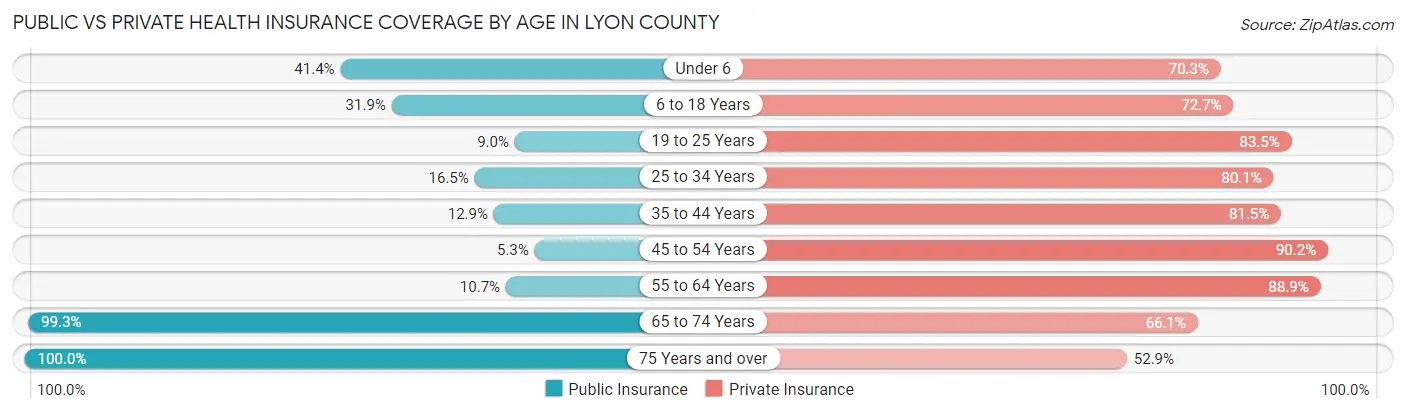
| Age Bracket | Public Insurance | Private Insurance |
| Under 6 | 413 (41.4%) | 702 (70.3%) |
| 6 to 18 Years | 833 (31.9%) | 1,900 (72.7%) |
| 19 to 25 Years | 72 (9.0%) | 667 (83.5%) |
| 25 to 34 Years | 179 (16.5%) | 871 (80.1%) |
| 35 to 44 Years | 195 (12.9%) | 1,232 (81.5%) |
| 45 to 54 Years | 65 (5.3%) | 1,100 (90.2%) |
| 55 to 64 Years | 156 (10.7%) | 1,301 (88.9%) |
| 65 to 74 Years | 1,192 (99.3%) | 793 (66.1%) |
| 75 Years and over | 945 (100.0%) | 500 (52.9%) |
| Total | 4,050 (34.2%) | 9,066 (76.6%) |
Disability Status by Sex by Age in Lyon County
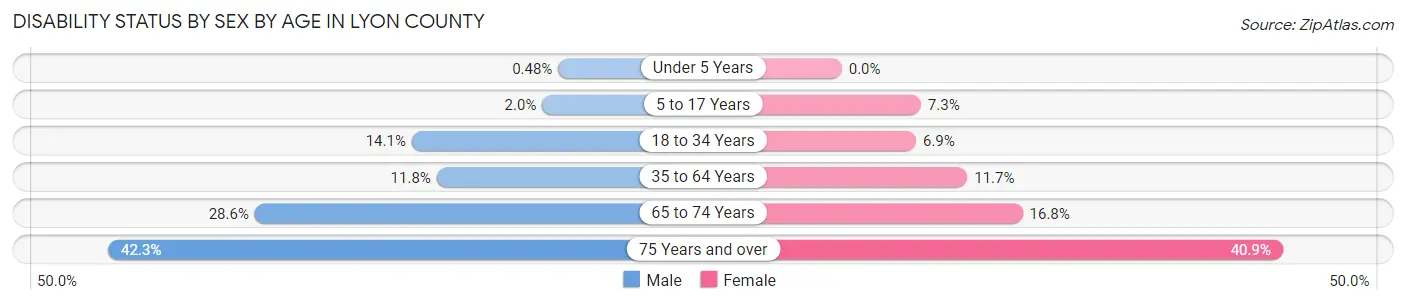
| Age Bracket | Male | Female |
| Under 5 Years | 2 (0.5%) | 0 (0.0%) |
| 5 to 17 Years | 27 (2.0%) | 85 (7.3%) |
| 18 to 34 Years | 159 (14.1%) | 68 (6.9%) |
| 35 to 64 Years | 257 (11.8%) | 234 (11.7%) |
| 65 to 74 Years | 173 (28.6%) | 100 (16.8%) |
| 75 Years and over | 169 (42.2%) | 223 (40.9%) |
Disability Class by Sex by Age in Lyon County
Disability Class: Hearing Difficulty
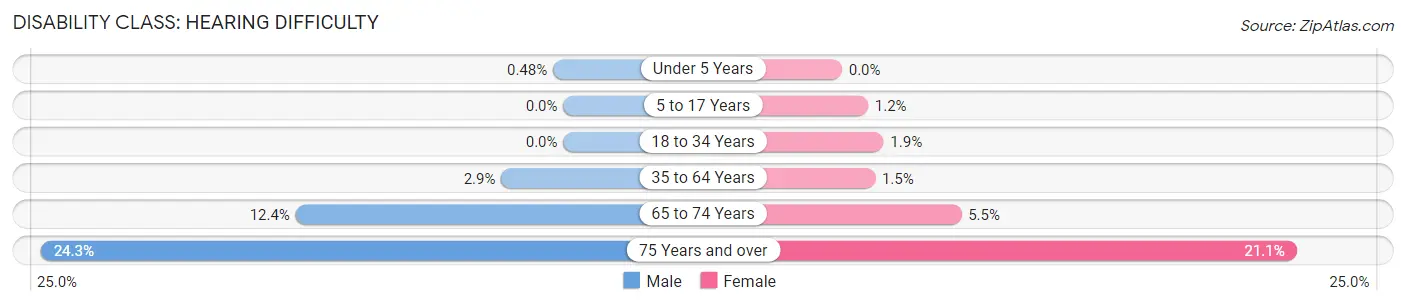
| Age Bracket | Male | Female |
| Under 5 Years | 2 (0.5%) | 0 (0.0%) |
| 5 to 17 Years | 0 (0.0%) | 14 (1.2%) |
| 18 to 34 Years | 0 (0.0%) | 19 (1.9%) |
| 35 to 64 Years | 63 (2.9%) | 31 (1.5%) |
| 65 to 74 Years | 75 (12.4%) | 33 (5.5%) |
| 75 Years and over | 97 (24.2%) | 115 (21.1%) |
Disability Class: Vision Difficulty
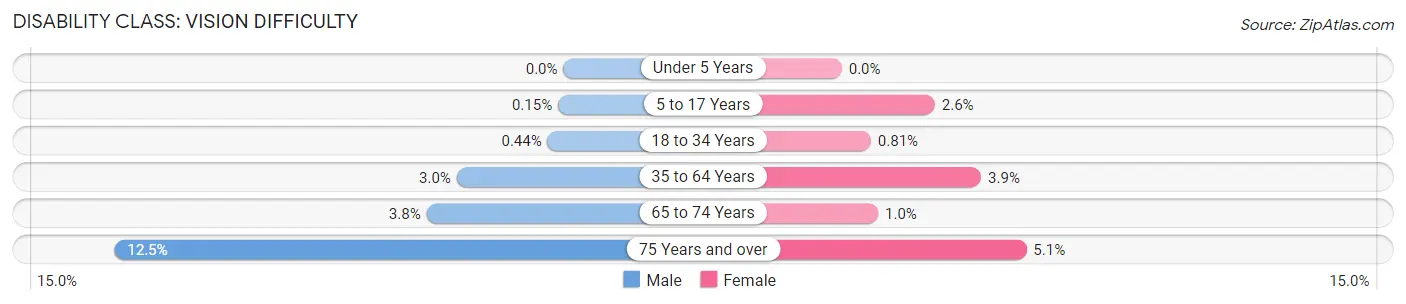
| Age Bracket | Male | Female |
| Under 5 Years | 0 (0.0%) | 0 (0.0%) |
| 5 to 17 Years | 2 (0.2%) | 30 (2.6%) |
| 18 to 34 Years | 5 (0.4%) | 8 (0.8%) |
| 35 to 64 Years | 65 (3.0%) | 78 (3.9%) |
| 65 to 74 Years | 23 (3.8%) | 6 (1.0%) |
| 75 Years and over | 50 (12.5%) | 28 (5.1%) |
Disability Class: Cognitive Difficulty
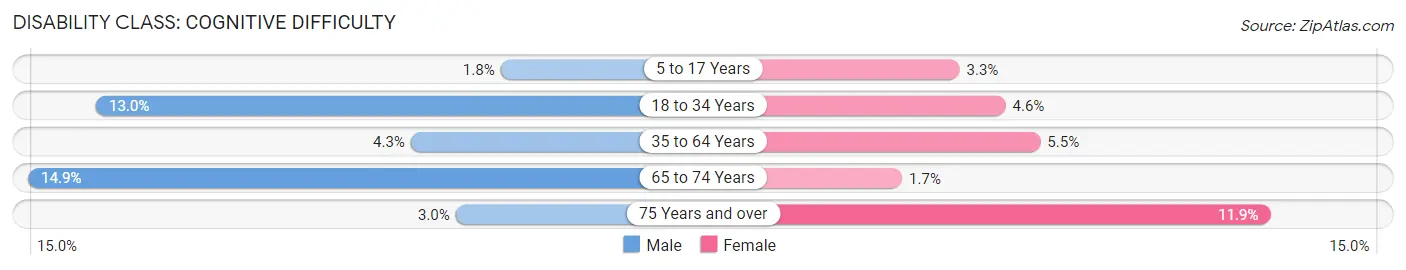
| Age Bracket | Male | Female |
| 5 to 17 Years | 24 (1.8%) | 38 (3.3%) |
| 18 to 34 Years | 147 (13.0%) | 45 (4.6%) |
| 35 to 64 Years | 93 (4.3%) | 111 (5.5%) |
| 65 to 74 Years | 90 (14.9%) | 10 (1.7%) |
| 75 Years and over | 12 (3.0%) | 65 (11.9%) |
Disability Class: Ambulatory Difficulty
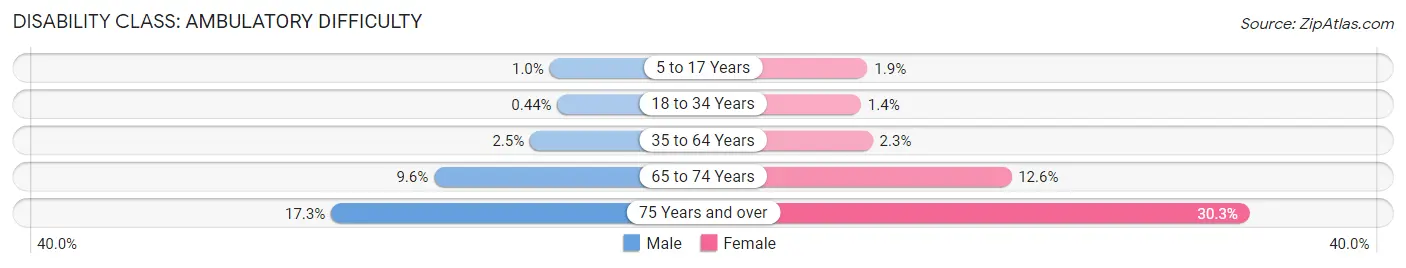
| Age Bracket | Male | Female |
| 5 to 17 Years | 14 (1.0%) | 22 (1.9%) |
| 18 to 34 Years | 5 (0.4%) | 14 (1.4%) |
| 35 to 64 Years | 54 (2.5%) | 46 (2.3%) |
| 65 to 74 Years | 58 (9.6%) | 75 (12.6%) |
| 75 Years and over | 69 (17.2%) | 165 (30.3%) |
Disability Class: Self-Care Difficulty
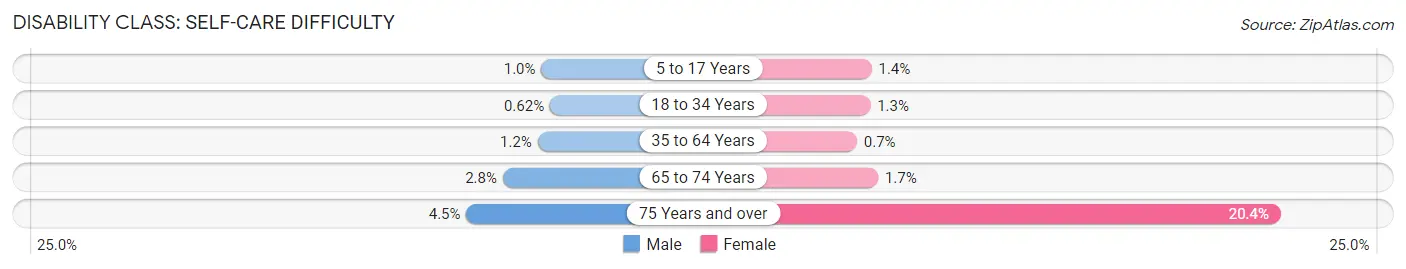
| Age Bracket | Male | Female |
| 5 to 17 Years | 14 (1.0%) | 16 (1.4%) |
| 18 to 34 Years | 7 (0.6%) | 13 (1.3%) |
| 35 to 64 Years | 26 (1.2%) | 14 (0.7%) |
| 65 to 74 Years | 17 (2.8%) | 10 (1.7%) |
| 75 Years and over | 18 (4.5%) | 111 (20.4%) |
Technology Access in Lyon County
Computing Device Access in Lyon County
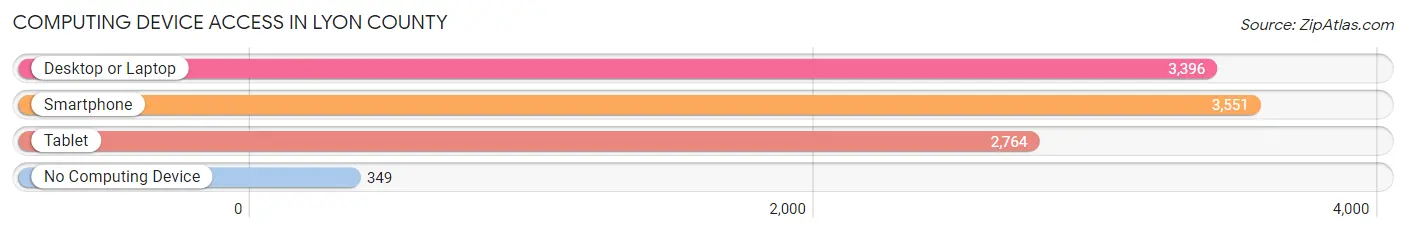
| Device Type | # Households | % Households |
| Desktop or Laptop | 3,396 | 77.0% |
| Smartphone | 3,551 | 80.5% |
| Tablet | 2,764 | 62.6% |
| No Computing Device | 349 | 7.9% |
| Total | 4,412 | 100.0% |
Internet Access in Lyon County
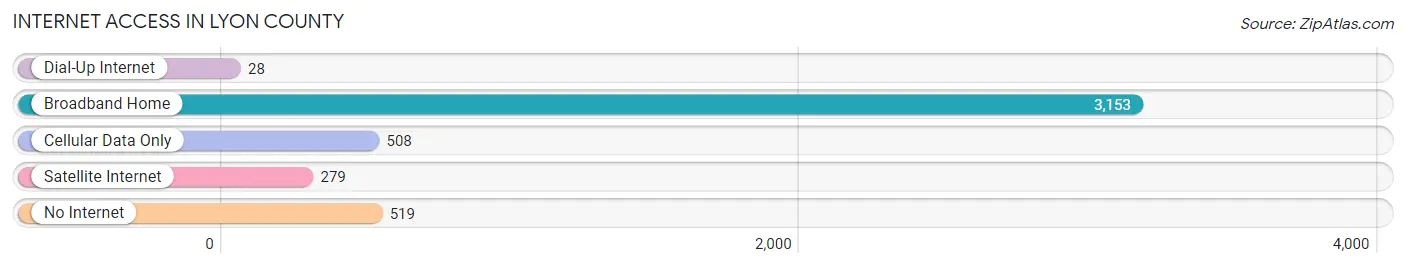
| Internet Type | # Households | % Households |
| Dial-Up Internet | 28 | 0.6% |
| Broadband Home | 3,153 | 71.5% |
| Cellular Data Only | 508 | 11.5% |
| Satellite Internet | 279 | 6.3% |
| No Internet | 519 | 11.8% |
| Total | 4,412 | 100.0% |
Lyon County Summary
Lyon County is located in the northwest corner of Iowa, and is bordered by Sioux, O’Brien, Osceola, and Sioux counties. The county seat is Rock Rapids, and the county was named after General Nathaniel Lyon, who was killed in the Civil War. The county has a total area of 576 square miles, and a population of 11,581 as of the 2010 census.
Geography
Lyon County is located in the northwest corner of Iowa, and is bordered by Sioux, O’Brien, Osceola, and Sioux counties. The county is mostly rural, with a few small towns and villages scattered throughout. The terrain is mostly flat, with some rolling hills in the northern part of the county. The Big Sioux River runs through the county, and there are several small lakes and ponds scattered throughout.
The county is divided into two distinct regions: the Big Sioux River Valley and the Loess Hills. The Big Sioux River Valley is a wide, flat plain that runs through the center of the county. The Loess Hills are a series of rolling hills that run along the western edge of the county.
History
Lyon County was established in 1851, and was named after General Nathaniel Lyon, who was killed in the Civil War. The county was originally part of Sioux County, but was split off in 1851. The county seat was originally located in Rock Rapids, but was moved to Larchwood in 1856. The county seat was moved back to Rock Rapids in 1868.
The county was largely agricultural in the early years, with most of the population living in small towns and villages. The county was also home to several Native American tribes, including the Sioux, Winnebago, and Omaha.
Economy
Lyon County’s economy is largely based on agriculture. The county is home to several large farms, and the majority of the population is employed in the agricultural sector. The county is also home to several small businesses, including manufacturing, retail, and service industries.
The county is also home to several large employers, including the Rock Rapids Municipal Airport, the Rock Rapids Municipal Hospital, and the Rock Rapids Municipal Library.
Demographics
As of the 2010 census, the population of Lyon County was 11,581. The racial makeup of the county was 95.3% White, 0.3% African American, 0.3% Native American, 0.3% Asian, 0.1% Pacific Islander, 2.3% from other races, and 1.6% from two or more races. Hispanic or Latino of any race were 4.2% of the population.
The median income for a household in the county was $45,945, and the median income for a family was $53,945. The per capita income for the county was $21,945. About 8.3% of families and 11.2% of the population were below the poverty line, including 14.2% of those under age 18 and 8.2% of those age 65 or over.
Common Questions
What is the Total Population of Lyon County?
Total Population of Lyon County is 12,023.
What is the Total Male Population of Lyon County?
Total Male Population of Lyon County is 6,161.
What is the Total Female Population of Lyon County?
Total Female Population of Lyon County is 5,862.
What is the Ratio of Males per 100 Females in Lyon County?
There are 105.10 Males per 100 Females in Lyon County.
What is the Ratio of Females per 100 Males in Lyon County?
There are 95.15 Females per 100 Males in Lyon County.
What is the Median Population Age in Lyon County?
Median Population Age in Lyon County is 38.3 Years.
What is the Average Family Size in Lyon County
Average Family Size in Lyon County is 3.3 People.
What is the Average Household Size in Lyon County
Average Household Size in Lyon County is 2.7 People.
What is Per Capita Income in Lyon County?
Per Capita income in Lyon County is $33,428.
What is the Median Family Income in Lyon County?
Median Family Income in Lyon County is $86,215.
What is the Median Household income in Lyon County?
Median Household Income in Lyon County is $73,735.
What is Income or Wage Gap in Lyon County?
Income or Wage Gap in Lyon County is 33.8%.
Women in Lyon County earn 66.2 cents for every dollar earned by a man.
What is Inequality or Gini Index in Lyon County?
Inequality or Gini Index in Lyon County is 0.39.
How Large is the Labor Force in Lyon County?
There are 5,997 People in the Labor Forcein in Lyon County.
What is the Percentage of People in the Labor Force in Lyon County?
66.8% of People are in the Labor Force in Lyon County.
What is the Unemployment Rate in Lyon County?
Unemployment Rate in Lyon County is 2.4%.