Louisa County, IA
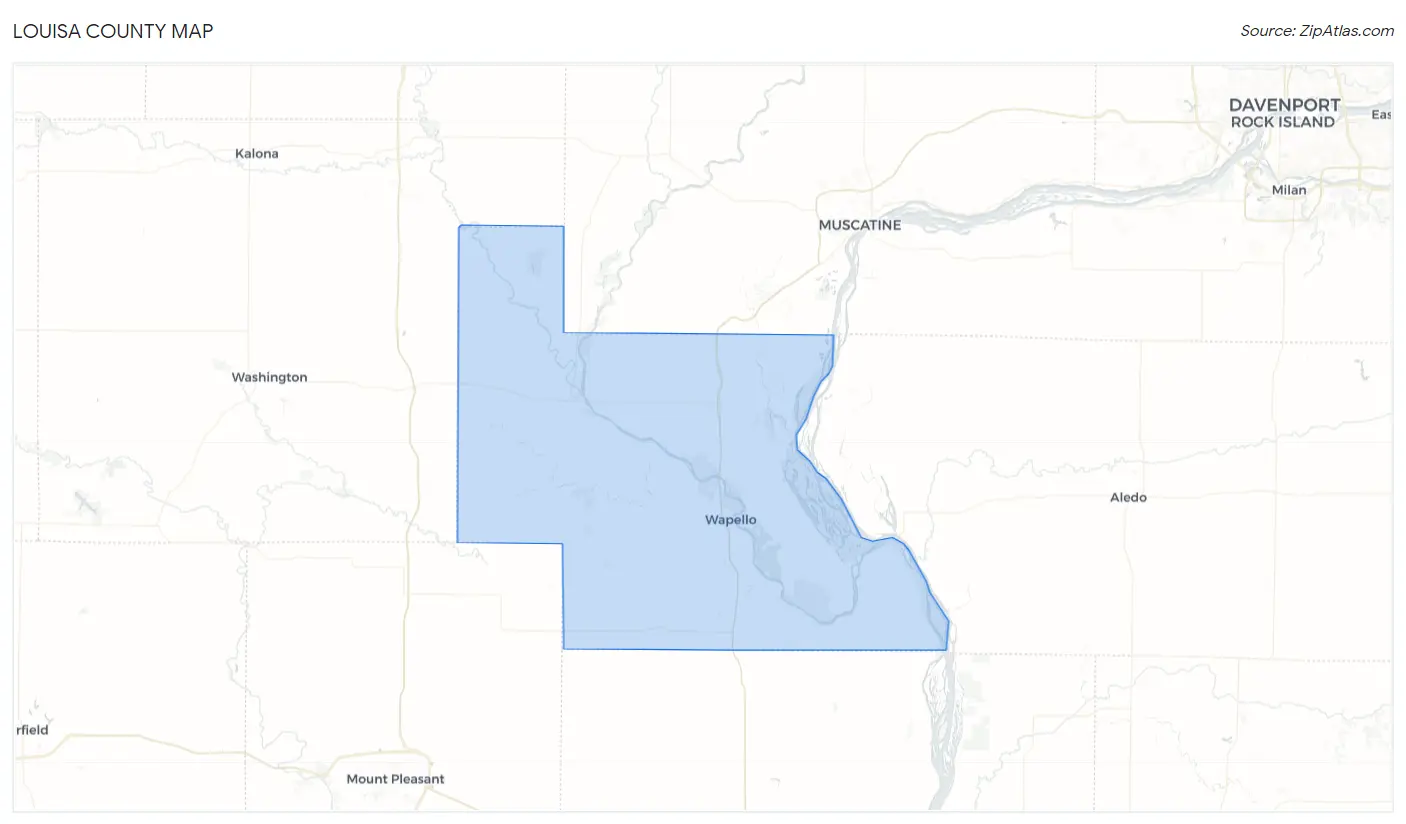
Louisa County Map
Louisa County Overview
10,823
TOTAL POPULATION
5,572
MALE POPULATION
5,251
FEMALE POPULATION
106.11
MALES / 100 FEMALES
94.24
FEMALES / 100 MALES
42.2
MEDIAN AGE
3.0
AVG FAMILY SIZE
2.6
AVG HOUSEHOLD SIZE
$33,296
PER CAPITA INCOME
$83,792
AVG FAMILY INCOME
$72,500
AVG HOUSEHOLD INCOME
32.7%
WAGE / INCOME GAP [ % ]
67.3¢/ $1
WAGE / INCOME GAP [ $ ]
$7,997
FAMILY INCOME DEFICIT
0.43
INEQUALITY / GINI INDEX
5,632
LABOR FORCE [ PEOPLE ]
65.0%
PERCENT IN LABOR FORCE
4.4%
UNEMPLOYMENT RATE
Louisa County Area Codes
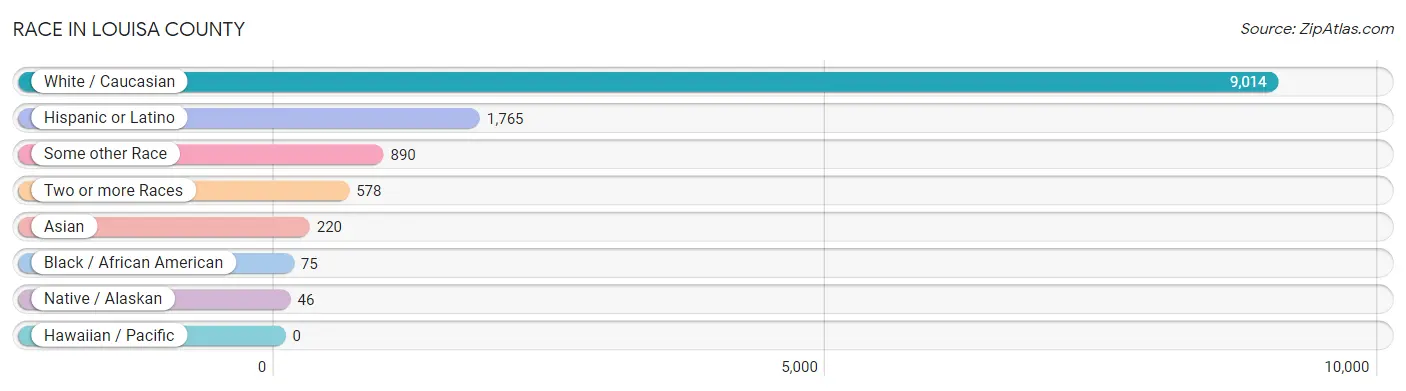
Race in Louisa County
The most populous races in Louisa County are White / Caucasian (9,014 | 83.3%), Hispanic or Latino (1,765 | 16.3%), and Some other Race (890 | 8.2%).
| Race | # Population | % Population |
| Asian | 220 | 2.0% |
| Black / African American | 75 | 0.7% |
| Hawaiian / Pacific | 0 | 0.0% |
| Hispanic or Latino | 1,765 | 16.3% |
| Native / Alaskan | 46 | 0.4% |
| White / Caucasian | 9,014 | 83.3% |
| Two or more Races | 578 | 5.3% |
| Some other Race | 890 | 8.2% |
| Total | 10,823 | 100.0% |
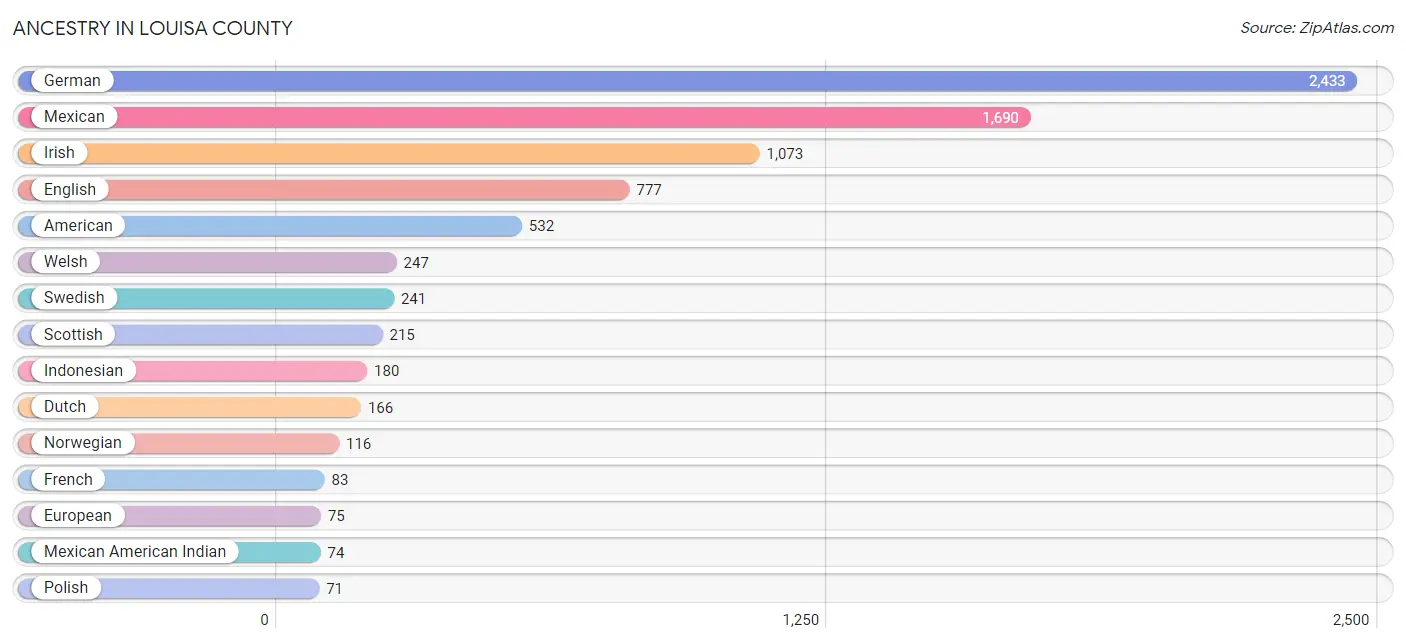
Ancestry in Louisa County
The most populous ancestries reported in Louisa County are German (2,433 | 22.5%), Mexican (1,690 | 15.6%), Irish (1,073 | 9.9%), English (777 | 7.2%), and American (532 | 4.9%), together accounting for 60.1% of all Louisa County residents.
| Ancestry | # Population | % Population |
| African | 48 | 0.4% |
| American | 532 | 4.9% |
| Belgian | 6 | 0.1% |
| Blackfeet | 3 | 0.0% |
| British | 6 | 0.1% |
| Canadian | 13 | 0.1% |
| Central American | 13 | 0.1% |
| Cherokee | 7 | 0.1% |
| Croatian | 3 | 0.0% |
| Czech | 45 | 0.4% |
| Czechoslovakian | 2 | 0.0% |
| Danish | 22 | 0.2% |
| Dutch | 166 | 1.5% |
| English | 777 | 7.2% |
| European | 75 | 0.7% |
| French | 83 | 0.8% |
| French Canadian | 1 | 0.0% |
| German | 2,433 | 22.5% |
| Greek | 8 | 0.1% |
| Hungarian | 34 | 0.3% |
| Indonesian | 180 | 1.7% |
| Irish | 1,073 | 9.9% |
| Italian | 47 | 0.4% |
| Korean | 6 | 0.1% |
| Luxembourger | 4 | 0.0% |
| Malaysian | 25 | 0.2% |
| Mexican | 1,690 | 15.6% |
| Mexican American Indian | 74 | 0.7% |
| Northern European | 2 | 0.0% |
| Norwegian | 116 | 1.1% |
| Polish | 71 | 0.7% |
| Portuguese | 1 | 0.0% |
| Puerto Rican | 14 | 0.1% |
| Russian | 5 | 0.1% |
| Salvadoran | 13 | 0.1% |
| Scandinavian | 27 | 0.3% |
| Scotch-Irish | 62 | 0.6% |
| Scottish | 215 | 2.0% |
| Sioux | 15 | 0.1% |
| Spanish | 3 | 0.0% |
| Sri Lankan | 3 | 0.0% |
| Subsaharan African | 48 | 0.4% |
| Swedish | 241 | 2.2% |
| Swiss | 30 | 0.3% |
| Thai | 37 | 0.3% |
| Ukrainian | 9 | 0.1% |
| Welsh | 247 | 2.3% | View All 47 Rows |
Immigrants in Louisa County
The most numerous immigrant groups reported in Louisa County came from Latin America (744 | 6.9%), Central America (743 | 6.9%), Mexico (739 | 6.8%), Asia (124 | 1.1%), and South Eastern Asia (96 | 0.9%), together accounting for 22.6% of all Louisa County residents.

| Immigration Origin | # Population | % Population |
| Africa | 39 | 0.4% |
| Asia | 124 | 1.1% |
| Canada | 12 | 0.1% |
| Central America | 743 | 6.9% |
| Eastern Africa | 22 | 0.2% |
| Eastern Europe | 10 | 0.1% |
| Ecuador | 1 | 0.0% |
| El Salvador | 4 | 0.0% |
| Europe | 10 | 0.1% |
| Hungary | 10 | 0.1% |
| India | 28 | 0.3% |
| Latin America | 744 | 6.9% |
| Mexico | 739 | 6.8% |
| Northern Africa | 17 | 0.2% |
| Philippines | 2 | 0.0% |
| South America | 1 | 0.0% |
| South Central Asia | 28 | 0.3% |
| South Eastern Asia | 96 | 0.9% |
| Vietnam | 3 | 0.0% | View All 19 Rows |
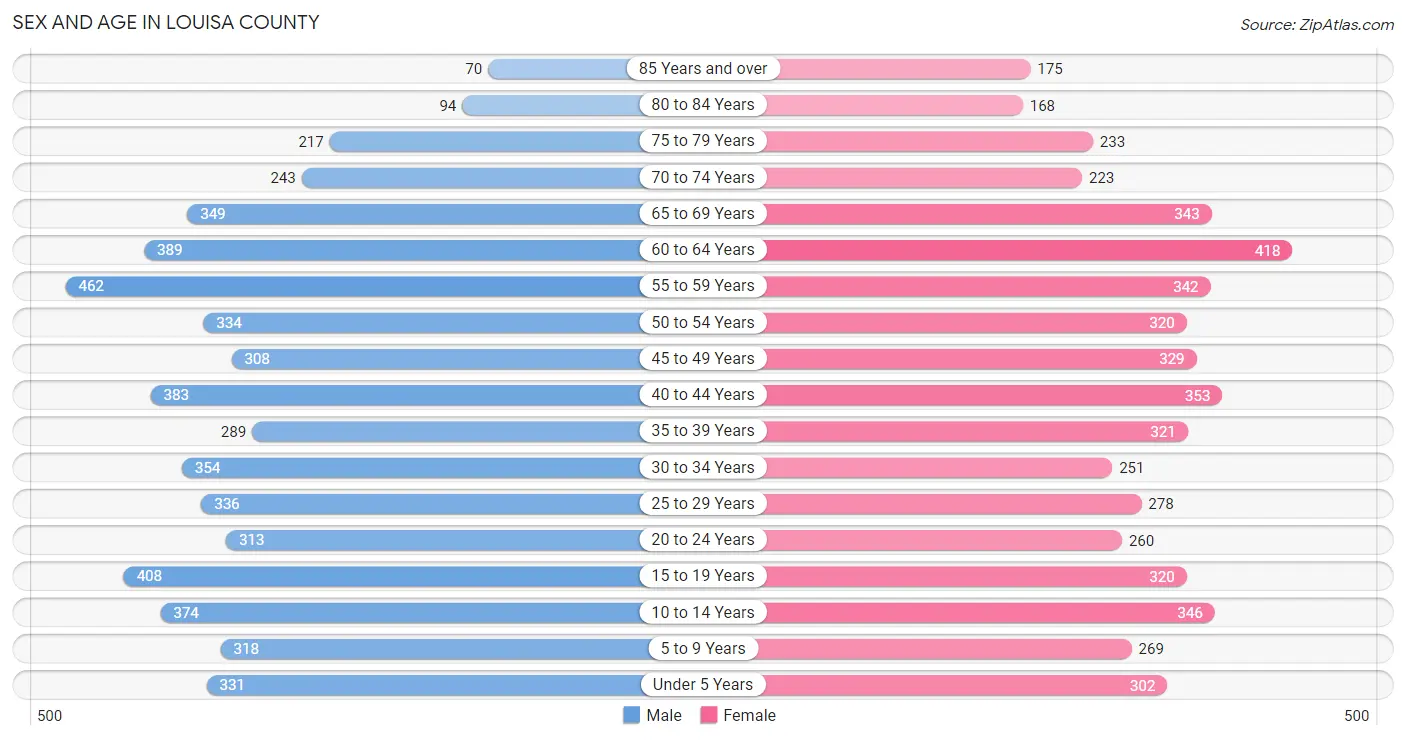
Sex and Age in Louisa County
Sex and Age in Louisa County
The most populous age groups in Louisa County are 55 to 59 Years (462 | 8.3%) for men and 60 to 64 Years (418 | 8.0%) for women.
| Age Bracket | Male | Female |
| Under 5 Years | 331 (5.9%) | 302 (5.8%) |
| 5 to 9 Years | 318 (5.7%) | 269 (5.1%) |
| 10 to 14 Years | 374 (6.7%) | 346 (6.6%) |
| 15 to 19 Years | 408 (7.3%) | 320 (6.1%) |
| 20 to 24 Years | 313 (5.6%) | 260 (5.0%) |
| 25 to 29 Years | 336 (6.0%) | 278 (5.3%) |
| 30 to 34 Years | 354 (6.4%) | 251 (4.8%) |
| 35 to 39 Years | 289 (5.2%) | 321 (6.1%) |
| 40 to 44 Years | 383 (6.9%) | 353 (6.7%) |
| 45 to 49 Years | 308 (5.5%) | 329 (6.3%) |
| 50 to 54 Years | 334 (6.0%) | 320 (6.1%) |
| 55 to 59 Years | 462 (8.3%) | 342 (6.5%) |
| 60 to 64 Years | 389 (7.0%) | 418 (8.0%) |
| 65 to 69 Years | 349 (6.3%) | 343 (6.5%) |
| 70 to 74 Years | 243 (4.4%) | 223 (4.3%) |
| 75 to 79 Years | 217 (3.9%) | 233 (4.4%) |
| 80 to 84 Years | 94 (1.7%) | 168 (3.2%) |
| 85 Years and over | 70 (1.3%) | 175 (3.3%) |
| Total | 5,572 (100.0%) | 5,251 (100.0%) |
Families and Households in Louisa County
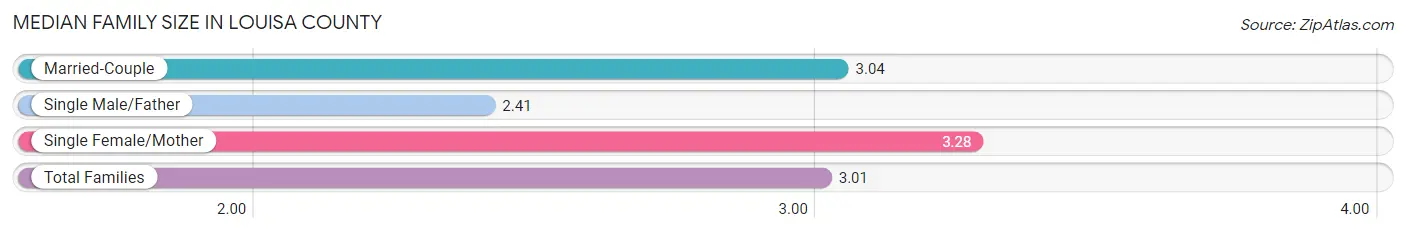
Median Family Size in Louisa County
The median family size in Louisa County is 3.01 persons per family, with single female/mother families (317 | 10.5%) accounting for the largest median family size of 3.28 persons per family. On the other hand, single male/father families (245 | 8.1%) represent the smallest median family size with 2.41 persons per family.
| Family Type | # Families | Family Size |
| Married-Couple | 2,465 (81.4%) | 3.04 |
| Single Male/Father | 245 (8.1%) | 2.41 |
| Single Female/Mother | 317 (10.5%) | 3.28 |
| Total Families | 3,027 (100.0%) | 3.01 |
Median Household Size in Louisa County
The median household size in Louisa County is 2.60 persons per household, with single female/mother households (317 | 7.7%) accounting for the largest median household size of 3.57 persons per household. non-family households (1,085 | 26.4%) represent the smallest median household size with 1.17 persons per household.

| Household Type | # Households | Household Size |
| Married-Couple | 2,465 (60.0%) | 3.06 |
| Single Male/Father | 245 (6.0%) | 3.03 |
| Single Female/Mother | 317 (7.7%) | 3.57 |
| Non-family | 1,085 (26.4%) | 1.17 |
| Total Households | 4,112 (100.0%) | 2.60 |
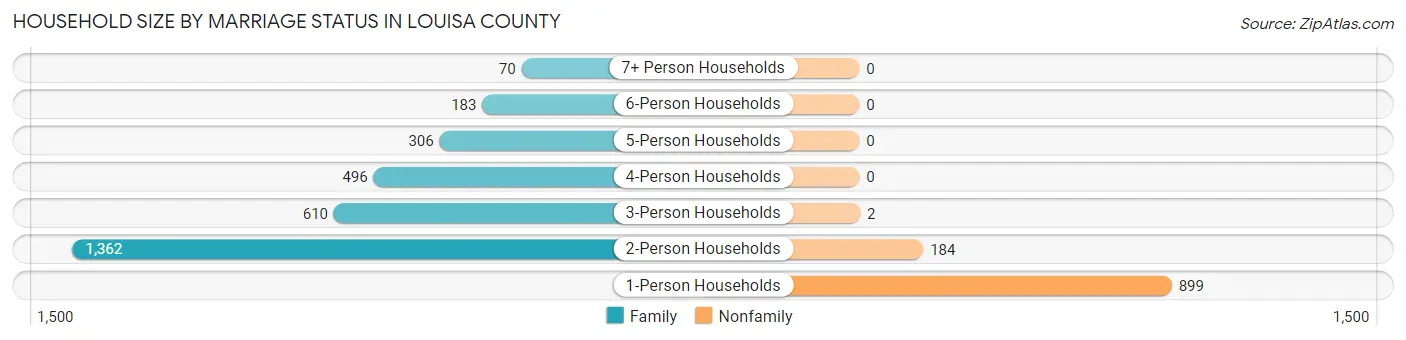
Household Size by Marriage Status in Louisa County
Out of a total of 4,112 households in Louisa County, 3,027 (73.6%) are family households, while 1,085 (26.4%) are nonfamily households. The most numerous type of family households are 2-person households, comprising 1,362, and the most common type of nonfamily households are 1-person households, comprising 899.
| Household Size | Family Households | Nonfamily Households |
| 1-Person Households | - | 899 (21.9%) |
| 2-Person Households | 1,362 (33.1%) | 184 (4.5%) |
| 3-Person Households | 610 (14.8%) | 2 (0.1%) |
| 4-Person Households | 496 (12.1%) | 0 (0.0%) |
| 5-Person Households | 306 (7.4%) | 0 (0.0%) |
| 6-Person Households | 183 (4.4%) | 0 (0.0%) |
| 7+ Person Households | 70 (1.7%) | 0 (0.0%) |
| Total | 3,027 (73.6%) | 1,085 (26.4%) |
Female Fertility in Louisa County
Fertility by Age in Louisa County
Average fertility rate in Louisa County is 59.0 births per 1,000 women. Women in the age bracket of 20 to 34 years have the highest fertility rate with 127.0 births per 1,000 women. Women in the age bracket of 20 to 34 years acount for 77.5% of all women with births.

| Age Bracket | Women with Births | Births / 1,000 Women |
| 15 to 19 years | 0 (0.0%) | 0.0 |
| 20 to 34 years | 100 (77.5%) | 127.0 |
| 35 to 50 years | 29 (22.5%) | 27.0 |
| Total | 129 (100.0%) | 59.0 |
Fertility by Age by Marriage Status in Louisa County
89.9% of women with births (129) in Louisa County are married. The highest percentage of unmarried women with births falls into 20 to 34 years age bracket with 13.0% of them unmarried at the time of birth, while the lowest percentage of unmarried women with births belong to 35 to 50 years age bracket with 0.0% of them unmarried.

| Age Bracket | Married | Unmarried |
| 15 to 19 years | 0 (0.0%) | 0 (0.0%) |
| 20 to 34 years | 87 (87.0%) | 13 (13.0%) |
| 35 to 50 years | 29 (100.0%) | 0 (0.0%) |
| Total | 116 (89.9%) | 13 (10.1%) |
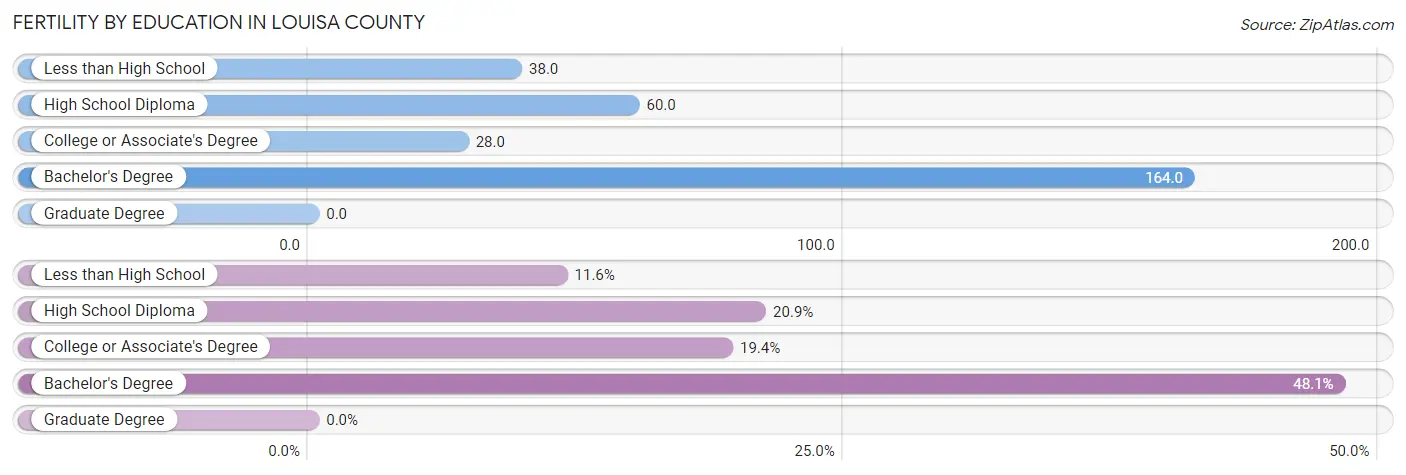
Fertility by Education in Louisa County
| Educational Attainment | Women with Births | Births / 1,000 Women |
| Less than High School | 15 (11.6%) | 38.0 |
| High School Diploma | 27 (20.9%) | 60.0 |
| College or Associate's Degree | 25 (19.4%) | 28.0 |
| Bachelor's Degree | 62 (48.1%) | 164.0 |
| Graduate Degree | 0 (0.0%) | 0.0 |
| Total | 129 (100.0%) | 59.0 |
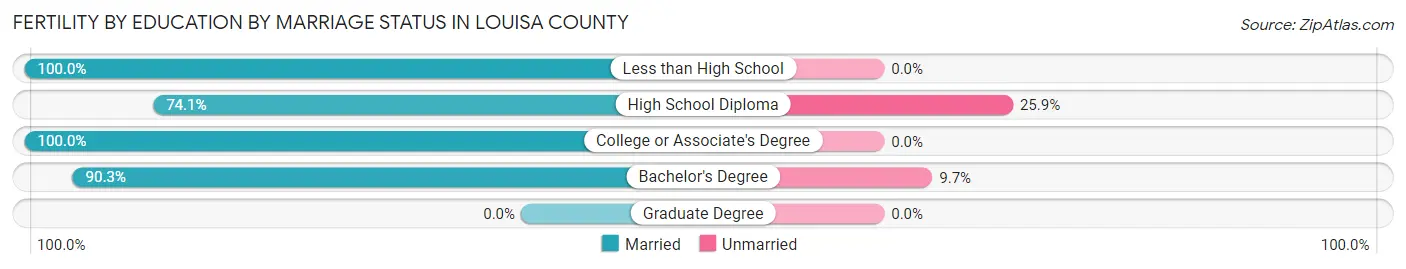
Fertility by Education by Marriage Status in Louisa County
10.1% of women with births in Louisa County are unmarried. Women with the educational attainment of less than high school are most likely to be married with 100.0% of them married at childbirth, while women with the educational attainment of high school diploma are least likely to be married with 25.9% of them unmarried at childbirth.
| Educational Attainment | Married | Unmarried |
| Less than High School | 15 (100.0%) | 0 (0.0%) |
| High School Diploma | 20 (74.1%) | 7 (25.9%) |
| College or Associate's Degree | 25 (100.0%) | 0 (0.0%) |
| Bachelor's Degree | 56 (90.3%) | 6 (9.7%) |
| Graduate Degree | 0 (0.0%) | 0 (0.0%) |
| Total | 116 (89.9%) | 13 (10.1%) |
Income in Louisa County
Income Overview in Louisa County
Per Capita Income in Louisa County is $33,296, while median incomes of families and households are $83,792 and $72,500 respectively.
| Characteristic | Number | Measure |
| Per Capita Income | 10,823 | $33,296 |
| Median Family Income | 3,027 | $83,792 |
| Mean Family Income | 3,027 | $101,590 |
| Median Household Income | 4,112 | $72,500 |
| Mean Household Income | 4,112 | $90,256 |
| Income Deficit | 3,027 | $7,997 |
| Wage / Income Gap (%) | 10,823 | 32.66% |
| Wage / Income Gap ($) | 10,823 | 67.34¢ per $1 |
| Gini / Inequality Index | 10,823 | 0.43 |
Earnings by Sex in Louisa County
Average Earnings in Louisa County are $40,652, $47,683 for men and $32,109 for women, a difference of 32.7%.

| Sex | Number | Average Earnings |
| Male | 3,285 (56.4%) | $47,683 |
| Female | 2,545 (43.6%) | $32,109 |
| Total | 5,830 (100.0%) | $40,652 |
Earnings by Sex by Income Bracket in Louisa County
The most common earnings brackets in Louisa County are $75,000 to $99,999 for men (408 | 12.4%) and $25,000 to $29,999 for women (200 | 7.9%).

| Income | Male | Female |
| $2,499 or less | 175 (5.3%) | 177 (7.0%) |
| $2,500 to $4,999 | 66 (2.0%) | 75 (2.9%) |
| $5,000 to $7,499 | 88 (2.7%) | 81 (3.2%) |
| $7,500 to $9,999 | 31 (0.9%) | 80 (3.1%) |
| $10,000 to $12,499 | 80 (2.4%) | 62 (2.4%) |
| $12,500 to $14,999 | 68 (2.1%) | 111 (4.4%) |
| $15,000 to $17,499 | 84 (2.6%) | 140 (5.5%) |
| $17,500 to $19,999 | 40 (1.2%) | 94 (3.7%) |
| $20,000 to $22,499 | 68 (2.1%) | 92 (3.6%) |
| $22,500 to $24,999 | 73 (2.2%) | 77 (3.0%) |
| $25,000 to $29,999 | 240 (7.3%) | 200 (7.9%) |
| $30,000 to $34,999 | 168 (5.1%) | 199 (7.8%) |
| $35,000 to $39,999 | 164 (5.0%) | 140 (5.5%) |
| $40,000 to $44,999 | 145 (4.4%) | 180 (7.1%) |
| $45,000 to $49,999 | 222 (6.8%) | 96 (3.8%) |
| $50,000 to $54,999 | 176 (5.4%) | 155 (6.1%) |
| $55,000 to $64,999 | 359 (10.9%) | 183 (7.2%) |
| $65,000 to $74,999 | 325 (9.9%) | 196 (7.7%) |
| $75,000 to $99,999 | 408 (12.4%) | 127 (5.0%) |
| $100,000+ | 305 (9.3%) | 80 (3.1%) |
| Total | 3,285 (100.0%) | 2,545 (100.0%) |
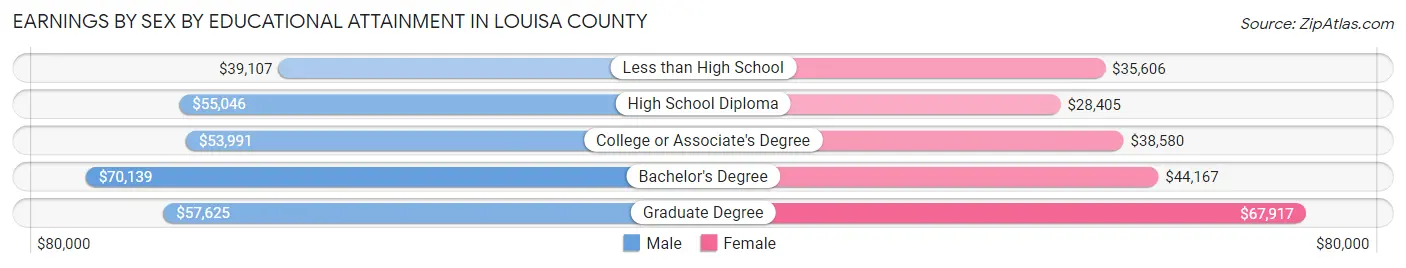
Earnings by Sex by Educational Attainment in Louisa County
Average earnings in Louisa County are $52,939 for men and $37,267 for women, a difference of 29.6%. Men with an educational attainment of bachelor's degree enjoy the highest average annual earnings of $70,139, while those with less than high school education earn the least with $39,107. Women with an educational attainment of graduate degree earn the most with the average annual earnings of $67,917, while those with high school diploma education have the smallest earnings of $28,405.
| Educational Attainment | Male Income | Female Income |
| Less than High School | $39,107 | $35,606 |
| High School Diploma | $55,046 | $28,405 |
| College or Associate's Degree | $53,991 | $38,580 |
| Bachelor's Degree | $70,139 | $44,167 |
| Graduate Degree | $57,625 | $67,917 |
| Total | $52,939 | $37,267 |
Family Income in Louisa County
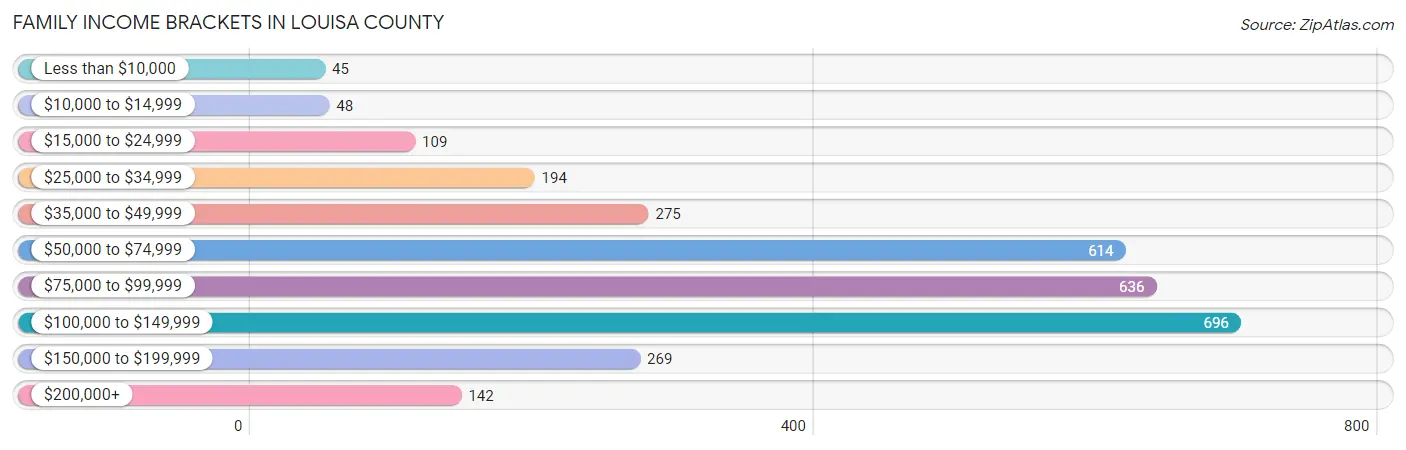
Family Income Brackets in Louisa County
According to the Louisa County family income data, there are 696 families falling into the $100,000 to $149,999 income range, which is the most common income bracket and makes up 23.0% of all families. Conversely, the less than $10,000 income bracket is the least frequent group with only 45 families (1.5%) belonging to this category.
| Income Bracket | # Families | % Families |
| Less than $10,000 | 45 | 1.5% |
| $10,000 to $14,999 | 48 | 1.6% |
| $15,000 to $24,999 | 109 | 3.6% |
| $25,000 to $34,999 | 194 | 6.4% |
| $35,000 to $49,999 | 275 | 9.1% |
| $50,000 to $74,999 | 614 | 20.3% |
| $75,000 to $99,999 | 636 | 21.0% |
| $100,000 to $149,999 | 696 | 23.0% |
| $150,000 to $199,999 | 269 | 8.9% |
| $200,000+ | 142 | 4.7% |
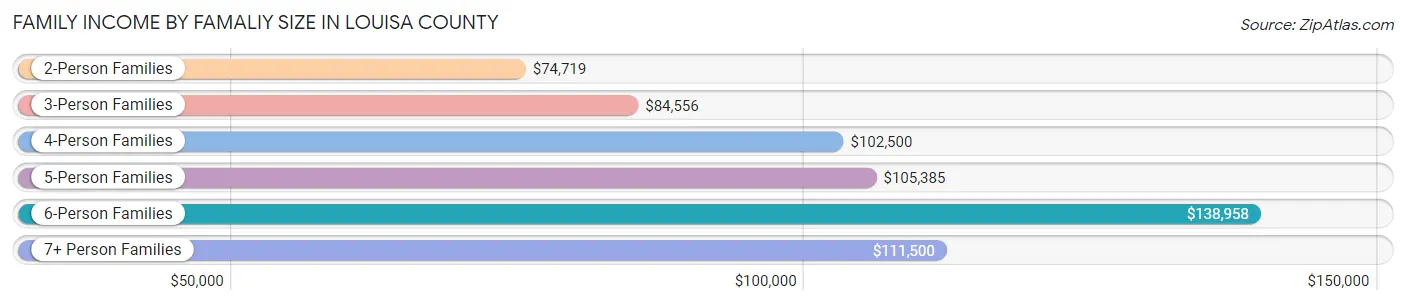
Family Income by Famaliy Size in Louisa County
6-person families (175 | 5.8%) account for the highest median family income in Louisa County with $138,958 per family, while 2-person families (1,437 | 47.5%) have the highest median income of $37,360 per family member.
| Income Bracket | # Families | Median Income |
| 2-Person Families | 1,437 (47.5%) | $74,719 |
| 3-Person Families | 591 (19.5%) | $84,556 |
| 4-Person Families | 500 (16.5%) | $102,500 |
| 5-Person Families | 270 (8.9%) | $105,385 |
| 6-Person Families | 175 (5.8%) | $138,958 |
| 7+ Person Families | 54 (1.8%) | $111,500 |
| Total | 3,027 (100.0%) | $83,792 |
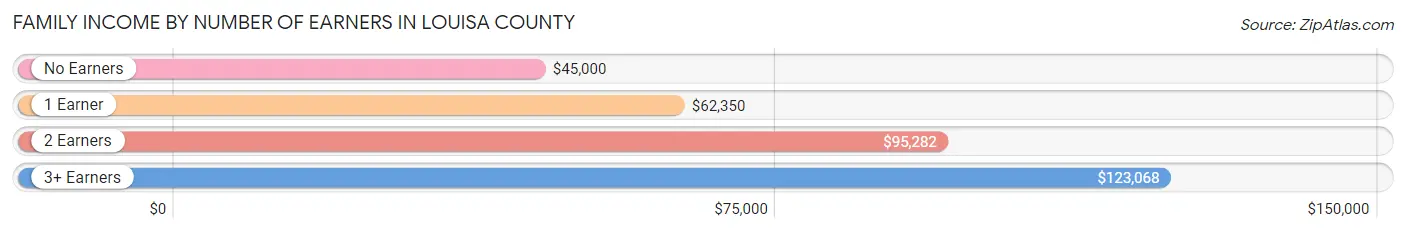
Family Income by Number of Earners in Louisa County
The median family income in Louisa County is $83,792, with families comprising 3+ earners (465) having the highest median family income of $123,068, while families with no earners (400) have the lowest median family income of $45,000, accounting for 15.4% and 13.2% of families, respectively.
| Number of Earners | # Families | Median Income |
| No Earners | 400 (13.2%) | $45,000 |
| 1 Earner | 897 (29.6%) | $62,350 |
| 2 Earners | 1,265 (41.8%) | $95,282 |
| 3+ Earners | 465 (15.4%) | $123,068 |
| Total | 3,027 (100.0%) | $83,792 |
Household Income in Louisa County
Household Income Brackets in Louisa County
With 785 households falling in the category, the $100,000 to $149,999 income range is the most frequent in Louisa County, accounting for 19.1% of all households. In contrast, only 132 households (3.2%) fall into the less than $10,000 income bracket, making it the least populous group.
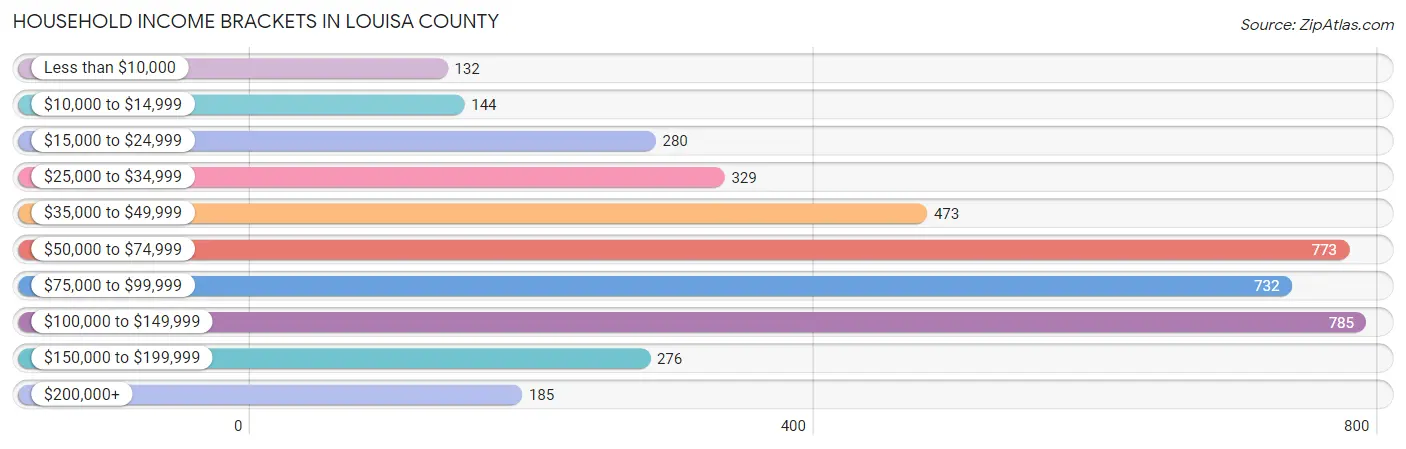
| Income Bracket | # Households | % Households |
| Less than $10,000 | 132 | 3.2% |
| $10,000 to $14,999 | 144 | 3.5% |
| $15,000 to $24,999 | 280 | 6.8% |
| $25,000 to $34,999 | 329 | 8.0% |
| $35,000 to $49,999 | 473 | 11.5% |
| $50,000 to $74,999 | 773 | 18.8% |
| $75,000 to $99,999 | 732 | 17.8% |
| $100,000 to $149,999 | 785 | 19.1% |
| $150,000 to $199,999 | 276 | 6.7% |
| $200,000+ | 185 | 4.5% |
Household Income by Householder Age in Louisa County
The median household income in Louisa County is $72,500, with the highest median household income of $94,118 found in the 25 to 44 years age bracket for the primary householder. A total of 1,188 households (28.9%) fall into this category. Meanwhile, the 65+ years age bracket for the primary householder has the lowest median household income of $45,676, with 1,239 households (30.1%) in this group.
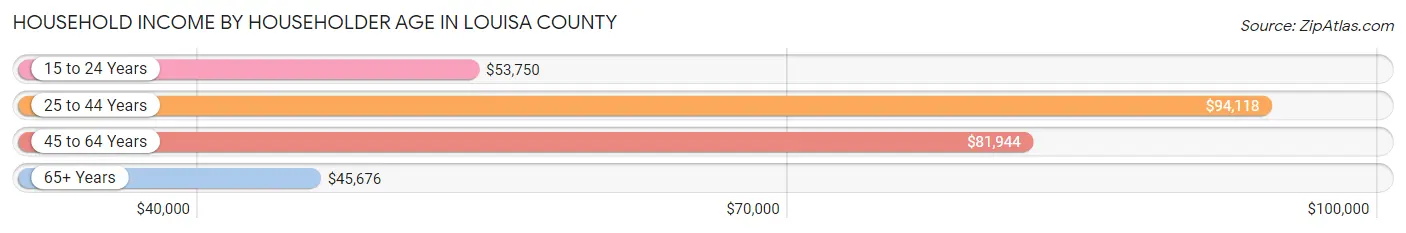
| Income Bracket | # Households | Median Income |
| 15 to 24 Years | 161 (3.9%) | $53,750 |
| 25 to 44 Years | 1,188 (28.9%) | $94,118 |
| 45 to 64 Years | 1,524 (37.1%) | $81,944 |
| 65+ Years | 1,239 (30.1%) | $45,676 |
| Total | 4,112 (100.0%) | $72,500 |
Poverty in Louisa County
Income Below Poverty by Sex and Age in Louisa County
With 8.9% poverty level for males and 11.3% for females among the residents of Louisa County, 12 to 14 year old males and 35 to 44 year old females are the most vulnerable to poverty, with 51 males (20.3%) and 133 females (19.8%) in their respective age groups living below the poverty level.
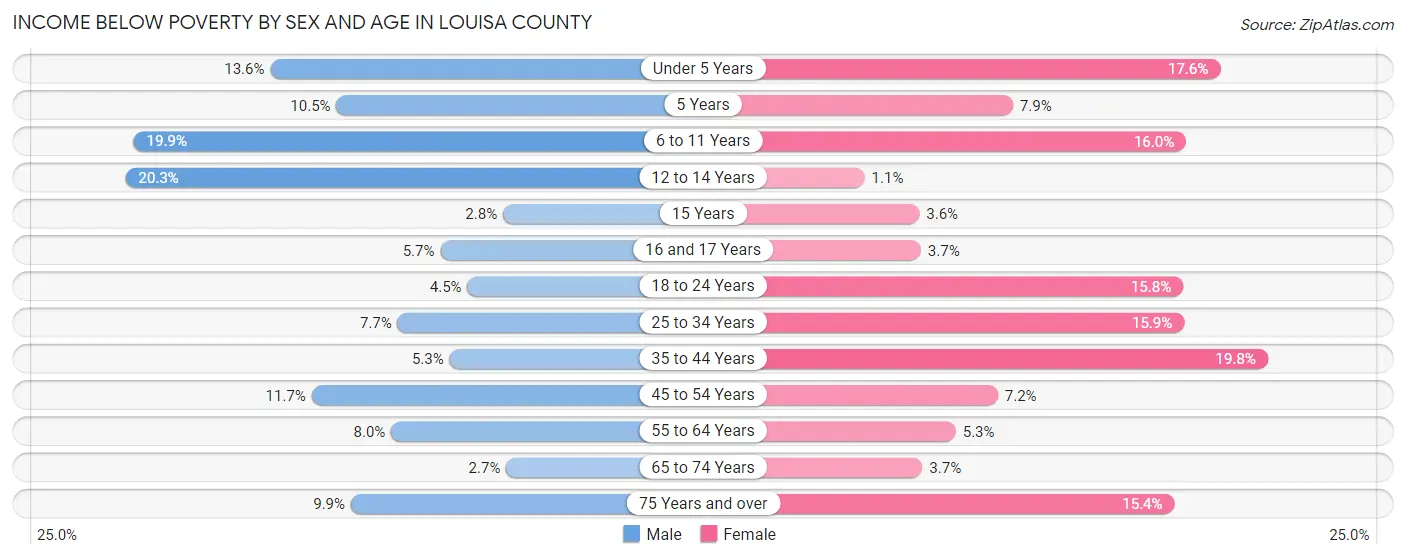
| Age Bracket | Male | Female |
| Under 5 Years | 45 (13.6%) | 53 (17.5%) |
| 5 Years | 6 (10.5%) | 5 (7.9%) |
| 6 to 11 Years | 72 (19.9%) | 57 (16.0%) |
| 12 to 14 Years | 51 (20.3%) | 2 (1.1%) |
| 15 Years | 3 (2.8%) | 4 (3.6%) |
| 16 and 17 Years | 8 (5.7%) | 4 (3.7%) |
| 18 to 24 Years | 21 (4.4%) | 57 (15.8%) |
| 25 to 34 Years | 53 (7.7%) | 84 (15.9%) |
| 35 to 44 Years | 35 (5.3%) | 133 (19.8%) |
| 45 to 54 Years | 75 (11.7%) | 47 (7.2%) |
| 55 to 64 Years | 68 (8.0%) | 40 (5.3%) |
| 65 to 74 Years | 15 (2.6%) | 21 (3.7%) |
| 75 Years and over | 36 (9.9%) | 77 (15.4%) |
| Total | 488 (8.9%) | 584 (11.3%) |
Income Above Poverty by Sex and Age in Louisa County
According to the poverty statistics in Louisa County, males aged 65 to 74 years and females aged 12 to 14 years are the age groups that are most secure financially, with 97.4% of males and 98.9% of females in these age groups living above the poverty line.
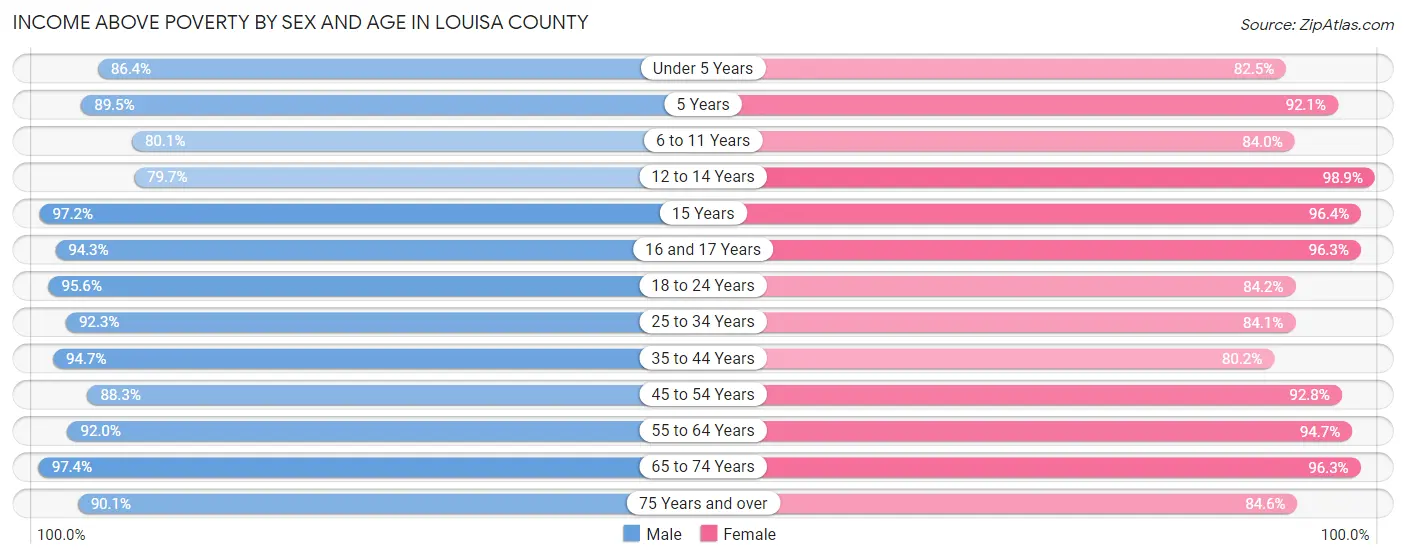
| Age Bracket | Male | Female |
| Under 5 Years | 286 (86.4%) | 249 (82.5%) |
| 5 Years | 51 (89.5%) | 58 (92.1%) |
| 6 to 11 Years | 289 (80.1%) | 300 (84.0%) |
| 12 to 14 Years | 200 (79.7%) | 187 (98.9%) |
| 15 Years | 104 (97.2%) | 107 (96.4%) |
| 16 and 17 Years | 132 (94.3%) | 105 (96.3%) |
| 18 to 24 Years | 451 (95.6%) | 303 (84.2%) |
| 25 to 34 Years | 636 (92.3%) | 445 (84.1%) |
| 35 to 44 Years | 628 (94.7%) | 540 (80.2%) |
| 45 to 54 Years | 567 (88.3%) | 602 (92.8%) |
| 55 to 64 Years | 783 (92.0%) | 716 (94.7%) |
| 65 to 74 Years | 552 (97.4%) | 541 (96.3%) |
| 75 Years and over | 329 (90.1%) | 422 (84.6%) |
| Total | 5,008 (91.1%) | 4,575 (88.7%) |
Income Below Poverty Among Married-Couple Families in Louisa County
The poverty statistics for married-couple families in Louisa County show that 5.6% or 138 of the total 2,465 families live below the poverty line. Families with 5 or more children have the highest poverty rate of 26.7%, comprising of 4 families. On the other hand, families with no children have the lowest poverty rate of 2.6%, which includes 39 families.
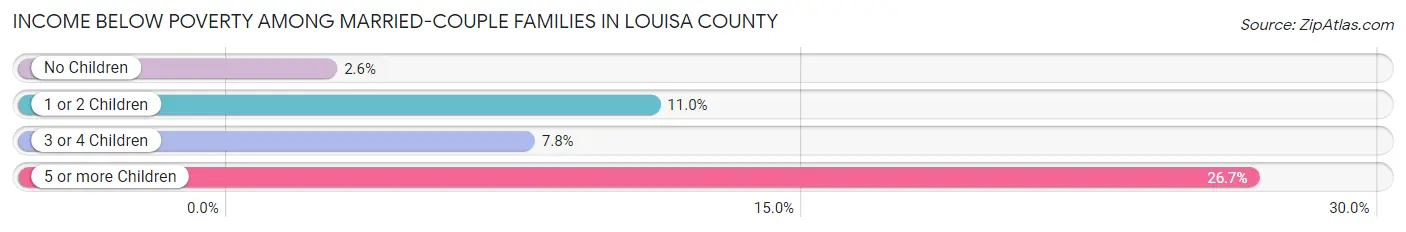
| Children | Above Poverty | Below Poverty |
| No Children | 1,465 (97.4%) | 39 (2.6%) |
| 1 or 2 Children | 589 (89.0%) | 73 (11.0%) |
| 3 or 4 Children | 262 (92.2%) | 22 (7.7%) |
| 5 or more Children | 11 (73.3%) | 4 (26.7%) |
| Total | 2,327 (94.4%) | 138 (5.6%) |
Income Below Poverty Among Single-Parent Households in Louisa County
According to the poverty data in Louisa County, 12.7% or 31 single-father households and 17.7% or 56 single-mother households are living below the poverty line. Among single-father households, those with no children have the highest poverty rate, with 22 households (23.2%) experiencing poverty. Likewise, among single-mother households, those with 5 or more children have the highest poverty rate, with 7 households (100.0%) falling below the poverty line.

| Children | Single Father | Single Mother |
| No Children | 22 (23.2%) | 5 (3.8%) |
| 1 or 2 Children | 9 (6.7%) | 35 (21.6%) |
| 3 or 4 Children | 0 (0.0%) | 9 (60.0%) |
| 5 or more Children | 0 (0.0%) | 7 (100.0%) |
| Total | 31 (12.7%) | 56 (17.7%) |
Income Below Poverty Among Married-Couple vs Single-Parent Households in Louisa County
The poverty data for Louisa County shows that 138 of the married-couple family households (5.6%) and 87 of the single-parent households (15.5%) are living below the poverty level. Within the married-couple family households, those with 5 or more children have the highest poverty rate, with 4 households (26.7%) falling below the poverty line. Among the single-parent households, those with 5 or more children have the highest poverty rate, with 7 household (100.0%) living below poverty.
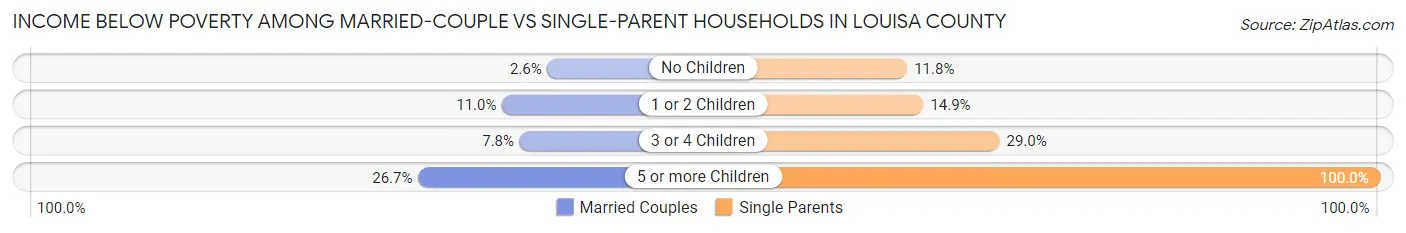
| Children | Married-Couple Families | Single-Parent Households |
| No Children | 39 (2.6%) | 27 (11.8%) |
| 1 or 2 Children | 73 (11.0%) | 44 (14.9%) |
| 3 or 4 Children | 22 (7.7%) | 9 (29.0%) |
| 5 or more Children | 4 (26.7%) | 7 (100.0%) |
| Total | 138 (5.6%) | 87 (15.5%) |
Employment Characteristics in Louisa County
Employment by Class of Employer in Louisa County
Among the 5,341 employed individuals in Louisa County, private company employees (3,863 | 72.3%), local government employees (435 | 8.1%), and self-employed (not incorporated) (270 | 5.1%) make up the most common classes of employment.

| Employer Class | # Employees | % Employees |
| Private Company Employees | 3,863 | 72.3% |
| Self-Employed (Incorporated) | 158 | 3.0% |
| Self-Employed (Not Incorporated) | 270 | 5.1% |
| Not-for-profit Organizations | 262 | 4.9% |
| Local Government Employees | 435 | 8.1% |
| State Government Employees | 238 | 4.5% |
| Federal Government Employees | 113 | 2.1% |
| Unpaid Family Workers | 2 | 0.0% |
| Total | 5,341 | 100.0% |
Employment Status by Age in Louisa County
According to the labor force statistics for Louisa County, out of the total population over 16 years of age (8,665), 65.0% or 5,632 individuals are in the labor force, with 4.4% or 248 of them unemployed. The age group with the highest labor force participation rate is 35 to 44 years, with 87.7% or 1,180 individuals in the labor force. Within the labor force, the 16 to 19 years age range has the highest percentage of unemployed individuals, with 11.4% or 33 of them being unemployed.
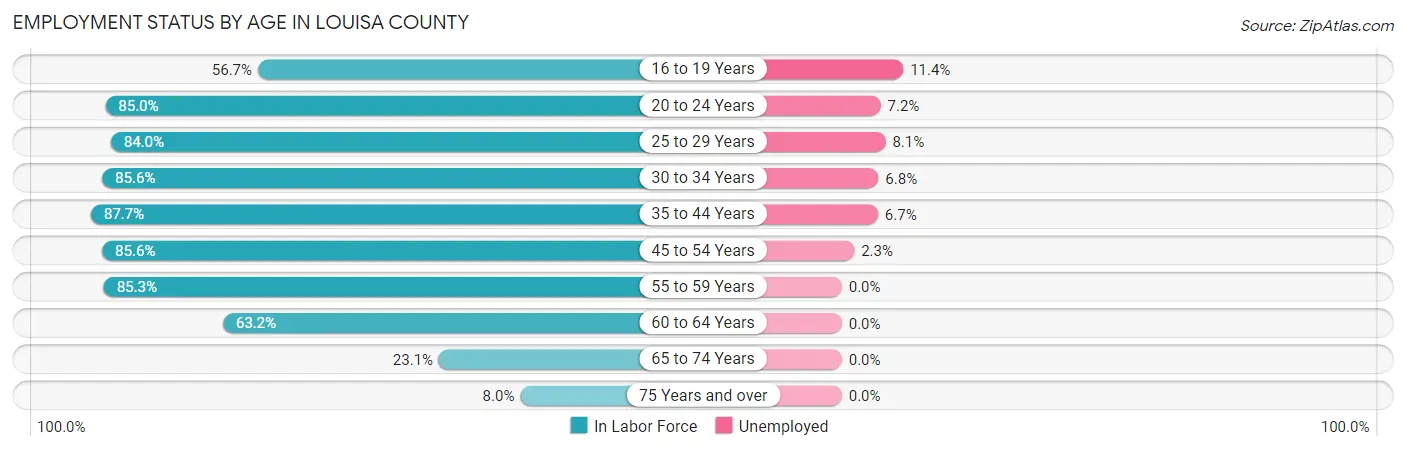
| Age Bracket | In Labor Force | Unemployed |
| 16 to 19 Years | 289 (56.7%) | 33 (11.4%) |
| 20 to 24 Years | 487 (85.0%) | 35 (7.2%) |
| 25 to 29 Years | 516 (84.0%) | 42 (8.1%) |
| 30 to 34 Years | 518 (85.6%) | 35 (6.8%) |
| 35 to 44 Years | 1,180 (87.7%) | 79 (6.7%) |
| 45 to 54 Years | 1,105 (85.6%) | 25 (2.3%) |
| 55 to 59 Years | 686 (85.3%) | 0 (0.0%) |
| 60 to 64 Years | 510 (63.2%) | 0 (0.0%) |
| 65 to 74 Years | 267 (23.1%) | 0 (0.0%) |
| 75 Years and over | 77 (8.0%) | 0 (0.0%) |
| Total | 5,632 (65.0%) | 248 (4.4%) |
Employment Status by Educational Attainment in Louisa County
According to labor force statistics for Louisa County, 82.6% of individuals (4,516) out of the total population between 25 and 64 years of age (5,467) are in the labor force, with 4.0% or 181 of them being unemployed. The group with the highest labor force participation rate are those with the educational attainment of college / associate degree, with 86.3% or 1,769 individuals in the labor force. Within the labor force, individuals with less than high school education have the highest percentage of unemployment, with 11.3% or 67 of them being unemployed.
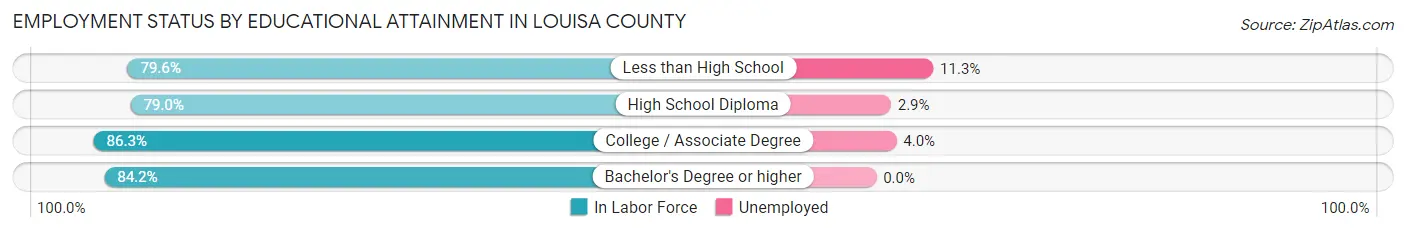
| Educational Attainment | In Labor Force | Unemployed |
| Less than High School | 592 (79.6%) | 84 (11.3%) |
| High School Diploma | 1,473 (79.0%) | 54 (2.9%) |
| College / Associate Degree | 1,769 (86.3%) | 82 (4.0%) |
| Bachelor's Degree or higher | 681 (84.2%) | 0 (0.0%) |
| Total | 4,516 (82.6%) | 219 (4.0%) |
Employment Occupations by Sex in Louisa County
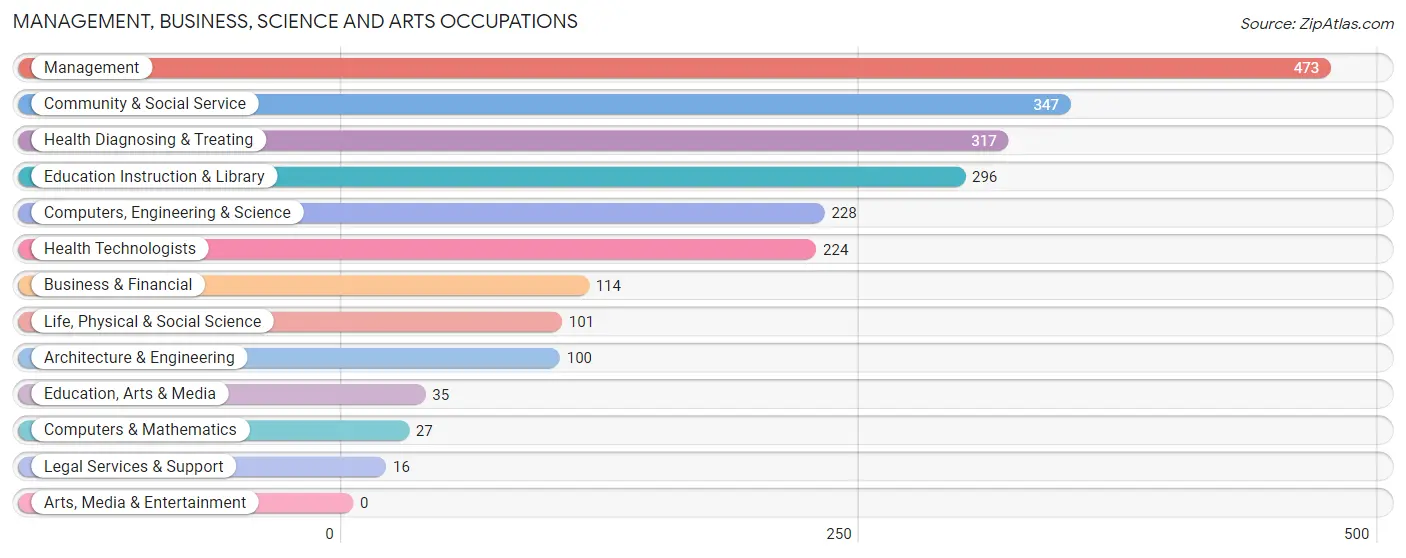
Management, Business, Science and Arts Occupations
The most common Management, Business, Science and Arts occupations in Louisa County are Management (473 | 8.8%), Community & Social Service (347 | 6.5%), Health Diagnosing & Treating (317 | 5.9%), Education Instruction & Library (296 | 5.5%), and Computers, Engineering & Science (228 | 4.2%).
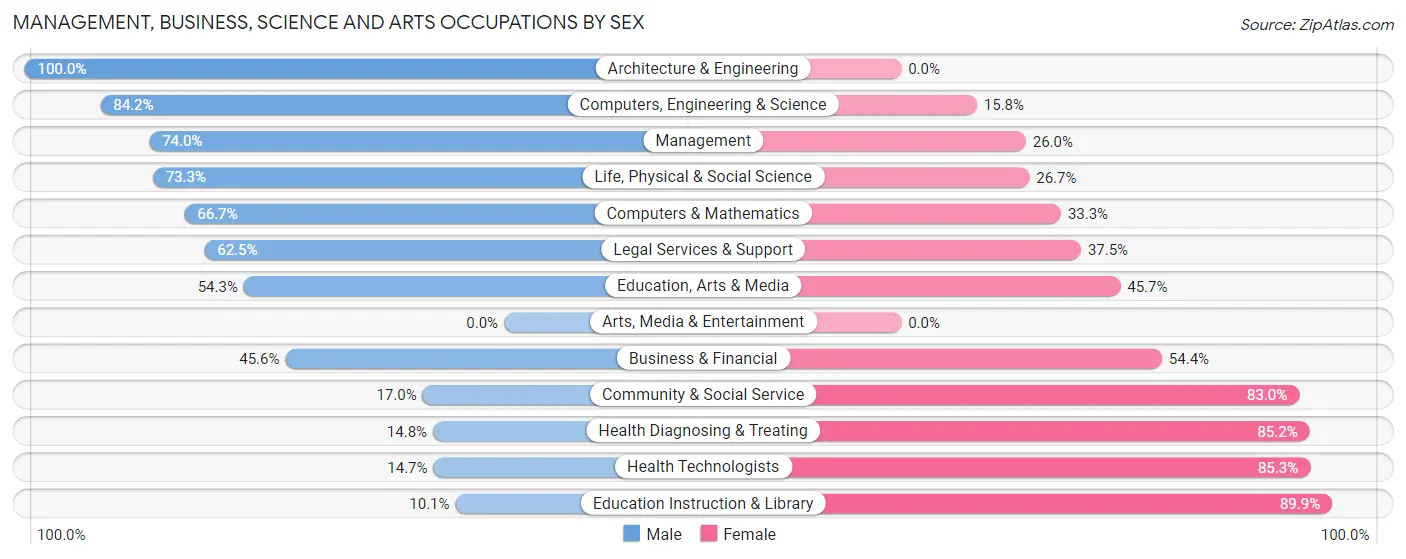
Management, Business, Science and Arts Occupations by Sex
Within the Management, Business, Science and Arts occupations in Louisa County, the most male-oriented occupations are Architecture & Engineering (100.0%), Computers, Engineering & Science (84.2%), and Management (74.0%), while the most female-oriented occupations are Education Instruction & Library (89.9%), Health Technologists (85.3%), and Health Diagnosing & Treating (85.2%).
| Occupation | Male | Female |
| Management | 350 (74.0%) | 123 (26.0%) |
| Business & Financial | 52 (45.6%) | 62 (54.4%) |
| Computers, Engineering & Science | 192 (84.2%) | 36 (15.8%) |
| Computers & Mathematics | 18 (66.7%) | 9 (33.3%) |
| Architecture & Engineering | 100 (100.0%) | 0 (0.0%) |
| Life, Physical & Social Science | 74 (73.3%) | 27 (26.7%) |
| Community & Social Service | 59 (17.0%) | 288 (83.0%) |
| Education, Arts & Media | 19 (54.3%) | 16 (45.7%) |
| Legal Services & Support | 10 (62.5%) | 6 (37.5%) |
| Education Instruction & Library | 30 (10.1%) | 266 (89.9%) |
| Arts, Media & Entertainment | 0 (0.0%) | 0 (0.0%) |
| Health Diagnosing & Treating | 47 (14.8%) | 270 (85.2%) |
| Health Technologists | 33 (14.7%) | 191 (85.3%) |
| Total (Category) | 700 (47.3%) | 779 (52.7%) |
| Total (Overall) | 3,065 (57.0%) | 2,315 (43.0%) |
Services Occupations
The most common Services occupations in Louisa County are Food Preparation & Serving (352 | 6.5%), Healthcare Support (197 | 3.7%), Cleaning & Maintenance (183 | 3.4%), Security & Protection (63 | 1.2%), and Personal Care & Service (60 | 1.1%).

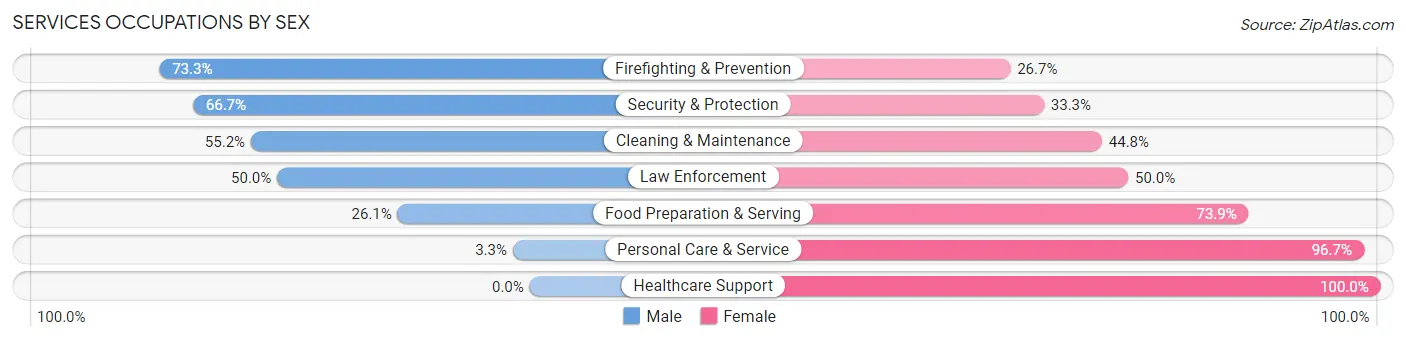
Services Occupations by Sex
Within the Services occupations in Louisa County, the most male-oriented occupations are Firefighting & Prevention (73.3%), Security & Protection (66.7%), and Cleaning & Maintenance (55.2%), while the most female-oriented occupations are Healthcare Support (100.0%), Personal Care & Service (96.7%), and Food Preparation & Serving (73.9%).
| Occupation | Male | Female |
| Healthcare Support | 0 (0.0%) | 197 (100.0%) |
| Security & Protection | 42 (66.7%) | 21 (33.3%) |
| Firefighting & Prevention | 33 (73.3%) | 12 (26.7%) |
| Law Enforcement | 9 (50.0%) | 9 (50.0%) |
| Food Preparation & Serving | 92 (26.1%) | 260 (73.9%) |
| Cleaning & Maintenance | 101 (55.2%) | 82 (44.8%) |
| Personal Care & Service | 2 (3.3%) | 58 (96.7%) |
| Total (Category) | 237 (27.7%) | 618 (72.3%) |
| Total (Overall) | 3,065 (57.0%) | 2,315 (43.0%) |
Sales and Office Occupations
The most common Sales and Office occupations in Louisa County are Office & Administration (530 | 9.9%), and Sales & Related (355 | 6.6%).

Sales and Office Occupations by Sex
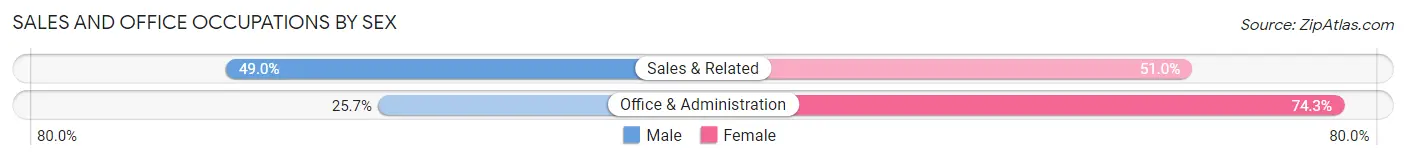
| Occupation | Male | Female |
| Sales & Related | 174 (49.0%) | 181 (51.0%) |
| Office & Administration | 136 (25.7%) | 394 (74.3%) |
| Total (Category) | 310 (35.0%) | 575 (65.0%) |
| Total (Overall) | 3,065 (57.0%) | 2,315 (43.0%) |
Natural Resources, Construction and Maintenance Occupations
The most common Natural Resources, Construction and Maintenance occupations in Louisa County are Construction & Extraction (354 | 6.6%), Installation, Maintenance & Repair (310 | 5.8%), and Farming, Fishing & Forestry (152 | 2.8%).
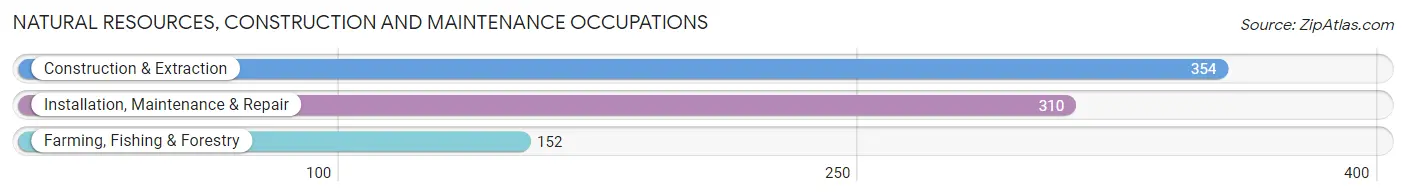
Natural Resources, Construction and Maintenance Occupations by Sex
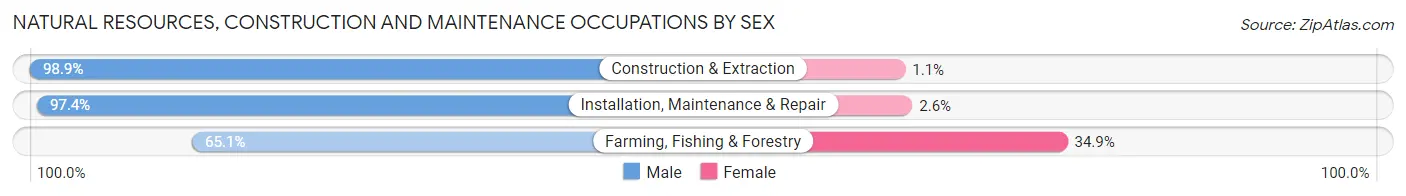
| Occupation | Male | Female |
| Farming, Fishing & Forestry | 99 (65.1%) | 53 (34.9%) |
| Construction & Extraction | 350 (98.9%) | 4 (1.1%) |
| Installation, Maintenance & Repair | 302 (97.4%) | 8 (2.6%) |
| Total (Category) | 751 (92.0%) | 65 (8.0%) |
| Total (Overall) | 3,065 (57.0%) | 2,315 (43.0%) |
Production, Transportation and Moving Occupations
The most common Production, Transportation and Moving occupations in Louisa County are Production (786 | 14.6%), Material Moving (341 | 6.3%), and Transportation (218 | 4.1%).
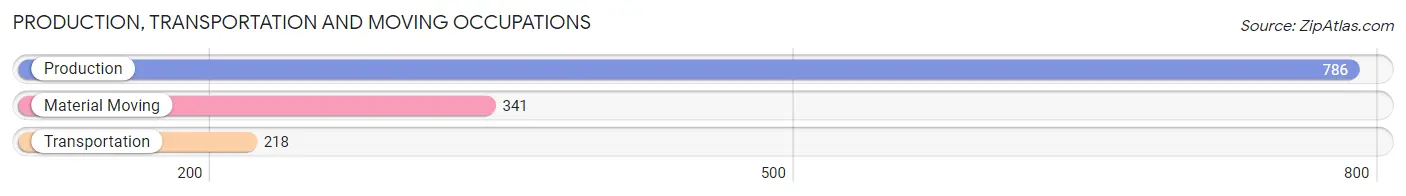
Production, Transportation and Moving Occupations by Sex
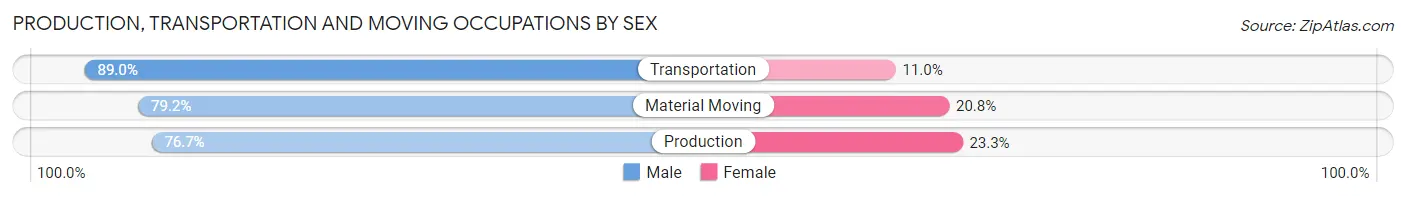
| Occupation | Male | Female |
| Production | 603 (76.7%) | 183 (23.3%) |
| Transportation | 194 (89.0%) | 24 (11.0%) |
| Material Moving | 270 (79.2%) | 71 (20.8%) |
| Total (Category) | 1,067 (79.3%) | 278 (20.7%) |
| Total (Overall) | 3,065 (57.0%) | 2,315 (43.0%) |
Employment Industries by Sex in Louisa County
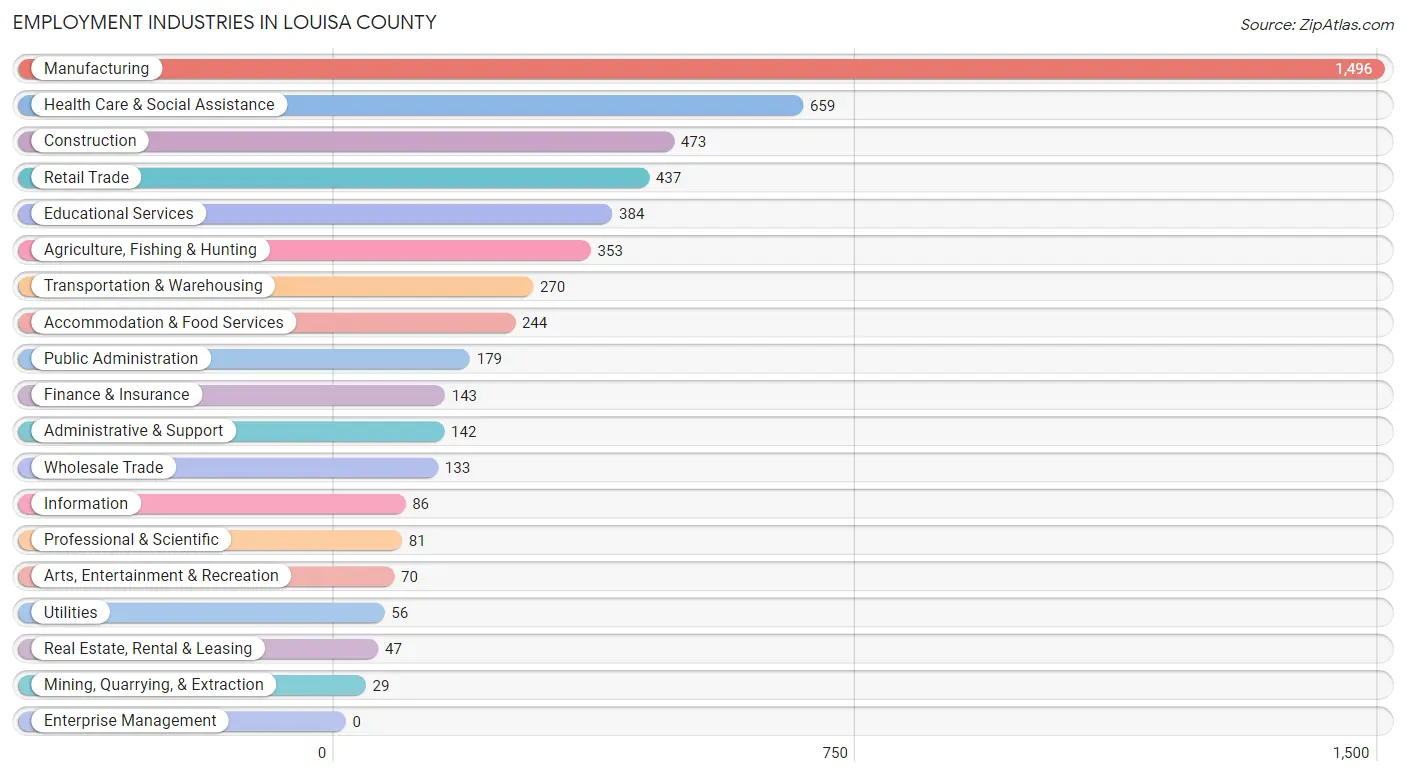
Employment Industries in Louisa County
The major employment industries in Louisa County include Manufacturing (1,496 | 27.8%), Health Care & Social Assistance (659 | 12.2%), Construction (473 | 8.8%), Retail Trade (437 | 8.1%), and Educational Services (384 | 7.1%).
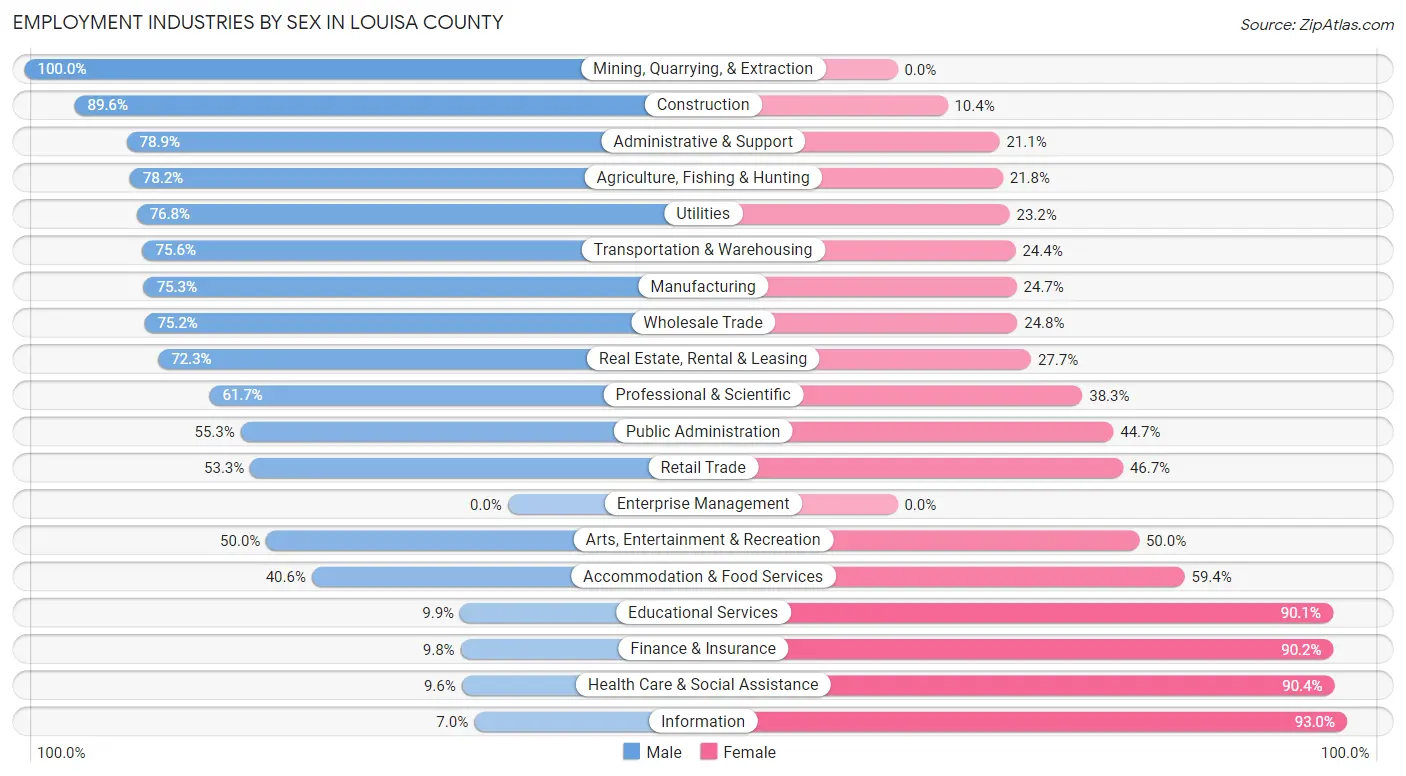
Employment Industries by Sex in Louisa County
The Louisa County industries that see more men than women are Mining, Quarrying, & Extraction (100.0%), Construction (89.6%), and Administrative & Support (78.9%), whereas the industries that tend to have a higher number of women are Information (93.0%), Health Care & Social Assistance (90.4%), and Finance & Insurance (90.2%).
| Industry | Male | Female |
| Agriculture, Fishing & Hunting | 276 (78.2%) | 77 (21.8%) |
| Mining, Quarrying, & Extraction | 29 (100.0%) | 0 (0.0%) |
| Construction | 424 (89.6%) | 49 (10.4%) |
| Manufacturing | 1,127 (75.3%) | 369 (24.7%) |
| Wholesale Trade | 100 (75.2%) | 33 (24.8%) |
| Retail Trade | 233 (53.3%) | 204 (46.7%) |
| Transportation & Warehousing | 204 (75.6%) | 66 (24.4%) |
| Utilities | 43 (76.8%) | 13 (23.2%) |
| Information | 6 (7.0%) | 80 (93.0%) |
| Finance & Insurance | 14 (9.8%) | 129 (90.2%) |
| Real Estate, Rental & Leasing | 34 (72.3%) | 13 (27.7%) |
| Professional & Scientific | 50 (61.7%) | 31 (38.3%) |
| Enterprise Management | 0 (0.0%) | 0 (0.0%) |
| Administrative & Support | 112 (78.9%) | 30 (21.1%) |
| Educational Services | 38 (9.9%) | 346 (90.1%) |
| Health Care & Social Assistance | 63 (9.6%) | 596 (90.4%) |
| Arts, Entertainment & Recreation | 35 (50.0%) | 35 (50.0%) |
| Accommodation & Food Services | 99 (40.6%) | 145 (59.4%) |
| Public Administration | 99 (55.3%) | 80 (44.7%) |
| Total | 3,065 (57.0%) | 2,315 (43.0%) |
Education in Louisa County
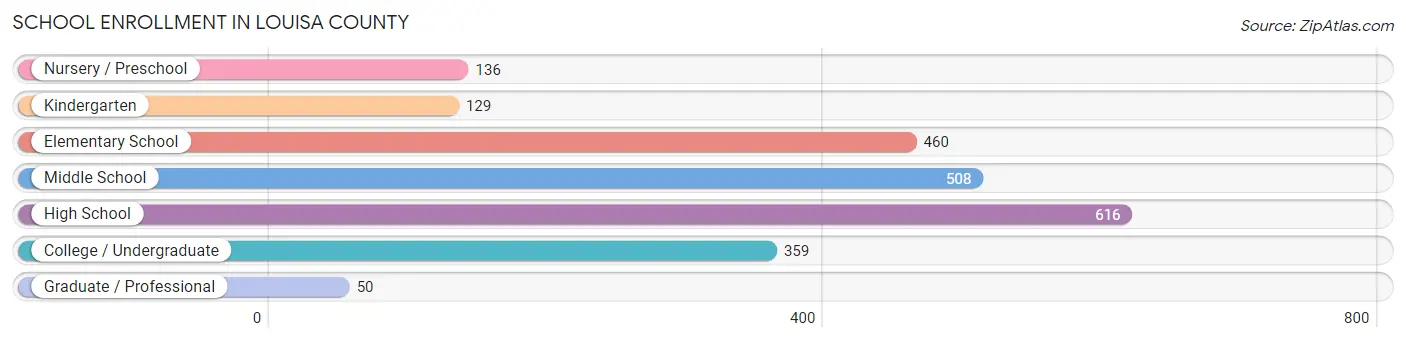
School Enrollment in Louisa County
The most common levels of schooling among the 2,258 students in Louisa County are high school (616 | 27.3%), middle school (508 | 22.5%), and elementary school (460 | 20.4%).
| School Level | # Students | % Students |
| Nursery / Preschool | 136 | 6.0% |
| Kindergarten | 129 | 5.7% |
| Elementary School | 460 | 20.4% |
| Middle School | 508 | 22.5% |
| High School | 616 | 27.3% |
| College / Undergraduate | 359 | 15.9% |
| Graduate / Professional | 50 | 2.2% |
| Total | 2,258 | 100.0% |
School Enrollment by Age by Funding Source in Louisa County
Out of a total of 2,258 students who are enrolled in schools in Louisa County, 165 (7.3%) attend a private institution, while the remaining 2,093 (92.7%) are enrolled in public schools. The age group of 35 years and over has the highest likelihood of being enrolled in private schools, with 36 (47.4% in the age bracket) enrolled. Conversely, the age group of 3 to 4 year olds has the lowest likelihood of being enrolled in a private school, with 63 (100.0% in the age bracket) attending a public institution.

| Age Bracket | Public School | Private School |
| 3 to 4 Year Olds | 63 (100.0%) | 0 (0.0%) |
| 5 to 9 Year Old | 522 (90.9%) | 52 (9.1%) |
| 10 to 14 Year Olds | 652 (95.6%) | 30 (4.4%) |
| 15 to 17 Year Olds | 426 (97.3%) | 12 (2.7%) |
| 18 to 19 Year Olds | 175 (100.0%) | 0 (0.0%) |
| 20 to 24 Year Olds | 180 (84.9%) | 32 (15.1%) |
| 25 to 34 Year Olds | 36 (94.7%) | 2 (5.3%) |
| 35 Years and over | 40 (52.6%) | 36 (47.4%) |
| Total | 2,093 (92.7%) | 165 (7.3%) |
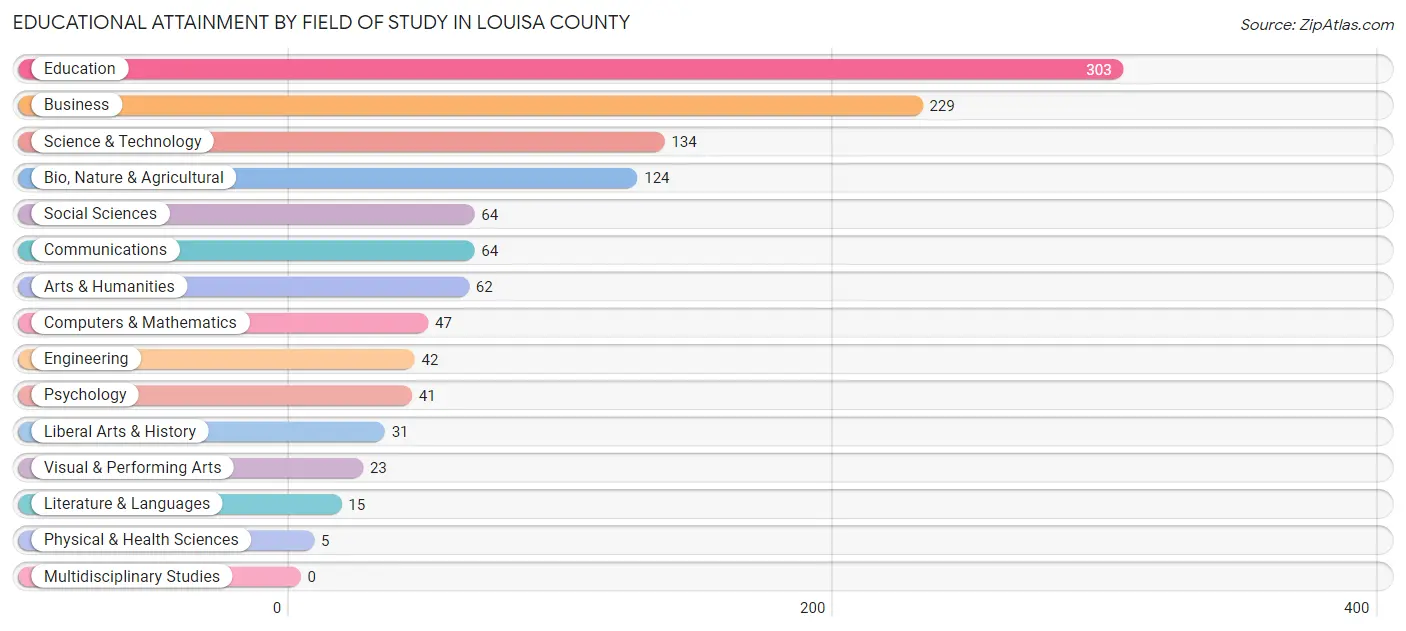
Educational Attainment by Field of Study in Louisa County
Education (303 | 25.6%), business (229 | 19.3%), science & technology (134 | 11.3%), bio, nature & agricultural (124 | 10.5%), and social sciences (64 | 5.4%) are the most common fields of study among 1,184 individuals in Louisa County who have obtained a bachelor's degree or higher.
| Field of Study | # Graduates | % Graduates |
| Computers & Mathematics | 47 | 4.0% |
| Bio, Nature & Agricultural | 124 | 10.5% |
| Physical & Health Sciences | 5 | 0.4% |
| Psychology | 41 | 3.5% |
| Social Sciences | 64 | 5.4% |
| Engineering | 42 | 3.5% |
| Multidisciplinary Studies | 0 | 0.0% |
| Science & Technology | 134 | 11.3% |
| Business | 229 | 19.3% |
| Education | 303 | 25.6% |
| Literature & Languages | 15 | 1.3% |
| Liberal Arts & History | 31 | 2.6% |
| Visual & Performing Arts | 23 | 1.9% |
| Communications | 64 | 5.4% |
| Arts & Humanities | 62 | 5.2% |
| Total | 1,184 | 100.0% |
Transportation & Commute in Louisa County
Vehicle Availability by Sex in Louisa County
The most prevalent vehicle ownership categories in Louisa County are males with 2 vehicles (1,149, accounting for 37.9%) and females with 2 vehicles (804, making up 49.8%).
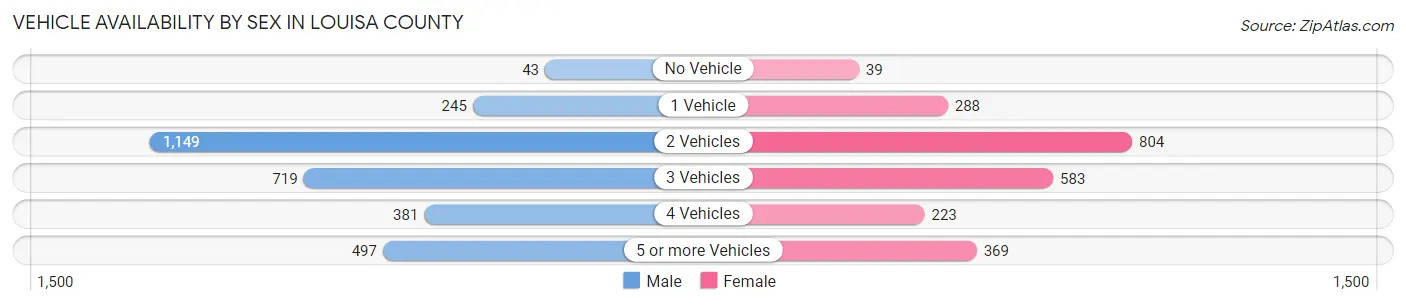
| Vehicles Available | Male | Female |
| No Vehicle | 43 (1.4%) | 39 (1.7%) |
| 1 Vehicle | 245 (8.1%) | 288 (12.5%) |
| 2 Vehicles | 1,149 (37.9%) | 804 (34.9%) |
| 3 Vehicles | 719 (23.7%) | 583 (25.3%) |
| 4 Vehicles | 381 (12.6%) | 223 (9.7%) |
| 5 or more Vehicles | 497 (16.4%) | 369 (16.0%) |
| Total | 3,034 (100.0%) | 2,306 (100.0%) |
Commute Time in Louisa County
The most frequently occuring commute durations in Louisa County are 30 to 34 minutes (832 commuters, 16.2%), 5 to 9 minutes (795 commuters, 15.5%), and 20 to 24 minutes (711 commuters, 13.8%).
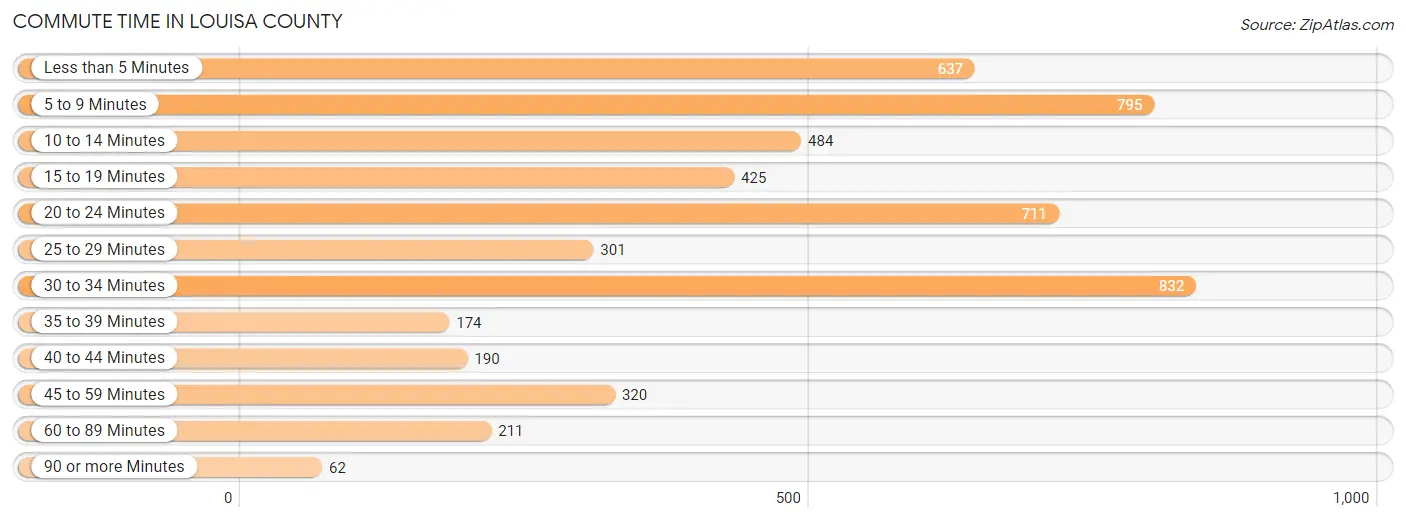
| Commute Time | # Commuters | % Commuters |
| Less than 5 Minutes | 637 | 12.4% |
| 5 to 9 Minutes | 795 | 15.5% |
| 10 to 14 Minutes | 484 | 9.4% |
| 15 to 19 Minutes | 425 | 8.3% |
| 20 to 24 Minutes | 711 | 13.8% |
| 25 to 29 Minutes | 301 | 5.9% |
| 30 to 34 Minutes | 832 | 16.2% |
| 35 to 39 Minutes | 174 | 3.4% |
| 40 to 44 Minutes | 190 | 3.7% |
| 45 to 59 Minutes | 320 | 6.2% |
| 60 to 89 Minutes | 211 | 4.1% |
| 90 or more Minutes | 62 | 1.2% |
Commute Time by Sex in Louisa County
The most common commute times in Louisa County are 30 to 34 minutes (527 commuters, 18.1%) for males and 5 to 9 minutes (366 commuters, 16.4%) for females.
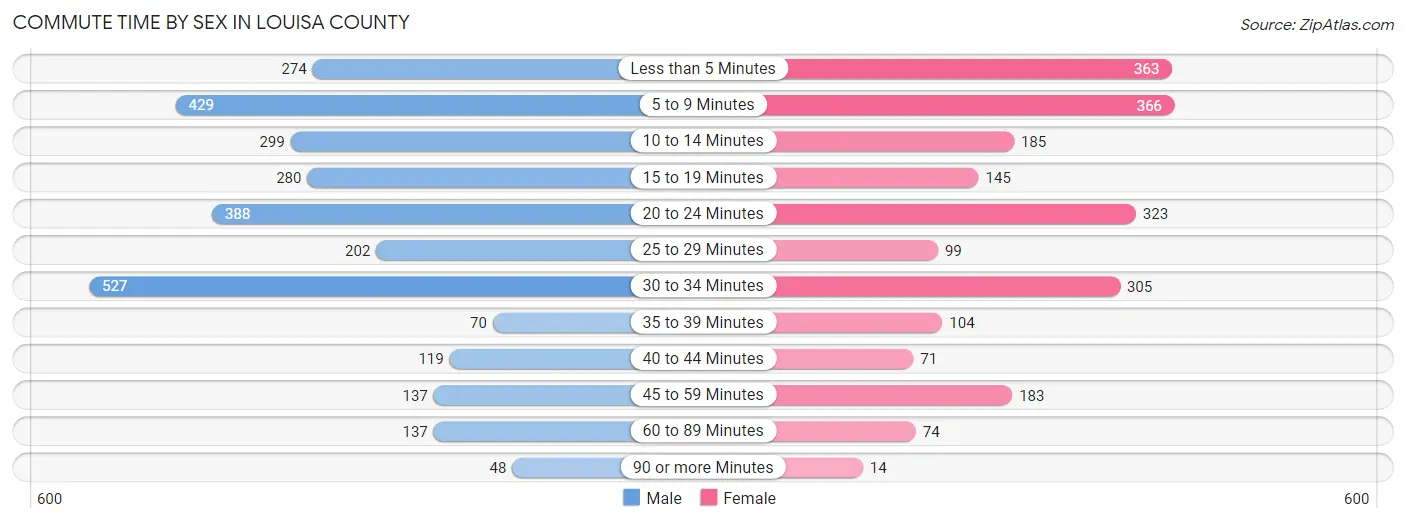
| Commute Time | Male | Female |
| Less than 5 Minutes | 274 (9.4%) | 363 (16.3%) |
| 5 to 9 Minutes | 429 (14.7%) | 366 (16.4%) |
| 10 to 14 Minutes | 299 (10.3%) | 185 (8.3%) |
| 15 to 19 Minutes | 280 (9.6%) | 145 (6.5%) |
| 20 to 24 Minutes | 388 (13.3%) | 323 (14.5%) |
| 25 to 29 Minutes | 202 (6.9%) | 99 (4.4%) |
| 30 to 34 Minutes | 527 (18.1%) | 305 (13.7%) |
| 35 to 39 Minutes | 70 (2.4%) | 104 (4.7%) |
| 40 to 44 Minutes | 119 (4.1%) | 71 (3.2%) |
| 45 to 59 Minutes | 137 (4.7%) | 183 (8.2%) |
| 60 to 89 Minutes | 137 (4.7%) | 74 (3.3%) |
| 90 or more Minutes | 48 (1.7%) | 14 (0.6%) |
Time of Departure to Work by Sex in Louisa County
The most frequent times of departure to work in Louisa County are 6:30 AM to 6:59 AM (450, 15.5%) for males and 7:30 AM to 7:59 AM (392, 17.6%) for females.
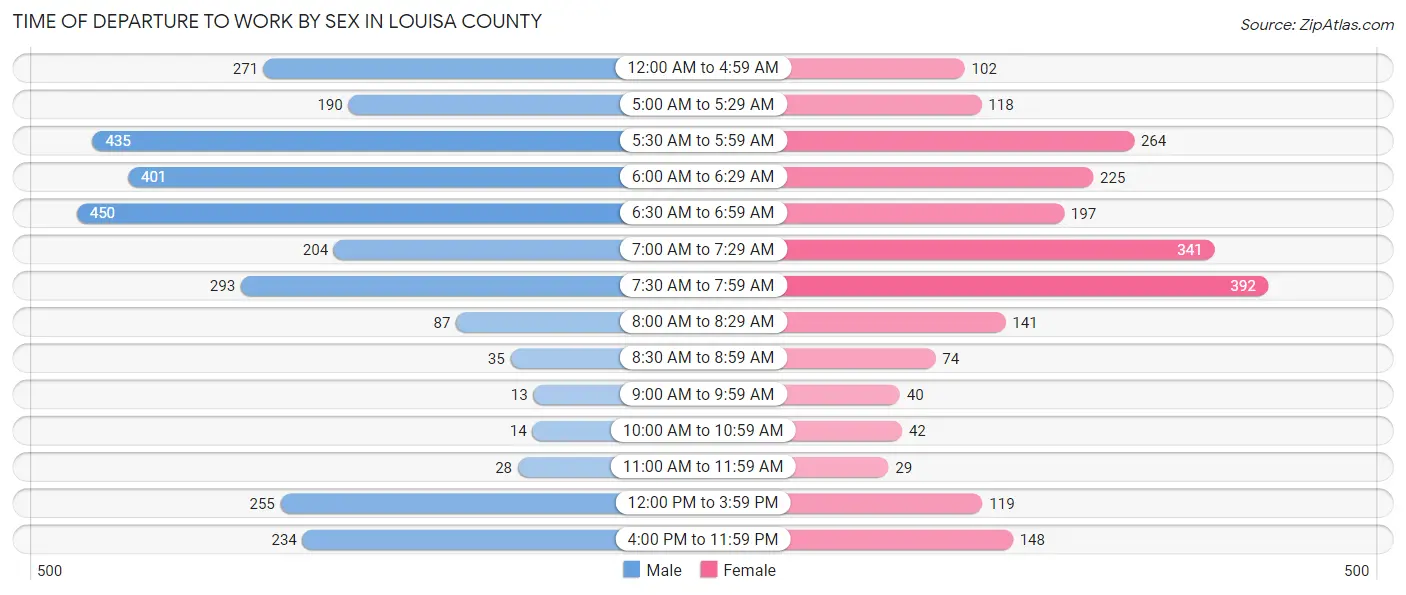
| Time of Departure | Male | Female |
| 12:00 AM to 4:59 AM | 271 (9.3%) | 102 (4.6%) |
| 5:00 AM to 5:29 AM | 190 (6.5%) | 118 (5.3%) |
| 5:30 AM to 5:59 AM | 435 (14.9%) | 264 (11.8%) |
| 6:00 AM to 6:29 AM | 401 (13.8%) | 225 (10.1%) |
| 6:30 AM to 6:59 AM | 450 (15.5%) | 197 (8.8%) |
| 7:00 AM to 7:29 AM | 204 (7.0%) | 341 (15.3%) |
| 7:30 AM to 7:59 AM | 293 (10.1%) | 392 (17.6%) |
| 8:00 AM to 8:29 AM | 87 (3.0%) | 141 (6.3%) |
| 8:30 AM to 8:59 AM | 35 (1.2%) | 74 (3.3%) |
| 9:00 AM to 9:59 AM | 13 (0.4%) | 40 (1.8%) |
| 10:00 AM to 10:59 AM | 14 (0.5%) | 42 (1.9%) |
| 11:00 AM to 11:59 AM | 28 (1.0%) | 29 (1.3%) |
| 12:00 PM to 3:59 PM | 255 (8.8%) | 119 (5.3%) |
| 4:00 PM to 11:59 PM | 234 (8.0%) | 148 (6.6%) |
| Total | 2,910 (100.0%) | 2,232 (100.0%) |
Housing Occupancy in Louisa County
Occupancy by Ownership in Louisa County
Of the total 4,112 dwellings in Louisa County, owner-occupied units account for 3,202 (77.9%), while renter-occupied units make up 910 (22.1%).
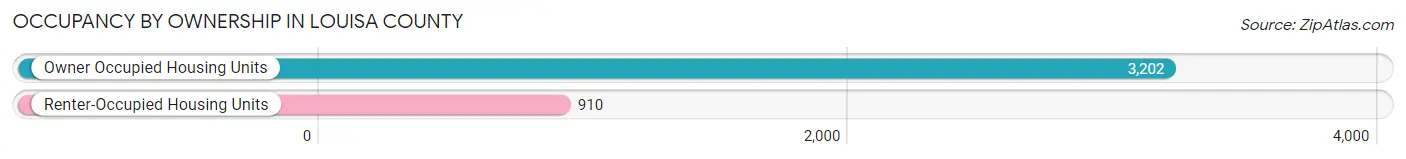
| Occupancy | # Housing Units | % Housing Units |
| Owner Occupied Housing Units | 3,202 | 77.9% |
| Renter-Occupied Housing Units | 910 | 22.1% |
| Total Occupied Housing Units | 4,112 | 100.0% |
Occupancy by Household Size in Louisa County

| Household Size | # Housing Units | % Housing Units |
| 1-Person Household | 899 | 21.9% |
| 2-Person Household | 1,546 | 37.6% |
| 3-Person Household | 612 | 14.9% |
| 4+ Person Household | 1,055 | 25.7% |
| Total Housing Units | 4,112 | 100.0% |
Occupancy by Ownership by Household Size in Louisa County
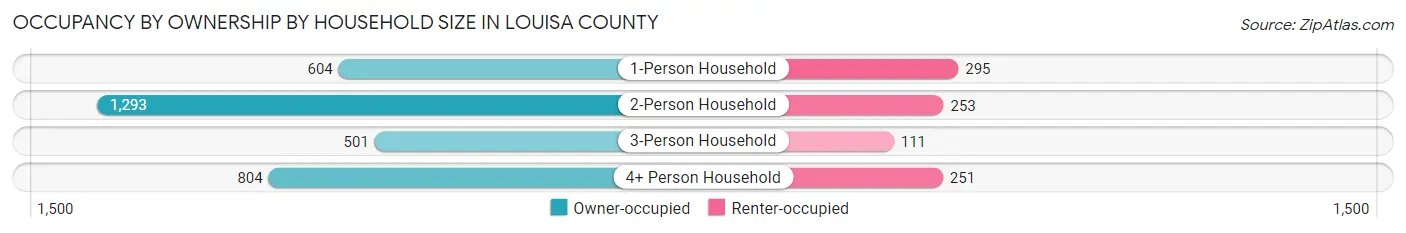
| Household Size | Owner-occupied | Renter-occupied |
| 1-Person Household | 604 (67.2%) | 295 (32.8%) |
| 2-Person Household | 1,293 (83.6%) | 253 (16.4%) |
| 3-Person Household | 501 (81.9%) | 111 (18.1%) |
| 4+ Person Household | 804 (76.2%) | 251 (23.8%) |
| Total Housing Units | 3,202 (77.9%) | 910 (22.1%) |
Occupancy by Educational Attainment in Louisa County
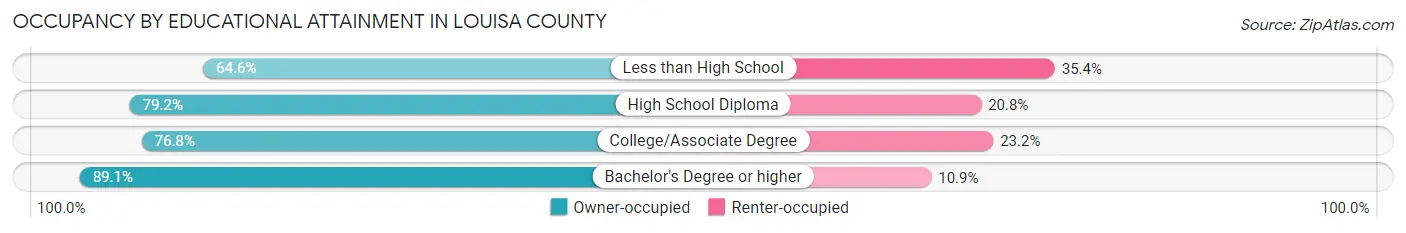
| Household Size | Owner-occupied | Renter-occupied |
| Less than High School | 301 (64.6%) | 165 (35.4%) |
| High School Diploma | 1,346 (79.2%) | 354 (20.8%) |
| College/Associate Degree | 1,115 (76.8%) | 337 (23.2%) |
| Bachelor's Degree or higher | 440 (89.1%) | 54 (10.9%) |
Occupancy by Age of Householder in Louisa County

| Age Bracket | # Households | % Households |
| Under 35 Years | 668 | 16.3% |
| 35 to 44 Years | 681 | 16.6% |
| 45 to 54 Years | 617 | 15.0% |
| 55 to 64 Years | 907 | 22.1% |
| 65 to 74 Years | 646 | 15.7% |
| 75 to 84 Years | 431 | 10.5% |
| 85 Years and Over | 162 | 3.9% |
| Total | 4,112 | 100.0% |
Housing Finances in Louisa County
Median Income by Occupancy in Louisa County
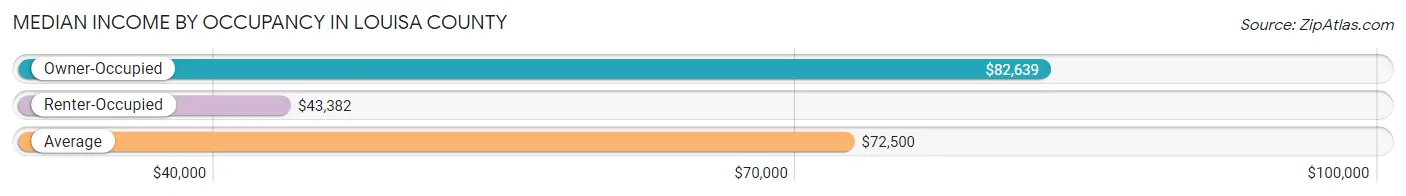
| Occupancy Type | # Households | Median Income |
| Owner-Occupied | 3,202 (77.9%) | $82,639 |
| Renter-Occupied | 910 (22.1%) | $43,382 |
| Average | 4,112 (100.0%) | $72,500 |
Occupancy by Householder Income Bracket in Louisa County
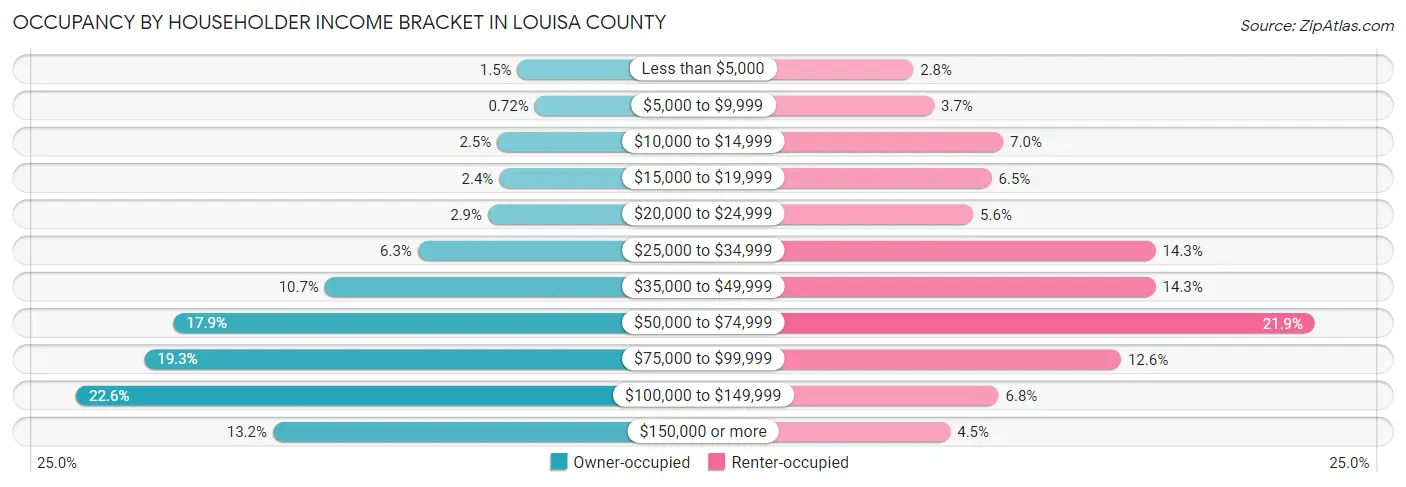
| Income Bracket | Owner-occupied | Renter-occupied |
| Less than $5,000 | 49 (1.5%) | 25 (2.8%) |
| $5,000 to $9,999 | 23 (0.7%) | 34 (3.7%) |
| $10,000 to $14,999 | 80 (2.5%) | 64 (7.0%) |
| $15,000 to $19,999 | 77 (2.4%) | 59 (6.5%) |
| $20,000 to $24,999 | 94 (2.9%) | 51 (5.6%) |
| $25,000 to $34,999 | 201 (6.3%) | 130 (14.3%) |
| $35,000 to $49,999 | 343 (10.7%) | 130 (14.3%) |
| $50,000 to $74,999 | 573 (17.9%) | 199 (21.9%) |
| $75,000 to $99,999 | 618 (19.3%) | 115 (12.6%) |
| $100,000 to $149,999 | 722 (22.6%) | 62 (6.8%) |
| $150,000 or more | 422 (13.2%) | 41 (4.5%) |
| Total | 3,202 (100.0%) | 910 (100.0%) |
Monthly Housing Cost Tiers in Louisa County
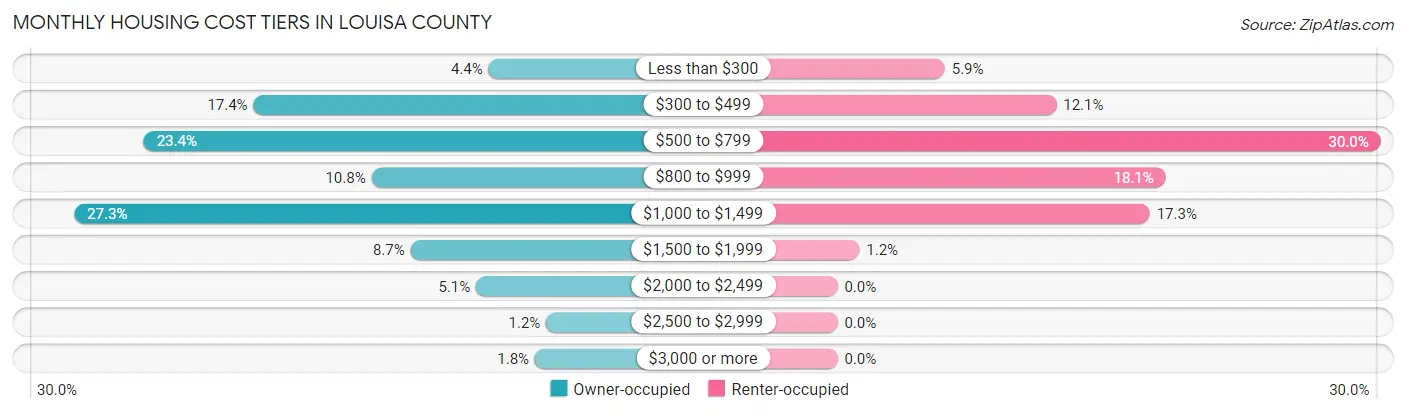
| Monthly Cost | Owner-occupied | Renter-occupied |
| Less than $300 | 140 (4.4%) | 54 (5.9%) |
| $300 to $499 | 556 (17.4%) | 110 (12.1%) |
| $500 to $799 | 750 (23.4%) | 273 (30.0%) |
| $800 to $999 | 347 (10.8%) | 165 (18.1%) |
| $1,000 to $1,499 | 873 (27.3%) | 157 (17.2%) |
| $1,500 to $1,999 | 278 (8.7%) | 11 (1.2%) |
| $2,000 to $2,499 | 162 (5.1%) | 0 (0.0%) |
| $2,500 to $2,999 | 38 (1.2%) | 0 (0.0%) |
| $3,000 or more | 58 (1.8%) | 0 (0.0%) |
| Total | 3,202 (100.0%) | 910 (100.0%) |
Physical Housing Characteristics in Louisa County
Housing Structures in Louisa County
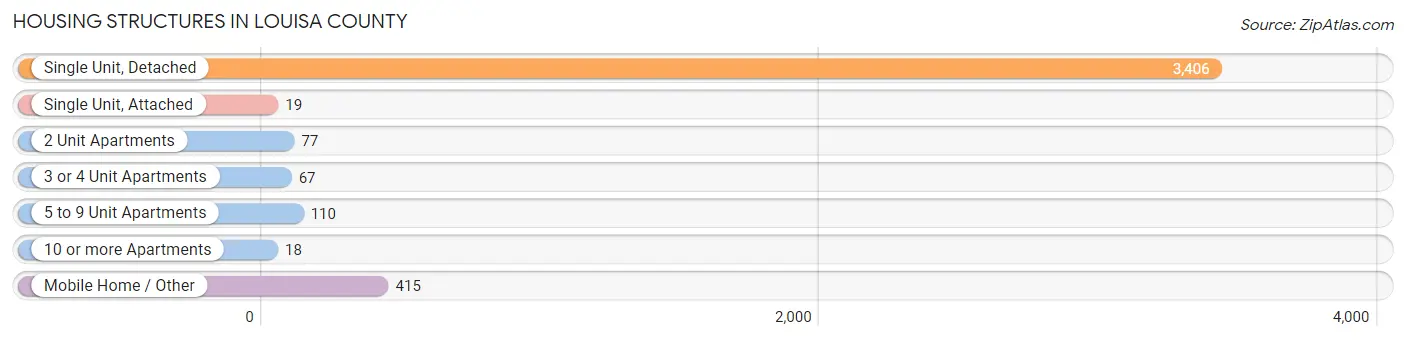
| Structure Type | # Housing Units | % Housing Units |
| Single Unit, Detached | 3,406 | 82.8% |
| Single Unit, Attached | 19 | 0.5% |
| 2 Unit Apartments | 77 | 1.9% |
| 3 or 4 Unit Apartments | 67 | 1.6% |
| 5 to 9 Unit Apartments | 110 | 2.7% |
| 10 or more Apartments | 18 | 0.4% |
| Mobile Home / Other | 415 | 10.1% |
| Total | 4,112 | 100.0% |
Housing Structures by Occupancy in Louisa County
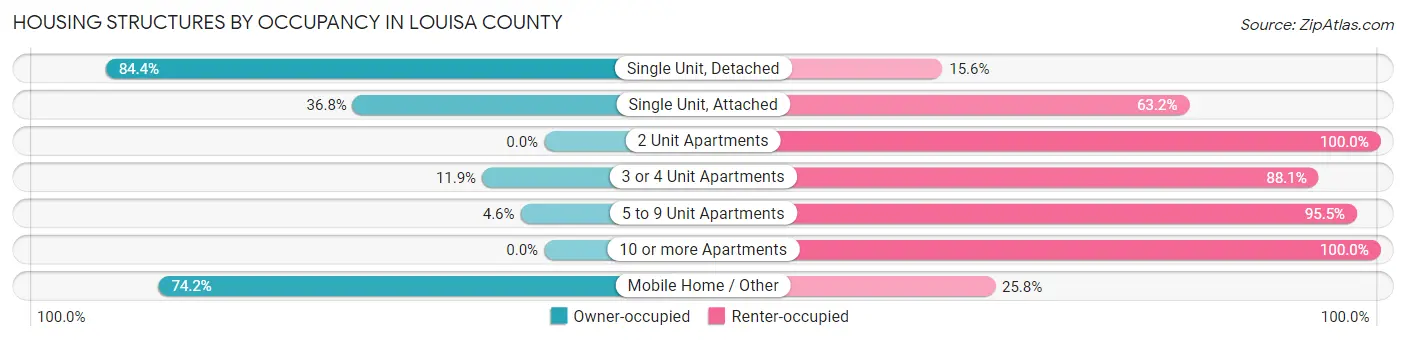
| Structure Type | Owner-occupied | Renter-occupied |
| Single Unit, Detached | 2,874 (84.4%) | 532 (15.6%) |
| Single Unit, Attached | 7 (36.8%) | 12 (63.2%) |
| 2 Unit Apartments | 0 (0.0%) | 77 (100.0%) |
| 3 or 4 Unit Apartments | 8 (11.9%) | 59 (88.1%) |
| 5 to 9 Unit Apartments | 5 (4.5%) | 105 (95.5%) |
| 10 or more Apartments | 0 (0.0%) | 18 (100.0%) |
| Mobile Home / Other | 308 (74.2%) | 107 (25.8%) |
| Total | 3,202 (77.9%) | 910 (22.1%) |
Housing Structures by Number of Rooms in Louisa County
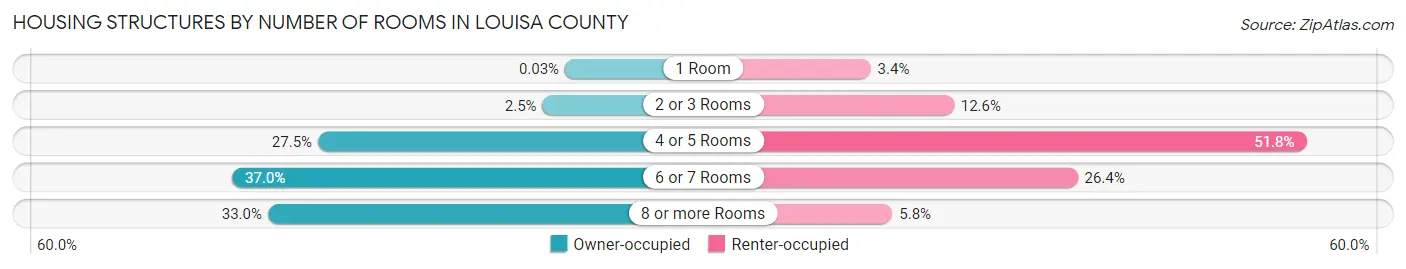
| Number of Rooms | Owner-occupied | Renter-occupied |
| 1 Room | 1 (0.0%) | 31 (3.4%) |
| 2 or 3 Rooms | 81 (2.5%) | 115 (12.6%) |
| 4 or 5 Rooms | 879 (27.5%) | 471 (51.8%) |
| 6 or 7 Rooms | 1,184 (37.0%) | 240 (26.4%) |
| 8 or more Rooms | 1,057 (33.0%) | 53 (5.8%) |
| Total | 3,202 (100.0%) | 910 (100.0%) |
Housing Structure by Heating Type in Louisa County
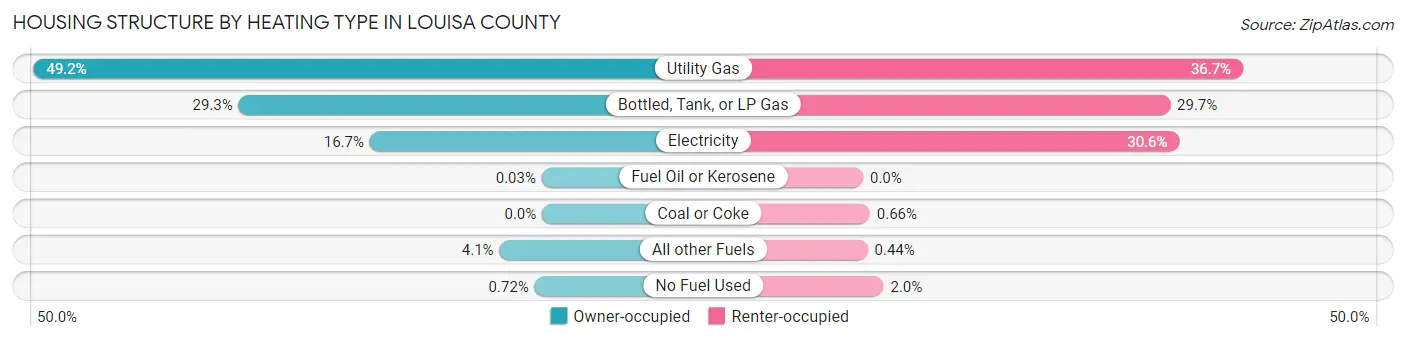
| Heating Type | Owner-occupied | Renter-occupied |
| Utility Gas | 1,574 (49.2%) | 334 (36.7%) |
| Bottled, Tank, or LP Gas | 939 (29.3%) | 270 (29.7%) |
| Electricity | 533 (16.7%) | 278 (30.5%) |
| Fuel Oil or Kerosene | 1 (0.0%) | 0 (0.0%) |
| Coal or Coke | 0 (0.0%) | 6 (0.7%) |
| All other Fuels | 132 (4.1%) | 4 (0.4%) |
| No Fuel Used | 23 (0.7%) | 18 (2.0%) |
| Total | 3,202 (100.0%) | 910 (100.0%) |
Household Vehicle Usage in Louisa County
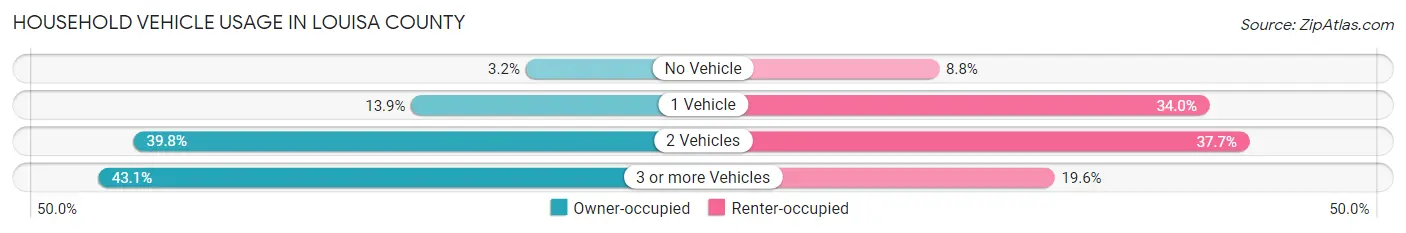
| Vehicles per Household | Owner-occupied | Renter-occupied |
| No Vehicle | 103 (3.2%) | 80 (8.8%) |
| 1 Vehicle | 445 (13.9%) | 309 (34.0%) |
| 2 Vehicles | 1,275 (39.8%) | 343 (37.7%) |
| 3 or more Vehicles | 1,379 (43.1%) | 178 (19.6%) |
| Total | 3,202 (100.0%) | 910 (100.0%) |
Real Estate & Mortgages in Louisa County
Real Estate and Mortgage Overview in Louisa County
| Characteristic | Without Mortgage | With Mortgage |
| Housing Units | 1,455 | 1,747 |
| Median Property Value | $108,200 | $146,900 |
| Median Household Income | $61,328 | $312 |
| Monthly Housing Costs | $515 | $58 |
| Real Estate Taxes | $1,377 | $8 |
Property Value by Mortgage Status in Louisa County

| Property Value | Without Mortgage | With Mortgage |
| Less than $50,000 | 303 (20.8%) | 16 (0.9%) |
| $50,000 to $99,999 | 367 (25.2%) | 406 (23.2%) |
| $100,000 to $299,999 | 615 (42.3%) | 1,029 (58.9%) |
| $300,000 to $499,999 | 136 (9.3%) | 203 (11.6%) |
| $500,000 to $749,999 | 34 (2.3%) | 77 (4.4%) |
| $750,000 to $999,999 | 0 (0.0%) | 3 (0.2%) |
| $1,000,000 or more | 0 (0.0%) | 13 (0.7%) |
| Total | 1,455 (100.0%) | 1,747 (100.0%) |
Household Income by Mortgage Status in Louisa County
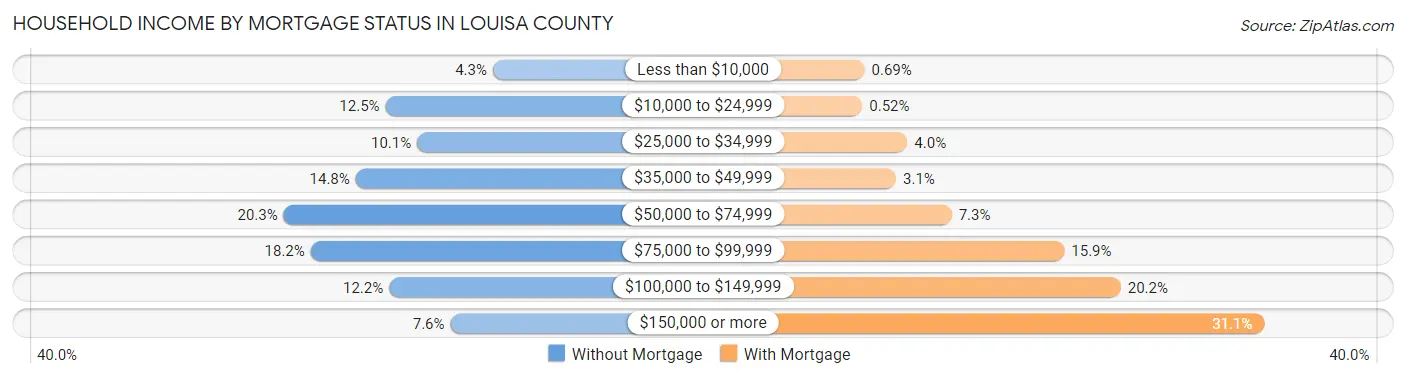
| Household Income | Without Mortgage | With Mortgage |
| Less than $10,000 | 63 (4.3%) | 12 (0.7%) |
| $10,000 to $24,999 | 182 (12.5%) | 9 (0.5%) |
| $25,000 to $34,999 | 147 (10.1%) | 69 (4.0%) |
| $35,000 to $49,999 | 215 (14.8%) | 54 (3.1%) |
| $50,000 to $74,999 | 295 (20.3%) | 128 (7.3%) |
| $75,000 to $99,999 | 265 (18.2%) | 278 (15.9%) |
| $100,000 to $149,999 | 178 (12.2%) | 353 (20.2%) |
| $150,000 or more | 110 (7.6%) | 544 (31.1%) |
| Total | 1,455 (100.0%) | 1,747 (100.0%) |
Property Value to Household Income Ratio in Louisa County
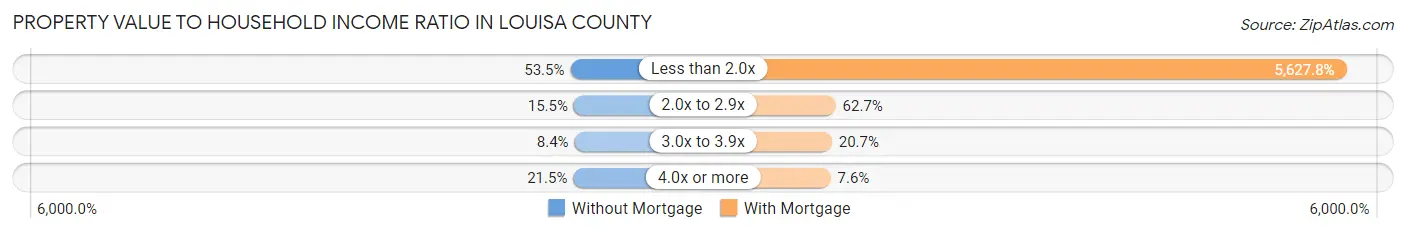
| Value-to-Income Ratio | Without Mortgage | With Mortgage |
| Less than 2.0x | 779 (53.5%) | 98,317 (5,627.8%) |
| 2.0x to 2.9x | 226 (15.5%) | 1,095 (62.7%) |
| 3.0x to 3.9x | 122 (8.4%) | 361 (20.7%) |
| 4.0x or more | 313 (21.5%) | 133 (7.6%) |
| Total | 1,455 (100.0%) | 1,747 (100.0%) |
Real Estate Taxes by Mortgage Status in Louisa County
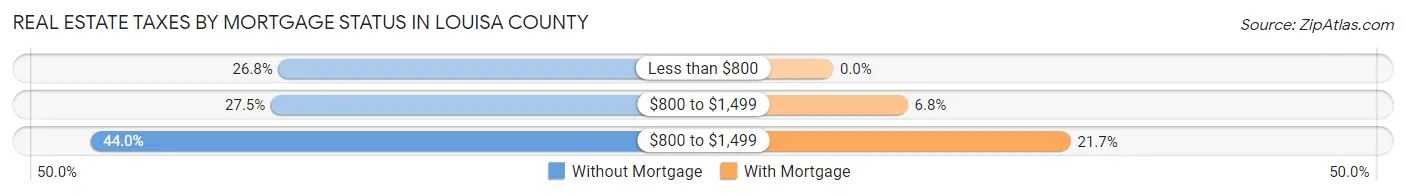
| Property Taxes | Without Mortgage | With Mortgage |
| Less than $800 | 390 (26.8%) | 0 (0.0%) |
| $800 to $1,499 | 400 (27.5%) | 119 (6.8%) |
| $800 to $1,499 | 640 (44.0%) | 379 (21.7%) |
| Total | 1,455 (100.0%) | 1,747 (100.0%) |
Health & Disability in Louisa County
Health Insurance Coverage by Age in Louisa County
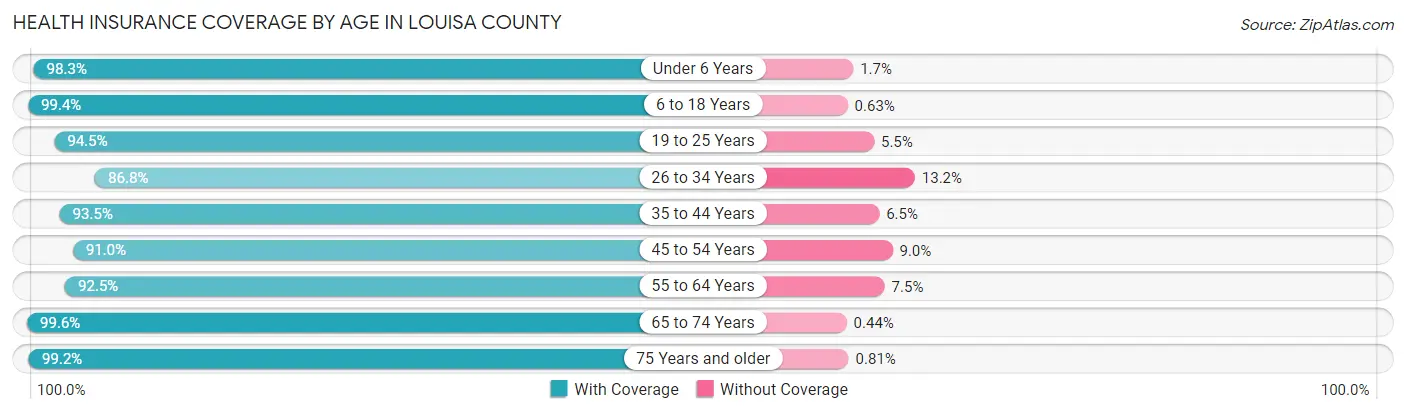
| Age Bracket | With Coverage | Without Coverage |
| Under 6 Years | 764 (98.3%) | 13 (1.7%) |
| 6 to 18 Years | 1,748 (99.4%) | 11 (0.6%) |
| 19 to 25 Years | 802 (94.5%) | 47 (5.5%) |
| 26 to 34 Years | 924 (86.8%) | 140 (13.2%) |
| 35 to 44 Years | 1,249 (93.5%) | 87 (6.5%) |
| 45 to 54 Years | 1,175 (91.0%) | 116 (9.0%) |
| 55 to 64 Years | 1,486 (92.5%) | 121 (7.5%) |
| 65 to 74 Years | 1,124 (99.6%) | 5 (0.4%) |
| 75 Years and older | 857 (99.2%) | 7 (0.8%) |
| Total | 10,129 (94.9%) | 547 (5.1%) |
Health Insurance Coverage by Citizenship Status in Louisa County
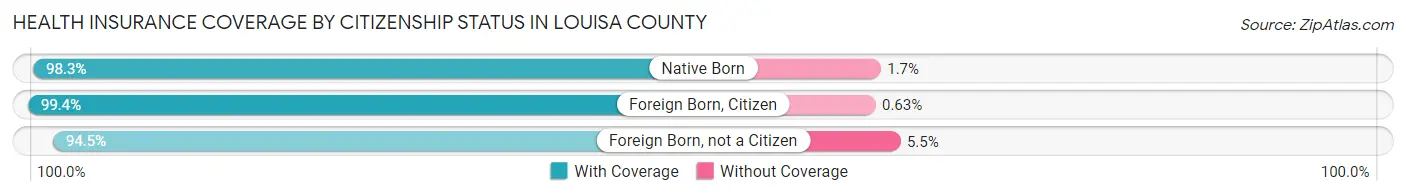
| Citizenship Status | With Coverage | Without Coverage |
| Native Born | 764 (98.3%) | 13 (1.7%) |
| Foreign Born, Citizen | 1,748 (99.4%) | 11 (0.6%) |
| Foreign Born, not a Citizen | 802 (94.5%) | 47 (5.5%) |
Health Insurance Coverage by Household Income in Louisa County
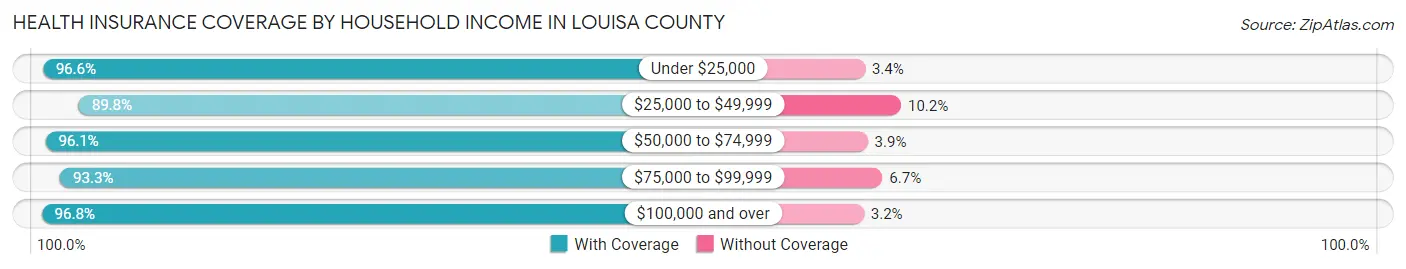
| Household Income | With Coverage | Without Coverage |
| Under $25,000 | 852 (96.6%) | 30 (3.4%) |
| $25,000 to $49,999 | 1,548 (89.8%) | 175 (10.2%) |
| $50,000 to $74,999 | 1,843 (96.1%) | 75 (3.9%) |
| $75,000 to $99,999 | 1,890 (93.3%) | 135 (6.7%) |
| $100,000 and over | 3,995 (96.8%) | 132 (3.2%) |
Public vs Private Health Insurance Coverage by Age in Louisa County
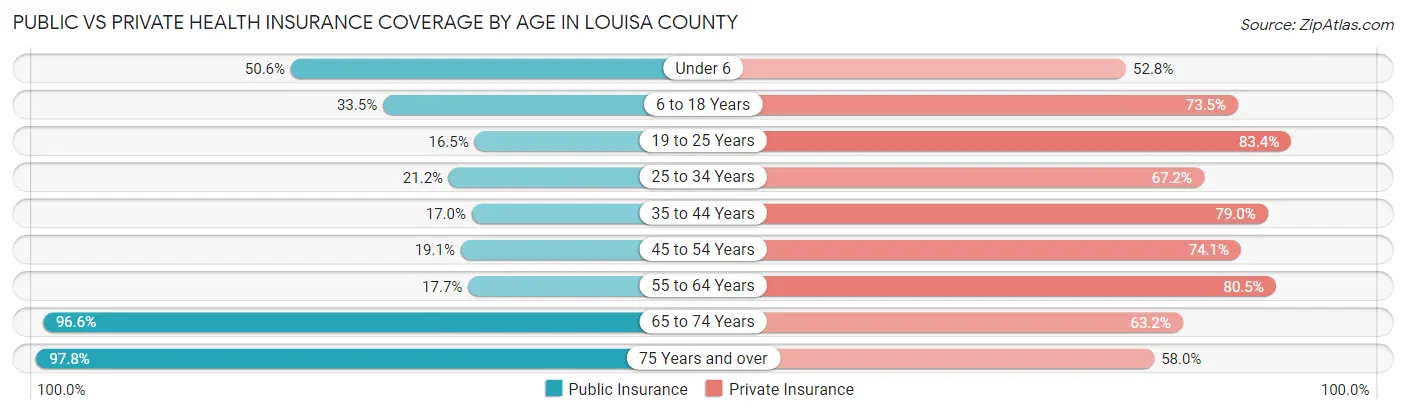
| Age Bracket | Public Insurance | Private Insurance |
| Under 6 | 393 (50.6%) | 410 (52.8%) |
| 6 to 18 Years | 589 (33.5%) | 1,293 (73.5%) |
| 19 to 25 Years | 140 (16.5%) | 708 (83.4%) |
| 25 to 34 Years | 226 (21.2%) | 715 (67.2%) |
| 35 to 44 Years | 227 (17.0%) | 1,056 (79.0%) |
| 45 to 54 Years | 246 (19.1%) | 956 (74.1%) |
| 55 to 64 Years | 284 (17.7%) | 1,294 (80.5%) |
| 65 to 74 Years | 1,091 (96.6%) | 714 (63.2%) |
| 75 Years and over | 845 (97.8%) | 501 (58.0%) |
| Total | 4,041 (37.9%) | 7,647 (71.6%) |
Disability Status by Sex by Age in Louisa County

| Age Bracket | Male | Female |
| Under 5 Years | 0 (0.0%) | 0 (0.0%) |
| 5 to 17 Years | 71 (7.6%) | 53 (6.4%) |
| 18 to 34 Years | 66 (5.7%) | 27 (3.0%) |
| 35 to 64 Years | 205 (9.5%) | 270 (13.0%) |
| 65 to 74 Years | 214 (37.7%) | 221 (39.3%) |
| 75 Years and over | 135 (37.0%) | 249 (49.9%) |
Disability Class by Sex by Age in Louisa County
Disability Class: Hearing Difficulty
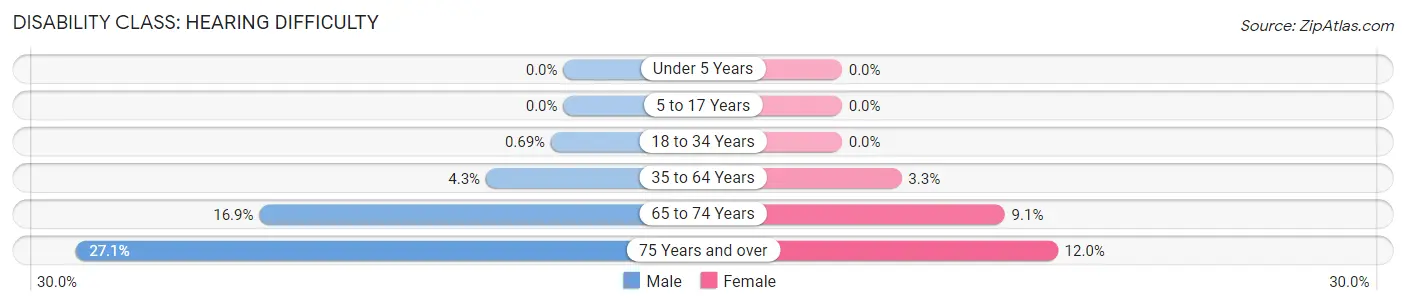
| Age Bracket | Male | Female |
| Under 5 Years | 0 (0.0%) | 0 (0.0%) |
| 5 to 17 Years | 0 (0.0%) | 0 (0.0%) |
| 18 to 34 Years | 8 (0.7%) | 0 (0.0%) |
| 35 to 64 Years | 93 (4.3%) | 69 (3.3%) |
| 65 to 74 Years | 96 (16.9%) | 51 (9.1%) |
| 75 Years and over | 99 (27.1%) | 60 (12.0%) |
Disability Class: Vision Difficulty
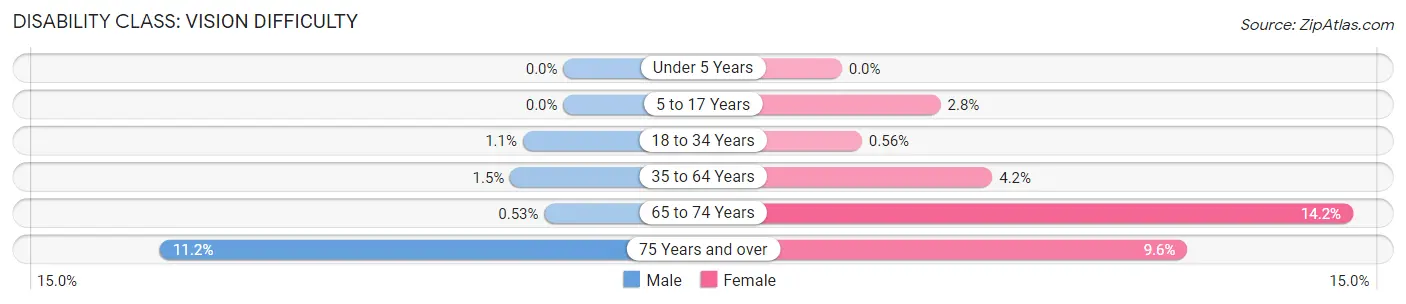
| Age Bracket | Male | Female |
| Under 5 Years | 0 (0.0%) | 0 (0.0%) |
| 5 to 17 Years | 0 (0.0%) | 23 (2.8%) |
| 18 to 34 Years | 13 (1.1%) | 5 (0.6%) |
| 35 to 64 Years | 32 (1.5%) | 87 (4.2%) |
| 65 to 74 Years | 3 (0.5%) | 80 (14.2%) |
| 75 Years and over | 41 (11.2%) | 48 (9.6%) |
Disability Class: Cognitive Difficulty
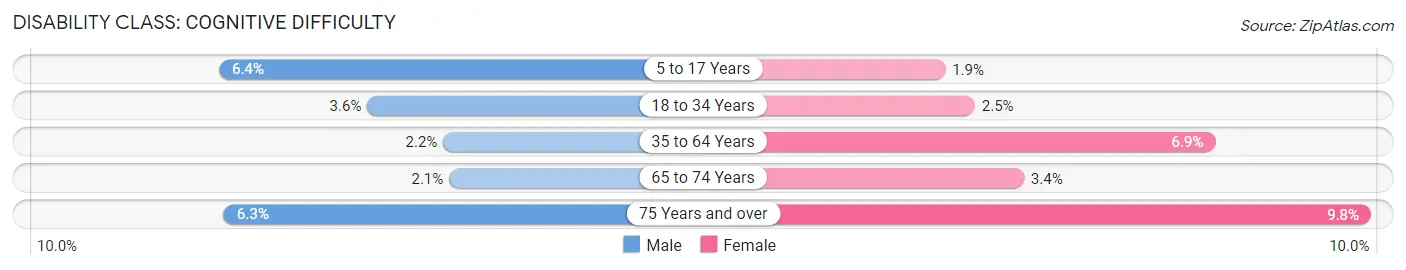
| Age Bracket | Male | Female |
| 5 to 17 Years | 60 (6.4%) | 16 (1.9%) |
| 18 to 34 Years | 42 (3.6%) | 22 (2.5%) |
| 35 to 64 Years | 48 (2.2%) | 144 (6.9%) |
| 65 to 74 Years | 12 (2.1%) | 19 (3.4%) |
| 75 Years and over | 23 (6.3%) | 49 (9.8%) |
Disability Class: Ambulatory Difficulty
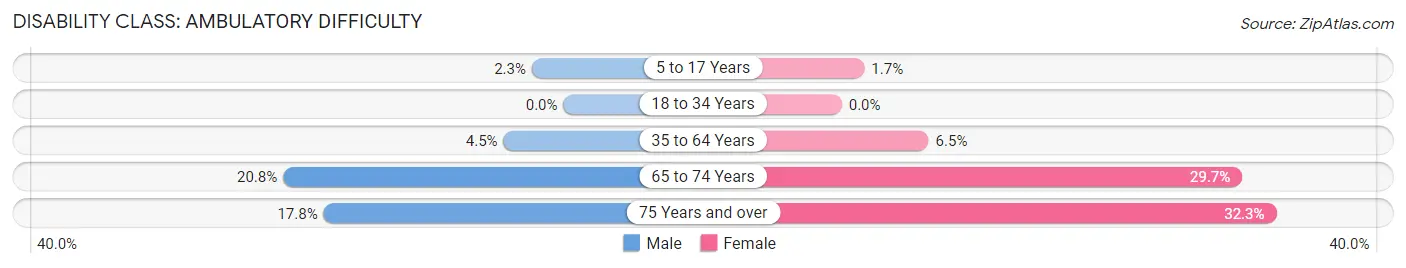
| Age Bracket | Male | Female |
| 5 to 17 Years | 22 (2.3%) | 14 (1.7%) |
| 18 to 34 Years | 0 (0.0%) | 0 (0.0%) |
| 35 to 64 Years | 96 (4.4%) | 134 (6.5%) |
| 65 to 74 Years | 118 (20.8%) | 167 (29.7%) |
| 75 Years and over | 65 (17.8%) | 161 (32.3%) |
Disability Class: Self-Care Difficulty
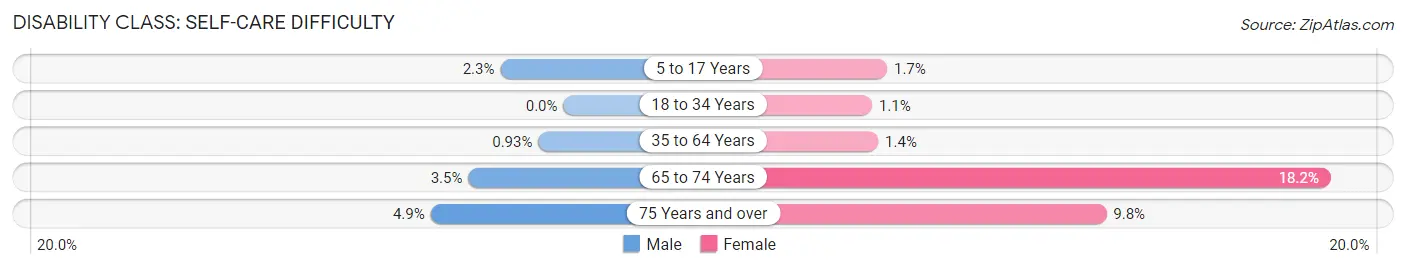
| Age Bracket | Male | Female |
| 5 to 17 Years | 22 (2.3%) | 14 (1.7%) |
| 18 to 34 Years | 0 (0.0%) | 10 (1.1%) |
| 35 to 64 Years | 20 (0.9%) | 28 (1.3%) |
| 65 to 74 Years | 20 (3.5%) | 102 (18.1%) |
| 75 Years and over | 18 (4.9%) | 49 (9.8%) |
Technology Access in Louisa County
Computing Device Access in Louisa County
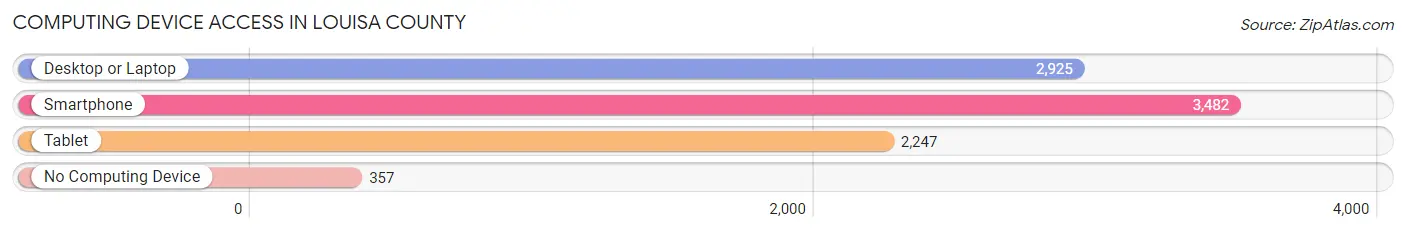
| Device Type | # Households | % Households |
| Desktop or Laptop | 2,925 | 71.1% |
| Smartphone | 3,482 | 84.7% |
| Tablet | 2,247 | 54.6% |
| No Computing Device | 357 | 8.7% |
| Total | 4,112 | 100.0% |
Internet Access in Louisa County
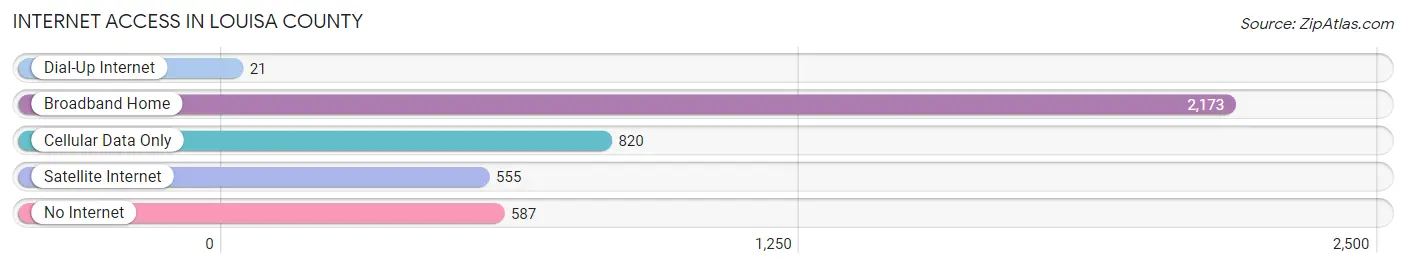
| Internet Type | # Households | % Households |
| Dial-Up Internet | 21 | 0.5% |
| Broadband Home | 2,173 | 52.8% |
| Cellular Data Only | 820 | 19.9% |
| Satellite Internet | 555 | 13.5% |
| No Internet | 587 | 14.3% |
| Total | 4,112 | 100.0% |
Louisa County Summary
Louisa County, Iowa is located in the southeastern corner of the state, bordered by the Mississippi River to the east and the Iowa River to the south. It is part of the Muscatine Micropolitan Statistical Area and is home to approximately 11,000 people. The county seat is Wapello, and the largest city is Columbus Junction.
History
Louisa County was established in 1836 and named after Louisa County, Virginia. The first settlers arrived in the area in 1835, and the county was officially organized in 1837. The first courthouse was built in Wapello in 1838, and the first school was established in 1839.
The county was an important part of the Underground Railroad, with many of the county's residents helping to provide shelter and assistance to escaped slaves. During the Civil War, Louisa County was home to several Union regiments, and many of the county's residents served in the war.
Geography
Louisa County is located in the southeastern corner of Iowa, bordered by the Mississippi River to the east and the Iowa River to the south. The county covers an area of 576 square miles and is mostly flat, with some rolling hills in the northern part of the county. The highest point in the county is located in the northern part of the county, near the town of Morning Sun, and is 845 feet above sea level.
The county is home to several rivers and streams, including the Iowa River, the Cedar River, the Skunk River, and the Wapsipinicon River. The county is also home to several lakes, including Lake Odessa, Lake Darling, and Lake Belva Deer.
Economy
The economy of Louisa County is largely based on agriculture. The county is home to several large farms, and the main crops grown in the county are corn, soybeans, and hay. The county is also home to several livestock farms, and the main livestock raised in the county are cattle, hogs, and sheep.
The county is also home to several manufacturing companies, including a furniture factory, a plastics factory, and a food processing plant. The county is also home to several small businesses, including restaurants, retail stores, and service providers.
Demographics
As of the 2010 census, the population of Louisa County was 11,039. The population is mostly white (96.2%), with small percentages of African Americans (1.2%), Asians (0.7%), and Native Americans (0.3%). The median household income in the county is $45,845, and the median age is 40.
The county is home to several small towns, including Wapello, Columbus Junction, Morning Sun, and Grandview. The county is also home to several unincorporated communities, including Letts, Oakville, and Fredonia.
Common Questions
What is the Total Population of Louisa County?
Total Population of Louisa County is 10,823.
What is the Total Male Population of Louisa County?
Total Male Population of Louisa County is 5,572.
What is the Total Female Population of Louisa County?
Total Female Population of Louisa County is 5,251.
What is the Ratio of Males per 100 Females in Louisa County?
There are 106.11 Males per 100 Females in Louisa County.
What is the Ratio of Females per 100 Males in Louisa County?
There are 94.24 Females per 100 Males in Louisa County.
What is the Median Population Age in Louisa County?
Median Population Age in Louisa County is 42.2 Years.
What is the Average Family Size in Louisa County
Average Family Size in Louisa County is 3.0 People.
What is the Average Household Size in Louisa County
Average Household Size in Louisa County is 2.6 People.
What is Per Capita Income in Louisa County?
Per Capita income in Louisa County is $33,296.
What is the Median Family Income in Louisa County?
Median Family Income in Louisa County is $83,792.
What is the Median Household income in Louisa County?
Median Household Income in Louisa County is $72,500.
What is Income or Wage Gap in Louisa County?
Income or Wage Gap in Louisa County is 32.7%.
Women in Louisa County earn 67.3 cents for every dollar earned by a man.
What is Family Income Deficit in Louisa County?
Family Income Deficit in Louisa County is $7,997.
Families that are below poverty line in Louisa County earn $7,997 less on average than the poverty threshold level.
What is Inequality or Gini Index in Louisa County?
Inequality or Gini Index in Louisa County is 0.43.
How Large is the Labor Force in Louisa County?
There are 5,632 People in the Labor Forcein in Louisa County.
What is the Percentage of People in the Labor Force in Louisa County?
65.0% of People are in the Labor Force in Louisa County.
What is the Unemployment Rate in Louisa County?
Unemployment Rate in Louisa County is 4.4%.