Howard County, IA
Howard County Map
Howard County Overview
9,479
TOTAL POPULATION
4,787
MALE POPULATION
4,692
FEMALE POPULATION
102.02
MALES / 100 FEMALES
98.02
FEMALES / 100 MALES
39.5
MEDIAN AGE
3.1
AVG FAMILY SIZE
2.5
AVG HOUSEHOLD SIZE
$32,033
PER CAPITA INCOME
$81,250
AVG FAMILY INCOME
$63,947
AVG HOUSEHOLD INCOME
19.5%
WAGE / INCOME GAP [ % ]
80.5¢/ $1
WAGE / INCOME GAP [ $ ]
0.42
INEQUALITY / GINI INDEX
4,792
LABOR FORCE [ PEOPLE ]
65.4%
PERCENT IN LABOR FORCE
1.5%
UNEMPLOYMENT RATE
Race in Howard County
The most populous races in Howard County are White / Caucasian (9,091 | 95.9%), Two or more Races (295 | 3.1%), and Hispanic or Latino (171 | 1.8%).

| Race | # Population | % Population |
| Asian | 30 | 0.3% |
| Black / African American | 16 | 0.2% |
| Hawaiian / Pacific | 7 | 0.1% |
| Hispanic or Latino | 171 | 1.8% |
| Native / Alaskan | 15 | 0.2% |
| White / Caucasian | 9,091 | 95.9% |
| Two or more Races | 295 | 3.1% |
| Some other Race | 25 | 0.3% |
| Total | 9,479 | 100.0% |
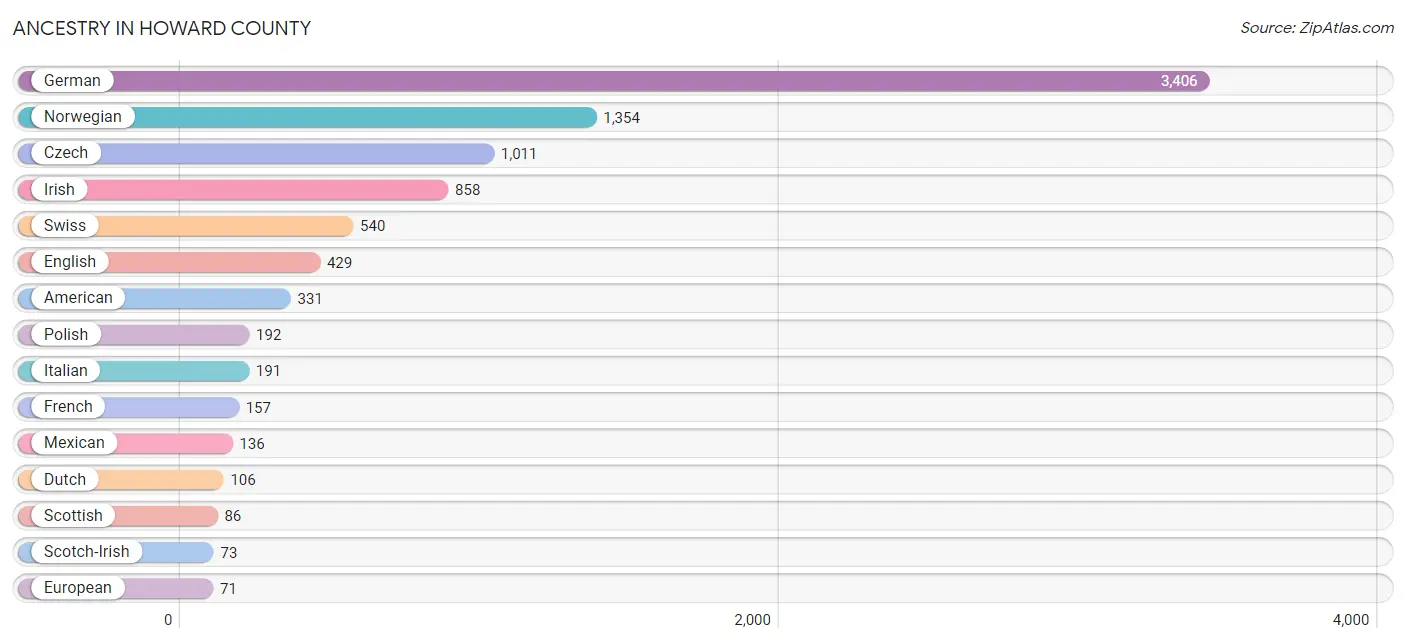
Ancestry in Howard County
The most populous ancestries reported in Howard County are German (3,406 | 35.9%), Norwegian (1,354 | 14.3%), Czech (1,011 | 10.7%), Irish (858 | 9.0%), and Swiss (540 | 5.7%), together accounting for 75.6% of all Howard County residents.
| Ancestry | # Population | % Population |
| American | 331 | 3.5% |
| Austrian | 7 | 0.1% |
| Belgian | 1 | 0.0% |
| Bhutanese | 13 | 0.1% |
| British | 24 | 0.3% |
| Burmese | 15 | 0.2% |
| Canadian | 31 | 0.3% |
| Central American | 11 | 0.1% |
| Cherokee | 16 | 0.2% |
| Cuban | 5 | 0.1% |
| Czech | 1,011 | 10.7% |
| Czechoslovakian | 49 | 0.5% |
| Danish | 69 | 0.7% |
| Dutch | 106 | 1.1% |
| Eastern European | 4 | 0.0% |
| English | 429 | 4.5% |
| European | 71 | 0.7% |
| French | 157 | 1.7% |
| French Canadian | 11 | 0.1% |
| German | 3,406 | 35.9% |
| Greek | 10 | 0.1% |
| Guatemalan | 11 | 0.1% |
| Hungarian | 9 | 0.1% |
| Irish | 858 | 9.0% |
| Italian | 191 | 2.0% |
| Korean | 14 | 0.2% |
| Lithuanian | 27 | 0.3% |
| Luxembourger | 5 | 0.1% |
| Mexican | 136 | 1.4% |
| Norwegian | 1,354 | 14.3% |
| Pennsylvania German | 2 | 0.0% |
| Polish | 192 | 2.0% |
| Potawatomi | 1 | 0.0% |
| Scandinavian | 60 | 0.6% |
| Scotch-Irish | 73 | 0.8% |
| Scottish | 86 | 0.9% |
| Seminole | 10 | 0.1% |
| Somali | 2 | 0.0% |
| South African | 18 | 0.2% |
| Subsaharan African | 20 | 0.2% |
| Swedish | 35 | 0.4% |
| Swiss | 540 | 5.7% |
| Thai | 13 | 0.1% |
| Ukrainian | 2 | 0.0% |
| Welsh | 27 | 0.3% | View All 45 Rows |
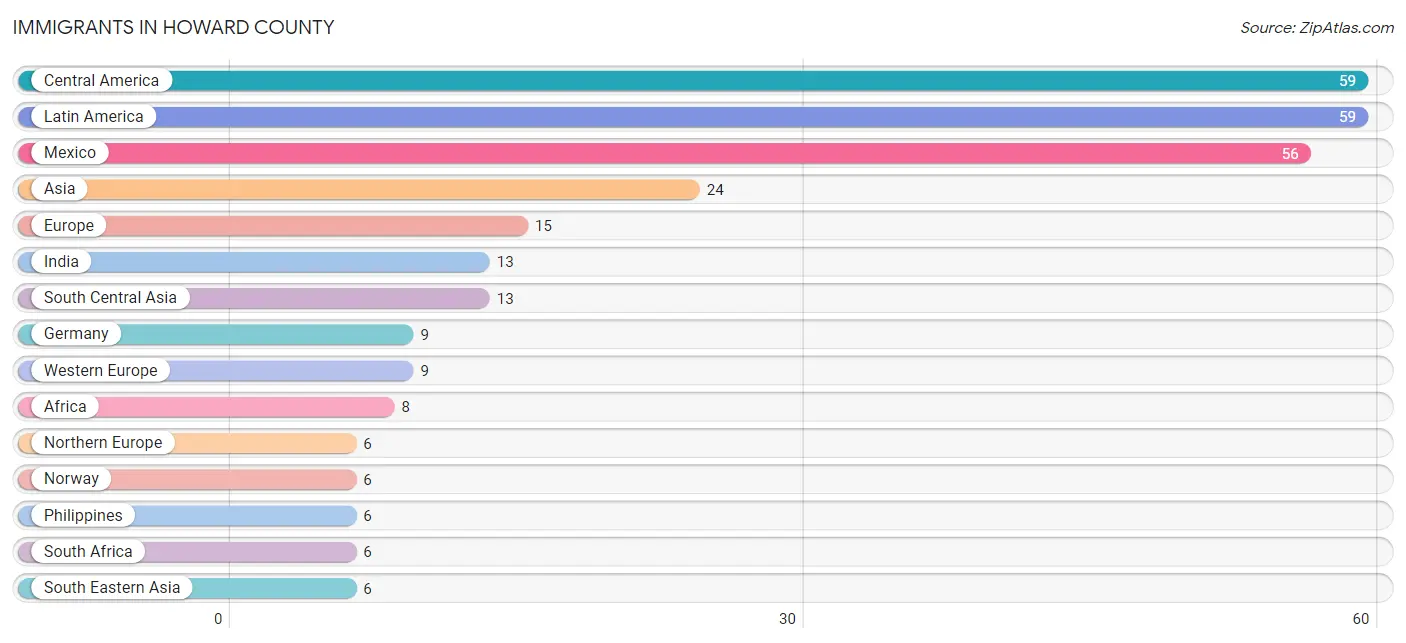
Immigrants in Howard County
The most numerous immigrant groups reported in Howard County came from Central America (59 | 0.6%), Latin America (59 | 0.6%), Mexico (56 | 0.6%), Asia (24 | 0.3%), and Europe (15 | 0.2%), together accounting for 2.2% of all Howard County residents.
| Immigration Origin | # Population | % Population |
| Africa | 8 | 0.1% |
| Asia | 24 | 0.3% |
| Central America | 59 | 0.6% |
| Eastern Africa | 2 | 0.0% |
| Eastern Asia | 5 | 0.1% |
| Europe | 15 | 0.2% |
| Germany | 9 | 0.1% |
| Guatemala | 3 | 0.0% |
| India | 13 | 0.1% |
| Japan | 4 | 0.0% |
| Korea | 1 | 0.0% |
| Latin America | 59 | 0.6% |
| Mexico | 56 | 0.6% |
| Northern Europe | 6 | 0.1% |
| Norway | 6 | 0.1% |
| Philippines | 6 | 0.1% |
| Somalia | 2 | 0.0% |
| South Africa | 6 | 0.1% |
| South Central Asia | 13 | 0.1% |
| South Eastern Asia | 6 | 0.1% |
| Western Europe | 9 | 0.1% | View All 21 Rows |
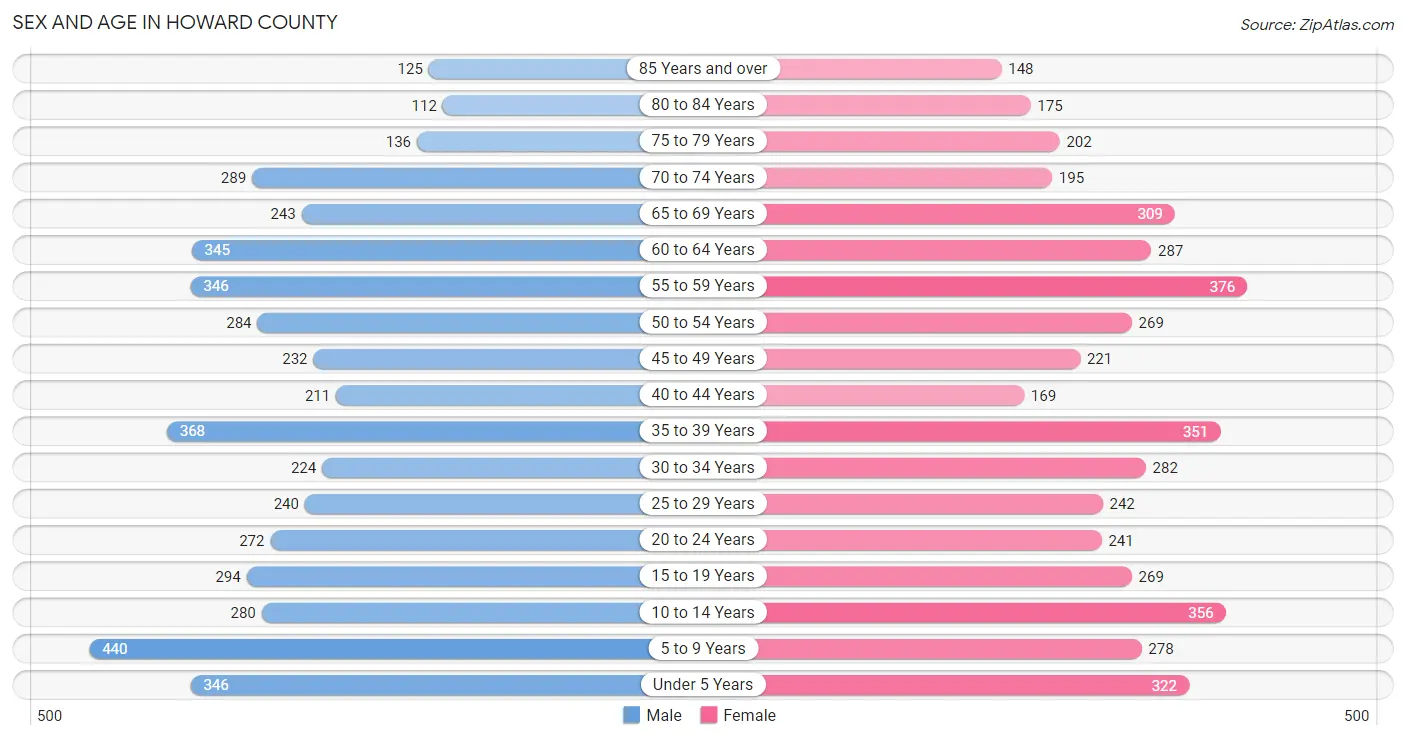
Sex and Age in Howard County
Sex and Age in Howard County
The most populous age groups in Howard County are 5 to 9 Years (440 | 9.2%) for men and 55 to 59 Years (376 | 8.0%) for women.
| Age Bracket | Male | Female |
| Under 5 Years | 346 (7.2%) | 322 (6.9%) |
| 5 to 9 Years | 440 (9.2%) | 278 (5.9%) |
| 10 to 14 Years | 280 (5.9%) | 356 (7.6%) |
| 15 to 19 Years | 294 (6.1%) | 269 (5.7%) |
| 20 to 24 Years | 272 (5.7%) | 241 (5.1%) |
| 25 to 29 Years | 240 (5.0%) | 242 (5.2%) |
| 30 to 34 Years | 224 (4.7%) | 282 (6.0%) |
| 35 to 39 Years | 368 (7.7%) | 351 (7.5%) |
| 40 to 44 Years | 211 (4.4%) | 169 (3.6%) |
| 45 to 49 Years | 232 (4.9%) | 221 (4.7%) |
| 50 to 54 Years | 284 (5.9%) | 269 (5.7%) |
| 55 to 59 Years | 346 (7.2%) | 376 (8.0%) |
| 60 to 64 Years | 345 (7.2%) | 287 (6.1%) |
| 65 to 69 Years | 243 (5.1%) | 309 (6.6%) |
| 70 to 74 Years | 289 (6.0%) | 195 (4.2%) |
| 75 to 79 Years | 136 (2.8%) | 202 (4.3%) |
| 80 to 84 Years | 112 (2.3%) | 175 (3.7%) |
| 85 Years and over | 125 (2.6%) | 148 (3.2%) |
| Total | 4,787 (100.0%) | 4,692 (100.0%) |
Families and Households in Howard County
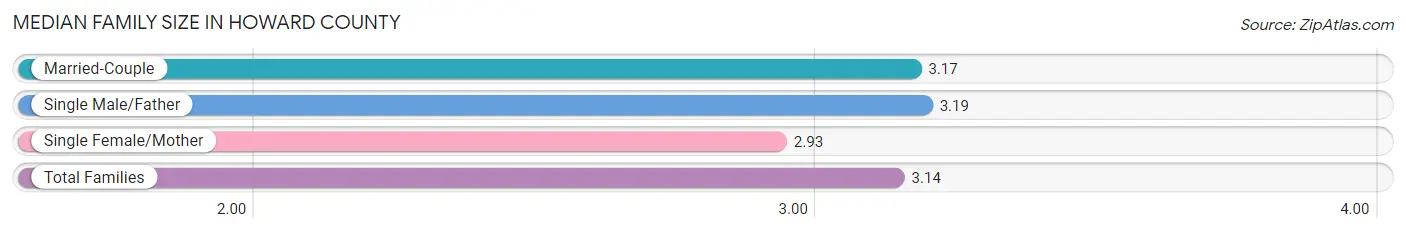
Median Family Size in Howard County
The median family size in Howard County is 3.14 persons per family, with single male/father families (79 | 3.3%) accounting for the largest median family size of 3.19 persons per family. On the other hand, single female/mother families (294 | 12.1%) represent the smallest median family size with 2.93 persons per family.
| Family Type | # Families | Family Size |
| Married-Couple | 2,052 (84.6%) | 3.17 |
| Single Male/Father | 79 (3.3%) | 3.19 |
| Single Female/Mother | 294 (12.1%) | 2.93 |
| Total Families | 2,425 (100.0%) | 3.14 |
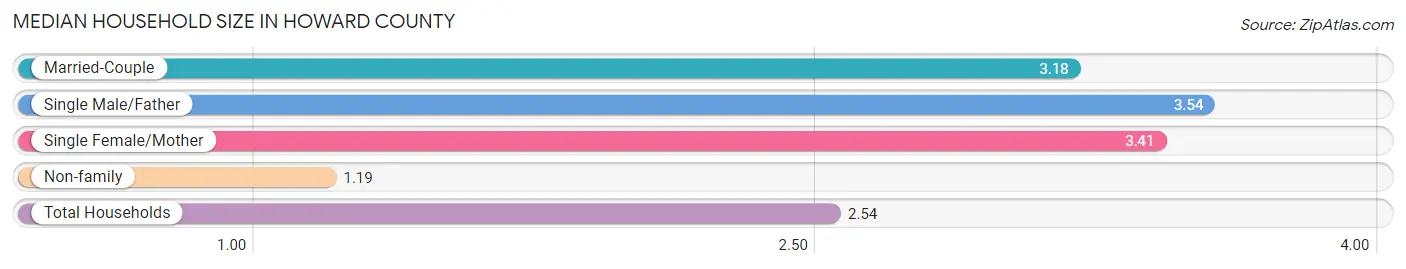
Median Household Size in Howard County
The median household size in Howard County is 2.54 persons per household, with single male/father households (79 | 2.2%) accounting for the largest median household size of 3.54 persons per household. non-family households (1,211 | 33.3%) represent the smallest median household size with 1.19 persons per household.
| Household Type | # Households | Household Size |
| Married-Couple | 2,052 (56.4%) | 3.18 |
| Single Male/Father | 79 (2.2%) | 3.54 |
| Single Female/Mother | 294 (8.1%) | 3.41 |
| Non-family | 1,211 (33.3%) | 1.19 |
| Total Households | 3,636 (100.0%) | 2.54 |
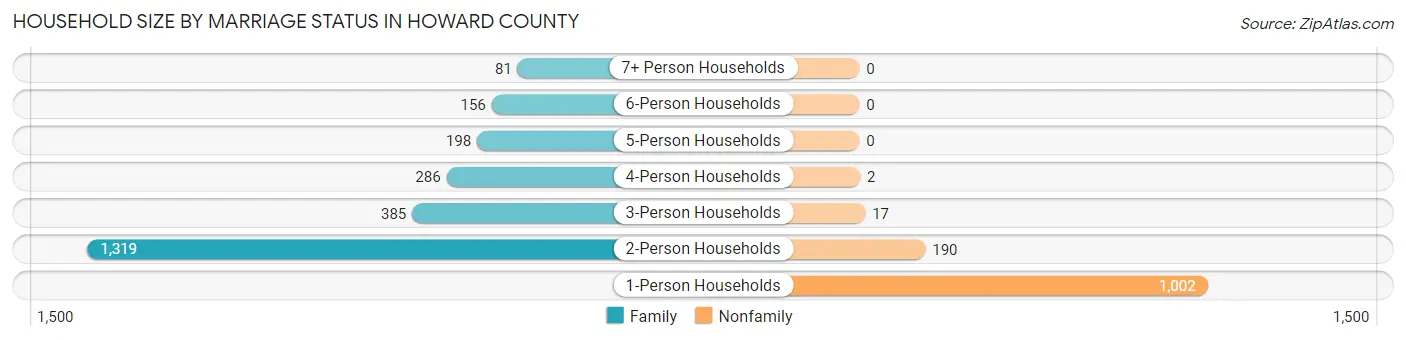
Household Size by Marriage Status in Howard County
Out of a total of 3,636 households in Howard County, 2,425 (66.7%) are family households, while 1,211 (33.3%) are nonfamily households. The most numerous type of family households are 2-person households, comprising 1,319, and the most common type of nonfamily households are 1-person households, comprising 1,002.
| Household Size | Family Households | Nonfamily Households |
| 1-Person Households | - | 1,002 (27.6%) |
| 2-Person Households | 1,319 (36.3%) | 190 (5.2%) |
| 3-Person Households | 385 (10.6%) | 17 (0.5%) |
| 4-Person Households | 286 (7.9%) | 2 (0.1%) |
| 5-Person Households | 198 (5.4%) | 0 (0.0%) |
| 6-Person Households | 156 (4.3%) | 0 (0.0%) |
| 7+ Person Households | 81 (2.2%) | 0 (0.0%) |
| Total | 2,425 (66.7%) | 1,211 (33.3%) |
Female Fertility in Howard County
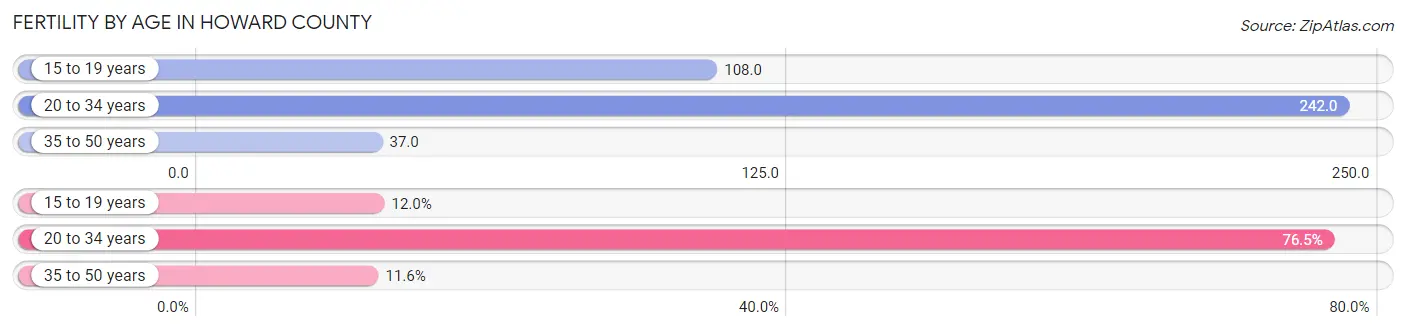
Fertility by Age in Howard County
Average fertility rate in Howard County is 135.0 births per 1,000 women. Women in the age bracket of 20 to 34 years have the highest fertility rate with 242.0 births per 1,000 women. Women in the age bracket of 20 to 34 years acount for 76.4% of all women with births.
| Age Bracket | Women with Births | Births / 1,000 Women |
| 15 to 19 years | 29 (12.0%) | 108.0 |
| 20 to 34 years | 185 (76.4%) | 242.0 |
| 35 to 50 years | 28 (11.6%) | 37.0 |
| Total | 242 (100.0%) | 135.0 |
Fertility by Age by Marriage Status in Howard County
46.7% of women with births (242) in Howard County are married. The highest percentage of unmarried women with births falls into 15 to 19 years age bracket with 100.0% of them unmarried at the time of birth, while the lowest percentage of unmarried women with births belong to 35 to 50 years age bracket with 0.0% of them unmarried.
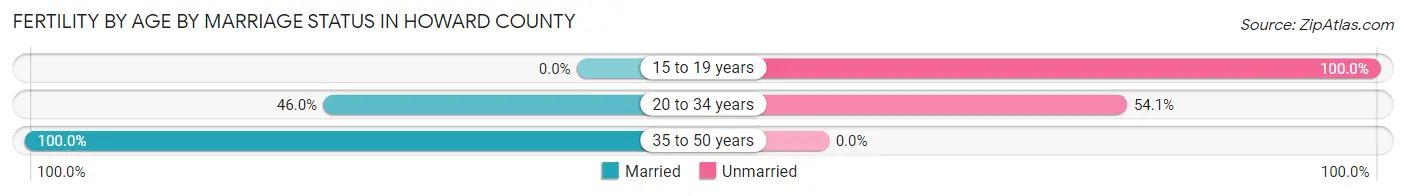
| Age Bracket | Married | Unmarried |
| 15 to 19 years | 0 (0.0%) | 29 (100.0%) |
| 20 to 34 years | 85 (46.0%) | 100 (54.0%) |
| 35 to 50 years | 28 (100.0%) | 0 (0.0%) |
| Total | 113 (46.7%) | 129 (53.3%) |
Fertility by Education in Howard County
Average fertility rate in Howard County is 135.0 births per 1,000 women. Women with the education attainment of high school diploma have the highest fertility rate of 175.0 births per 1,000 women, while women with the education attainment of bachelor's degree have the lowest fertility at 26.0 births per 1,000 women. Women with the education attainment of college or associate's degree represent 43.8% of all women with births.
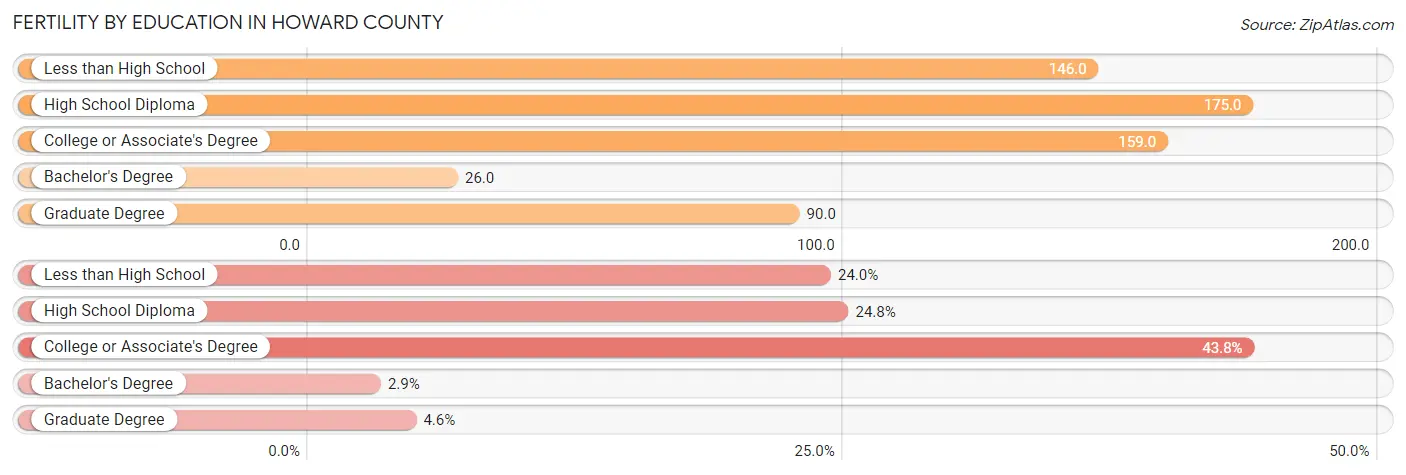
| Educational Attainment | Women with Births | Births / 1,000 Women |
| Less than High School | 58 (24.0%) | 146.0 |
| High School Diploma | 60 (24.8%) | 175.0 |
| College or Associate's Degree | 106 (43.8%) | 159.0 |
| Bachelor's Degree | 7 (2.9%) | 26.0 |
| Graduate Degree | 11 (4.5%) | 90.0 |
| Total | 242 (100.0%) | 135.0 |
Fertility by Education by Marriage Status in Howard County
53.3% of women with births in Howard County are unmarried. Women with the educational attainment of bachelor's degree are most likely to be married with 100.0% of them married at childbirth, while women with the educational attainment of college or associate's degree are least likely to be married with 58.5% of them unmarried at childbirth.
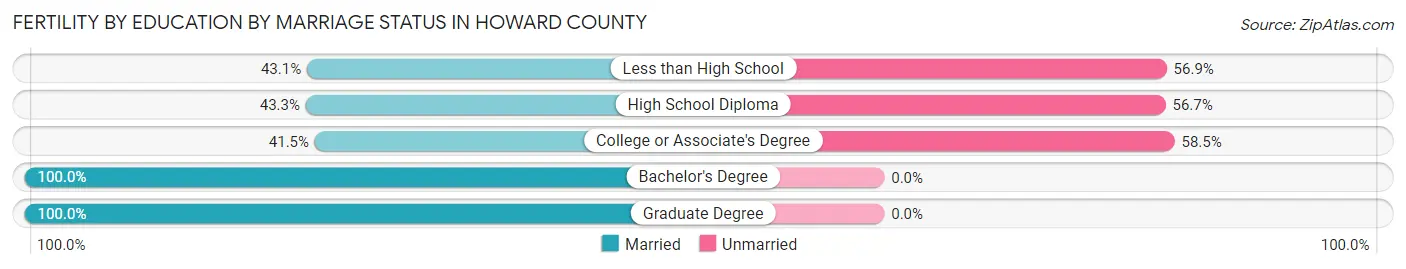
| Educational Attainment | Married | Unmarried |
| Less than High School | 25 (43.1%) | 33 (56.9%) |
| High School Diploma | 26 (43.3%) | 34 (56.7%) |
| College or Associate's Degree | 44 (41.5%) | 62 (58.5%) |
| Bachelor's Degree | 7 (100.0%) | 0 (0.0%) |
| Graduate Degree | 11 (100.0%) | 0 (0.0%) |
| Total | 113 (46.7%) | 129 (53.3%) |
Income in Howard County
Income Overview in Howard County
Per Capita Income in Howard County is $32,033, while median incomes of families and households are $81,250 and $63,947 respectively.
| Characteristic | Number | Measure |
| Per Capita Income | 9,479 | $32,033 |
| Median Family Income | 2,425 | $81,250 |
| Mean Family Income | 2,425 | $98,636 |
| Median Household Income | 3,636 | $63,947 |
| Mean Household Income | 3,636 | $80,838 |
| Income Deficit | 2,425 | $0 |
| Wage / Income Gap (%) | 9,479 | 19.55% |
| Wage / Income Gap ($) | 9,479 | 80.45¢ per $1 |
| Gini / Inequality Index | 9,479 | 0.42 |
Earnings by Sex in Howard County
Average Earnings in Howard County are $36,635, $40,927 for men and $32,926 for women, a difference of 19.6%.

| Sex | Number | Average Earnings |
| Male | 2,686 (53.8%) | $40,927 |
| Female | 2,309 (46.2%) | $32,926 |
| Total | 4,995 (100.0%) | $36,635 |
Earnings by Sex by Income Bracket in Howard County
The most common earnings brackets in Howard County are $55,000 to $64,999 for men (342 | 12.7%) and $25,000 to $29,999 for women (243 | 10.5%).
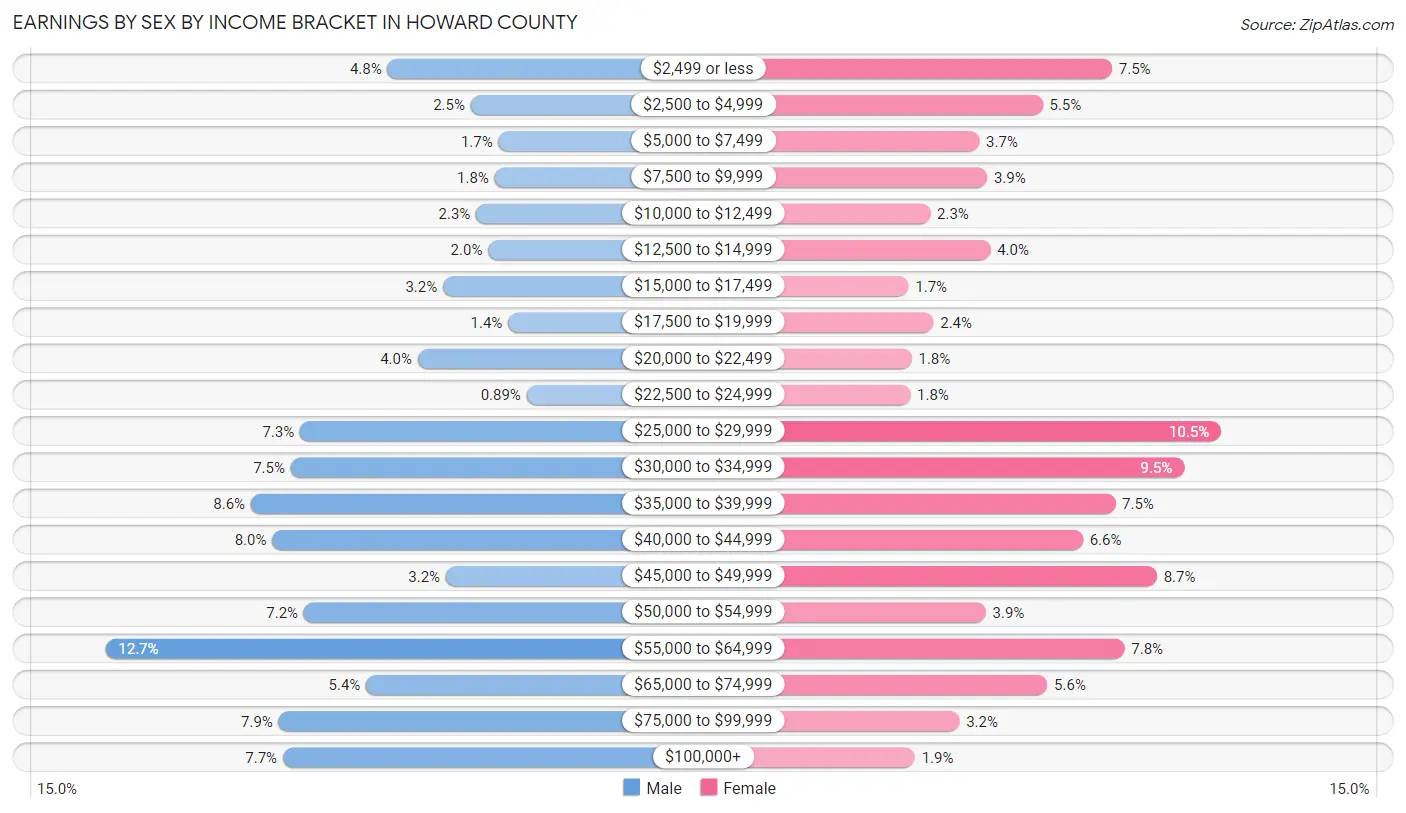
| Income | Male | Female |
| $2,499 or less | 129 (4.8%) | 172 (7.4%) |
| $2,500 to $4,999 | 66 (2.5%) | 127 (5.5%) |
| $5,000 to $7,499 | 45 (1.7%) | 86 (3.7%) |
| $7,500 to $9,999 | 48 (1.8%) | 91 (3.9%) |
| $10,000 to $12,499 | 62 (2.3%) | 54 (2.3%) |
| $12,500 to $14,999 | 53 (2.0%) | 93 (4.0%) |
| $15,000 to $17,499 | 87 (3.2%) | 40 (1.7%) |
| $17,500 to $19,999 | 38 (1.4%) | 56 (2.4%) |
| $20,000 to $22,499 | 106 (4.0%) | 42 (1.8%) |
| $22,500 to $24,999 | 24 (0.9%) | 41 (1.8%) |
| $25,000 to $29,999 | 195 (7.3%) | 243 (10.5%) |
| $30,000 to $34,999 | 202 (7.5%) | 219 (9.5%) |
| $35,000 to $39,999 | 232 (8.6%) | 174 (7.5%) |
| $40,000 to $44,999 | 216 (8.0%) | 153 (6.6%) |
| $45,000 to $49,999 | 85 (3.2%) | 201 (8.7%) |
| $50,000 to $54,999 | 192 (7.1%) | 90 (3.9%) |
| $55,000 to $64,999 | 342 (12.7%) | 180 (7.8%) |
| $65,000 to $74,999 | 145 (5.4%) | 130 (5.6%) |
| $75,000 to $99,999 | 211 (7.9%) | 73 (3.2%) |
| $100,000+ | 208 (7.7%) | 44 (1.9%) |
| Total | 2,686 (100.0%) | 2,309 (100.0%) |
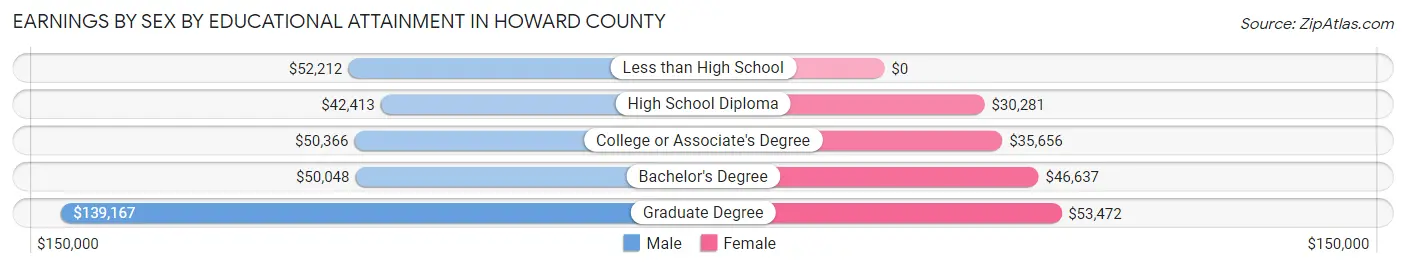
Earnings by Sex by Educational Attainment in Howard County
Average earnings in Howard County are $46,477 for men and $36,506 for women, a difference of 21.4%. Men with an educational attainment of graduate degree enjoy the highest average annual earnings of $139,167, while those with high school diploma education earn the least with $42,413. Women with an educational attainment of graduate degree earn the most with the average annual earnings of $53,472, while those with high school diploma education have the smallest earnings of $30,281.
| Educational Attainment | Male Income | Female Income |
| Less than High School | $52,212 | $0 |
| High School Diploma | $42,413 | $30,281 |
| College or Associate's Degree | $50,366 | $35,656 |
| Bachelor's Degree | $50,048 | $46,637 |
| Graduate Degree | $139,167 | $53,472 |
| Total | $46,477 | $36,506 |
Family Income in Howard County
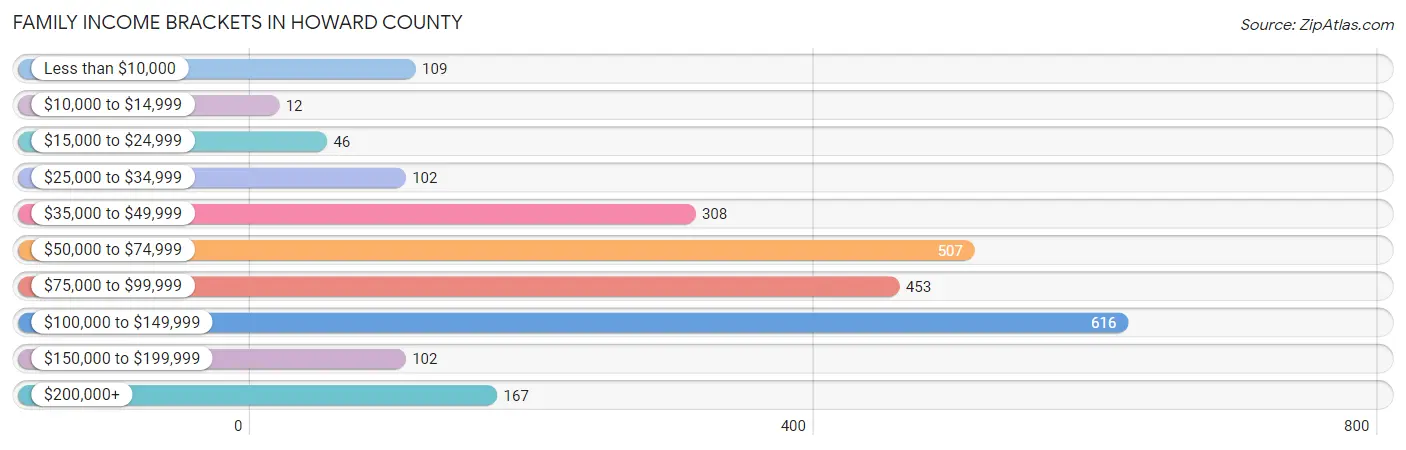
Family Income Brackets in Howard County
According to the Howard County family income data, there are 616 families falling into the $100,000 to $149,999 income range, which is the most common income bracket and makes up 25.4% of all families. Conversely, the $10,000 to $14,999 income bracket is the least frequent group with only 12 families (0.5%) belonging to this category.
| Income Bracket | # Families | % Families |
| Less than $10,000 | 109 | 4.5% |
| $10,000 to $14,999 | 12 | 0.5% |
| $15,000 to $24,999 | 46 | 1.9% |
| $25,000 to $34,999 | 102 | 4.2% |
| $35,000 to $49,999 | 308 | 12.7% |
| $50,000 to $74,999 | 507 | 20.9% |
| $75,000 to $99,999 | 453 | 18.7% |
| $100,000 to $149,999 | 616 | 25.4% |
| $150,000 to $199,999 | 102 | 4.2% |
| $200,000+ | 167 | 6.9% |
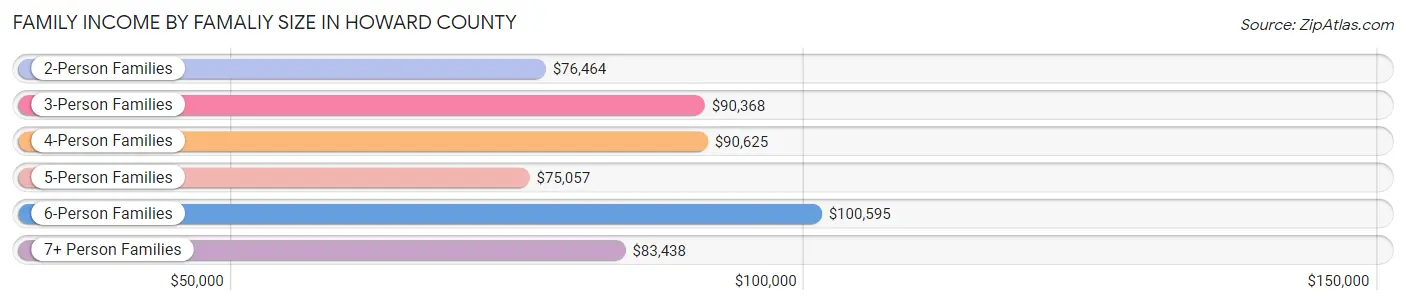
Family Income by Famaliy Size in Howard County
6-person families (120 | 5.0%) account for the highest median family income in Howard County with $100,595 per family, while 2-person families (1,401 | 57.8%) have the highest median income of $38,232 per family member.
| Income Bracket | # Families | Median Income |
| 2-Person Families | 1,401 (57.8%) | $76,464 |
| 3-Person Families | 341 (14.1%) | $90,368 |
| 4-Person Families | 295 (12.2%) | $90,625 |
| 5-Person Families | 187 (7.7%) | $75,057 |
| 6-Person Families | 120 (5.0%) | $100,595 |
| 7+ Person Families | 81 (3.3%) | $83,438 |
| Total | 2,425 (100.0%) | $81,250 |
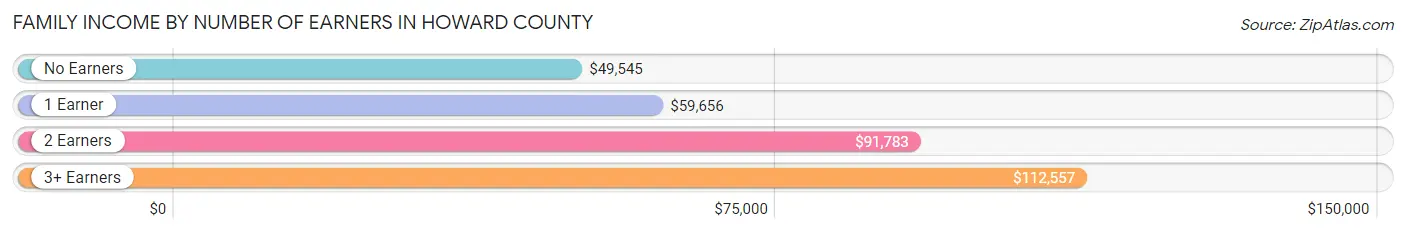
Family Income by Number of Earners in Howard County
The median family income in Howard County is $81,250, with families comprising 3+ earners (271) having the highest median family income of $112,557, while families with no earners (422) have the lowest median family income of $49,545, accounting for 11.2% and 17.4% of families, respectively.
| Number of Earners | # Families | Median Income |
| No Earners | 422 (17.4%) | $49,545 |
| 1 Earner | 647 (26.7%) | $59,656 |
| 2 Earners | 1,085 (44.7%) | $91,783 |
| 3+ Earners | 271 (11.2%) | $112,557 |
| Total | 2,425 (100.0%) | $81,250 |
Household Income in Howard County
Household Income Brackets in Howard County
With 778 households falling in the category, the $50,000 to $74,999 income range is the most frequent in Howard County, accounting for 21.4% of all households. In contrast, only 62 households (1.7%) fall into the less than $10,000 income bracket, making it the least populous group.
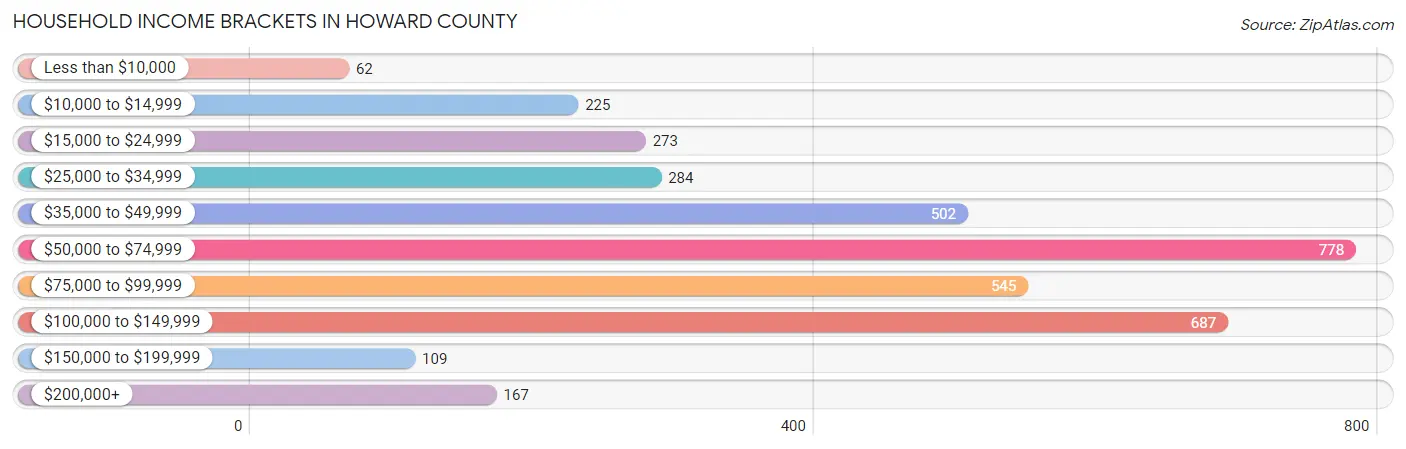
| Income Bracket | # Households | % Households |
| Less than $10,000 | 62 | 1.7% |
| $10,000 to $14,999 | 225 | 6.2% |
| $15,000 to $24,999 | 273 | 7.5% |
| $25,000 to $34,999 | 284 | 7.8% |
| $35,000 to $49,999 | 502 | 13.8% |
| $50,000 to $74,999 | 778 | 21.4% |
| $75,000 to $99,999 | 545 | 15.0% |
| $100,000 to $149,999 | 687 | 18.9% |
| $150,000 to $199,999 | 109 | 3.0% |
| $200,000+ | 167 | 4.6% |
Household Income by Householder Age in Howard County
The median household income in Howard County is $63,947, with the highest median household income of $80,439 found in the 45 to 64 years age bracket for the primary householder. A total of 1,316 households (36.2%) fall into this category. Meanwhile, the 15 to 24 years age bracket for the primary householder has the lowest median household income of $27,315, with 212 households (5.8%) in this group.

| Income Bracket | # Households | Median Income |
| 15 to 24 Years | 212 (5.8%) | $27,315 |
| 25 to 44 Years | 1,013 (27.9%) | $69,973 |
| 45 to 64 Years | 1,316 (36.2%) | $80,439 |
| 65+ Years | 1,095 (30.1%) | $52,969 |
| Total | 3,636 (100.0%) | $63,947 |
Poverty in Howard County
Income Below Poverty by Sex and Age in Howard County
With 8.0% poverty level for males and 9.3% for females among the residents of Howard County, 35 to 44 year old males and 18 to 24 year old females are the most vulnerable to poverty, with 111 males (19.3%) and 66 females (20.6%) in their respective age groups living below the poverty level.
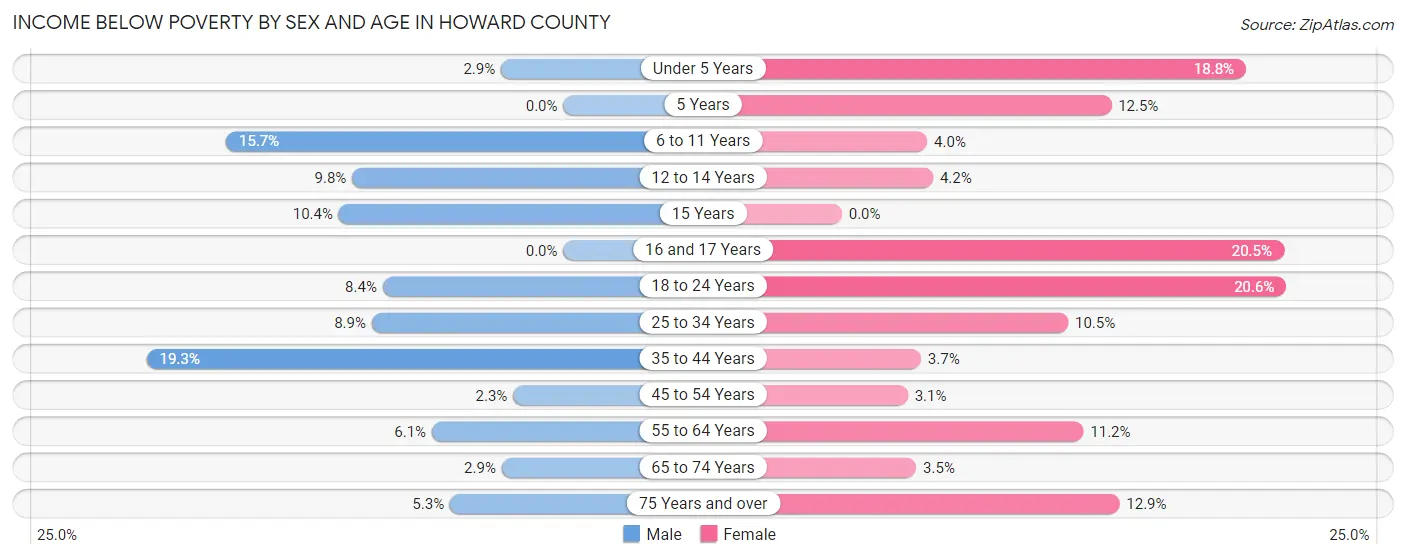
| Age Bracket | Male | Female |
| Under 5 Years | 10 (2.9%) | 60 (18.8%) |
| 5 Years | 0 (0.0%) | 12 (12.5%) |
| 6 to 11 Years | 75 (15.7%) | 11 (4.0%) |
| 12 to 14 Years | 15 (9.8%) | 11 (4.2%) |
| 15 Years | 10 (10.4%) | 0 (0.0%) |
| 16 and 17 Years | 0 (0.0%) | 32 (20.5%) |
| 18 to 24 Years | 30 (8.4%) | 66 (20.6%) |
| 25 to 34 Years | 41 (8.9%) | 55 (10.5%) |
| 35 to 44 Years | 111 (19.3%) | 19 (3.7%) |
| 45 to 54 Years | 12 (2.3%) | 15 (3.1%) |
| 55 to 64 Years | 42 (6.1%) | 74 (11.2%) |
| 65 to 74 Years | 15 (2.9%) | 17 (3.5%) |
| 75 Years and over | 17 (5.3%) | 55 (12.9%) |
| Total | 378 (8.0%) | 427 (9.3%) |
Income Above Poverty by Sex and Age in Howard County
According to the poverty statistics in Howard County, males aged 5 years and females aged 15 years are the age groups that are most secure financially, with 100.0% of males and 100.0% of females in these age groups living above the poverty line.
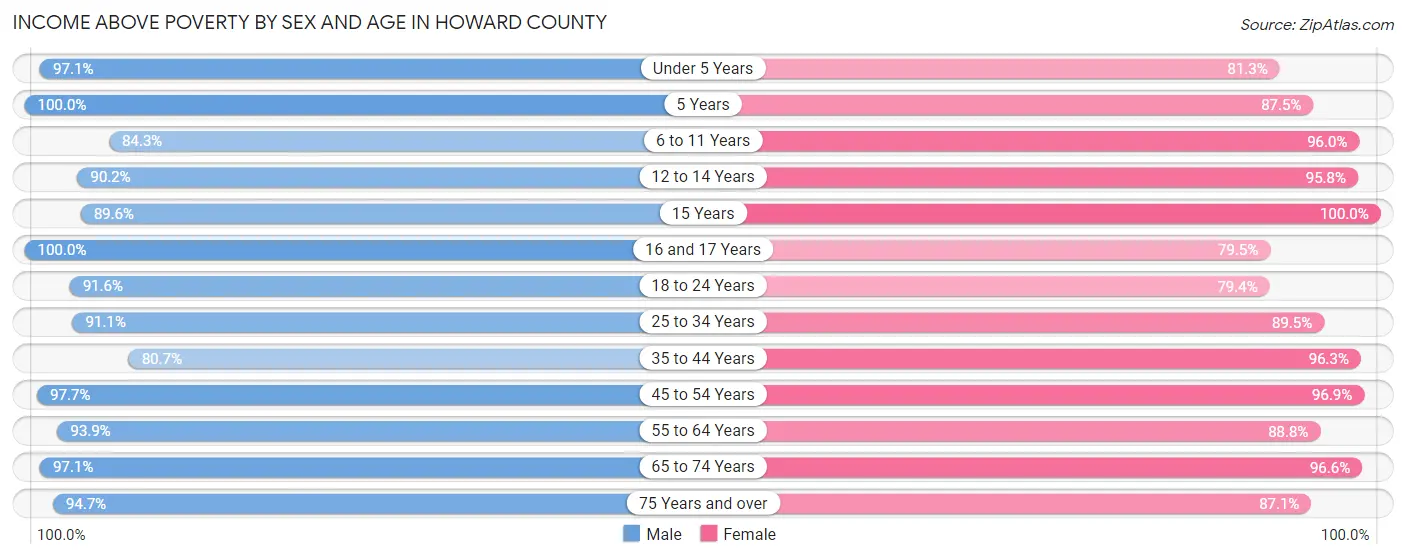
| Age Bracket | Male | Female |
| Under 5 Years | 336 (97.1%) | 260 (81.2%) |
| 5 Years | 73 (100.0%) | 84 (87.5%) |
| 6 to 11 Years | 404 (84.3%) | 267 (96.0%) |
| 12 to 14 Years | 138 (90.2%) | 249 (95.8%) |
| 15 Years | 86 (89.6%) | 34 (100.0%) |
| 16 and 17 Years | 109 (100.0%) | 124 (79.5%) |
| 18 to 24 Years | 328 (91.6%) | 254 (79.4%) |
| 25 to 34 Years | 420 (91.1%) | 469 (89.5%) |
| 35 to 44 Years | 463 (80.7%) | 499 (96.3%) |
| 45 to 54 Years | 502 (97.7%) | 475 (96.9%) |
| 55 to 64 Years | 647 (93.9%) | 586 (88.8%) |
| 65 to 74 Years | 510 (97.1%) | 476 (96.6%) |
| 75 Years and over | 306 (94.7%) | 372 (87.1%) |
| Total | 4,322 (92.0%) | 4,149 (90.7%) |
Income Below Poverty Among Married-Couple Families in Howard County
The poverty statistics for married-couple families in Howard County show that 1.3% or 27 of the total 2,052 families live below the poverty line. Families with 3 or 4 children have the highest poverty rate of 4.7%, comprising of 11 families. On the other hand, families with 1 or 2 children have the lowest poverty rate of 0.0%, which includes 0 families.

| Children | Above Poverty | Below Poverty |
| No Children | 1,290 (98.8%) | 16 (1.2%) |
| 1 or 2 Children | 461 (100.0%) | 0 (0.0%) |
| 3 or 4 Children | 224 (95.3%) | 11 (4.7%) |
| 5 or more Children | 50 (100.0%) | 0 (0.0%) |
| Total | 2,025 (98.7%) | 27 (1.3%) |
Income Below Poverty Among Single-Parent Households in Howard County
According to the poverty data in Howard County, 10.1% or 8 single-father households and 34.0% or 100 single-mother households are living below the poverty line. Among single-father households, those with 3 or 4 children have the highest poverty rate, with 5 households (41.7%) experiencing poverty. Likewise, among single-mother households, those with 3 or 4 children have the highest poverty rate, with 50 households (63.3%) falling below the poverty line.
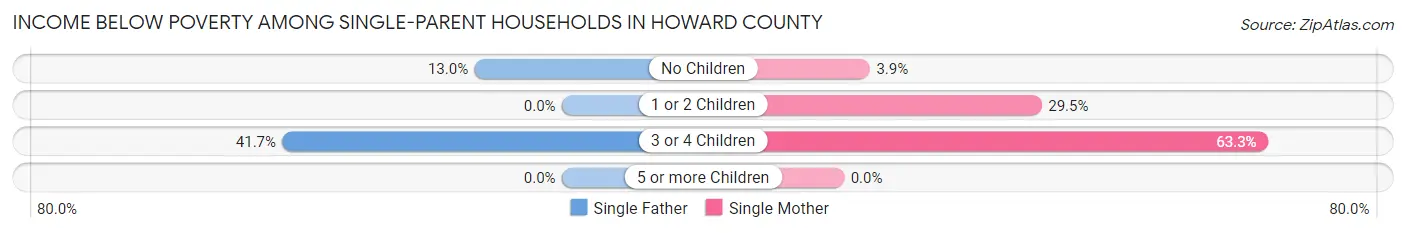
| Children | Single Father | Single Mother |
| No Children | 3 (13.0%) | 2 (3.8%) |
| 1 or 2 Children | 0 (0.0%) | 48 (29.4%) |
| 3 or 4 Children | 5 (41.7%) | 50 (63.3%) |
| 5 or more Children | 0 (0.0%) | 0 (0.0%) |
| Total | 8 (10.1%) | 100 (34.0%) |
Income Below Poverty Among Married-Couple vs Single-Parent Households in Howard County
The poverty data for Howard County shows that 27 of the married-couple family households (1.3%) and 108 of the single-parent households (28.9%) are living below the poverty level. Within the married-couple family households, those with 3 or 4 children have the highest poverty rate, with 11 households (4.7%) falling below the poverty line. Among the single-parent households, those with 3 or 4 children have the highest poverty rate, with 55 household (60.4%) living below poverty.
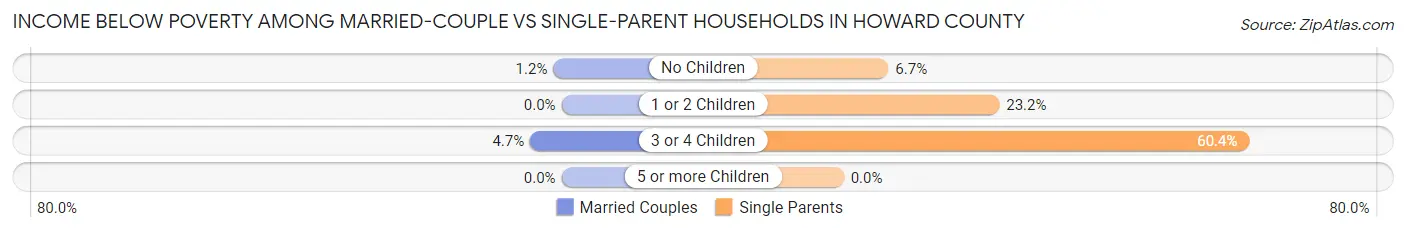
| Children | Married-Couple Families | Single-Parent Households |
| No Children | 16 (1.2%) | 5 (6.7%) |
| 1 or 2 Children | 0 (0.0%) | 48 (23.2%) |
| 3 or 4 Children | 11 (4.7%) | 55 (60.4%) |
| 5 or more Children | 0 (0.0%) | 0 (0.0%) |
| Total | 27 (1.3%) | 108 (28.9%) |
Employment Characteristics in Howard County
Employment by Class of Employer in Howard County
Among the 4,560 employed individuals in Howard County, private company employees (2,783 | 61.0%), self-employed (not incorporated) (471 | 10.3%), and not-for-profit organizations (449 | 9.9%) make up the most common classes of employment.
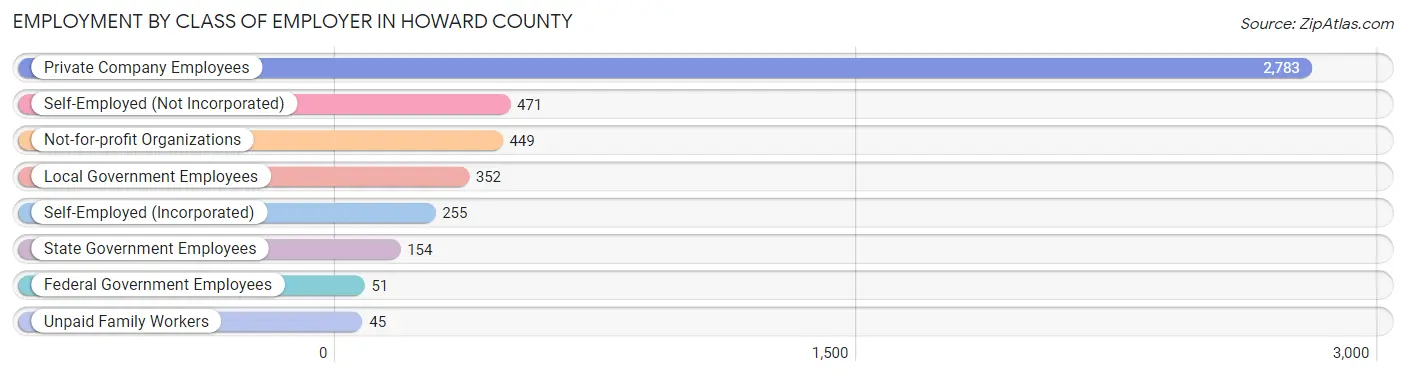
| Employer Class | # Employees | % Employees |
| Private Company Employees | 2,783 | 61.0% |
| Self-Employed (Incorporated) | 255 | 5.6% |
| Self-Employed (Not Incorporated) | 471 | 10.3% |
| Not-for-profit Organizations | 449 | 9.9% |
| Local Government Employees | 352 | 7.7% |
| State Government Employees | 154 | 3.4% |
| Federal Government Employees | 51 | 1.1% |
| Unpaid Family Workers | 45 | 1.0% |
| Total | 4,560 | 100.0% |
Employment Status by Age in Howard County
According to the labor force statistics for Howard County, out of the total population over 16 years of age (7,327), 65.4% or 4,792 individuals are in the labor force, with 1.5% or 72 of them unemployed. The age group with the highest labor force participation rate is 45 to 54 years, with 91.4% or 919 individuals in the labor force. Within the labor force, the 65 to 74 years age range has the highest percentage of unemployed individuals, with 3.3% or 9 of them being unemployed.
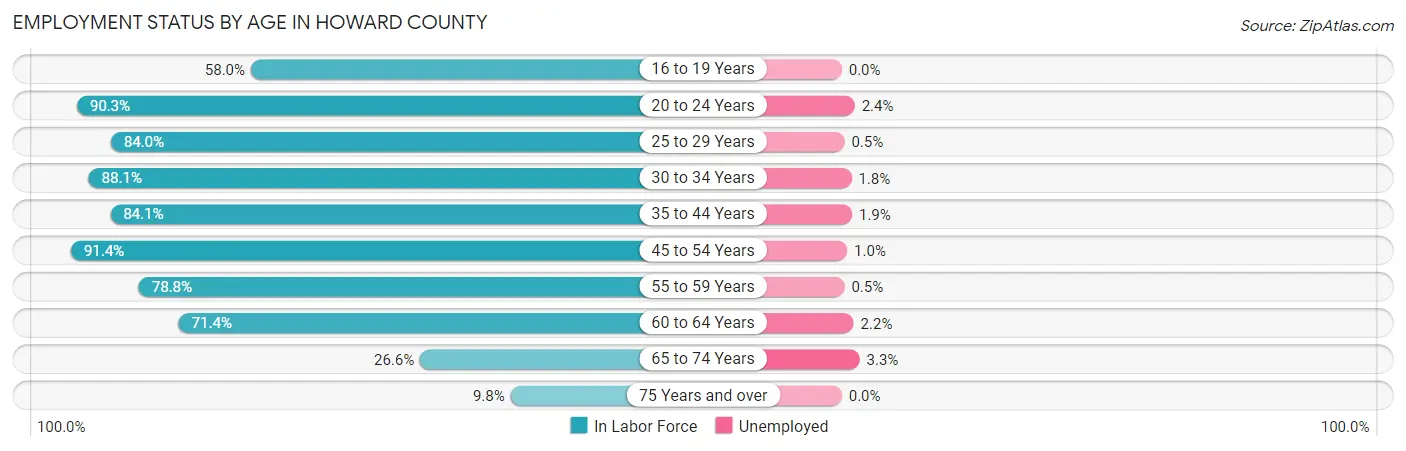
| Age Bracket | In Labor Force | Unemployed |
| 16 to 19 Years | 251 (58.0%) | 0 (0.0%) |
| 20 to 24 Years | 463 (90.3%) | 11 (2.4%) |
| 25 to 29 Years | 405 (84.0%) | 2 (0.5%) |
| 30 to 34 Years | 446 (88.1%) | 8 (1.8%) |
| 35 to 44 Years | 924 (84.1%) | 18 (1.9%) |
| 45 to 54 Years | 919 (91.4%) | 9 (1.0%) |
| 55 to 59 Years | 569 (78.8%) | 3 (0.5%) |
| 60 to 64 Years | 451 (71.4%) | 10 (2.2%) |
| 65 to 74 Years | 276 (26.6%) | 9 (3.3%) |
| 75 Years and over | 88 (9.8%) | 0 (0.0%) |
| Total | 4,792 (65.4%) | 72 (1.5%) |
Employment Status by Educational Attainment in Howard County
According to labor force statistics for Howard County, 83.5% of individuals (3,713) out of the total population between 25 and 64 years of age (4,447) are in the labor force, with 1.3% or 48 of them being unemployed. The group with the highest labor force participation rate are those with the educational attainment of college / associate degree, with 91.1% or 1,426 individuals in the labor force. Within the labor force, individuals with college / associate degree education have the highest percentage of unemployment, with 1.8% or 26 of them being unemployed.
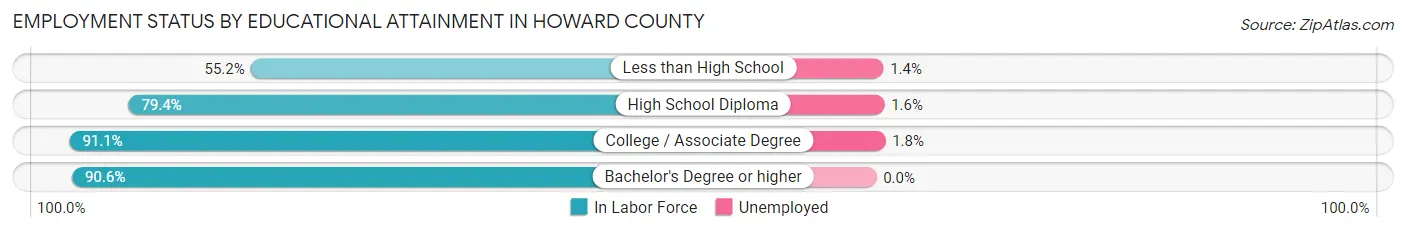
| Educational Attainment | In Labor Force | Unemployed |
| Less than High School | 222 (55.2%) | 6 (1.4%) |
| High School Diploma | 1,284 (79.4%) | 26 (1.6%) |
| College / Associate Degree | 1,426 (91.1%) | 28 (1.8%) |
| Bachelor's Degree or higher | 782 (90.6%) | 0 (0.0%) |
| Total | 3,713 (83.5%) | 58 (1.3%) |
Employment Occupations by Sex in Howard County
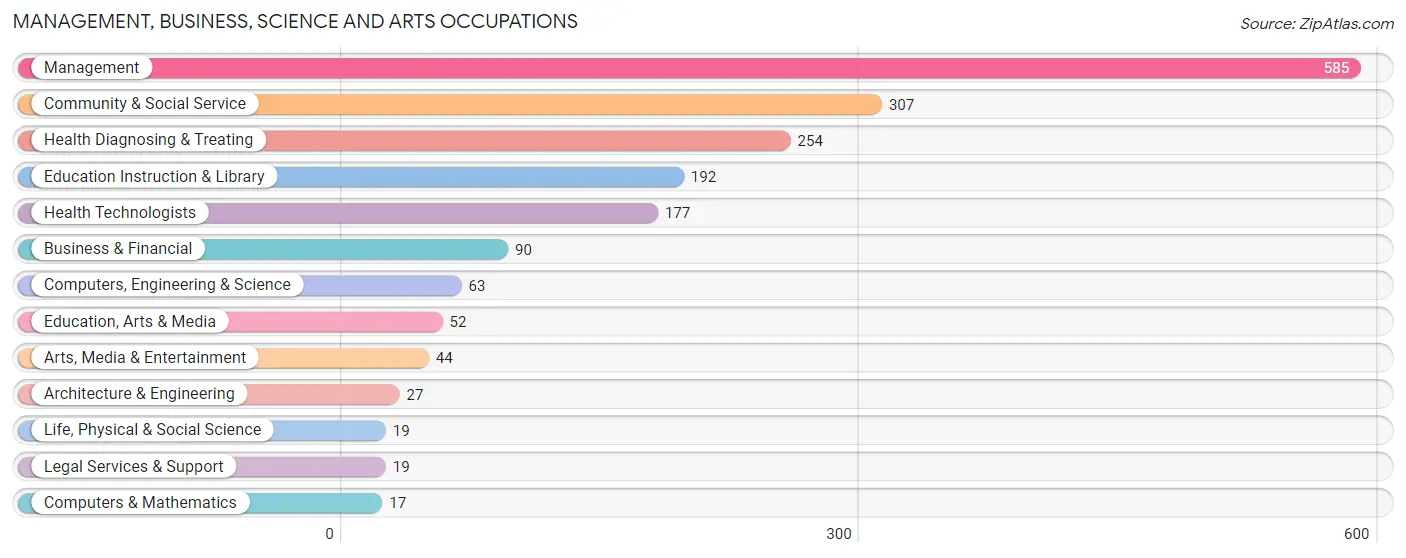
Management, Business, Science and Arts Occupations
The most common Management, Business, Science and Arts occupations in Howard County are Management (585 | 12.4%), Community & Social Service (307 | 6.5%), Health Diagnosing & Treating (254 | 5.4%), Education Instruction & Library (192 | 4.1%), and Health Technologists (177 | 3.7%).
Management, Business, Science and Arts Occupations by Sex
Within the Management, Business, Science and Arts occupations in Howard County, the most male-oriented occupations are Architecture & Engineering (100.0%), Management (60.7%), and Legal Services & Support (57.9%), while the most female-oriented occupations are Life, Physical & Social Science (100.0%), Health Technologists (96.6%), and Health Diagnosing & Treating (96.1%).

| Occupation | Male | Female |
| Management | 355 (60.7%) | 230 (39.3%) |
| Business & Financial | 21 (23.3%) | 69 (76.7%) |
| Computers, Engineering & Science | 34 (54.0%) | 29 (46.0%) |
| Computers & Mathematics | 7 (41.2%) | 10 (58.8%) |
| Architecture & Engineering | 27 (100.0%) | 0 (0.0%) |
| Life, Physical & Social Science | 0 (0.0%) | 19 (100.0%) |
| Community & Social Service | 111 (36.2%) | 196 (63.8%) |
| Education, Arts & Media | 17 (32.7%) | 35 (67.3%) |
| Legal Services & Support | 11 (57.9%) | 8 (42.1%) |
| Education Instruction & Library | 61 (31.8%) | 131 (68.2%) |
| Arts, Media & Entertainment | 22 (50.0%) | 22 (50.0%) |
| Health Diagnosing & Treating | 10 (3.9%) | 244 (96.1%) |
| Health Technologists | 6 (3.4%) | 171 (96.6%) |
| Total (Category) | 531 (40.9%) | 768 (59.1%) |
| Total (Overall) | 2,525 (53.5%) | 2,197 (46.5%) |
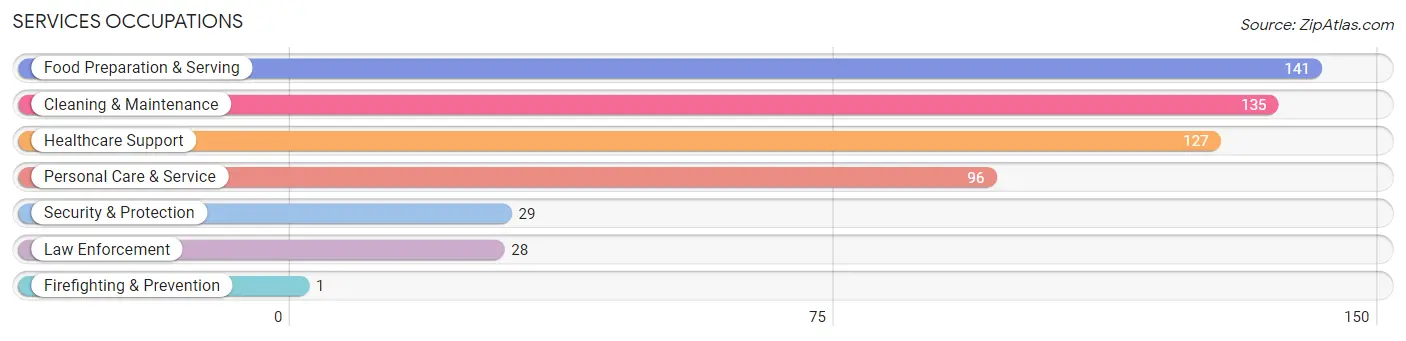
Services Occupations
The most common Services occupations in Howard County are Food Preparation & Serving (141 | 3.0%), Cleaning & Maintenance (135 | 2.9%), Healthcare Support (127 | 2.7%), Personal Care & Service (96 | 2.0%), and Security & Protection (29 | 0.6%).
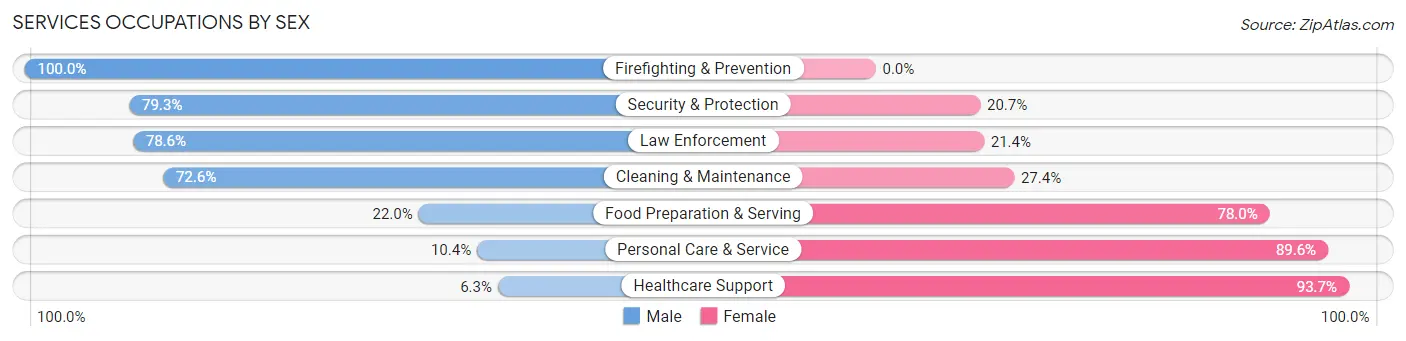
Services Occupations by Sex
Within the Services occupations in Howard County, the most male-oriented occupations are Firefighting & Prevention (100.0%), Security & Protection (79.3%), and Law Enforcement (78.6%), while the most female-oriented occupations are Healthcare Support (93.7%), Personal Care & Service (89.6%), and Food Preparation & Serving (78.0%).
| Occupation | Male | Female |
| Healthcare Support | 8 (6.3%) | 119 (93.7%) |
| Security & Protection | 23 (79.3%) | 6 (20.7%) |
| Firefighting & Prevention | 1 (100.0%) | 0 (0.0%) |
| Law Enforcement | 22 (78.6%) | 6 (21.4%) |
| Food Preparation & Serving | 31 (22.0%) | 110 (78.0%) |
| Cleaning & Maintenance | 98 (72.6%) | 37 (27.4%) |
| Personal Care & Service | 10 (10.4%) | 86 (89.6%) |
| Total (Category) | 170 (32.2%) | 358 (67.8%) |
| Total (Overall) | 2,525 (53.5%) | 2,197 (46.5%) |
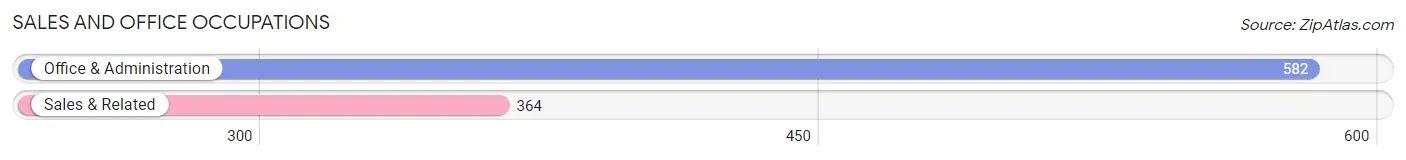
Sales and Office Occupations
The most common Sales and Office occupations in Howard County are Office & Administration (582 | 12.3%), and Sales & Related (364 | 7.7%).
Sales and Office Occupations by Sex
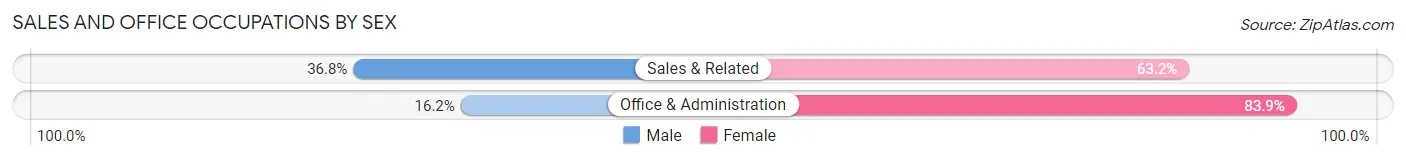
| Occupation | Male | Female |
| Sales & Related | 134 (36.8%) | 230 (63.2%) |
| Office & Administration | 94 (16.2%) | 488 (83.9%) |
| Total (Category) | 228 (24.1%) | 718 (75.9%) |
| Total (Overall) | 2,525 (53.5%) | 2,197 (46.5%) |
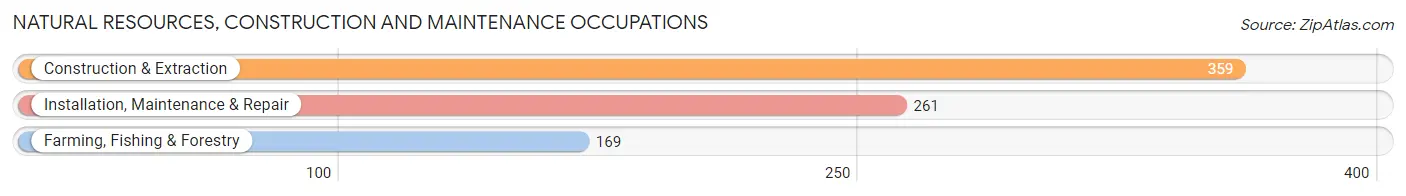
Natural Resources, Construction and Maintenance Occupations
The most common Natural Resources, Construction and Maintenance occupations in Howard County are Construction & Extraction (359 | 7.6%), Installation, Maintenance & Repair (261 | 5.5%), and Farming, Fishing & Forestry (169 | 3.6%).
Natural Resources, Construction and Maintenance Occupations by Sex
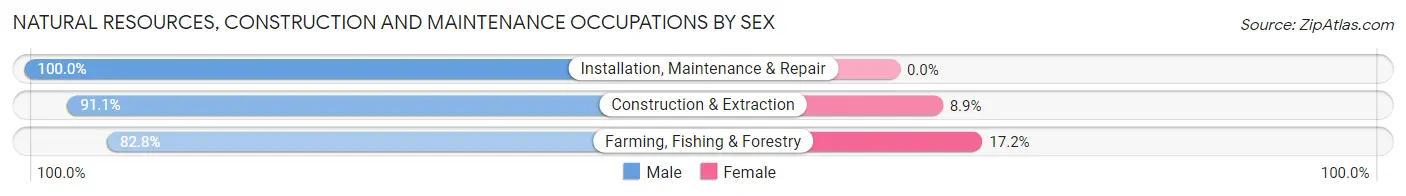
| Occupation | Male | Female |
| Farming, Fishing & Forestry | 140 (82.8%) | 29 (17.2%) |
| Construction & Extraction | 327 (91.1%) | 32 (8.9%) |
| Installation, Maintenance & Repair | 261 (100.0%) | 0 (0.0%) |
| Total (Category) | 728 (92.3%) | 61 (7.7%) |
| Total (Overall) | 2,525 (53.5%) | 2,197 (46.5%) |
Production, Transportation and Moving Occupations
The most common Production, Transportation and Moving occupations in Howard County are Production (617 | 13.1%), Material Moving (366 | 7.7%), and Transportation (177 | 3.7%).
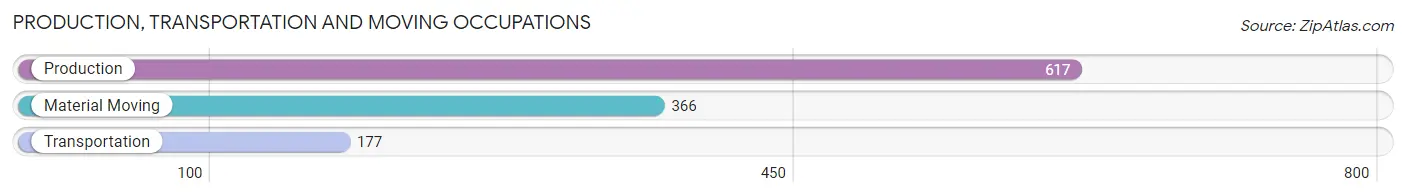
Production, Transportation and Moving Occupations by Sex
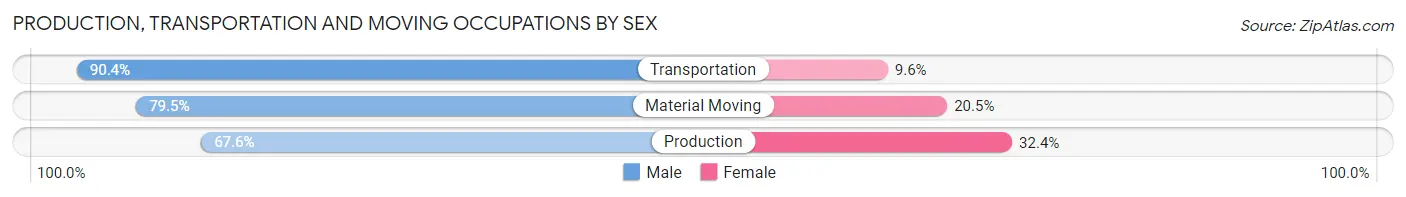
| Occupation | Male | Female |
| Production | 417 (67.6%) | 200 (32.4%) |
| Transportation | 160 (90.4%) | 17 (9.6%) |
| Material Moving | 291 (79.5%) | 75 (20.5%) |
| Total (Category) | 868 (74.8%) | 292 (25.2%) |
| Total (Overall) | 2,525 (53.5%) | 2,197 (46.5%) |
Employment Industries by Sex in Howard County
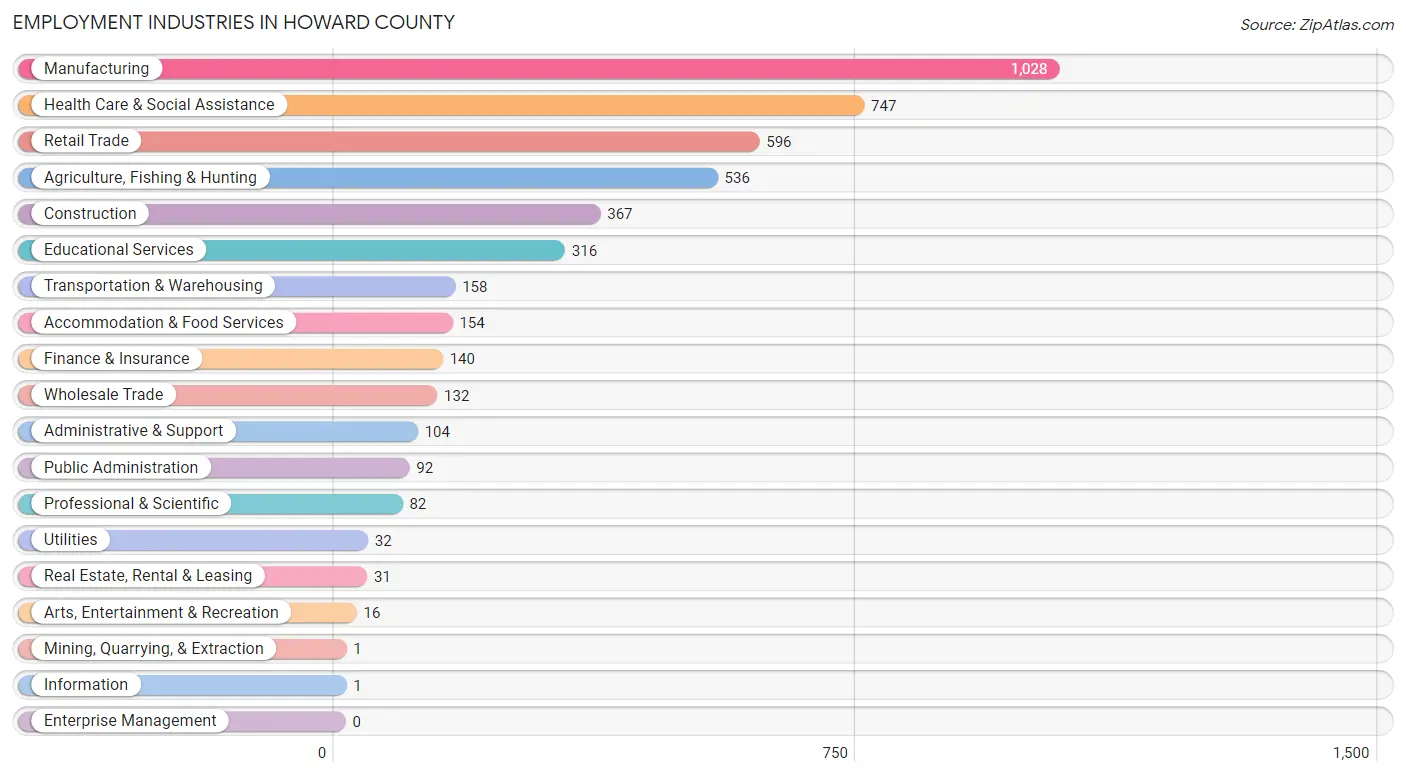
Employment Industries in Howard County
The major employment industries in Howard County include Manufacturing (1,028 | 21.8%), Health Care & Social Assistance (747 | 15.8%), Retail Trade (596 | 12.6%), Agriculture, Fishing & Hunting (536 | 11.4%), and Construction (367 | 7.8%).
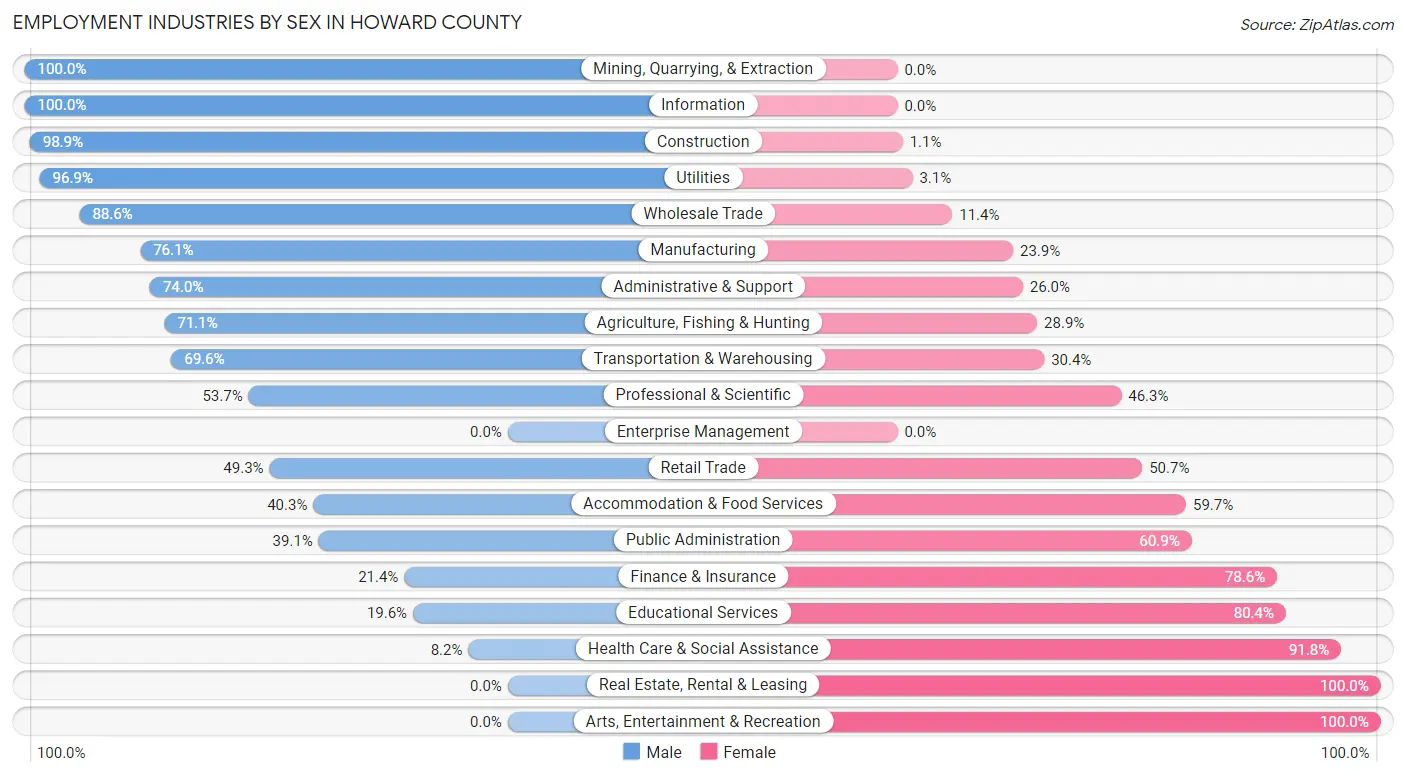
Employment Industries by Sex in Howard County
The Howard County industries that see more men than women are Mining, Quarrying, & Extraction (100.0%), Information (100.0%), and Construction (98.9%), whereas the industries that tend to have a higher number of women are Real Estate, Rental & Leasing (100.0%), Arts, Entertainment & Recreation (100.0%), and Health Care & Social Assistance (91.8%).
| Industry | Male | Female |
| Agriculture, Fishing & Hunting | 381 (71.1%) | 155 (28.9%) |
| Mining, Quarrying, & Extraction | 1 (100.0%) | 0 (0.0%) |
| Construction | 363 (98.9%) | 4 (1.1%) |
| Manufacturing | 782 (76.1%) | 246 (23.9%) |
| Wholesale Trade | 117 (88.6%) | 15 (11.4%) |
| Retail Trade | 294 (49.3%) | 302 (50.7%) |
| Transportation & Warehousing | 110 (69.6%) | 48 (30.4%) |
| Utilities | 31 (96.9%) | 1 (3.1%) |
| Information | 1 (100.0%) | 0 (0.0%) |
| Finance & Insurance | 30 (21.4%) | 110 (78.6%) |
| Real Estate, Rental & Leasing | 0 (0.0%) | 31 (100.0%) |
| Professional & Scientific | 44 (53.7%) | 38 (46.3%) |
| Enterprise Management | 0 (0.0%) | 0 (0.0%) |
| Administrative & Support | 77 (74.0%) | 27 (26.0%) |
| Educational Services | 62 (19.6%) | 254 (80.4%) |
| Health Care & Social Assistance | 61 (8.2%) | 686 (91.8%) |
| Arts, Entertainment & Recreation | 0 (0.0%) | 16 (100.0%) |
| Accommodation & Food Services | 62 (40.3%) | 92 (59.7%) |
| Public Administration | 36 (39.1%) | 56 (60.9%) |
| Total | 2,525 (53.5%) | 2,197 (46.5%) |
Education in Howard County
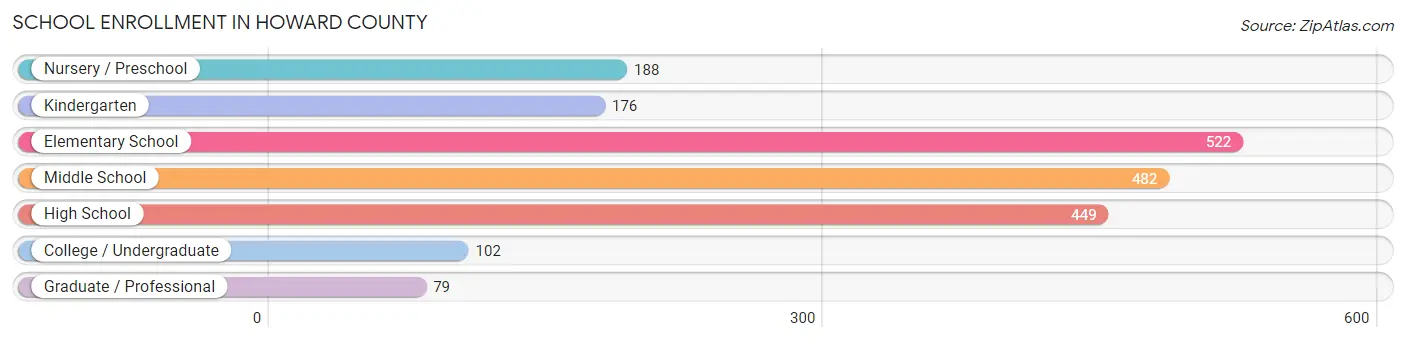
School Enrollment in Howard County
The most common levels of schooling among the 1,998 students in Howard County are elementary school (522 | 26.1%), middle school (482 | 24.1%), and high school (449 | 22.5%).
| School Level | # Students | % Students |
| Nursery / Preschool | 188 | 9.4% |
| Kindergarten | 176 | 8.8% |
| Elementary School | 522 | 26.1% |
| Middle School | 482 | 24.1% |
| High School | 449 | 22.5% |
| College / Undergraduate | 102 | 5.1% |
| Graduate / Professional | 79 | 4.0% |
| Total | 1,998 | 100.0% |
School Enrollment by Age by Funding Source in Howard County
Out of a total of 1,998 students who are enrolled in schools in Howard County, 575 (28.8%) attend a private institution, while the remaining 1,423 (71.2%) are enrolled in public schools. The age group of 25 to 34 year olds has the highest likelihood of being enrolled in private schools, with 41 (87.2% in the age bracket) enrolled. Conversely, the age group of 18 to 19 year olds has the lowest likelihood of being enrolled in a private school, with 76 (100.0% in the age bracket) attending a public institution.
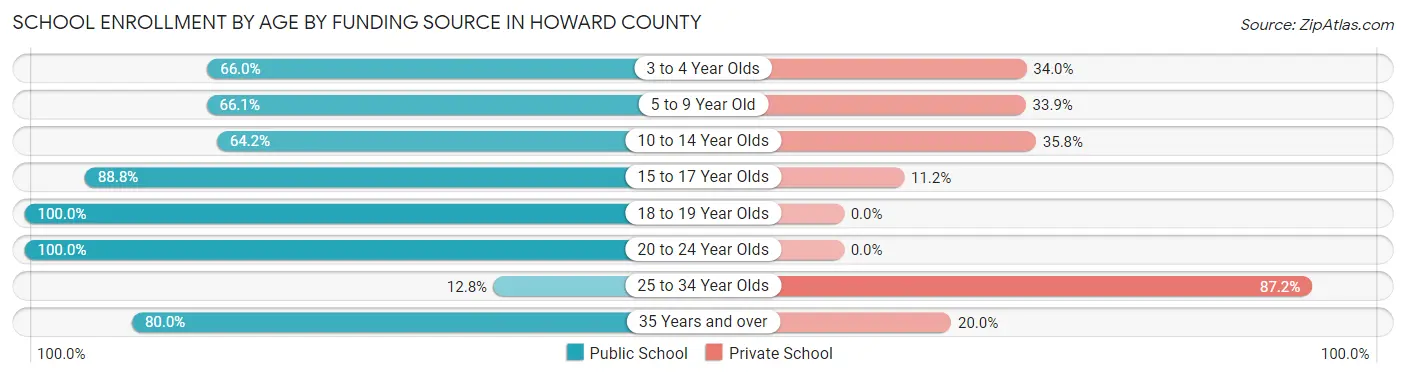
| Age Bracket | Public School | Private School |
| 3 to 4 Year Olds | 95 (66.0%) | 49 (34.0%) |
| 5 to 9 Year Old | 425 (66.1%) | 218 (33.9%) |
| 10 to 14 Year Olds | 382 (64.2%) | 213 (35.8%) |
| 15 to 17 Year Olds | 316 (88.8%) | 40 (11.2%) |
| 18 to 19 Year Olds | 76 (100.0%) | 0 (0.0%) |
| 20 to 24 Year Olds | 67 (100.0%) | 0 (0.0%) |
| 25 to 34 Year Olds | 6 (12.8%) | 41 (87.2%) |
| 35 Years and over | 56 (80.0%) | 14 (20.0%) |
| Total | 1,423 (71.2%) | 575 (28.8%) |
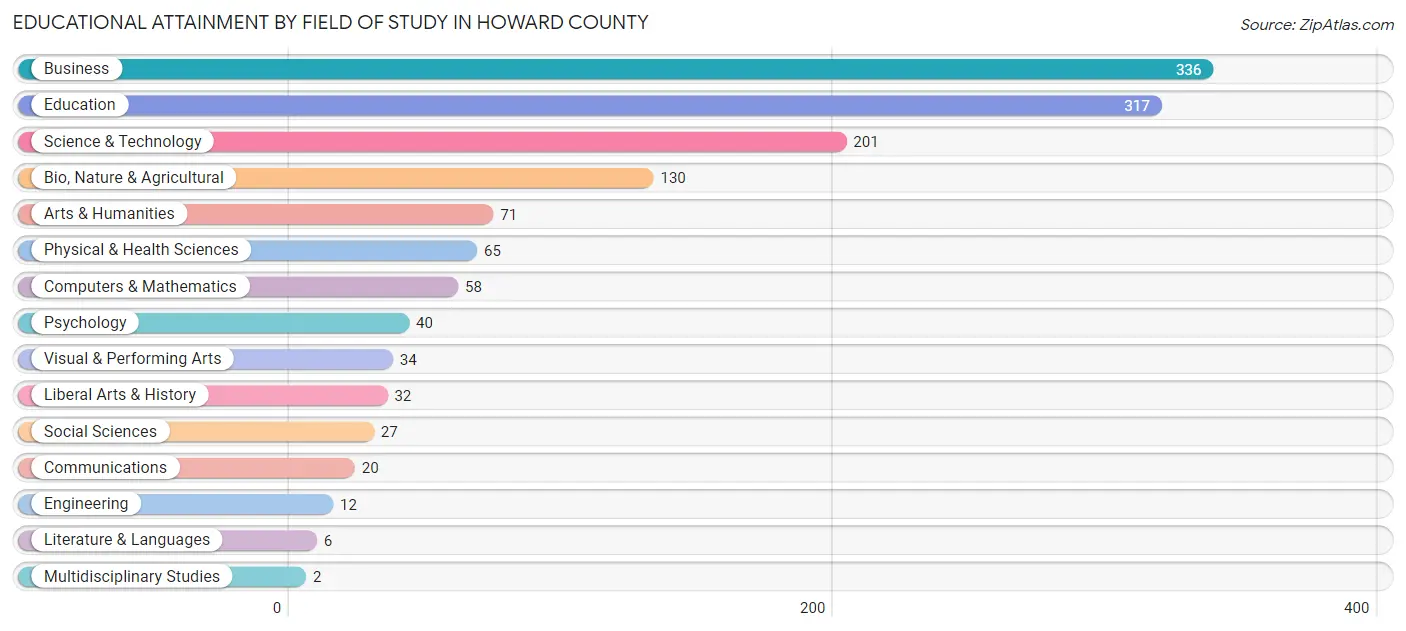
Educational Attainment by Field of Study in Howard County
Business (336 | 24.9%), education (317 | 23.5%), science & technology (201 | 14.9%), bio, nature & agricultural (130 | 9.6%), and arts & humanities (71 | 5.3%) are the most common fields of study among 1,351 individuals in Howard County who have obtained a bachelor's degree or higher.
| Field of Study | # Graduates | % Graduates |
| Computers & Mathematics | 58 | 4.3% |
| Bio, Nature & Agricultural | 130 | 9.6% |
| Physical & Health Sciences | 65 | 4.8% |
| Psychology | 40 | 3.0% |
| Social Sciences | 27 | 2.0% |
| Engineering | 12 | 0.9% |
| Multidisciplinary Studies | 2 | 0.2% |
| Science & Technology | 201 | 14.9% |
| Business | 336 | 24.9% |
| Education | 317 | 23.5% |
| Literature & Languages | 6 | 0.4% |
| Liberal Arts & History | 32 | 2.4% |
| Visual & Performing Arts | 34 | 2.5% |
| Communications | 20 | 1.5% |
| Arts & Humanities | 71 | 5.3% |
| Total | 1,351 | 100.0% |
Transportation & Commute in Howard County
Vehicle Availability by Sex in Howard County
The most prevalent vehicle ownership categories in Howard County are males with 2 vehicles (907, accounting for 37.3%) and females with 2 vehicles (827, making up 42.8%).
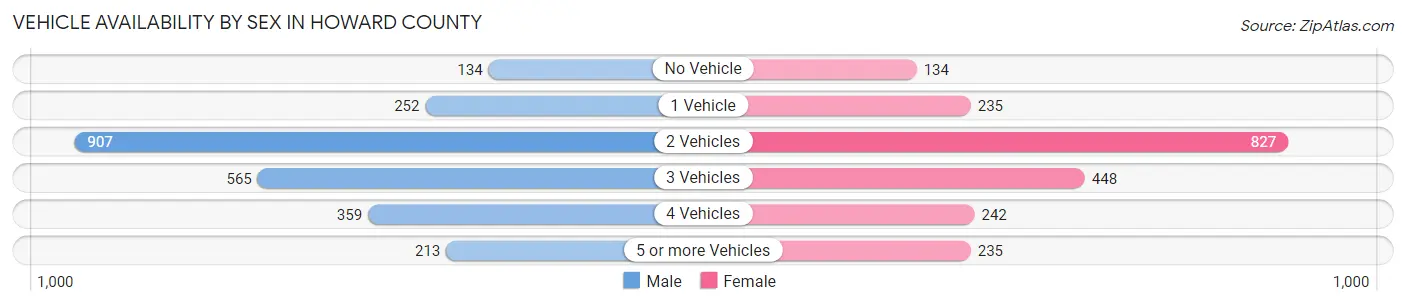
| Vehicles Available | Male | Female |
| No Vehicle | 134 (5.5%) | 134 (6.3%) |
| 1 Vehicle | 252 (10.4%) | 235 (11.1%) |
| 2 Vehicles | 907 (37.3%) | 827 (39.0%) |
| 3 Vehicles | 565 (23.3%) | 448 (21.1%) |
| 4 Vehicles | 359 (14.8%) | 242 (11.4%) |
| 5 or more Vehicles | 213 (8.8%) | 235 (11.1%) |
| Total | 2,430 (100.0%) | 2,121 (100.0%) |
Commute Time in Howard County
The most frequently occuring commute durations in Howard County are 5 to 9 minutes (952 commuters, 23.1%), less than 5 minutes (613 commuters, 14.9%), and 10 to 14 minutes (547 commuters, 13.3%).
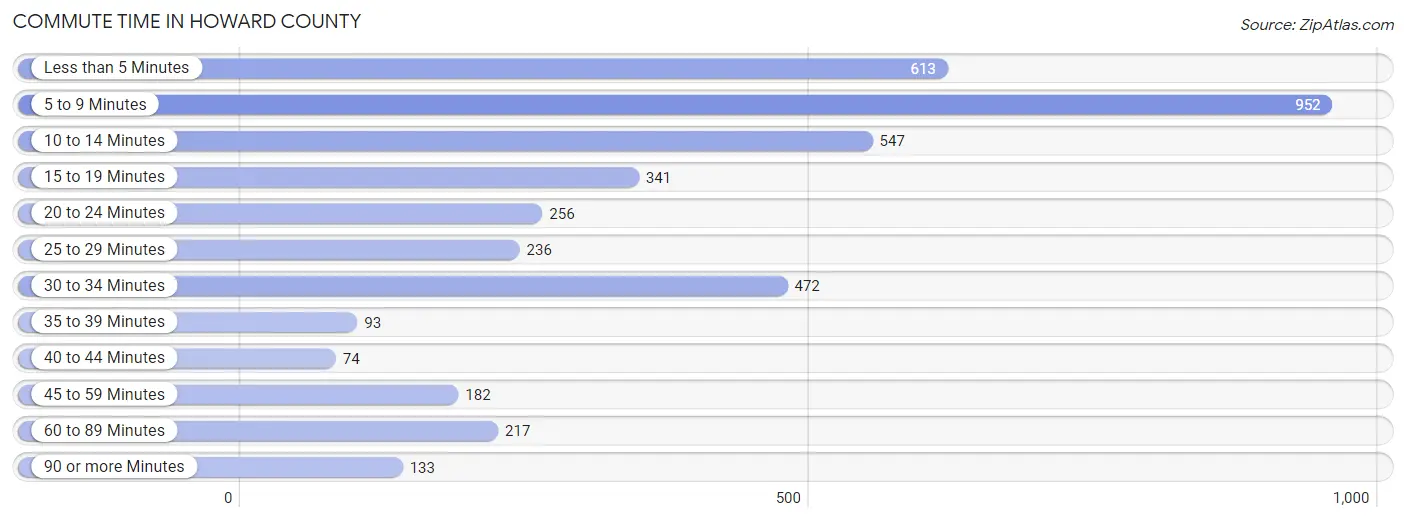
| Commute Time | # Commuters | % Commuters |
| Less than 5 Minutes | 613 | 14.9% |
| 5 to 9 Minutes | 952 | 23.1% |
| 10 to 14 Minutes | 547 | 13.3% |
| 15 to 19 Minutes | 341 | 8.3% |
| 20 to 24 Minutes | 256 | 6.2% |
| 25 to 29 Minutes | 236 | 5.7% |
| 30 to 34 Minutes | 472 | 11.5% |
| 35 to 39 Minutes | 93 | 2.3% |
| 40 to 44 Minutes | 74 | 1.8% |
| 45 to 59 Minutes | 182 | 4.4% |
| 60 to 89 Minutes | 217 | 5.3% |
| 90 or more Minutes | 133 | 3.2% |
Commute Time by Sex in Howard County
The most common commute times in Howard County are 5 to 9 minutes (543 commuters, 24.5%) for males and 5 to 9 minutes (409 commuters, 21.6%) for females.
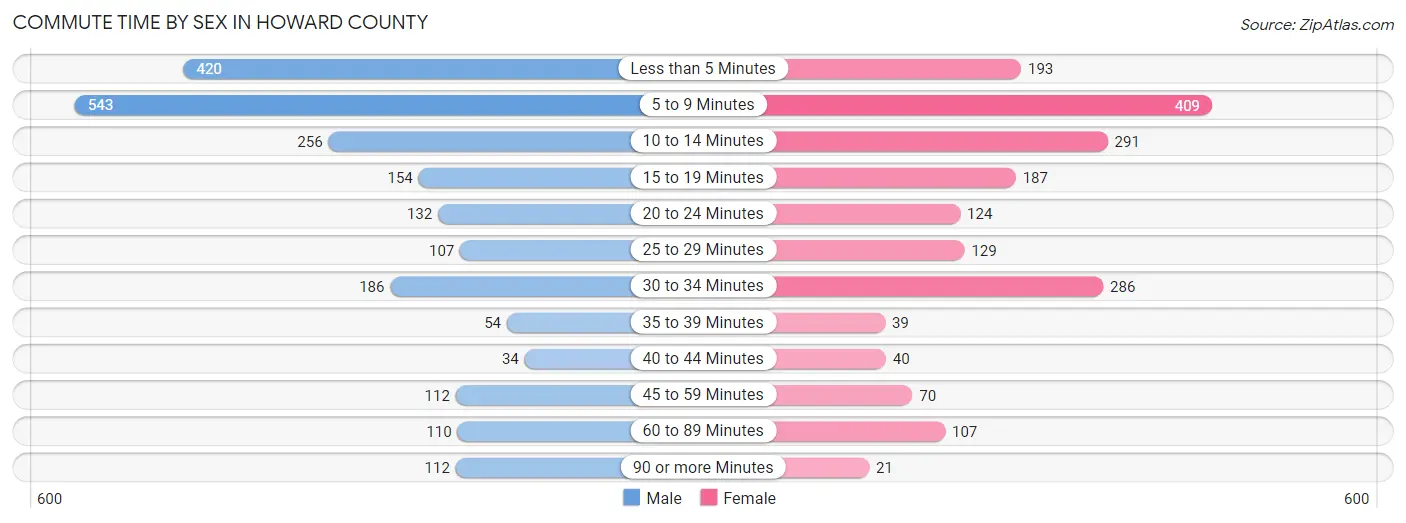
| Commute Time | Male | Female |
| Less than 5 Minutes | 420 (18.9%) | 193 (10.2%) |
| 5 to 9 Minutes | 543 (24.5%) | 409 (21.6%) |
| 10 to 14 Minutes | 256 (11.5%) | 291 (15.3%) |
| 15 to 19 Minutes | 154 (6.9%) | 187 (9.9%) |
| 20 to 24 Minutes | 132 (5.9%) | 124 (6.5%) |
| 25 to 29 Minutes | 107 (4.8%) | 129 (6.8%) |
| 30 to 34 Minutes | 186 (8.4%) | 286 (15.1%) |
| 35 to 39 Minutes | 54 (2.4%) | 39 (2.1%) |
| 40 to 44 Minutes | 34 (1.5%) | 40 (2.1%) |
| 45 to 59 Minutes | 112 (5.1%) | 70 (3.7%) |
| 60 to 89 Minutes | 110 (5.0%) | 107 (5.6%) |
| 90 or more Minutes | 112 (5.1%) | 21 (1.1%) |
Time of Departure to Work by Sex in Howard County
The most frequent times of departure to work in Howard County are 5:30 AM to 5:59 AM (397, 17.9%) for males and 7:30 AM to 7:59 AM (416, 21.9%) for females.
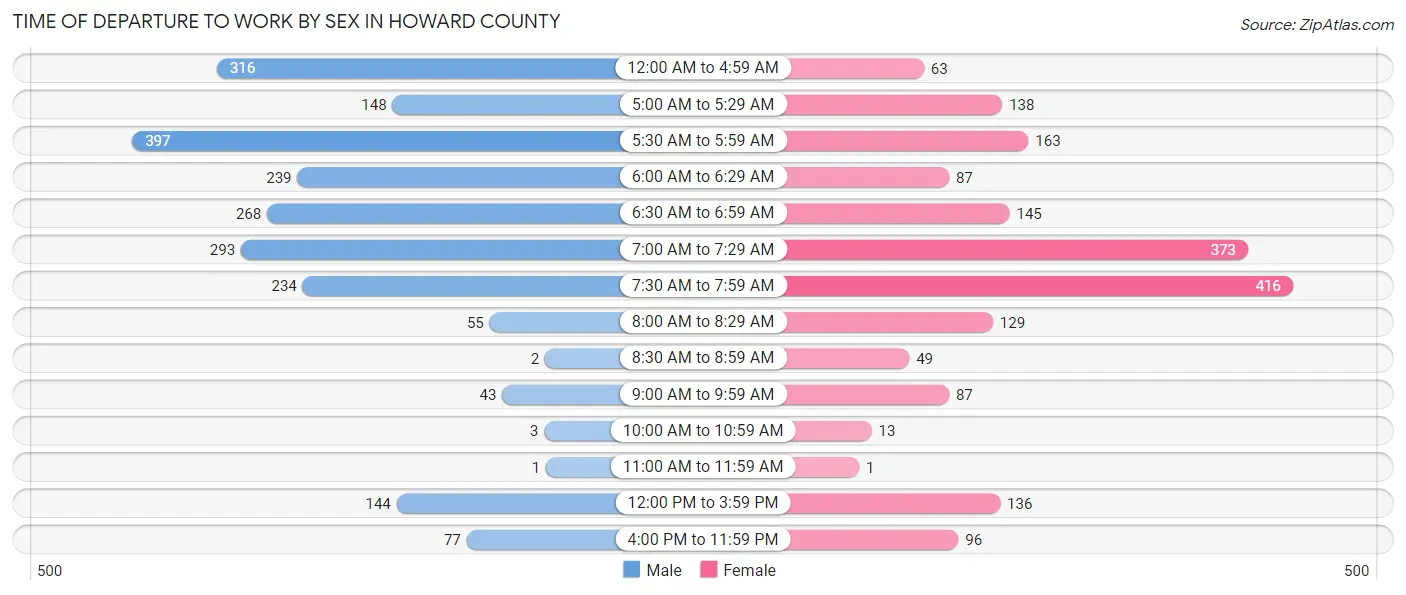
| Time of Departure | Male | Female |
| 12:00 AM to 4:59 AM | 316 (14.2%) | 63 (3.3%) |
| 5:00 AM to 5:29 AM | 148 (6.7%) | 138 (7.3%) |
| 5:30 AM to 5:59 AM | 397 (17.9%) | 163 (8.6%) |
| 6:00 AM to 6:29 AM | 239 (10.8%) | 87 (4.6%) |
| 6:30 AM to 6:59 AM | 268 (12.1%) | 145 (7.6%) |
| 7:00 AM to 7:29 AM | 293 (13.2%) | 373 (19.7%) |
| 7:30 AM to 7:59 AM | 234 (10.5%) | 416 (21.9%) |
| 8:00 AM to 8:29 AM | 55 (2.5%) | 129 (6.8%) |
| 8:30 AM to 8:59 AM | 2 (0.1%) | 49 (2.6%) |
| 9:00 AM to 9:59 AM | 43 (1.9%) | 87 (4.6%) |
| 10:00 AM to 10:59 AM | 3 (0.1%) | 13 (0.7%) |
| 11:00 AM to 11:59 AM | 1 (0.1%) | 1 (0.1%) |
| 12:00 PM to 3:59 PM | 144 (6.5%) | 136 (7.2%) |
| 4:00 PM to 11:59 PM | 77 (3.5%) | 96 (5.1%) |
| Total | 2,220 (100.0%) | 1,896 (100.0%) |
Housing Occupancy in Howard County
Occupancy by Ownership in Howard County
Of the total 3,636 dwellings in Howard County, owner-occupied units account for 2,770 (76.2%), while renter-occupied units make up 866 (23.8%).

| Occupancy | # Housing Units | % Housing Units |
| Owner Occupied Housing Units | 2,770 | 76.2% |
| Renter-Occupied Housing Units | 866 | 23.8% |
| Total Occupied Housing Units | 3,636 | 100.0% |
Occupancy by Household Size in Howard County
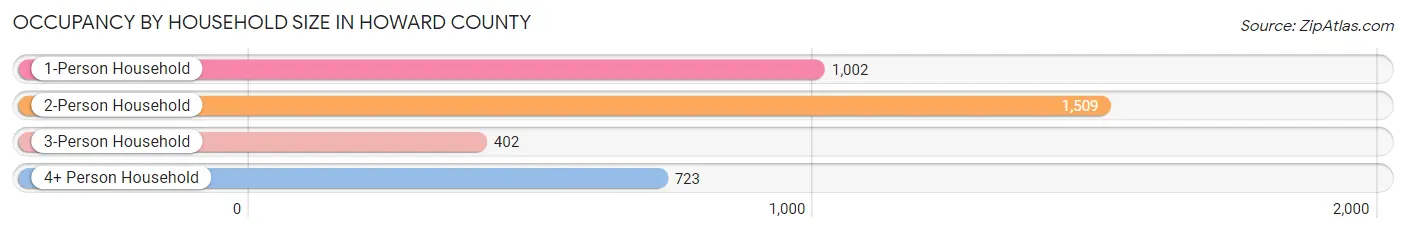
| Household Size | # Housing Units | % Housing Units |
| 1-Person Household | 1,002 | 27.6% |
| 2-Person Household | 1,509 | 41.5% |
| 3-Person Household | 402 | 11.1% |
| 4+ Person Household | 723 | 19.9% |
| Total Housing Units | 3,636 | 100.0% |
Occupancy by Ownership by Household Size in Howard County
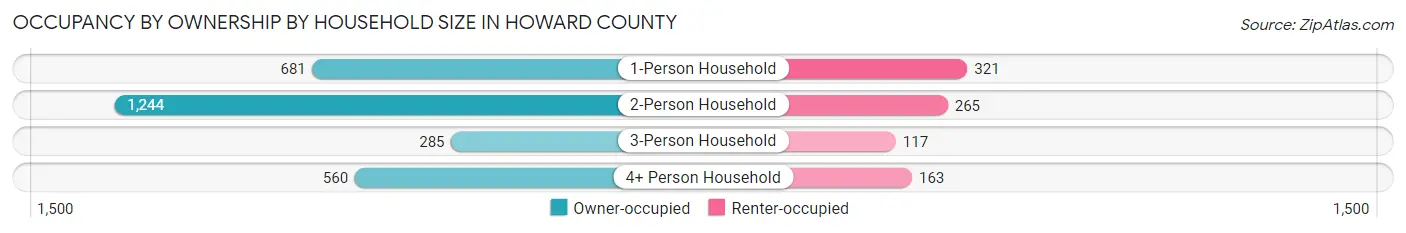
| Household Size | Owner-occupied | Renter-occupied |
| 1-Person Household | 681 (68.0%) | 321 (32.0%) |
| 2-Person Household | 1,244 (82.4%) | 265 (17.6%) |
| 3-Person Household | 285 (70.9%) | 117 (29.1%) |
| 4+ Person Household | 560 (77.5%) | 163 (22.5%) |
| Total Housing Units | 2,770 (76.2%) | 866 (23.8%) |
Occupancy by Educational Attainment in Howard County
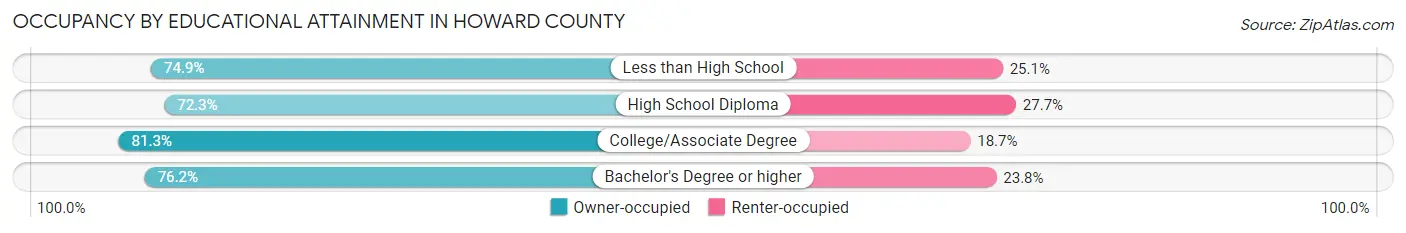
| Household Size | Owner-occupied | Renter-occupied |
| Less than High School | 218 (74.9%) | 73 (25.1%) |
| High School Diploma | 1,015 (72.3%) | 389 (27.7%) |
| College/Associate Degree | 920 (81.3%) | 211 (18.7%) |
| Bachelor's Degree or higher | 617 (76.2%) | 193 (23.8%) |
Occupancy by Age of Householder in Howard County
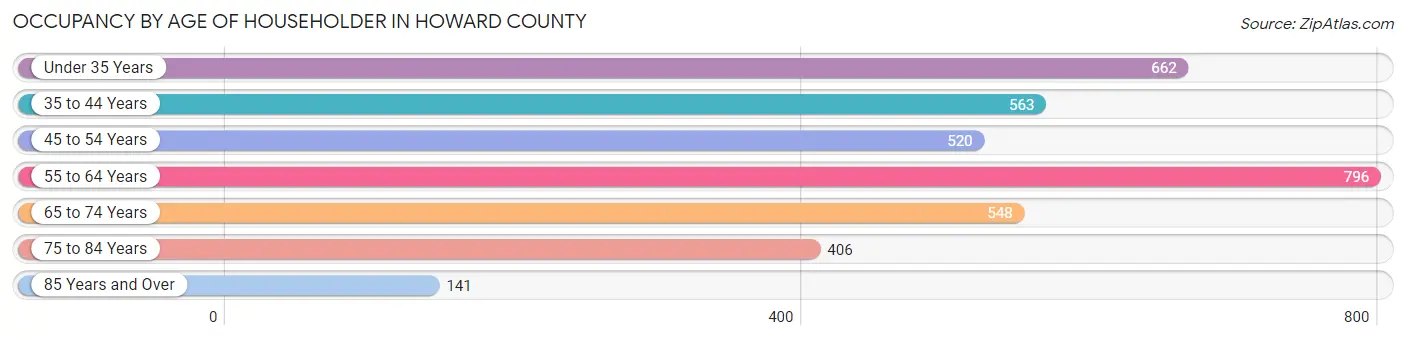
| Age Bracket | # Households | % Households |
| Under 35 Years | 662 | 18.2% |
| 35 to 44 Years | 563 | 15.5% |
| 45 to 54 Years | 520 | 14.3% |
| 55 to 64 Years | 796 | 21.9% |
| 65 to 74 Years | 548 | 15.1% |
| 75 to 84 Years | 406 | 11.2% |
| 85 Years and Over | 141 | 3.9% |
| Total | 3,636 | 100.0% |
Housing Finances in Howard County
Median Income by Occupancy in Howard County

| Occupancy Type | # Households | Median Income |
| Owner-Occupied | 2,770 (76.2%) | $73,685 |
| Renter-Occupied | 866 (23.8%) | $42,273 |
| Average | 3,636 (100.0%) | $63,947 |
Occupancy by Householder Income Bracket in Howard County
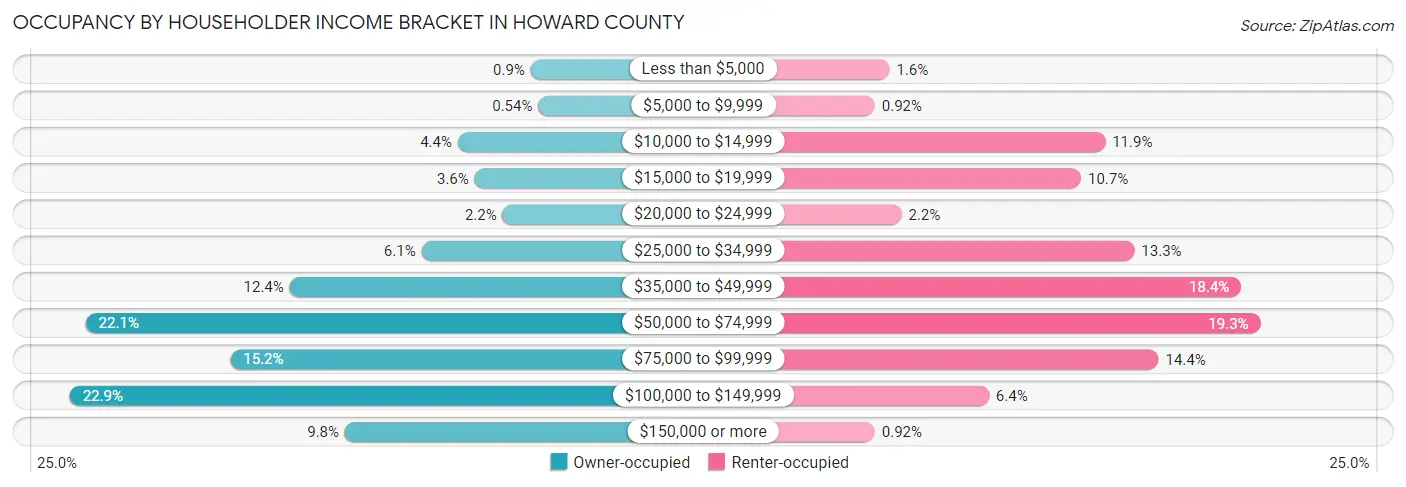
| Income Bracket | Owner-occupied | Renter-occupied |
| Less than $5,000 | 25 (0.9%) | 14 (1.6%) |
| $5,000 to $9,999 | 15 (0.5%) | 8 (0.9%) |
| $10,000 to $14,999 | 121 (4.4%) | 103 (11.9%) |
| $15,000 to $19,999 | 99 (3.6%) | 93 (10.7%) |
| $20,000 to $24,999 | 62 (2.2%) | 19 (2.2%) |
| $25,000 to $34,999 | 169 (6.1%) | 115 (13.3%) |
| $35,000 to $49,999 | 343 (12.4%) | 159 (18.4%) |
| $50,000 to $74,999 | 612 (22.1%) | 167 (19.3%) |
| $75,000 to $99,999 | 421 (15.2%) | 125 (14.4%) |
| $100,000 to $149,999 | 633 (22.9%) | 55 (6.4%) |
| $150,000 or more | 270 (9.8%) | 8 (0.9%) |
| Total | 2,770 (100.0%) | 866 (100.0%) |
Monthly Housing Cost Tiers in Howard County
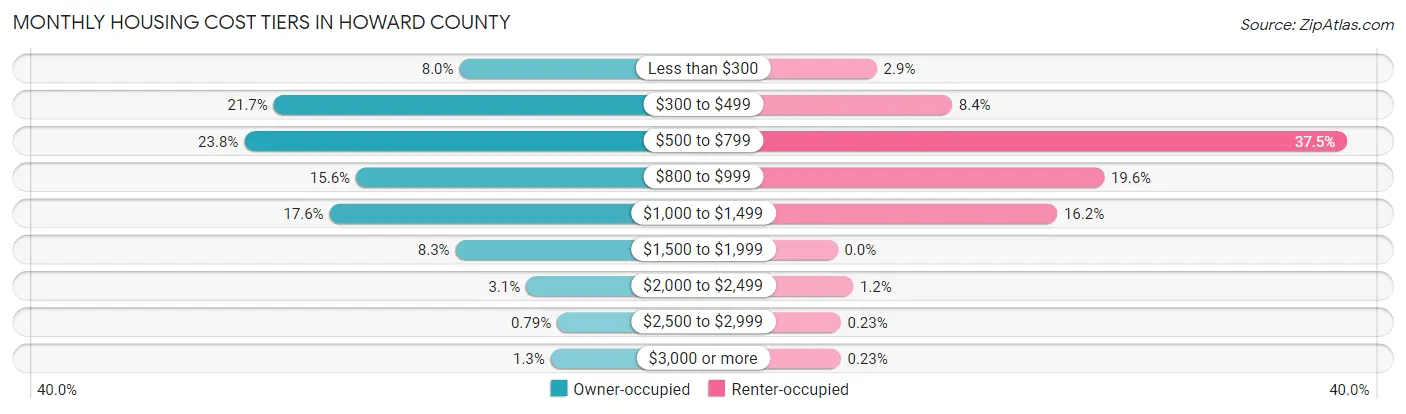
| Monthly Cost | Owner-occupied | Renter-occupied |
| Less than $300 | 221 (8.0%) | 25 (2.9%) |
| $300 to $499 | 600 (21.7%) | 73 (8.4%) |
| $500 to $799 | 660 (23.8%) | 325 (37.5%) |
| $800 to $999 | 432 (15.6%) | 170 (19.6%) |
| $1,000 to $1,499 | 486 (17.5%) | 140 (16.2%) |
| $1,500 to $1,999 | 229 (8.3%) | 0 (0.0%) |
| $2,000 to $2,499 | 85 (3.1%) | 10 (1.1%) |
| $2,500 to $2,999 | 22 (0.8%) | 2 (0.2%) |
| $3,000 or more | 35 (1.3%) | 2 (0.2%) |
| Total | 2,770 (100.0%) | 866 (100.0%) |
Physical Housing Characteristics in Howard County
Housing Structures in Howard County
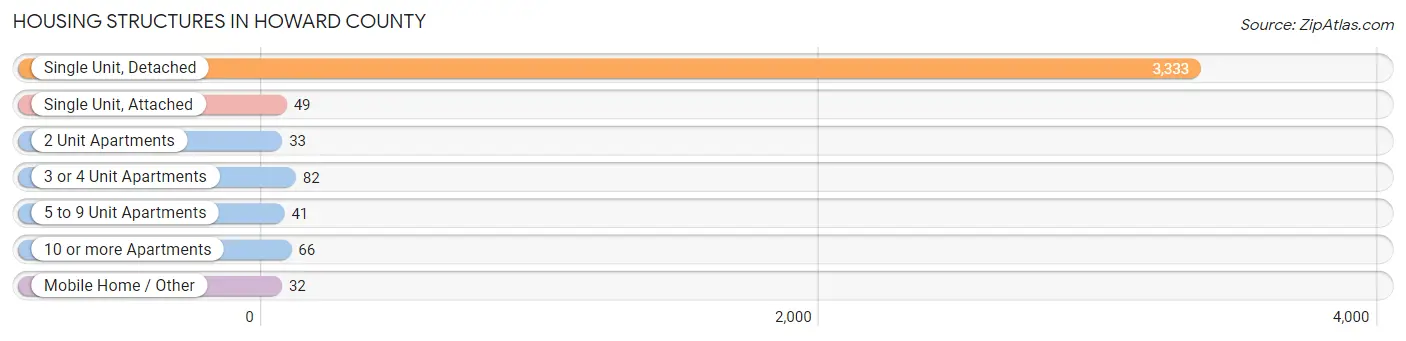
| Structure Type | # Housing Units | % Housing Units |
| Single Unit, Detached | 3,333 | 91.7% |
| Single Unit, Attached | 49 | 1.3% |
| 2 Unit Apartments | 33 | 0.9% |
| 3 or 4 Unit Apartments | 82 | 2.3% |
| 5 to 9 Unit Apartments | 41 | 1.1% |
| 10 or more Apartments | 66 | 1.8% |
| Mobile Home / Other | 32 | 0.9% |
| Total | 3,636 | 100.0% |
Housing Structures by Occupancy in Howard County
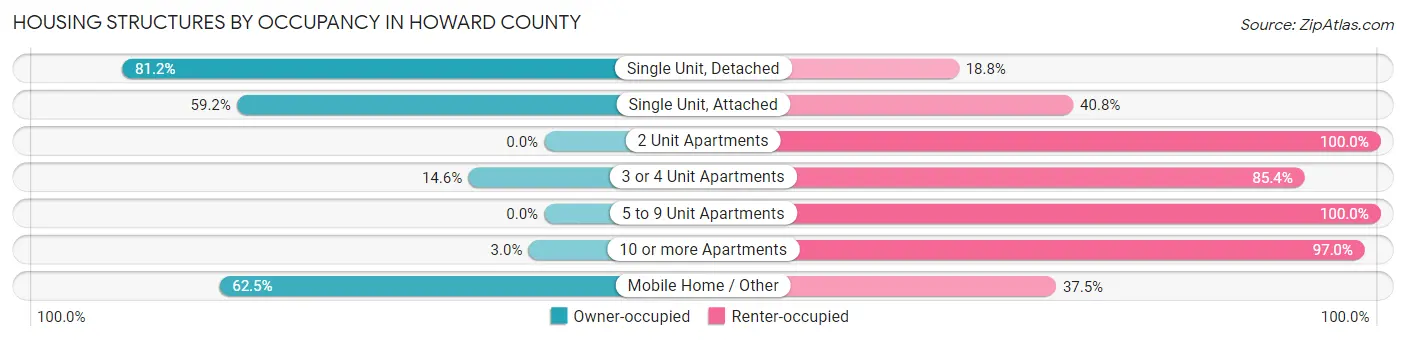
| Structure Type | Owner-occupied | Renter-occupied |
| Single Unit, Detached | 2,707 (81.2%) | 626 (18.8%) |
| Single Unit, Attached | 29 (59.2%) | 20 (40.8%) |
| 2 Unit Apartments | 0 (0.0%) | 33 (100.0%) |
| 3 or 4 Unit Apartments | 12 (14.6%) | 70 (85.4%) |
| 5 to 9 Unit Apartments | 0 (0.0%) | 41 (100.0%) |
| 10 or more Apartments | 2 (3.0%) | 64 (97.0%) |
| Mobile Home / Other | 20 (62.5%) | 12 (37.5%) |
| Total | 2,770 (76.2%) | 866 (23.8%) |
Housing Structures by Number of Rooms in Howard County
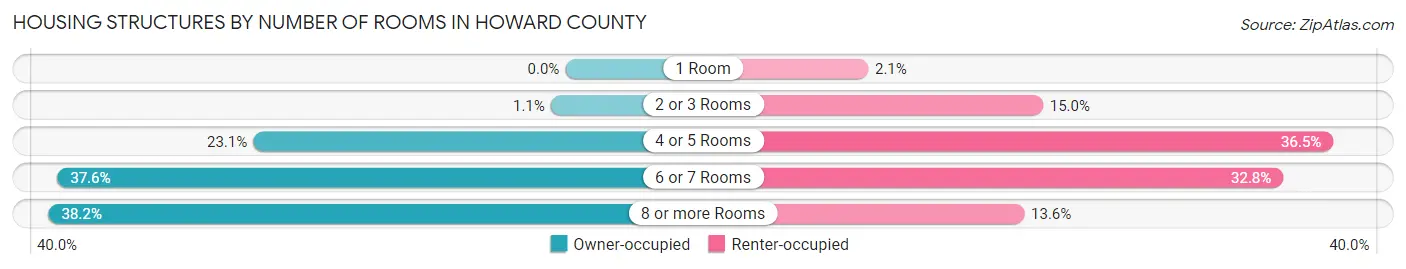
| Number of Rooms | Owner-occupied | Renter-occupied |
| 1 Room | 0 (0.0%) | 18 (2.1%) |
| 2 or 3 Rooms | 30 (1.1%) | 130 (15.0%) |
| 4 or 5 Rooms | 640 (23.1%) | 316 (36.5%) |
| 6 or 7 Rooms | 1,041 (37.6%) | 284 (32.8%) |
| 8 or more Rooms | 1,059 (38.2%) | 118 (13.6%) |
| Total | 2,770 (100.0%) | 866 (100.0%) |
Housing Structure by Heating Type in Howard County
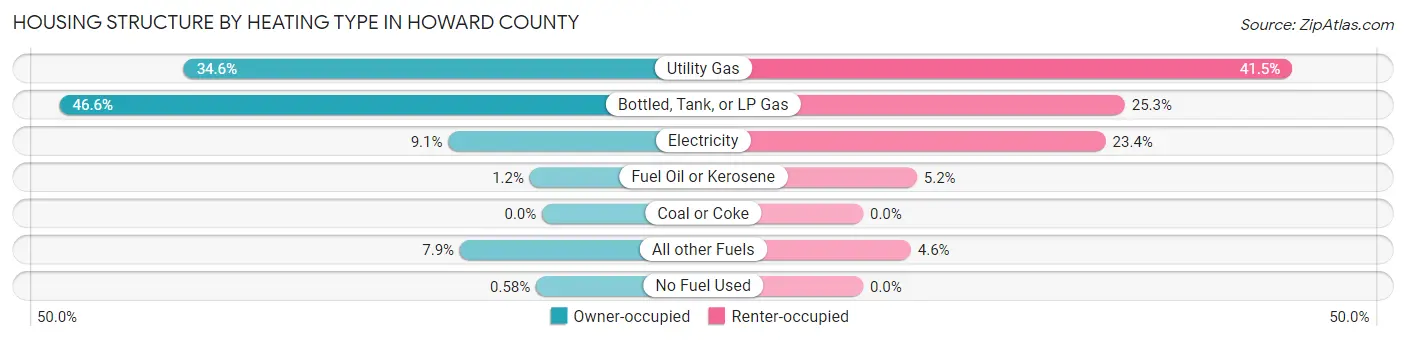
| Heating Type | Owner-occupied | Renter-occupied |
| Utility Gas | 959 (34.6%) | 359 (41.4%) |
| Bottled, Tank, or LP Gas | 1,291 (46.6%) | 219 (25.3%) |
| Electricity | 251 (9.1%) | 203 (23.4%) |
| Fuel Oil or Kerosene | 33 (1.2%) | 45 (5.2%) |
| Coal or Coke | 0 (0.0%) | 0 (0.0%) |
| All other Fuels | 220 (7.9%) | 40 (4.6%) |
| No Fuel Used | 16 (0.6%) | 0 (0.0%) |
| Total | 2,770 (100.0%) | 866 (100.0%) |
Household Vehicle Usage in Howard County
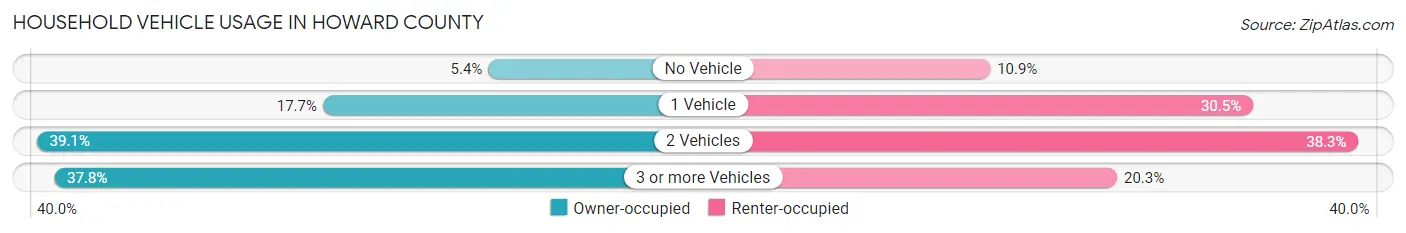
| Vehicles per Household | Owner-occupied | Renter-occupied |
| No Vehicle | 149 (5.4%) | 94 (10.8%) |
| 1 Vehicle | 491 (17.7%) | 264 (30.5%) |
| 2 Vehicles | 1,083 (39.1%) | 332 (38.3%) |
| 3 or more Vehicles | 1,047 (37.8%) | 176 (20.3%) |
| Total | 2,770 (100.0%) | 866 (100.0%) |
Real Estate & Mortgages in Howard County
Real Estate and Mortgage Overview in Howard County
| Characteristic | Without Mortgage | With Mortgage |
| Housing Units | 1,502 | 1,268 |
| Median Property Value | $128,400 | $121,900 |
| Median Household Income | $70,515 | $134 |
| Monthly Housing Costs | $486 | $24 |
| Real Estate Taxes | $1,520 | $13 |
Property Value by Mortgage Status in Howard County
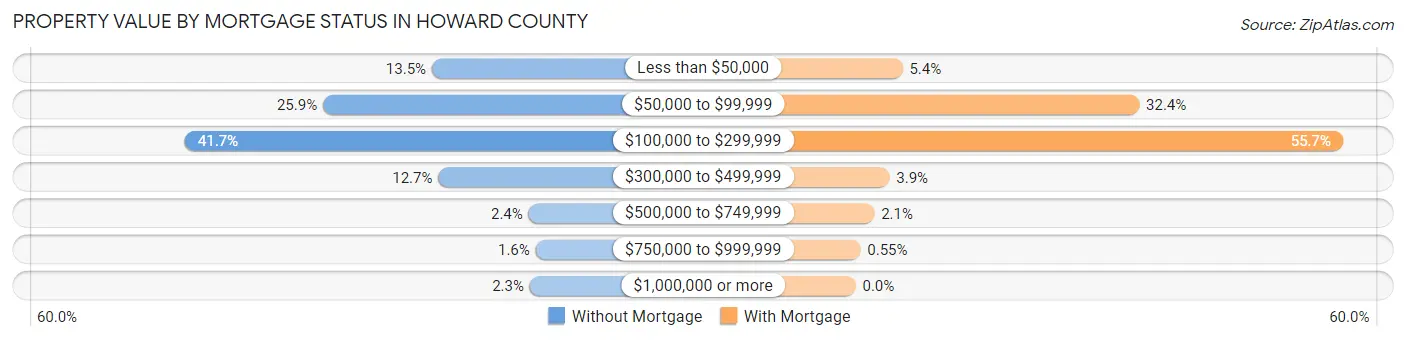
| Property Value | Without Mortgage | With Mortgage |
| Less than $50,000 | 202 (13.5%) | 68 (5.4%) |
| $50,000 to $99,999 | 389 (25.9%) | 411 (32.4%) |
| $100,000 to $299,999 | 626 (41.7%) | 706 (55.7%) |
| $300,000 to $499,999 | 191 (12.7%) | 49 (3.9%) |
| $500,000 to $749,999 | 36 (2.4%) | 27 (2.1%) |
| $750,000 to $999,999 | 24 (1.6%) | 7 (0.5%) |
| $1,000,000 or more | 34 (2.3%) | 0 (0.0%) |
| Total | 1,502 (100.0%) | 1,268 (100.0%) |
Household Income by Mortgage Status in Howard County
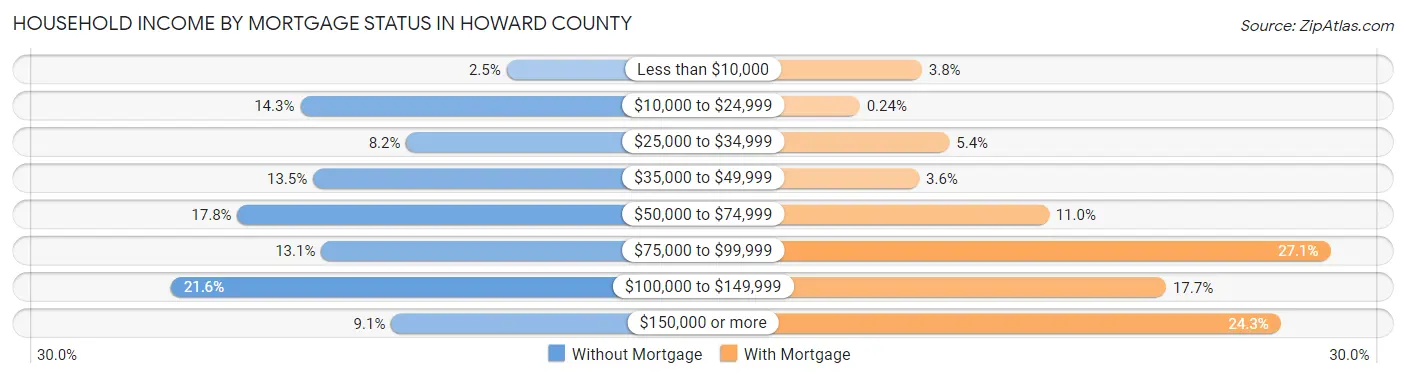
| Household Income | Without Mortgage | With Mortgage |
| Less than $10,000 | 37 (2.5%) | 48 (3.8%) |
| $10,000 to $24,999 | 214 (14.2%) | 3 (0.2%) |
| $25,000 to $34,999 | 123 (8.2%) | 68 (5.4%) |
| $35,000 to $49,999 | 203 (13.5%) | 46 (3.6%) |
| $50,000 to $74,999 | 268 (17.8%) | 140 (11.0%) |
| $75,000 to $99,999 | 196 (13.1%) | 344 (27.1%) |
| $100,000 to $149,999 | 325 (21.6%) | 225 (17.7%) |
| $150,000 or more | 136 (9.0%) | 308 (24.3%) |
| Total | 1,502 (100.0%) | 1,268 (100.0%) |
Property Value to Household Income Ratio in Howard County
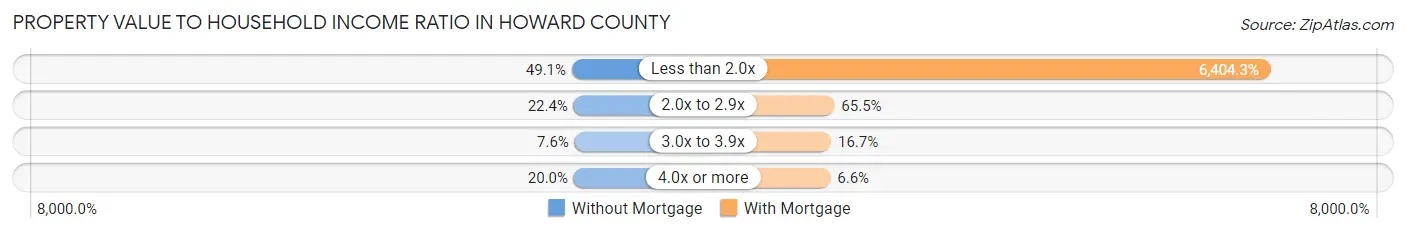
| Value-to-Income Ratio | Without Mortgage | With Mortgage |
| Less than 2.0x | 738 (49.1%) | 81,207 (6,404.3%) |
| 2.0x to 2.9x | 336 (22.4%) | 830 (65.5%) |
| 3.0x to 3.9x | 114 (7.6%) | 212 (16.7%) |
| 4.0x or more | 300 (20.0%) | 84 (6.6%) |
| Total | 1,502 (100.0%) | 1,268 (100.0%) |
Real Estate Taxes by Mortgage Status in Howard County
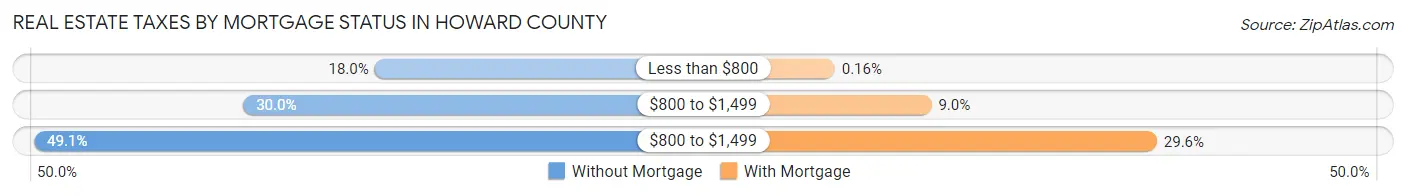
| Property Taxes | Without Mortgage | With Mortgage |
| Less than $800 | 271 (18.0%) | 2 (0.2%) |
| $800 to $1,499 | 451 (30.0%) | 114 (9.0%) |
| $800 to $1,499 | 738 (49.1%) | 375 (29.6%) |
| Total | 1,502 (100.0%) | 1,268 (100.0%) |
Health & Disability in Howard County
Health Insurance Coverage by Age in Howard County
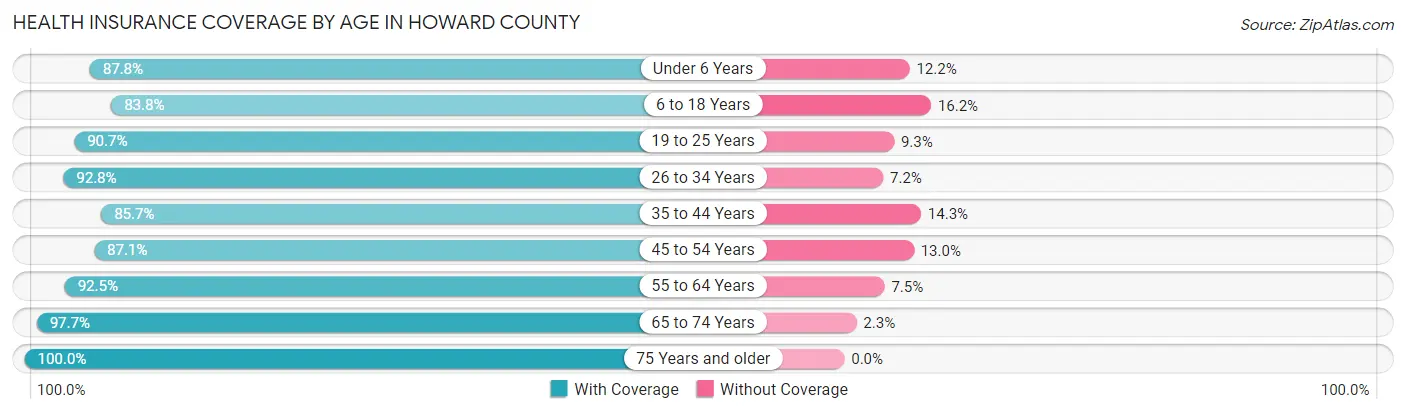
| Age Bracket | With Coverage | Without Coverage |
| Under 6 Years | 737 (87.8%) | 102 (12.2%) |
| 6 to 18 Years | 1,406 (83.8%) | 271 (16.2%) |
| 19 to 25 Years | 578 (90.7%) | 59 (9.3%) |
| 26 to 34 Years | 860 (92.8%) | 67 (7.2%) |
| 35 to 44 Years | 936 (85.7%) | 156 (14.3%) |
| 45 to 54 Years | 874 (87.1%) | 130 (13.0%) |
| 55 to 64 Years | 1,248 (92.5%) | 101 (7.5%) |
| 65 to 74 Years | 995 (97.7%) | 23 (2.3%) |
| 75 Years and older | 750 (100.0%) | 0 (0.0%) |
| Total | 8,384 (90.2%) | 909 (9.8%) |
Health Insurance Coverage by Citizenship Status in Howard County
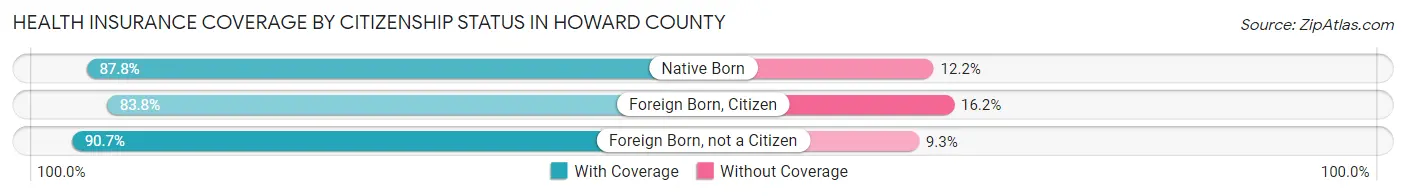
| Citizenship Status | With Coverage | Without Coverage |
| Native Born | 737 (87.8%) | 102 (12.2%) |
| Foreign Born, Citizen | 1,406 (83.8%) | 271 (16.2%) |
| Foreign Born, not a Citizen | 578 (90.7%) | 59 (9.3%) |
Health Insurance Coverage by Household Income in Howard County
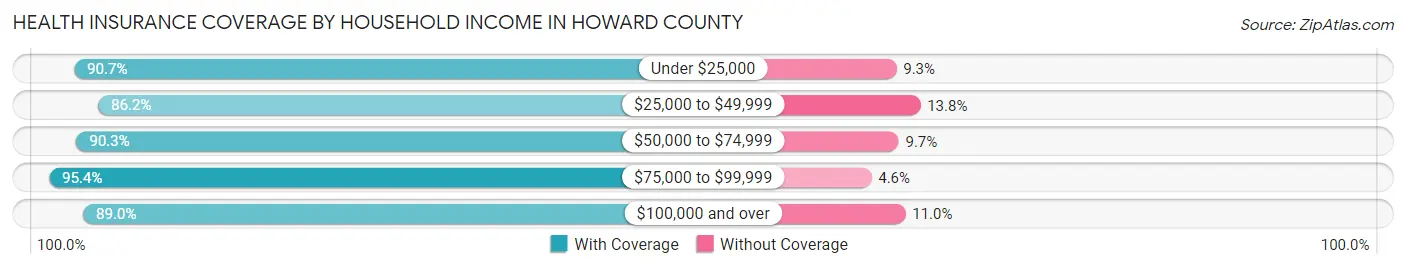
| Household Income | With Coverage | Without Coverage |
| Under $25,000 | 822 (90.7%) | 84 (9.3%) |
| $25,000 to $49,999 | 1,247 (86.2%) | 199 (13.8%) |
| $50,000 to $74,999 | 1,761 (90.3%) | 189 (9.7%) |
| $75,000 to $99,999 | 1,581 (95.4%) | 76 (4.6%) |
| $100,000 and over | 2,933 (89.0%) | 361 (11.0%) |
Public vs Private Health Insurance Coverage by Age in Howard County

| Age Bracket | Public Insurance | Private Insurance |
| Under 6 | 435 (51.8%) | 395 (47.1%) |
| 6 to 18 Years | 577 (34.4%) | 906 (54.0%) |
| 19 to 25 Years | 136 (21.3%) | 489 (76.8%) |
| 25 to 34 Years | 160 (17.3%) | 754 (81.3%) |
| 35 to 44 Years | 138 (12.6%) | 856 (78.4%) |
| 45 to 54 Years | 112 (11.2%) | 795 (79.2%) |
| 55 to 64 Years | 272 (20.2%) | 1,029 (76.3%) |
| 65 to 74 Years | 968 (95.1%) | 646 (63.5%) |
| 75 Years and over | 750 (100.0%) | 545 (72.7%) |
| Total | 3,548 (38.2%) | 6,415 (69.0%) |
Disability Status by Sex by Age in Howard County
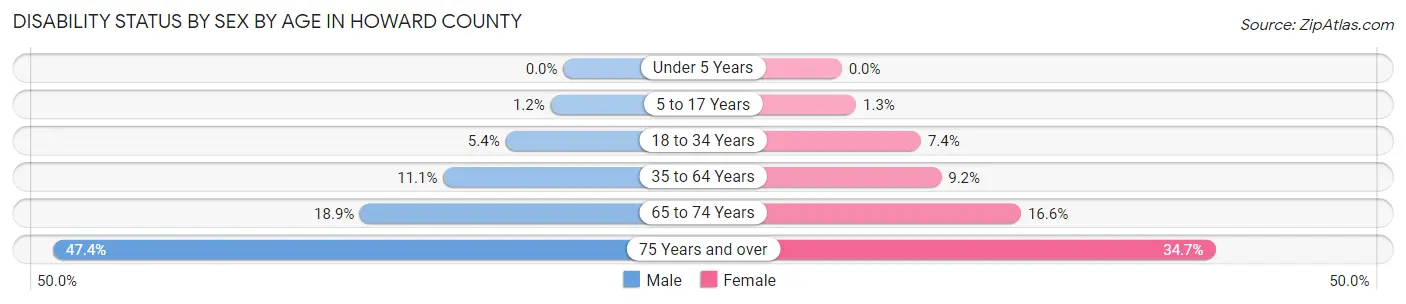
| Age Bracket | Male | Female |
| Under 5 Years | 0 (0.0%) | 0 (0.0%) |
| 5 to 17 Years | 11 (1.2%) | 11 (1.3%) |
| 18 to 34 Years | 44 (5.4%) | 62 (7.3%) |
| 35 to 64 Years | 198 (11.1%) | 154 (9.2%) |
| 65 to 74 Years | 99 (18.9%) | 82 (16.6%) |
| 75 Years and over | 153 (47.4%) | 148 (34.7%) |
Disability Class by Sex by Age in Howard County
Disability Class: Hearing Difficulty
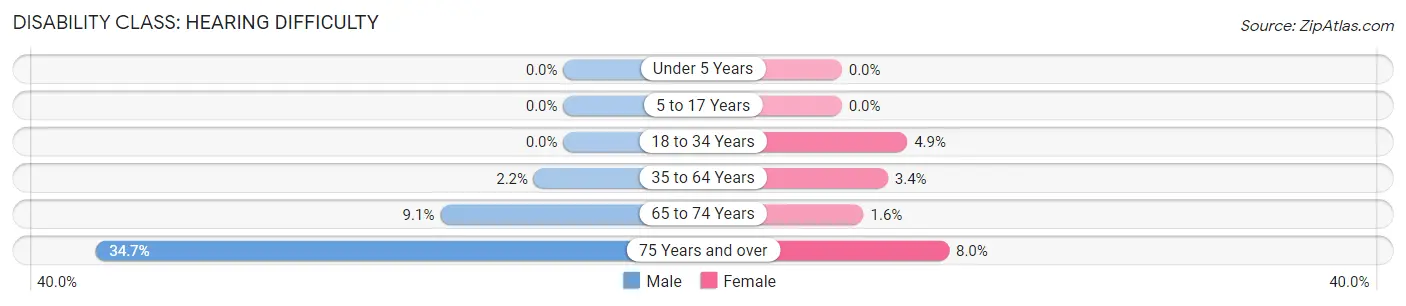
| Age Bracket | Male | Female |
| Under 5 Years | 0 (0.0%) | 0 (0.0%) |
| 5 to 17 Years | 0 (0.0%) | 0 (0.0%) |
| 18 to 34 Years | 0 (0.0%) | 41 (4.9%) |
| 35 to 64 Years | 39 (2.2%) | 57 (3.4%) |
| 65 to 74 Years | 48 (9.1%) | 8 (1.6%) |
| 75 Years and over | 112 (34.7%) | 34 (8.0%) |
Disability Class: Vision Difficulty
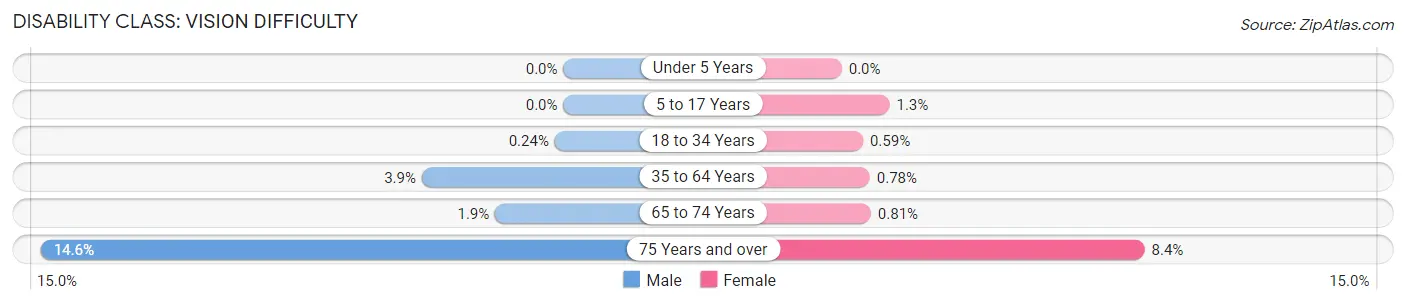
| Age Bracket | Male | Female |
| Under 5 Years | 0 (0.0%) | 0 (0.0%) |
| 5 to 17 Years | 0 (0.0%) | 11 (1.3%) |
| 18 to 34 Years | 2 (0.2%) | 5 (0.6%) |
| 35 to 64 Years | 70 (3.9%) | 13 (0.8%) |
| 65 to 74 Years | 10 (1.9%) | 4 (0.8%) |
| 75 Years and over | 47 (14.5%) | 36 (8.4%) |
Disability Class: Cognitive Difficulty
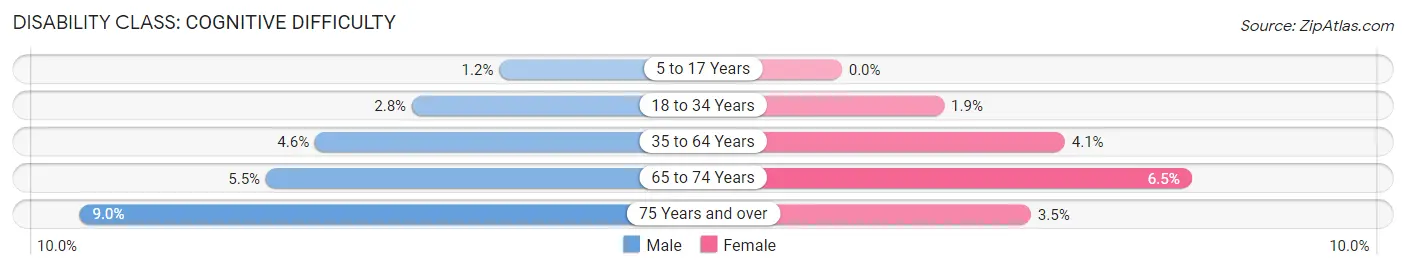
| Age Bracket | Male | Female |
| 5 to 17 Years | 11 (1.2%) | 0 (0.0%) |
| 18 to 34 Years | 23 (2.8%) | 16 (1.9%) |
| 35 to 64 Years | 82 (4.6%) | 69 (4.1%) |
| 65 to 74 Years | 29 (5.5%) | 32 (6.5%) |
| 75 Years and over | 29 (9.0%) | 15 (3.5%) |
Disability Class: Ambulatory Difficulty

| Age Bracket | Male | Female |
| 5 to 17 Years | 0 (0.0%) | 0 (0.0%) |
| 18 to 34 Years | 0 (0.0%) | 0 (0.0%) |
| 35 to 64 Years | 68 (3.8%) | 78 (4.7%) |
| 65 to 74 Years | 68 (13.0%) | 63 (12.8%) |
| 75 Years and over | 71 (22.0%) | 88 (20.6%) |
Disability Class: Self-Care Difficulty
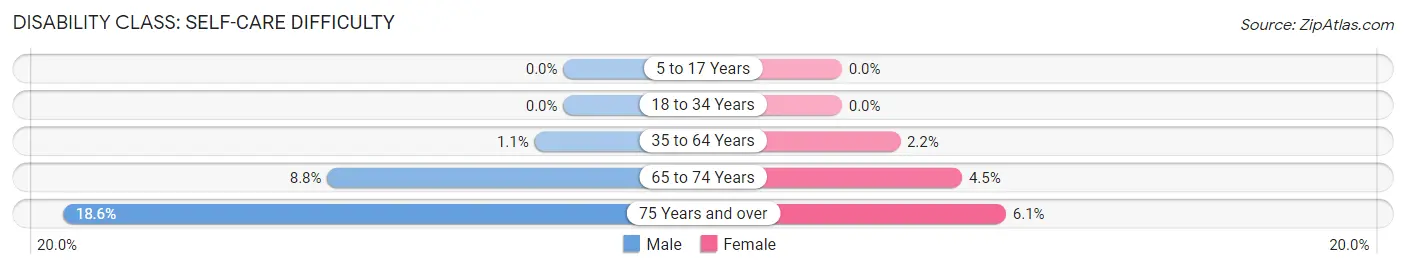
| Age Bracket | Male | Female |
| 5 to 17 Years | 0 (0.0%) | 0 (0.0%) |
| 18 to 34 Years | 0 (0.0%) | 0 (0.0%) |
| 35 to 64 Years | 19 (1.1%) | 36 (2.2%) |
| 65 to 74 Years | 46 (8.8%) | 22 (4.5%) |
| 75 Years and over | 60 (18.6%) | 26 (6.1%) |
Technology Access in Howard County
Computing Device Access in Howard County

| Device Type | # Households | % Households |
| Desktop or Laptop | 2,641 | 72.6% |
| Smartphone | 2,891 | 79.5% |
| Tablet | 2,061 | 56.7% |
| No Computing Device | 458 | 12.6% |
| Total | 3,636 | 100.0% |
Internet Access in Howard County

| Internet Type | # Households | % Households |
| Dial-Up Internet | 43 | 1.2% |
| Broadband Home | 2,171 | 59.7% |
| Cellular Data Only | 569 | 15.7% |
| Satellite Internet | 347 | 9.5% |
| No Internet | 617 | 17.0% |
| Total | 3,636 | 100.0% |
Howard County Summary
Howard County is located in the state of Iowa in the United States. It is located in the northeast corner of the state and is bordered by Winneshiek County to the north, Mitchell County to the east, Chickasaw County to the south, and Worth County to the west. The county seat is Cresco, and the largest city is Elma. The county was established in 1851 and named after General Tilghman Ashurst Howard, a veteran of the War of 1812.
Geography
Howard County is located in the northeast corner of Iowa and covers an area of 576 square miles. The county is mostly rural, with rolling hills and valleys. The Upper Iowa River runs through the county, and there are several small lakes and ponds scattered throughout the area. The highest point in the county is located in the northwest corner, at an elevation of 1,541 feet. The county is mostly covered in grasslands and agricultural fields, with some wooded areas in the northern and western parts.
Climate
Howard County has a humid continental climate, with cold winters and hot, humid summers. The average annual temperature is around 48°F, with average highs in the summer reaching around 85°F and average lows in the winter reaching around 10°F. The average annual precipitation is around 33 inches, with most of it falling in the spring and summer months.
Demographics
As of the 2010 census, Howard County had a population of 9,527. The population was spread out, with 48.3% male and 51.7% female. The median age was 43.2 years, and the median household income was $50,945. The racial makeup of the county was 97.2% White, 0.3% African American, 0.3% Native American, 0.4% Asian, 0.1% Pacific Islander, 0.7% from other races, and 0.9% from two or more races. Hispanic or Latino of any race were 2.2% of the population.
Economy
The economy of Howard County is largely based on agriculture. The county is home to several large farms, and the main crops grown are corn, soybeans, and hay. Livestock production is also important, with beef and dairy cattle being the main animals raised. The county also has several small businesses, including manufacturing, retail, and service industries.
The county is home to several educational institutions, including the University of Iowa, Upper Iowa University, and Hawkeye Community College. The county also has several recreational opportunities, including several parks, golf courses, and a ski resort.
Conclusion
Howard County is a rural county located in the northeast corner of Iowa. It is mostly covered in grasslands and agricultural fields, and the economy is largely based on agriculture. The county has a population of 9,527, and the median household income is $50,945. The county is home to several educational institutions and recreational opportunities, making it an attractive place to live and work.
Common Questions
What is the Total Population of Howard County?
Total Population of Howard County is 9,479.
What is the Total Male Population of Howard County?
Total Male Population of Howard County is 4,787.
What is the Total Female Population of Howard County?
Total Female Population of Howard County is 4,692.
What is the Ratio of Males per 100 Females in Howard County?
There are 102.02 Males per 100 Females in Howard County.
What is the Ratio of Females per 100 Males in Howard County?
There are 98.02 Females per 100 Males in Howard County.
What is the Median Population Age in Howard County?
Median Population Age in Howard County is 39.5 Years.
What is the Average Family Size in Howard County
Average Family Size in Howard County is 3.1 People.
What is the Average Household Size in Howard County
Average Household Size in Howard County is 2.5 People.
What is Per Capita Income in Howard County?
Per Capita income in Howard County is $32,033.
What is the Median Family Income in Howard County?
Median Family Income in Howard County is $81,250.
What is the Median Household income in Howard County?
Median Household Income in Howard County is $63,947.
What is Income or Wage Gap in Howard County?
Income or Wage Gap in Howard County is 19.5%.
Women in Howard County earn 80.5 cents for every dollar earned by a man.
What is Inequality or Gini Index in Howard County?
Inequality or Gini Index in Howard County is 0.42.
How Large is the Labor Force in Howard County?
There are 4,792 People in the Labor Forcein in Howard County.
What is the Percentage of People in the Labor Force in Howard County?
65.4% of People are in the Labor Force in Howard County.
What is the Unemployment Rate in Howard County?
Unemployment Rate in Howard County is 1.5%.