Crawford County, IA
Crawford County Map

Crawford County Overview
16,450
TOTAL POPULATION
8,167
MALE POPULATION
8,283
FEMALE POPULATION
98.60
MALES / 100 FEMALES
101.42
FEMALES / 100 MALES
37.3
MEDIAN AGE
3.0
AVG FAMILY SIZE
2.6
AVG HOUSEHOLD SIZE
$30,781
PER CAPITA INCOME
$73,892
AVG FAMILY INCOME
$61,188
AVG HOUSEHOLD INCOME
28.3%
WAGE / INCOME GAP [ % ]
71.7¢/ $1
WAGE / INCOME GAP [ $ ]
$15,863
FAMILY INCOME DEFICIT
0.44
INEQUALITY / GINI INDEX
8,241
LABOR FORCE [ PEOPLE ]
63.7%
PERCENT IN LABOR FORCE
4.1%
UNEMPLOYMENT RATE
Crawford County Area Codes
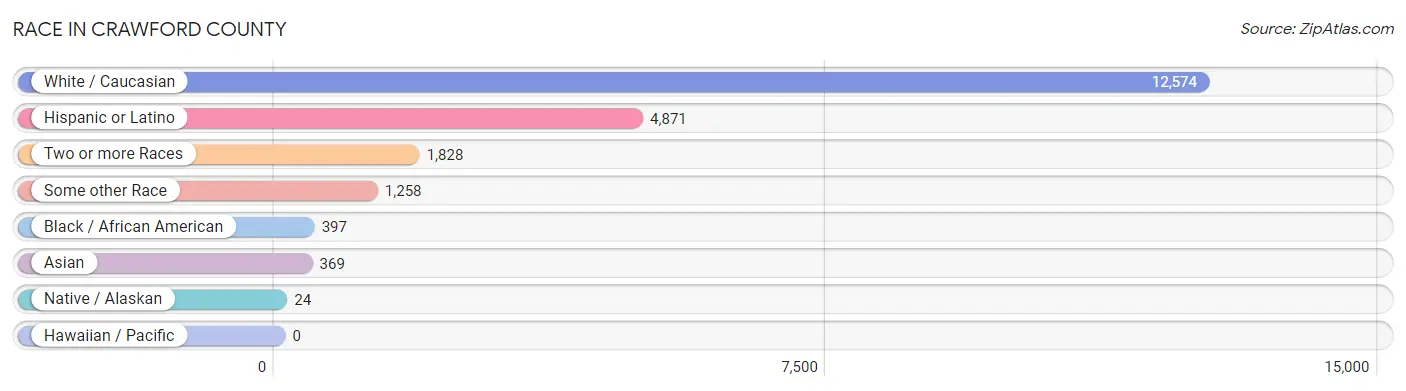
Race in Crawford County
The most populous races in Crawford County are White / Caucasian (12,574 | 76.4%), Hispanic or Latino (4,871 | 29.6%), and Two or more Races (1,828 | 11.1%).
| Race | # Population | % Population |
| Asian | 369 | 2.2% |
| Black / African American | 397 | 2.4% |
| Hawaiian / Pacific | 0 | 0.0% |
| Hispanic or Latino | 4,871 | 29.6% |
| Native / Alaskan | 24 | 0.2% |
| White / Caucasian | 12,574 | 76.4% |
| Two or more Races | 1,828 | 11.1% |
| Some other Race | 1,258 | 7.6% |
| Total | 16,450 | 100.0% |
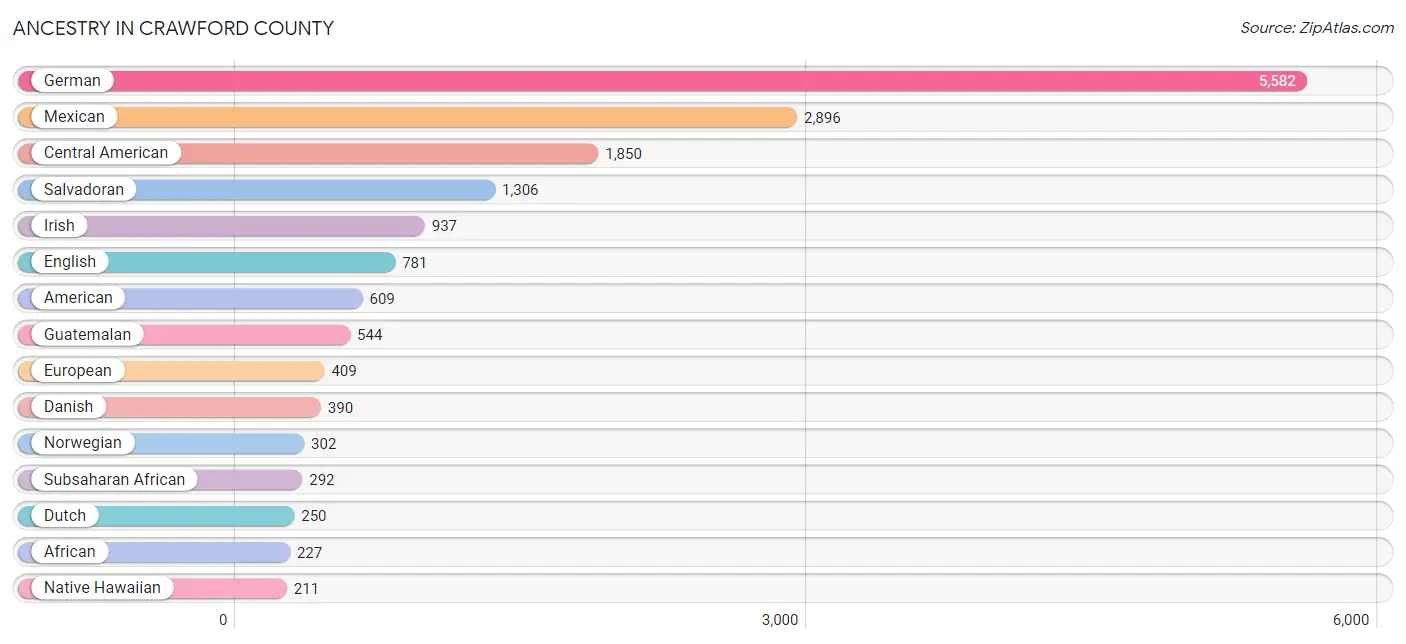
Ancestry in Crawford County
The most populous ancestries reported in Crawford County are German (5,582 | 33.9%), Mexican (2,896 | 17.6%), Central American (1,850 | 11.3%), Salvadoran (1,306 | 7.9%), and Irish (937 | 5.7%), together accounting for 76.4% of all Crawford County residents.
| Ancestry | # Population | % Population |
| African | 227 | 1.4% |
| American | 609 | 3.7% |
| Austrian | 19 | 0.1% |
| Belgian | 5 | 0.0% |
| Bhutanese | 35 | 0.2% |
| British | 14 | 0.1% |
| Burmese | 60 | 0.4% |
| Canadian | 10 | 0.1% |
| Central American | 1,850 | 11.3% |
| Central American Indian | 28 | 0.2% |
| Czech | 141 | 0.9% |
| Czechoslovakian | 15 | 0.1% |
| Danish | 390 | 2.4% |
| Dutch | 250 | 1.5% |
| Eastern European | 16 | 0.1% |
| English | 781 | 4.8% |
| Ethiopian | 10 | 0.1% |
| European | 409 | 2.5% |
| Finnish | 9 | 0.1% |
| French | 140 | 0.9% |
| French American Indian | 5 | 0.0% |
| French Canadian | 23 | 0.1% |
| German | 5,582 | 33.9% |
| Greek | 7 | 0.0% |
| Guatemalan | 544 | 3.3% |
| Hungarian | 6 | 0.0% |
| Indian (Asian) | 31 | 0.2% |
| Indonesian | 119 | 0.7% |
| Iranian | 3 | 0.0% |
| Irish | 937 | 5.7% |
| Italian | 41 | 0.3% |
| Korean | 20 | 0.1% |
| Lithuanian | 22 | 0.1% |
| Mexican | 2,896 | 17.6% |
| Mexican American Indian | 7 | 0.0% |
| Native Hawaiian | 211 | 1.3% |
| Northern European | 2 | 0.0% |
| Norwegian | 302 | 1.8% |
| Pakistani | 166 | 1.0% |
| Pennsylvania German | 6 | 0.0% |
| Polish | 79 | 0.5% |
| Portuguese | 10 | 0.1% |
| Salvadoran | 1,306 | 7.9% |
| Scandinavian | 22 | 0.1% |
| Scotch-Irish | 23 | 0.1% |
| Scottish | 120 | 0.7% |
| Sioux | 11 | 0.1% |
| South African | 4 | 0.0% |
| Spanish | 13 | 0.1% |
| Sri Lankan | 3 | 0.0% |
| Subsaharan African | 292 | 1.8% |
| Sudanese | 51 | 0.3% |
| Swedish | 190 | 1.2% |
| Swiss | 21 | 0.1% |
| Ukrainian | 2 | 0.0% |
| Welsh | 60 | 0.4% | View All 56 Rows |
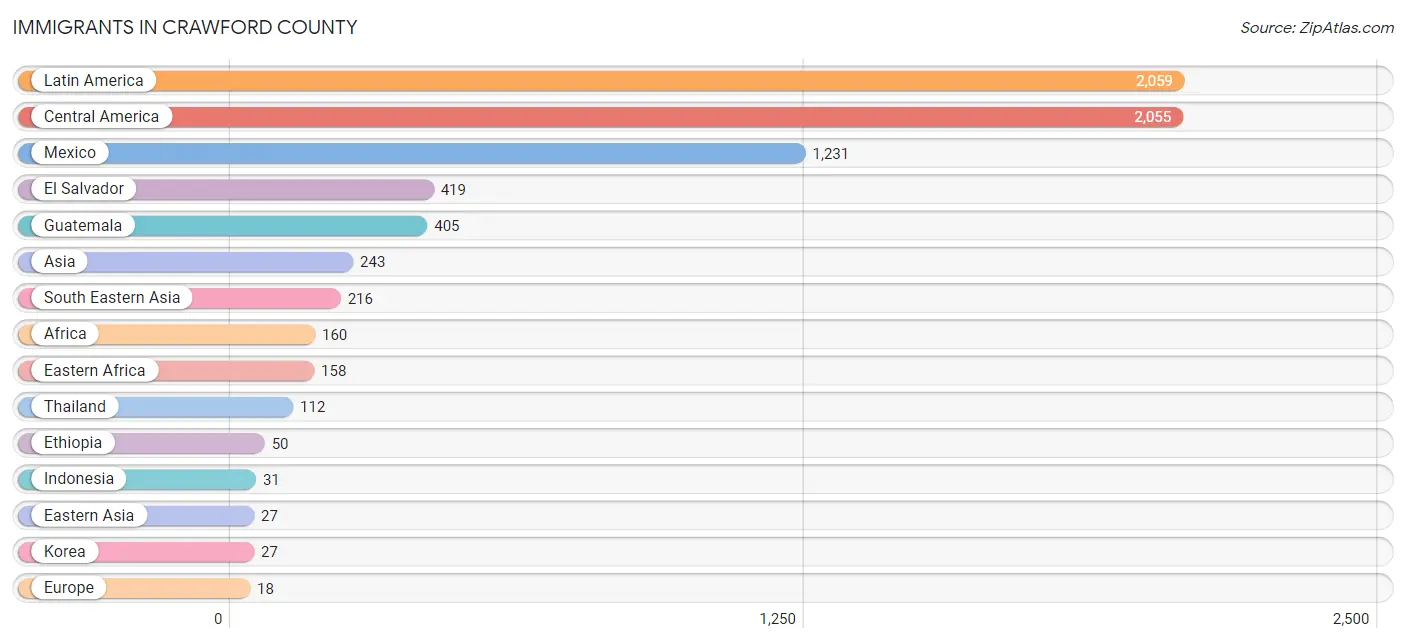
Immigrants in Crawford County
The most numerous immigrant groups reported in Crawford County came from Latin America (2,059 | 12.5%), Central America (2,055 | 12.5%), Mexico (1,231 | 7.5%), El Salvador (419 | 2.5%), and Guatemala (405 | 2.5%), together accounting for 37.5% of all Crawford County residents.
| Immigration Origin | # Population | % Population |
| Africa | 160 | 1.0% |
| Asia | 243 | 1.5% |
| Austria | 1 | 0.0% |
| Brazil | 4 | 0.0% |
| Canada | 2 | 0.0% |
| Central America | 2,055 | 12.5% |
| Czechoslovakia | 3 | 0.0% |
| Eastern Africa | 158 | 1.0% |
| Eastern Asia | 27 | 0.2% |
| Eastern Europe | 3 | 0.0% |
| El Salvador | 419 | 2.5% |
| Eritrea | 10 | 0.1% |
| Ethiopia | 50 | 0.3% |
| Europe | 18 | 0.1% |
| Germany | 14 | 0.1% |
| Guatemala | 405 | 2.5% |
| Indonesia | 31 | 0.2% |
| Korea | 27 | 0.2% |
| Latin America | 2,059 | 12.5% |
| Mexico | 1,231 | 7.5% |
| Philippines | 6 | 0.0% |
| South Africa | 2 | 0.0% |
| South America | 4 | 0.0% |
| South Eastern Asia | 216 | 1.3% |
| Thailand | 112 | 0.7% |
| Western Europe | 15 | 0.1% | View All 26 Rows |
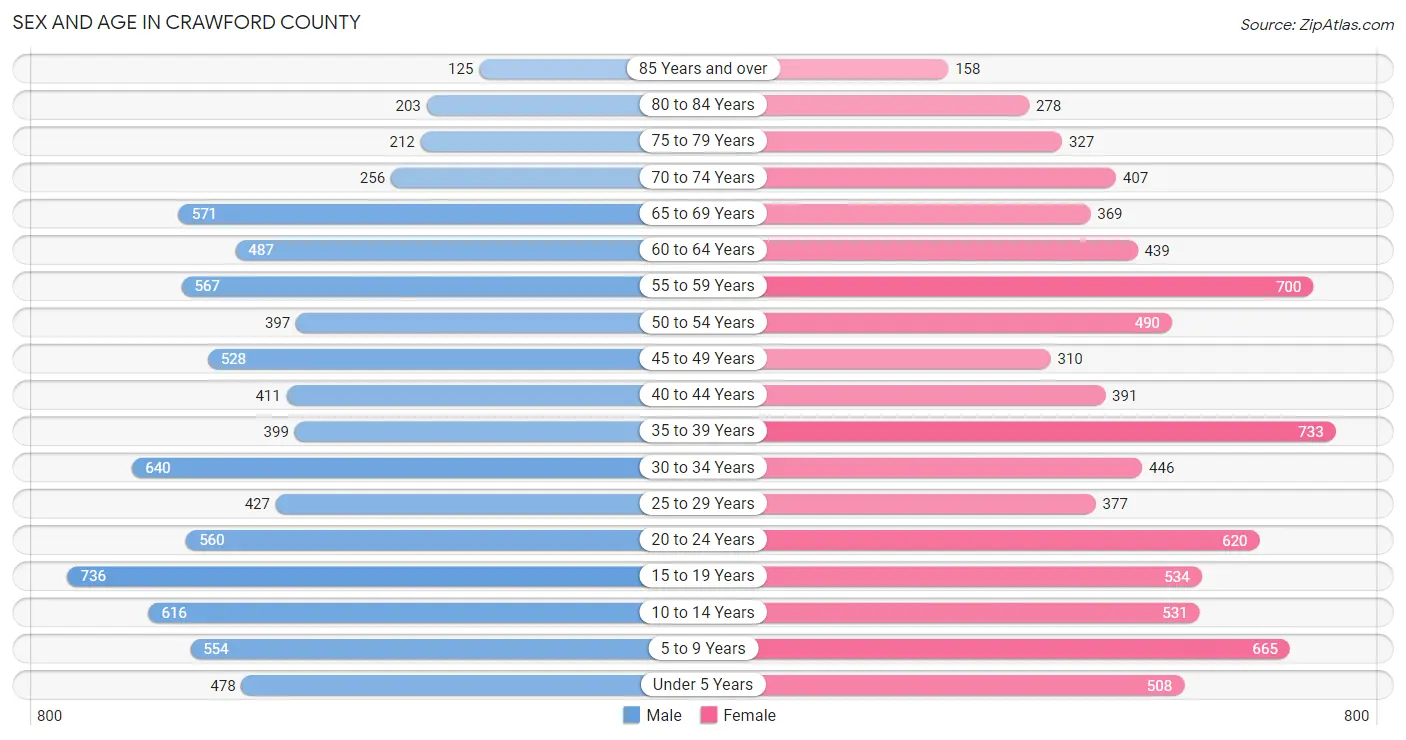
Sex and Age in Crawford County
Sex and Age in Crawford County
The most populous age groups in Crawford County are 15 to 19 Years (736 | 9.0%) for men and 35 to 39 Years (733 | 8.8%) for women.
| Age Bracket | Male | Female |
| Under 5 Years | 478 (5.9%) | 508 (6.1%) |
| 5 to 9 Years | 554 (6.8%) | 665 (8.0%) |
| 10 to 14 Years | 616 (7.5%) | 531 (6.4%) |
| 15 to 19 Years | 736 (9.0%) | 534 (6.5%) |
| 20 to 24 Years | 560 (6.9%) | 620 (7.5%) |
| 25 to 29 Years | 427 (5.2%) | 377 (4.5%) |
| 30 to 34 Years | 640 (7.8%) | 446 (5.4%) |
| 35 to 39 Years | 399 (4.9%) | 733 (8.8%) |
| 40 to 44 Years | 411 (5.0%) | 391 (4.7%) |
| 45 to 49 Years | 528 (6.5%) | 310 (3.7%) |
| 50 to 54 Years | 397 (4.9%) | 490 (5.9%) |
| 55 to 59 Years | 567 (6.9%) | 700 (8.5%) |
| 60 to 64 Years | 487 (6.0%) | 439 (5.3%) |
| 65 to 69 Years | 571 (7.0%) | 369 (4.4%) |
| 70 to 74 Years | 256 (3.1%) | 407 (4.9%) |
| 75 to 79 Years | 212 (2.6%) | 327 (4.0%) |
| 80 to 84 Years | 203 (2.5%) | 278 (3.4%) |
| 85 Years and over | 125 (1.5%) | 158 (1.9%) |
| Total | 8,167 (100.0%) | 8,283 (100.0%) |
Families and Households in Crawford County
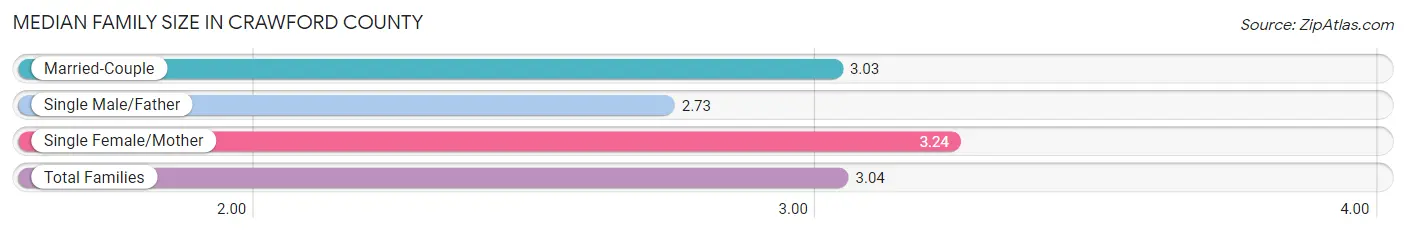
Median Family Size in Crawford County
The median family size in Crawford County is 3.04 persons per family, with single female/mother families (822 | 18.8%) accounting for the largest median family size of 3.24 persons per family. On the other hand, single male/father families (399 | 9.1%) represent the smallest median family size with 2.73 persons per family.
| Family Type | # Families | Family Size |
| Married-Couple | 3,149 (72.1%) | 3.03 |
| Single Male/Father | 399 (9.1%) | 2.73 |
| Single Female/Mother | 822 (18.8%) | 3.24 |
| Total Families | 4,370 (100.0%) | 3.04 |
Median Household Size in Crawford County
The median household size in Crawford County is 2.56 persons per household, with single female/mother households (822 | 13.2%) accounting for the largest median household size of 3.43 persons per household. non-family households (1,844 | 29.7%) represent the smallest median household size with 1.21 persons per household.

| Household Type | # Households | Household Size |
| Married-Couple | 3,149 (50.7%) | 3.03 |
| Single Male/Father | 399 (6.4%) | 3.26 |
| Single Female/Mother | 822 (13.2%) | 3.43 |
| Non-family | 1,844 (29.7%) | 1.21 |
| Total Households | 6,214 (100.0%) | 2.56 |
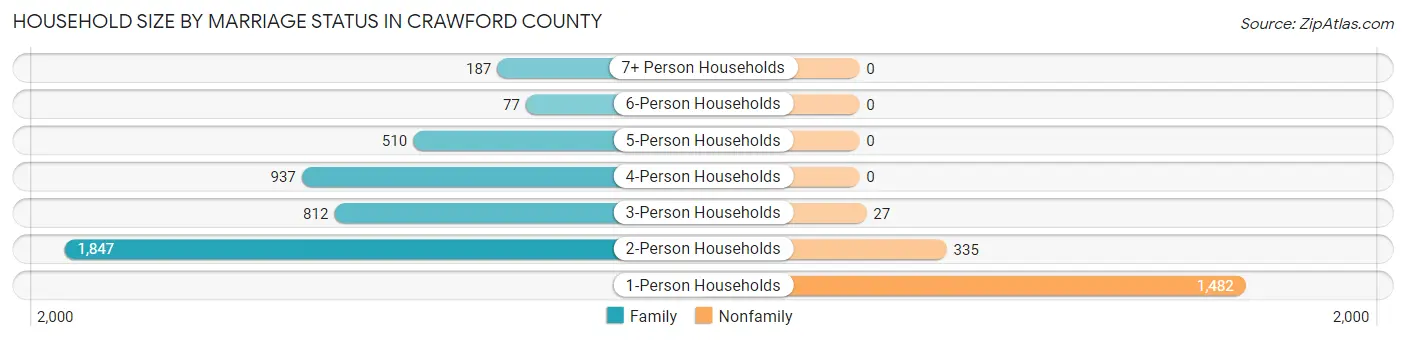
Household Size by Marriage Status in Crawford County
Out of a total of 6,214 households in Crawford County, 4,370 (70.3%) are family households, while 1,844 (29.7%) are nonfamily households. The most numerous type of family households are 2-person households, comprising 1,847, and the most common type of nonfamily households are 1-person households, comprising 1,482.
| Household Size | Family Households | Nonfamily Households |
| 1-Person Households | - | 1,482 (23.8%) |
| 2-Person Households | 1,847 (29.7%) | 335 (5.4%) |
| 3-Person Households | 812 (13.1%) | 27 (0.4%) |
| 4-Person Households | 937 (15.1%) | 0 (0.0%) |
| 5-Person Households | 510 (8.2%) | 0 (0.0%) |
| 6-Person Households | 77 (1.2%) | 0 (0.0%) |
| 7+ Person Households | 187 (3.0%) | 0 (0.0%) |
| Total | 4,370 (70.3%) | 1,844 (29.7%) |
Female Fertility in Crawford County
Fertility by Age in Crawford County
Average fertility rate in Crawford County is 61.0 births per 1,000 women. Women in the age bracket of 20 to 34 years have the highest fertility rate with 107.0 births per 1,000 women. Women in the age bracket of 20 to 34 years acount for 72.0% of all women with births.

| Age Bracket | Women with Births | Births / 1,000 Women |
| 15 to 19 years | 9 (4.2%) | 17.0 |
| 20 to 34 years | 154 (72.0%) | 107.0 |
| 35 to 50 years | 51 (23.8%) | 33.0 |
| Total | 214 (100.0%) | 61.0 |
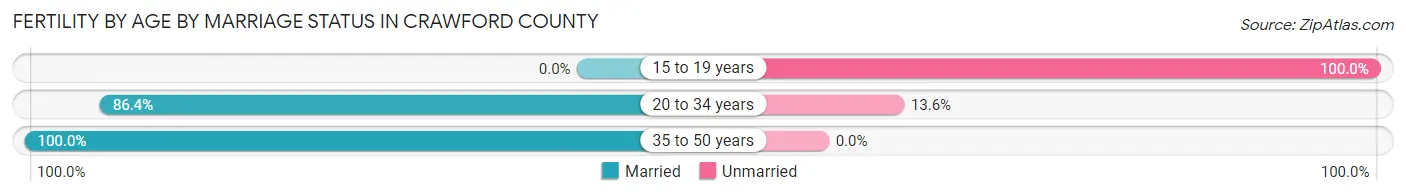
Fertility by Age by Marriage Status in Crawford County
86.0% of women with births (214) in Crawford County are married. The highest percentage of unmarried women with births falls into 15 to 19 years age bracket with 100.0% of them unmarried at the time of birth, while the lowest percentage of unmarried women with births belong to 35 to 50 years age bracket with 0.0% of them unmarried.
| Age Bracket | Married | Unmarried |
| 15 to 19 years | 0 (0.0%) | 9 (100.0%) |
| 20 to 34 years | 133 (86.4%) | 21 (13.6%) |
| 35 to 50 years | 51 (100.0%) | 0 (0.0%) |
| Total | 184 (86.0%) | 30 (14.0%) |
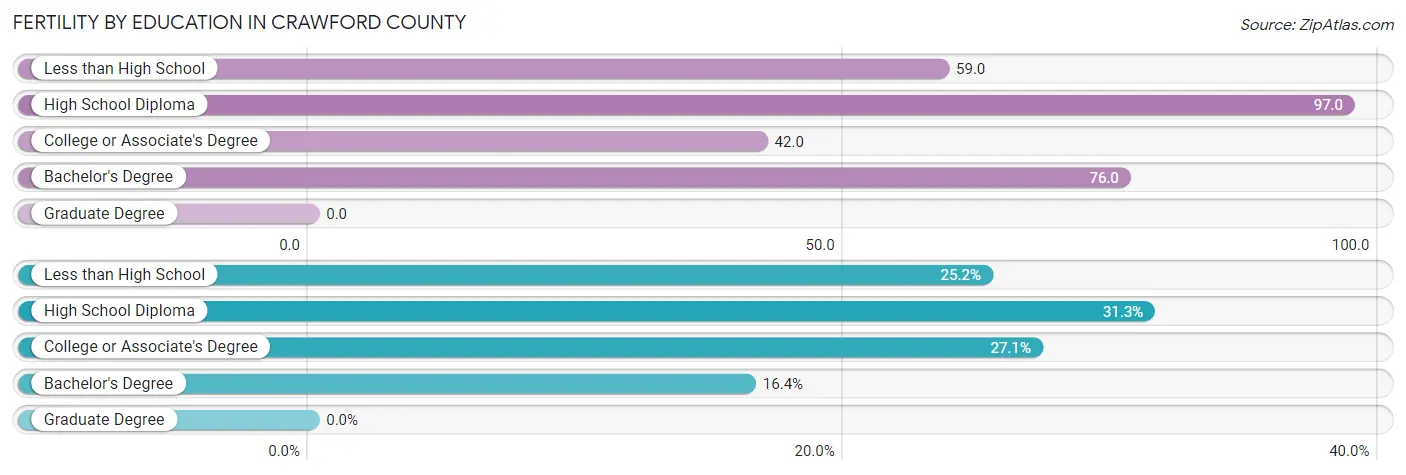
Fertility by Education in Crawford County
| Educational Attainment | Women with Births | Births / 1,000 Women |
| Less than High School | 54 (25.2%) | 59.0 |
| High School Diploma | 67 (31.3%) | 97.0 |
| College or Associate's Degree | 58 (27.1%) | 42.0 |
| Bachelor's Degree | 35 (16.4%) | 76.0 |
| Graduate Degree | 0 (0.0%) | 0.0 |
| Total | 214 (100.0%) | 61.0 |
Fertility by Education by Marriage Status in Crawford County
14.0% of women with births in Crawford County are unmarried. Women with the educational attainment of bachelor's degree are most likely to be married with 100.0% of them married at childbirth, while women with the educational attainment of college or associate's degree are least likely to be married with 25.9% of them unmarried at childbirth.
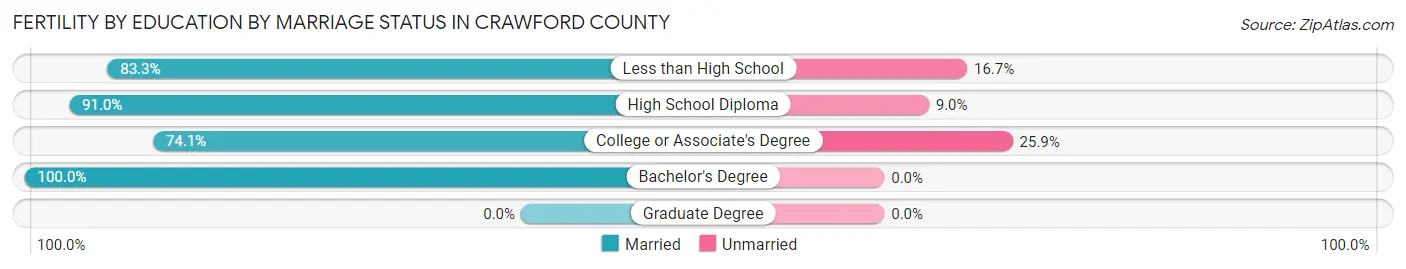
| Educational Attainment | Married | Unmarried |
| Less than High School | 45 (83.3%) | 9 (16.7%) |
| High School Diploma | 61 (91.0%) | 6 (9.0%) |
| College or Associate's Degree | 43 (74.1%) | 15 (25.9%) |
| Bachelor's Degree | 35 (100.0%) | 0 (0.0%) |
| Graduate Degree | 0 (0.0%) | 0 (0.0%) |
| Total | 184 (86.0%) | 30 (14.0%) |
Income in Crawford County
Income Overview in Crawford County
Per Capita Income in Crawford County is $30,781, while median incomes of families and households are $73,892 and $61,188 respectively.
| Characteristic | Number | Measure |
| Per Capita Income | 16,450 | $30,781 |
| Median Family Income | 4,370 | $73,892 |
| Mean Family Income | 4,370 | $91,175 |
| Median Household Income | 6,214 | $61,188 |
| Mean Household Income | 6,214 | $78,927 |
| Income Deficit | 4,370 | $15,863 |
| Wage / Income Gap (%) | 16,450 | 28.27% |
| Wage / Income Gap ($) | 16,450 | 71.73¢ per $1 |
| Gini / Inequality Index | 16,450 | 0.44 |
Earnings by Sex in Crawford County
Average Earnings in Crawford County are $34,756, $41,866 for men and $30,029 for women, a difference of 28.3%.
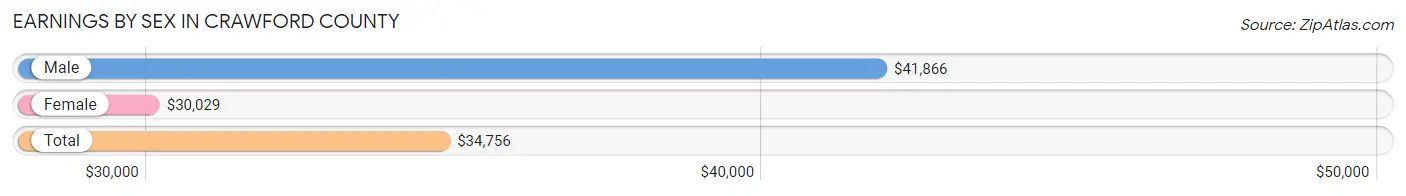
| Sex | Number | Average Earnings |
| Male | 4,741 (54.3%) | $41,866 |
| Female | 3,986 (45.7%) | $30,029 |
| Total | 8,727 (100.0%) | $34,756 |
Earnings by Sex by Income Bracket in Crawford County
The most common earnings brackets in Crawford County are $55,000 to $64,999 for men (464 | 9.8%) and $30,000 to $34,999 for women (396 | 9.9%).
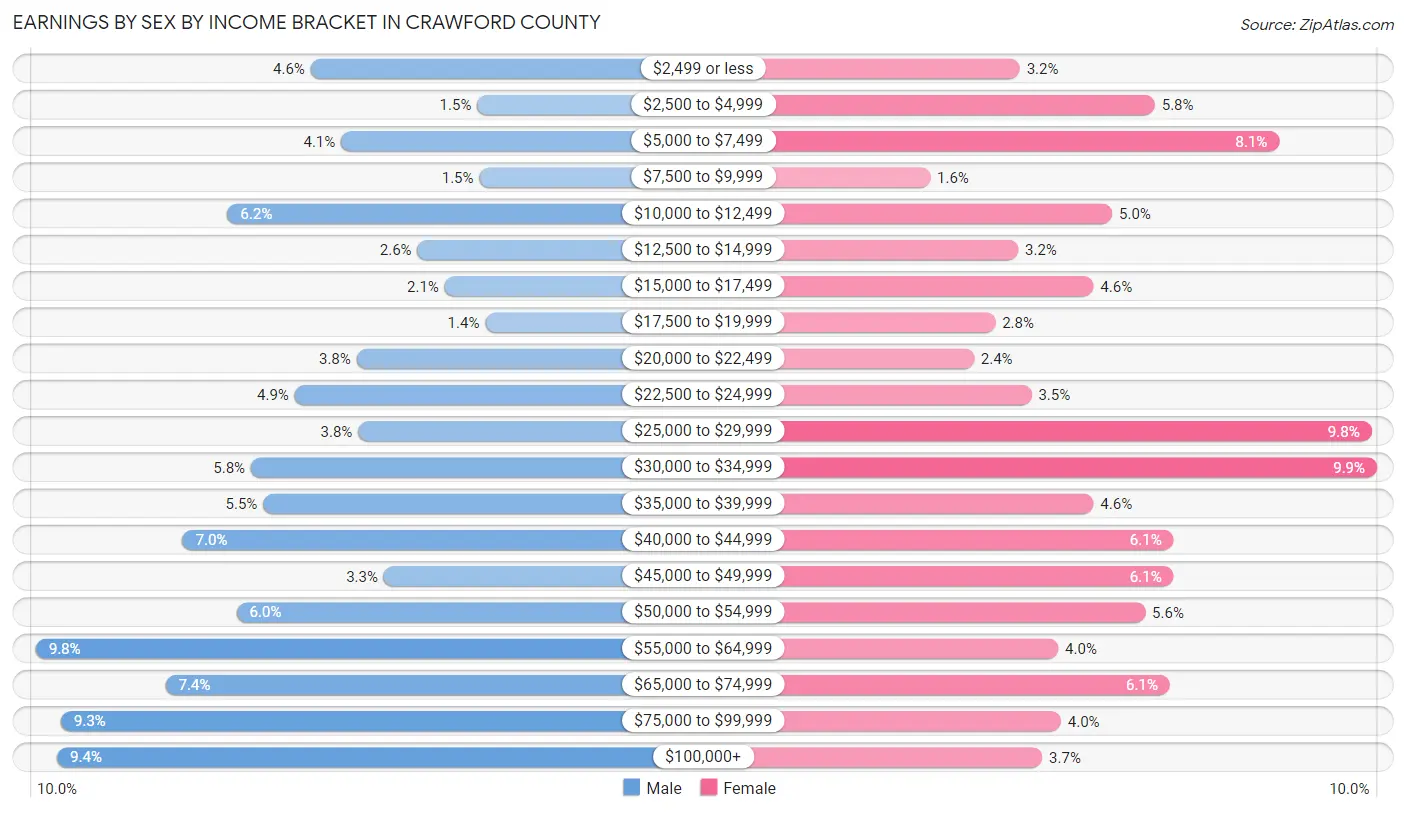
| Income | Male | Female |
| $2,499 or less | 220 (4.6%) | 129 (3.2%) |
| $2,500 to $4,999 | 72 (1.5%) | 230 (5.8%) |
| $5,000 to $7,499 | 193 (4.1%) | 323 (8.1%) |
| $7,500 to $9,999 | 70 (1.5%) | 62 (1.6%) |
| $10,000 to $12,499 | 294 (6.2%) | 198 (5.0%) |
| $12,500 to $14,999 | 125 (2.6%) | 128 (3.2%) |
| $15,000 to $17,499 | 101 (2.1%) | 184 (4.6%) |
| $17,500 to $19,999 | 65 (1.4%) | 111 (2.8%) |
| $20,000 to $22,499 | 179 (3.8%) | 95 (2.4%) |
| $22,500 to $24,999 | 234 (4.9%) | 138 (3.5%) |
| $25,000 to $29,999 | 178 (3.7%) | 392 (9.8%) |
| $30,000 to $34,999 | 273 (5.8%) | 396 (9.9%) |
| $35,000 to $39,999 | 262 (5.5%) | 184 (4.6%) |
| $40,000 to $44,999 | 334 (7.0%) | 244 (6.1%) |
| $45,000 to $49,999 | 155 (3.3%) | 244 (6.1%) |
| $50,000 to $54,999 | 286 (6.0%) | 223 (5.6%) |
| $55,000 to $64,999 | 464 (9.8%) | 158 (4.0%) |
| $65,000 to $74,999 | 349 (7.4%) | 241 (6.0%) |
| $75,000 to $99,999 | 442 (9.3%) | 160 (4.0%) |
| $100,000+ | 445 (9.4%) | 146 (3.7%) |
| Total | 4,741 (100.0%) | 3,986 (100.0%) |
Earnings by Sex by Educational Attainment in Crawford County
Average earnings in Crawford County are $47,059 for men and $35,045 for women, a difference of 25.5%. Men with an educational attainment of graduate degree enjoy the highest average annual earnings of $76,750, while those with college or associate's degree education earn the least with $40,938. Women with an educational attainment of graduate degree earn the most with the average annual earnings of $69,120, while those with college or associate's degree education have the smallest earnings of $30,028.
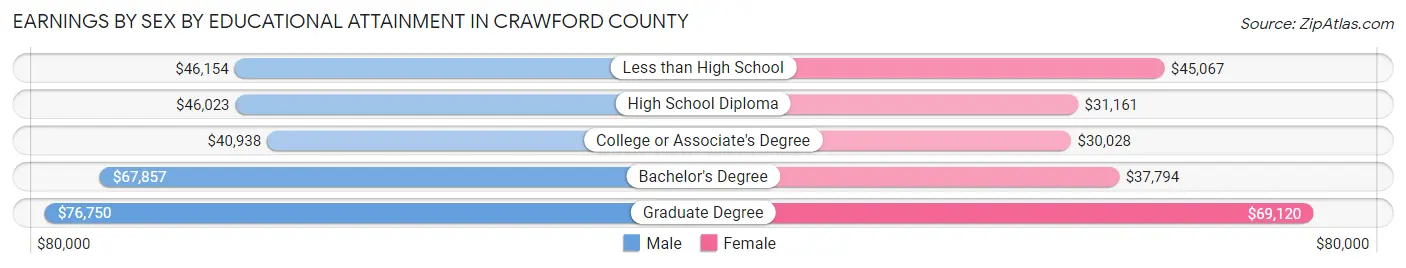
| Educational Attainment | Male Income | Female Income |
| Less than High School | $46,154 | $45,067 |
| High School Diploma | $46,023 | $31,161 |
| College or Associate's Degree | $40,938 | $30,028 |
| Bachelor's Degree | $67,857 | $37,794 |
| Graduate Degree | $76,750 | $69,120 |
| Total | $47,059 | $35,045 |
Family Income in Crawford County
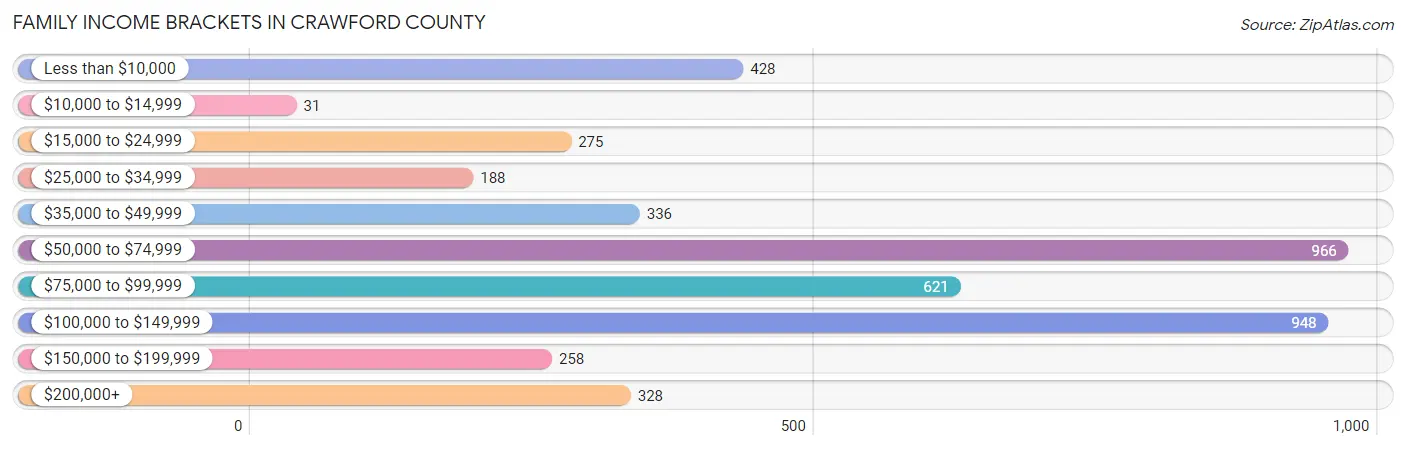
Family Income Brackets in Crawford County
According to the Crawford County family income data, there are 966 families falling into the $50,000 to $74,999 income range, which is the most common income bracket and makes up 22.1% of all families. Conversely, the $10,000 to $14,999 income bracket is the least frequent group with only 31 families (0.7%) belonging to this category.
| Income Bracket | # Families | % Families |
| Less than $10,000 | 428 | 9.8% |
| $10,000 to $14,999 | 31 | 0.7% |
| $15,000 to $24,999 | 275 | 6.3% |
| $25,000 to $34,999 | 188 | 4.3% |
| $35,000 to $49,999 | 336 | 7.7% |
| $50,000 to $74,999 | 966 | 22.1% |
| $75,000 to $99,999 | 621 | 14.2% |
| $100,000 to $149,999 | 948 | 21.7% |
| $150,000 to $199,999 | 258 | 5.9% |
| $200,000+ | 328 | 7.5% |
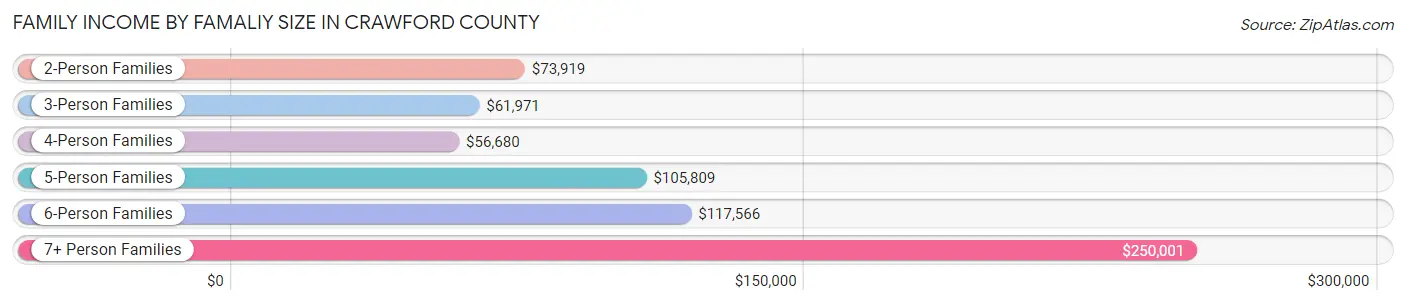
Family Income by Famaliy Size in Crawford County
7+ person families (176 | 4.0%) account for the highest median family income in Crawford County with $250,001 per family, while 2-person families (2,030 | 46.5%) have the highest median income of $36,960 per family member.
| Income Bracket | # Families | Median Income |
| 2-Person Families | 2,030 (46.5%) | $73,919 |
| 3-Person Families | 768 (17.6%) | $61,971 |
| 4-Person Families | 864 (19.8%) | $56,680 |
| 5-Person Families | 449 (10.3%) | $105,809 |
| 6-Person Families | 83 (1.9%) | $117,566 |
| 7+ Person Families | 176 (4.0%) | $250,001 |
| Total | 4,370 (100.0%) | $73,892 |
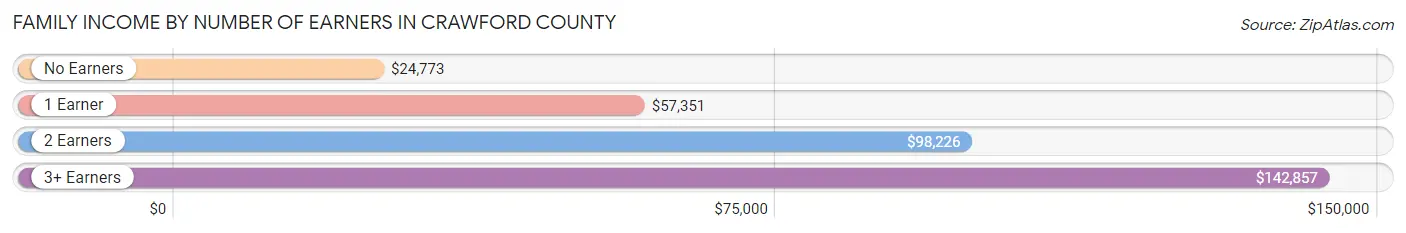
Family Income by Number of Earners in Crawford County
The median family income in Crawford County is $73,892, with families comprising 3+ earners (530) having the highest median family income of $142,857, while families with no earners (798) have the lowest median family income of $24,773, accounting for 12.1% and 18.3% of families, respectively.
| Number of Earners | # Families | Median Income |
| No Earners | 798 (18.3%) | $24,773 |
| 1 Earner | 1,165 (26.7%) | $57,351 |
| 2 Earners | 1,877 (42.9%) | $98,226 |
| 3+ Earners | 530 (12.1%) | $142,857 |
| Total | 4,370 (100.0%) | $73,892 |
Household Income in Crawford County
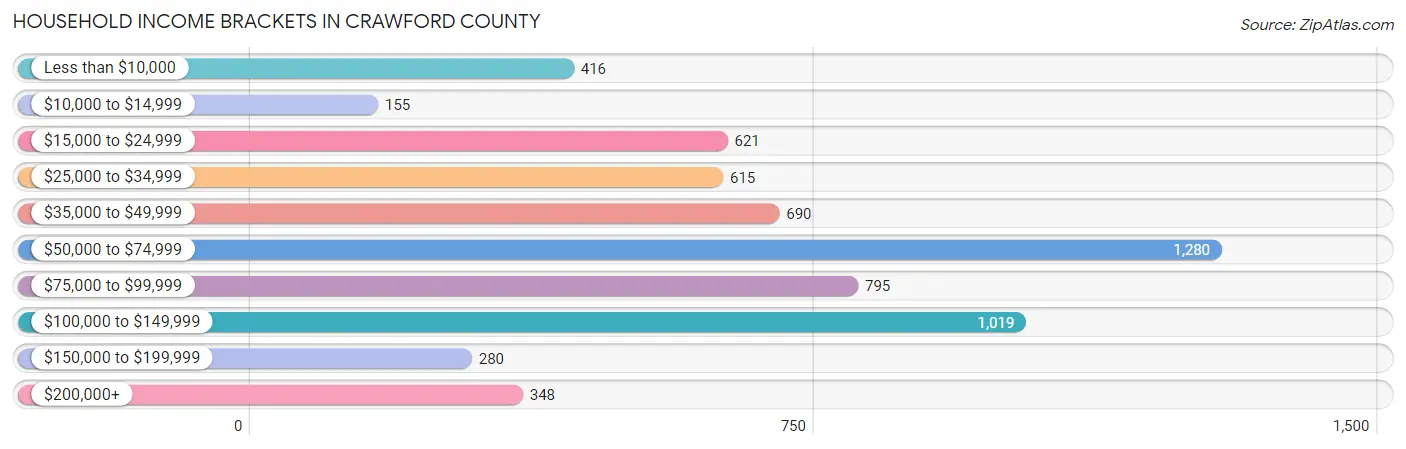
Household Income Brackets in Crawford County
With 1,280 households falling in the category, the $50,000 to $74,999 income range is the most frequent in Crawford County, accounting for 20.6% of all households. In contrast, only 155 households (2.5%) fall into the $10,000 to $14,999 income bracket, making it the least populous group.
| Income Bracket | # Households | % Households |
| Less than $10,000 | 416 | 6.7% |
| $10,000 to $14,999 | 155 | 2.5% |
| $15,000 to $24,999 | 621 | 10.0% |
| $25,000 to $34,999 | 615 | 9.9% |
| $35,000 to $49,999 | 690 | 11.1% |
| $50,000 to $74,999 | 1,280 | 20.6% |
| $75,000 to $99,999 | 795 | 12.8% |
| $100,000 to $149,999 | 1,019 | 16.4% |
| $150,000 to $199,999 | 280 | 4.5% |
| $200,000+ | 348 | 5.6% |
Household Income by Householder Age in Crawford County
The median household income in Crawford County is $61,188, with the highest median household income of $73,911 found in the 45 to 64 years age bracket for the primary householder. A total of 2,159 households (34.7%) fall into this category. Meanwhile, the 65+ years age bracket for the primary householder has the lowest median household income of $43,977, with 1,705 households (27.4%) in this group.
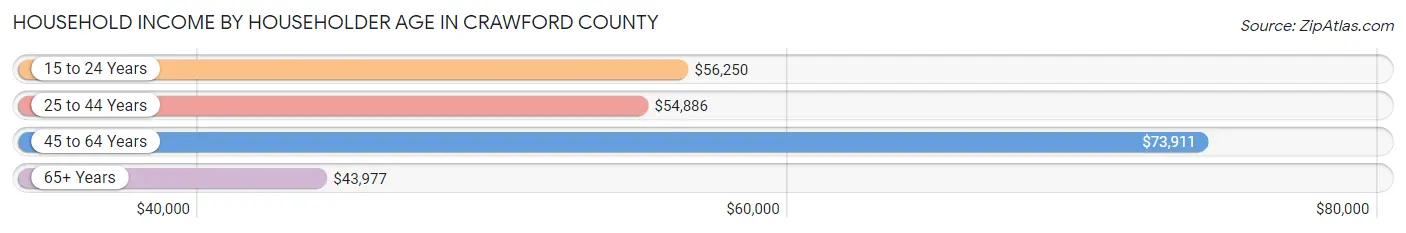
| Income Bracket | # Households | Median Income |
| 15 to 24 Years | 257 (4.1%) | $56,250 |
| 25 to 44 Years | 2,093 (33.7%) | $54,886 |
| 45 to 64 Years | 2,159 (34.7%) | $73,911 |
| 65+ Years | 1,705 (27.4%) | $43,977 |
| Total | 6,214 (100.0%) | $61,188 |
Poverty in Crawford County
Income Below Poverty by Sex and Age in Crawford County
With 13.2% poverty level for males and 20.7% for females among the residents of Crawford County, 5 year old males and 5 year old females are the most vulnerable to poverty, with 86 males (47.8%) and 35 females (55.6%) in their respective age groups living below the poverty level.
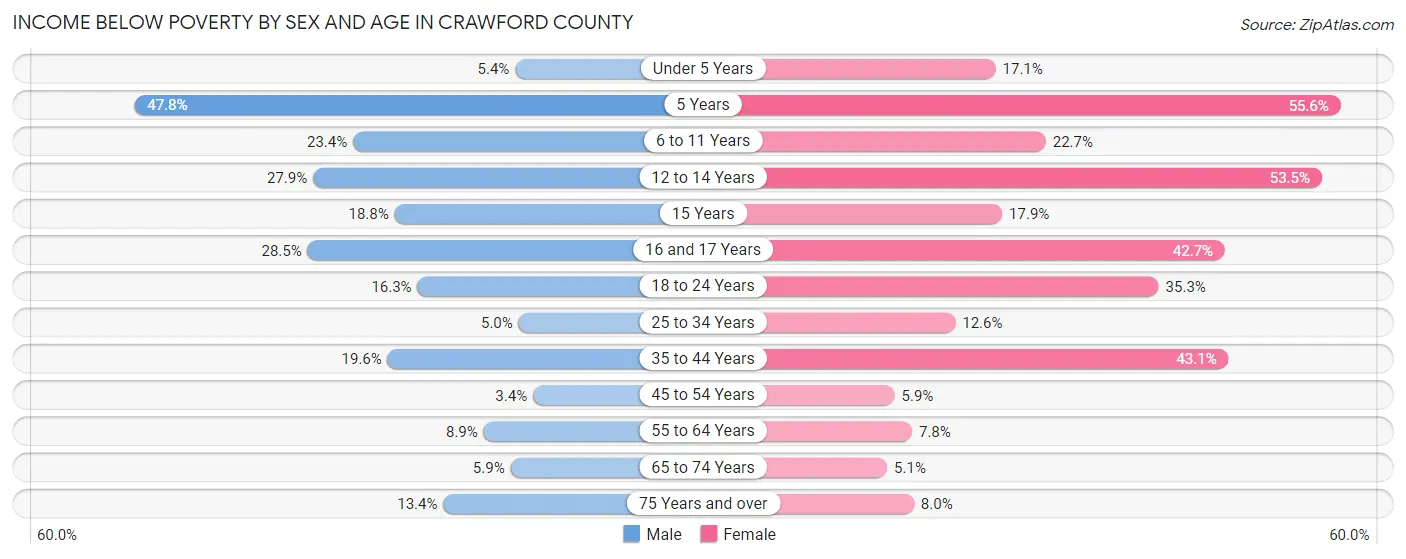
| Age Bracket | Male | Female |
| Under 5 Years | 25 (5.4%) | 87 (17.1%) |
| 5 Years | 86 (47.8%) | 35 (55.6%) |
| 6 to 11 Years | 130 (23.4%) | 204 (22.7%) |
| 12 to 14 Years | 121 (27.9%) | 124 (53.4%) |
| 15 Years | 25 (18.8%) | 5 (17.9%) |
| 16 and 17 Years | 100 (28.5%) | 125 (42.7%) |
| 18 to 24 Years | 130 (16.3%) | 294 (35.3%) |
| 25 to 34 Years | 53 (5.0%) | 104 (12.6%) |
| 35 to 44 Years | 158 (19.6%) | 484 (43.1%) |
| 45 to 54 Years | 31 (3.4%) | 47 (5.9%) |
| 55 to 64 Years | 92 (8.9%) | 88 (7.8%) |
| 65 to 74 Years | 48 (5.9%) | 37 (5.1%) |
| 75 Years and over | 69 (13.4%) | 57 (8.0%) |
| Total | 1,068 (13.2%) | 1,691 (20.7%) |
Income Above Poverty by Sex and Age in Crawford County
According to the poverty statistics in Crawford County, males aged 45 to 54 years and females aged 65 to 74 years are the age groups that are most secure financially, with 96.6% of males and 95.0% of females in these age groups living above the poverty line.
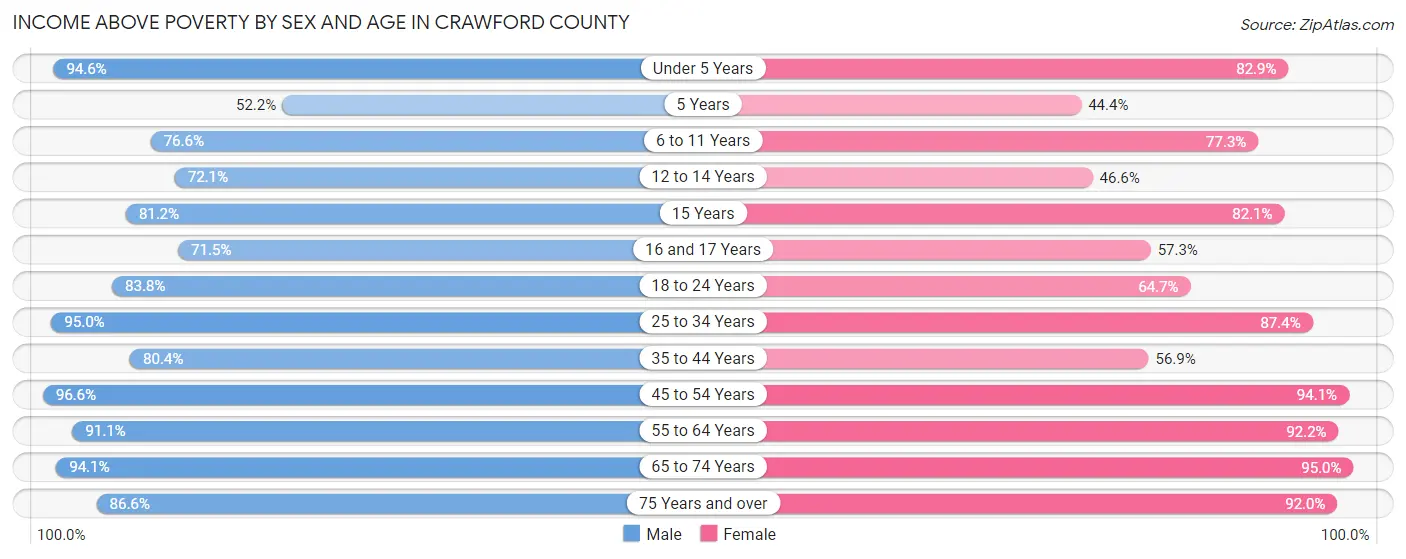
| Age Bracket | Male | Female |
| Under 5 Years | 441 (94.6%) | 421 (82.9%) |
| 5 Years | 94 (52.2%) | 28 (44.4%) |
| 6 to 11 Years | 425 (76.6%) | 694 (77.3%) |
| 12 to 14 Years | 313 (72.1%) | 108 (46.6%) |
| 15 Years | 108 (81.2%) | 23 (82.1%) |
| 16 and 17 Years | 251 (71.5%) | 168 (57.3%) |
| 18 to 24 Years | 670 (83.8%) | 539 (64.7%) |
| 25 to 34 Years | 1,012 (95.0%) | 719 (87.4%) |
| 35 to 44 Years | 649 (80.4%) | 640 (56.9%) |
| 45 to 54 Years | 885 (96.6%) | 753 (94.1%) |
| 55 to 64 Years | 944 (91.1%) | 1,038 (92.2%) |
| 65 to 74 Years | 767 (94.1%) | 695 (95.0%) |
| 75 Years and over | 447 (86.6%) | 653 (92.0%) |
| Total | 7,006 (86.8%) | 6,479 (79.3%) |
Income Below Poverty Among Married-Couple Families in Crawford County
The poverty statistics for married-couple families in Crawford County show that 3.2% or 100 of the total 3,149 families live below the poverty line. Families with no children have the highest poverty rate of 3.8%, comprising of 76 families. On the other hand, families with 5 or more children have the lowest poverty rate of 0.0%, which includes 0 families.
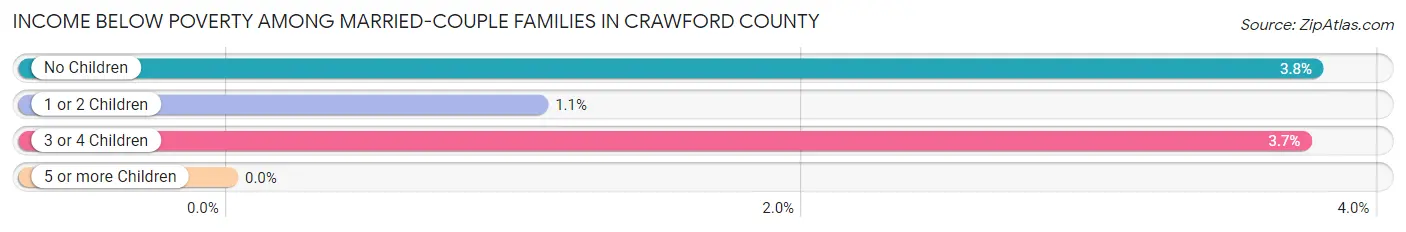
| Children | Above Poverty | Below Poverty |
| No Children | 1,933 (96.2%) | 76 (3.8%) |
| 1 or 2 Children | 642 (98.9%) | 7 (1.1%) |
| 3 or 4 Children | 437 (96.3%) | 17 (3.7%) |
| 5 or more Children | 37 (100.0%) | 0 (0.0%) |
| Total | 3,049 (96.8%) | 100 (3.2%) |
Income Below Poverty Among Single-Parent Households in Crawford County
According to the poverty data in Crawford County, 35.6% or 142 single-father households and 51.3% or 422 single-mother households are living below the poverty line. Among single-father households, those with 3 or 4 children have the highest poverty rate, with 69 households (87.3%) experiencing poverty. Likewise, among single-mother households, those with 3 or 4 children have the highest poverty rate, with 121 households (59.6%) falling below the poverty line.
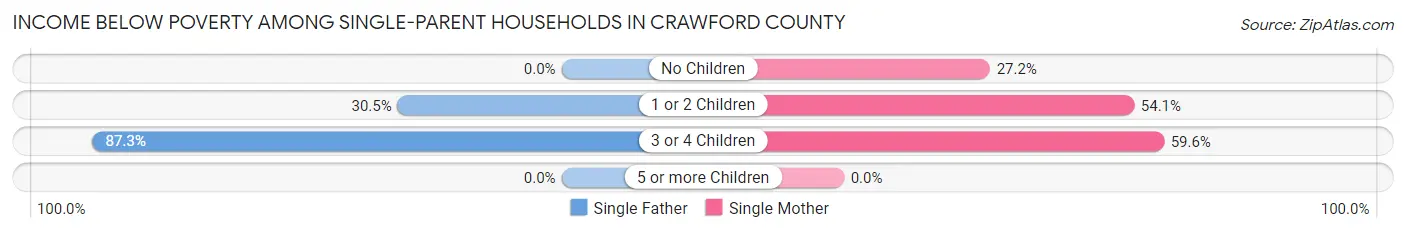
| Children | Single Father | Single Mother |
| No Children | 0 (0.0%) | 34 (27.2%) |
| 1 or 2 Children | 73 (30.5%) | 267 (54.0%) |
| 3 or 4 Children | 69 (87.3%) | 121 (59.6%) |
| 5 or more Children | 0 (0.0%) | 0 (0.0%) |
| Total | 142 (35.6%) | 422 (51.3%) |
Income Below Poverty Among Married-Couple vs Single-Parent Households in Crawford County
The poverty data for Crawford County shows that 100 of the married-couple family households (3.2%) and 564 of the single-parent households (46.2%) are living below the poverty level. Within the married-couple family households, those with no children have the highest poverty rate, with 76 households (3.8%) falling below the poverty line. Among the single-parent households, those with 3 or 4 children have the highest poverty rate, with 190 household (67.4%) living below poverty.
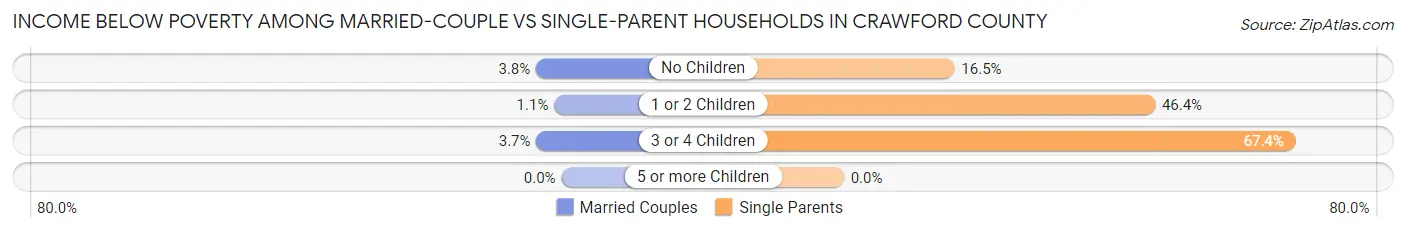
| Children | Married-Couple Families | Single-Parent Households |
| No Children | 76 (3.8%) | 34 (16.5%) |
| 1 or 2 Children | 7 (1.1%) | 340 (46.4%) |
| 3 or 4 Children | 17 (3.7%) | 190 (67.4%) |
| 5 or more Children | 0 (0.0%) | 0 (0.0%) |
| Total | 100 (3.2%) | 564 (46.2%) |
Employment Characteristics in Crawford County
Employment by Class of Employer in Crawford County
Among the 7,703 employed individuals in Crawford County, private company employees (4,925 | 63.9%), self-employed (not incorporated) (1,109 | 14.4%), and local government employees (575 | 7.5%) make up the most common classes of employment.
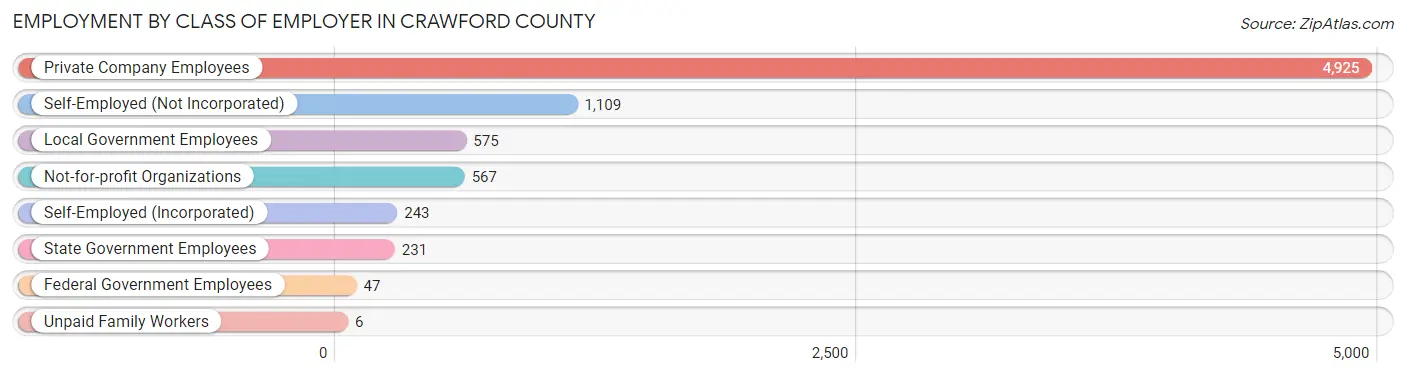
| Employer Class | # Employees | % Employees |
| Private Company Employees | 4,925 | 63.9% |
| Self-Employed (Incorporated) | 243 | 3.2% |
| Self-Employed (Not Incorporated) | 1,109 | 14.4% |
| Not-for-profit Organizations | 567 | 7.4% |
| Local Government Employees | 575 | 7.5% |
| State Government Employees | 231 | 3.0% |
| Federal Government Employees | 47 | 0.6% |
| Unpaid Family Workers | 6 | 0.1% |
| Total | 7,703 | 100.0% |
Employment Status by Age in Crawford County
According to the labor force statistics for Crawford County, out of the total population over 16 years of age (12,937), 63.7% or 8,241 individuals are in the labor force, with 4.1% or 338 of them unemployed. The age group with the highest labor force participation rate is 45 to 54 years, with 91.1% or 1,571 individuals in the labor force. Within the labor force, the 16 to 19 years age range has the highest percentage of unemployed individuals, with 17.2% or 93 of them being unemployed.
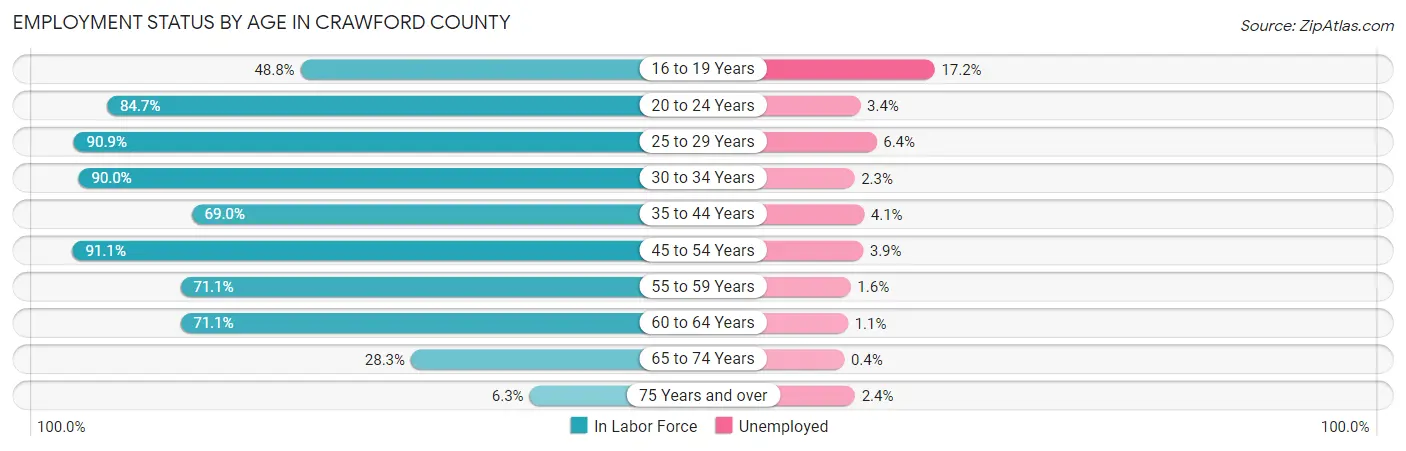
| Age Bracket | In Labor Force | Unemployed |
| 16 to 19 Years | 541 (48.8%) | 93 (17.2%) |
| 20 to 24 Years | 999 (84.7%) | 34 (3.4%) |
| 25 to 29 Years | 731 (90.9%) | 47 (6.4%) |
| 30 to 34 Years | 977 (90.0%) | 22 (2.3%) |
| 35 to 44 Years | 1,334 (69.0%) | 55 (4.1%) |
| 45 to 54 Years | 1,571 (91.1%) | 61 (3.9%) |
| 55 to 59 Years | 901 (71.1%) | 14 (1.6%) |
| 60 to 64 Years | 658 (71.1%) | 7 (1.1%) |
| 65 to 74 Years | 454 (28.3%) | 2 (0.4%) |
| 75 Years and over | 82 (6.3%) | 2 (2.4%) |
| Total | 8,241 (63.7%) | 338 (4.1%) |
Employment Status by Educational Attainment in Crawford County
According to labor force statistics for Crawford County, 79.7% of individuals (6,170) out of the total population between 25 and 64 years of age (7,742) are in the labor force, with 3.3% or 204 of them being unemployed. The group with the highest labor force participation rate are those with the educational attainment of bachelor's degree or higher, with 96.3% or 1,187 individuals in the labor force. Within the labor force, individuals with less than high school education have the highest percentage of unemployment, with 5.7% or 71 of them being unemployed.
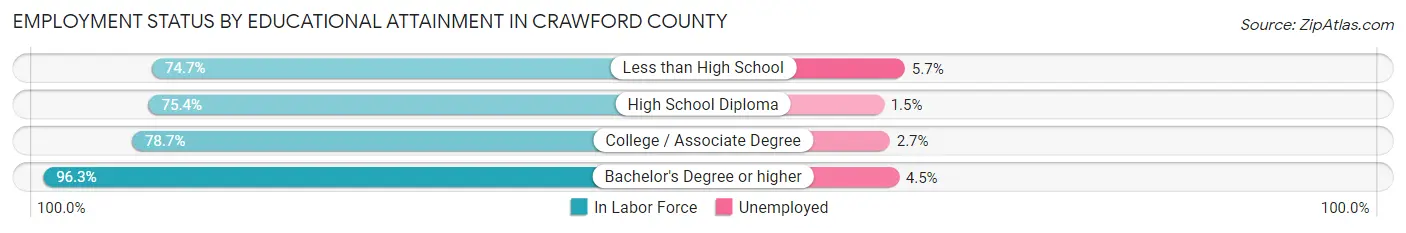
| Educational Attainment | In Labor Force | Unemployed |
| Less than High School | 1,241 (74.7%) | 95 (5.7%) |
| High School Diploma | 1,630 (75.4%) | 32 (1.5%) |
| College / Associate Degree | 2,114 (78.7%) | 73 (2.7%) |
| Bachelor's Degree or higher | 1,187 (96.3%) | 55 (4.5%) |
| Total | 6,170 (79.7%) | 255 (3.3%) |
Employment Occupations by Sex in Crawford County
Management, Business, Science and Arts Occupations
The most common Management, Business, Science and Arts occupations in Crawford County are Management (584 | 7.4%), Community & Social Service (506 | 6.4%), Education Instruction & Library (345 | 4.4%), Health Diagnosing & Treating (283 | 3.6%), and Business & Financial (193 | 2.4%).

Management, Business, Science and Arts Occupations by Sex
Within the Management, Business, Science and Arts occupations in Crawford County, the most male-oriented occupations are Computers & Mathematics (94.7%), Legal Services & Support (90.5%), and Architecture & Engineering (86.0%), while the most female-oriented occupations are Arts, Media & Entertainment (94.4%), Health Technologists (89.1%), and Health Diagnosing & Treating (87.3%).
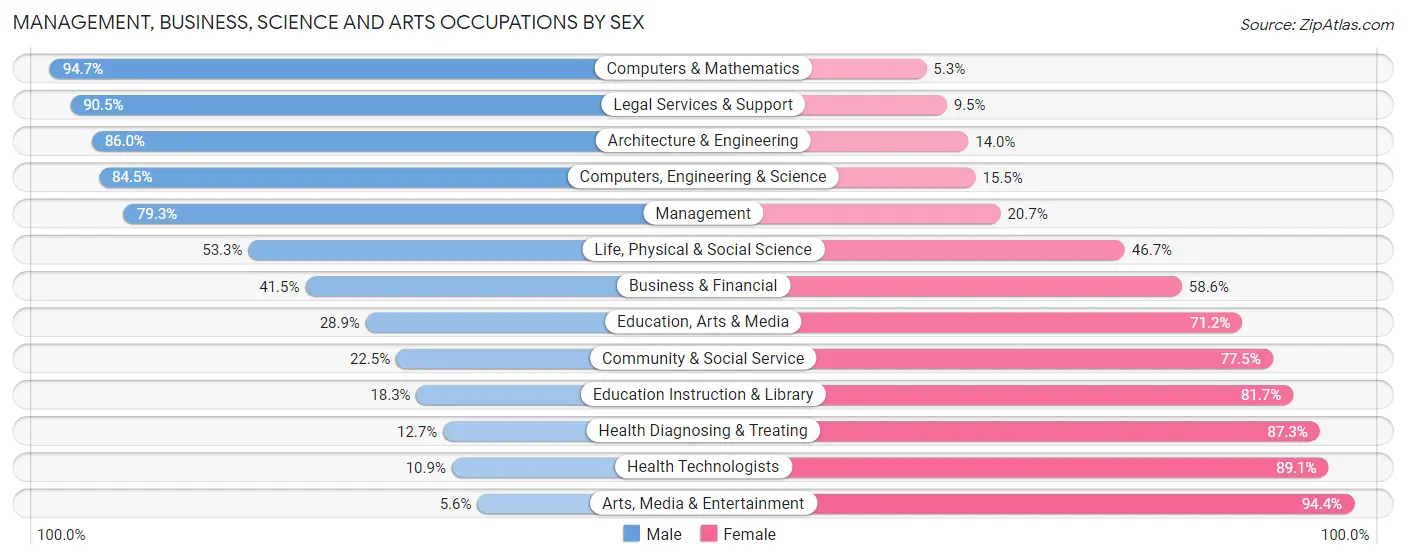
| Occupation | Male | Female |
| Management | 463 (79.3%) | 121 (20.7%) |
| Business & Financial | 80 (41.4%) | 113 (58.6%) |
| Computers, Engineering & Science | 87 (84.5%) | 16 (15.5%) |
| Computers & Mathematics | 36 (94.7%) | 2 (5.3%) |
| Architecture & Engineering | 43 (86.0%) | 7 (14.0%) |
| Life, Physical & Social Science | 8 (53.3%) | 7 (46.7%) |
| Community & Social Service | 114 (22.5%) | 392 (77.5%) |
| Education, Arts & Media | 30 (28.8%) | 74 (71.2%) |
| Legal Services & Support | 19 (90.5%) | 2 (9.5%) |
| Education Instruction & Library | 63 (18.3%) | 282 (81.7%) |
| Arts, Media & Entertainment | 2 (5.6%) | 34 (94.4%) |
| Health Diagnosing & Treating | 36 (12.7%) | 247 (87.3%) |
| Health Technologists | 17 (10.9%) | 139 (89.1%) |
| Total (Category) | 780 (46.7%) | 889 (53.3%) |
| Total (Overall) | 4,376 (55.3%) | 3,534 (44.7%) |
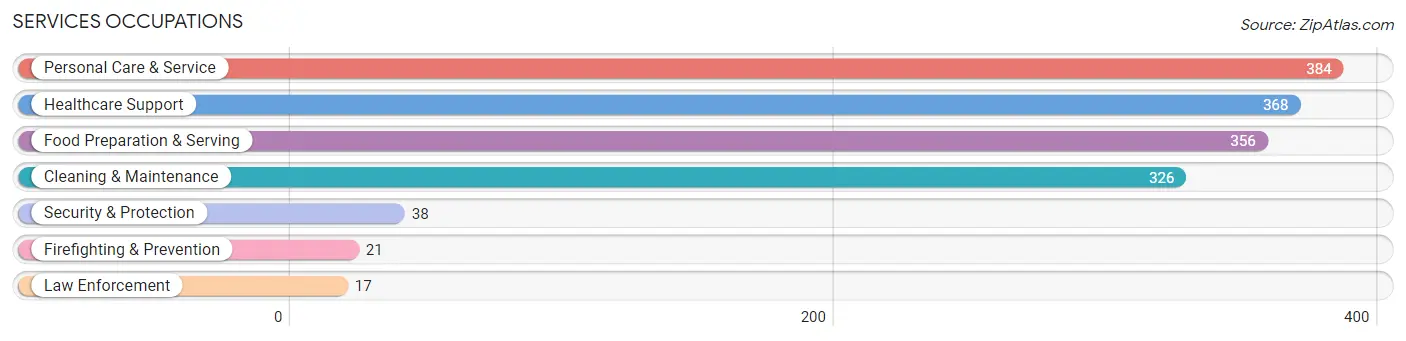
Services Occupations
The most common Services occupations in Crawford County are Personal Care & Service (384 | 4.9%), Healthcare Support (368 | 4.6%), Food Preparation & Serving (356 | 4.5%), Cleaning & Maintenance (326 | 4.1%), and Security & Protection (38 | 0.5%).
Services Occupations by Sex
Within the Services occupations in Crawford County, the most male-oriented occupations are Law Enforcement (94.1%), Security & Protection (71.1%), and Cleaning & Maintenance (64.7%), while the most female-oriented occupations are Personal Care & Service (89.8%), Healthcare Support (51.1%), and Food Preparation & Serving (50.0%).
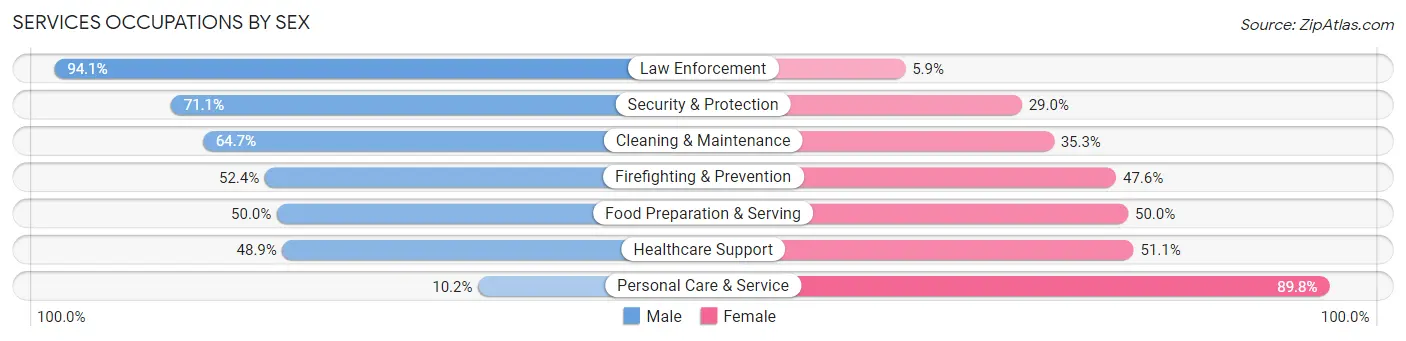
| Occupation | Male | Female |
| Healthcare Support | 180 (48.9%) | 188 (51.1%) |
| Security & Protection | 27 (71.1%) | 11 (28.9%) |
| Firefighting & Prevention | 11 (52.4%) | 10 (47.6%) |
| Law Enforcement | 16 (94.1%) | 1 (5.9%) |
| Food Preparation & Serving | 178 (50.0%) | 178 (50.0%) |
| Cleaning & Maintenance | 211 (64.7%) | 115 (35.3%) |
| Personal Care & Service | 39 (10.2%) | 345 (89.8%) |
| Total (Category) | 635 (43.1%) | 837 (56.9%) |
| Total (Overall) | 4,376 (55.3%) | 3,534 (44.7%) |
Sales and Office Occupations
The most common Sales and Office occupations in Crawford County are Sales & Related (830 | 10.5%), and Office & Administration (683 | 8.6%).

Sales and Office Occupations by Sex
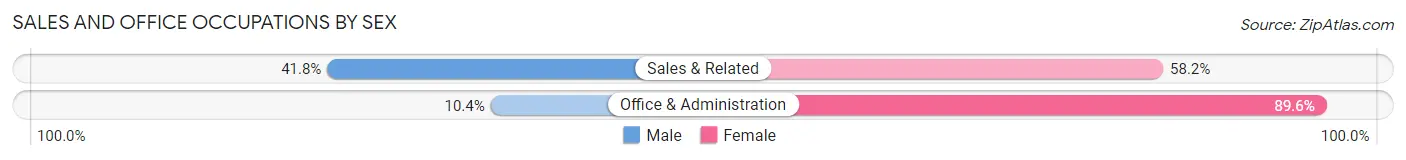
| Occupation | Male | Female |
| Sales & Related | 347 (41.8%) | 483 (58.2%) |
| Office & Administration | 71 (10.4%) | 612 (89.6%) |
| Total (Category) | 418 (27.6%) | 1,095 (72.4%) |
| Total (Overall) | 4,376 (55.3%) | 3,534 (44.7%) |
Natural Resources, Construction and Maintenance Occupations
The most common Natural Resources, Construction and Maintenance occupations in Crawford County are Construction & Extraction (423 | 5.3%), Farming, Fishing & Forestry (340 | 4.3%), and Installation, Maintenance & Repair (199 | 2.5%).
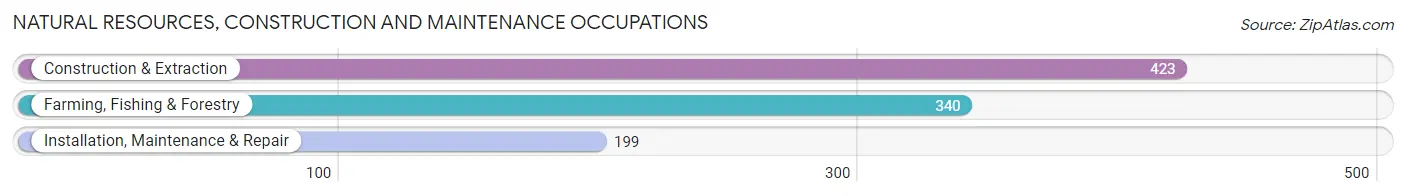
Natural Resources, Construction and Maintenance Occupations by Sex

| Occupation | Male | Female |
| Farming, Fishing & Forestry | 304 (89.4%) | 36 (10.6%) |
| Construction & Extraction | 423 (100.0%) | 0 (0.0%) |
| Installation, Maintenance & Repair | 192 (96.5%) | 7 (3.5%) |
| Total (Category) | 919 (95.5%) | 43 (4.5%) |
| Total (Overall) | 4,376 (55.3%) | 3,534 (44.7%) |
Production, Transportation and Moving Occupations
The most common Production, Transportation and Moving occupations in Crawford County are Production (1,253 | 15.8%), Material Moving (662 | 8.4%), and Transportation (379 | 4.8%).
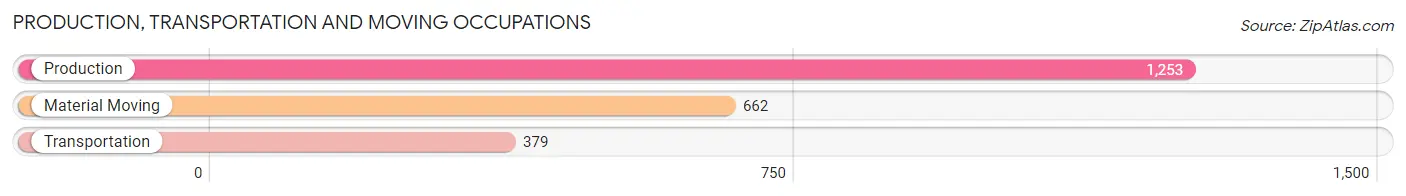
Production, Transportation and Moving Occupations by Sex
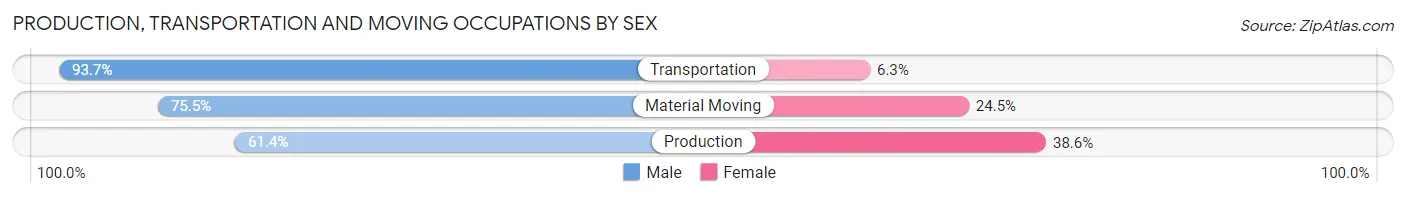
| Occupation | Male | Female |
| Production | 769 (61.4%) | 484 (38.6%) |
| Transportation | 355 (93.7%) | 24 (6.3%) |
| Material Moving | 500 (75.5%) | 162 (24.5%) |
| Total (Category) | 1,624 (70.8%) | 670 (29.2%) |
| Total (Overall) | 4,376 (55.3%) | 3,534 (44.7%) |
Employment Industries by Sex in Crawford County
Employment Industries in Crawford County
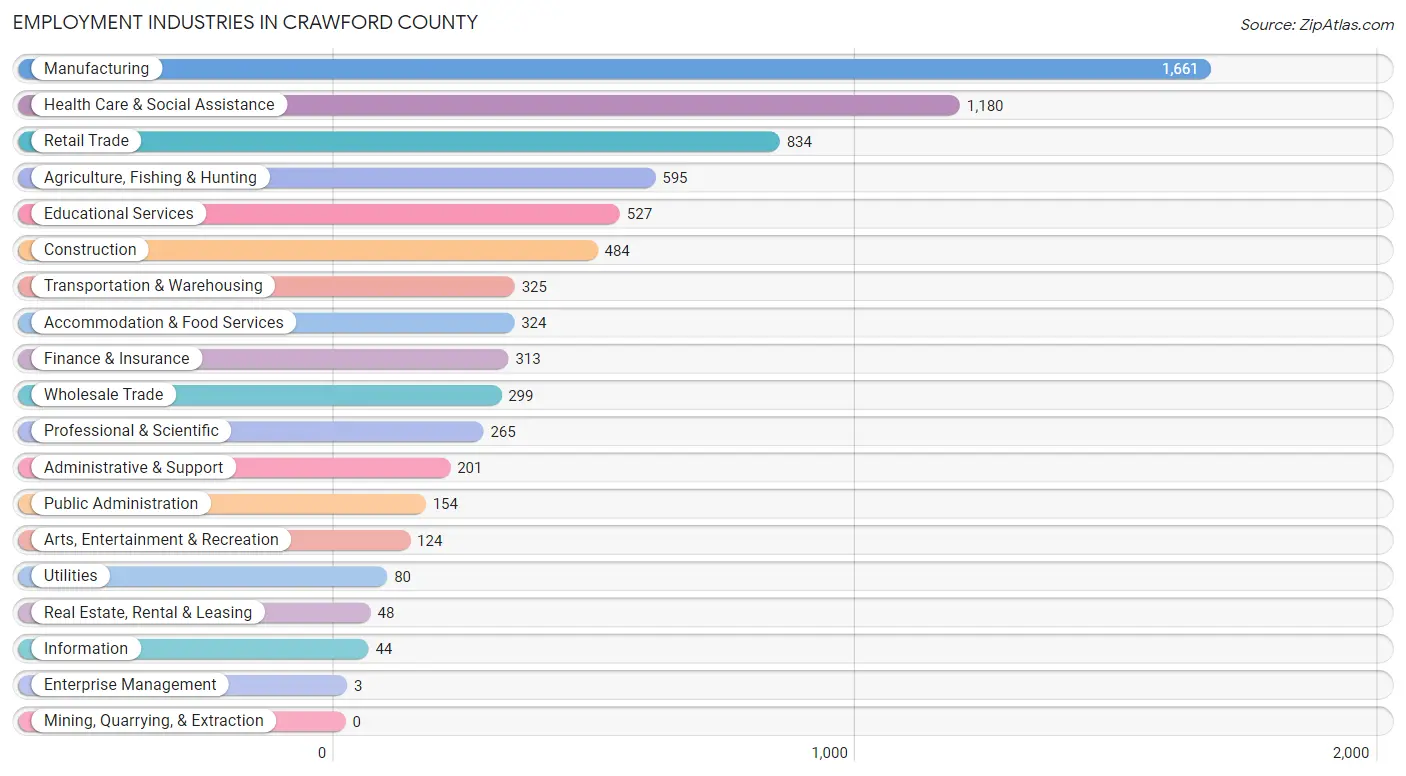
The major employment industries in Crawford County include Manufacturing (1,661 | 21.0%), Health Care & Social Assistance (1,180 | 14.9%), Retail Trade (834 | 10.5%), Agriculture, Fishing & Hunting (595 | 7.5%), and Educational Services (527 | 6.7%).
Employment Industries by Sex in Crawford County
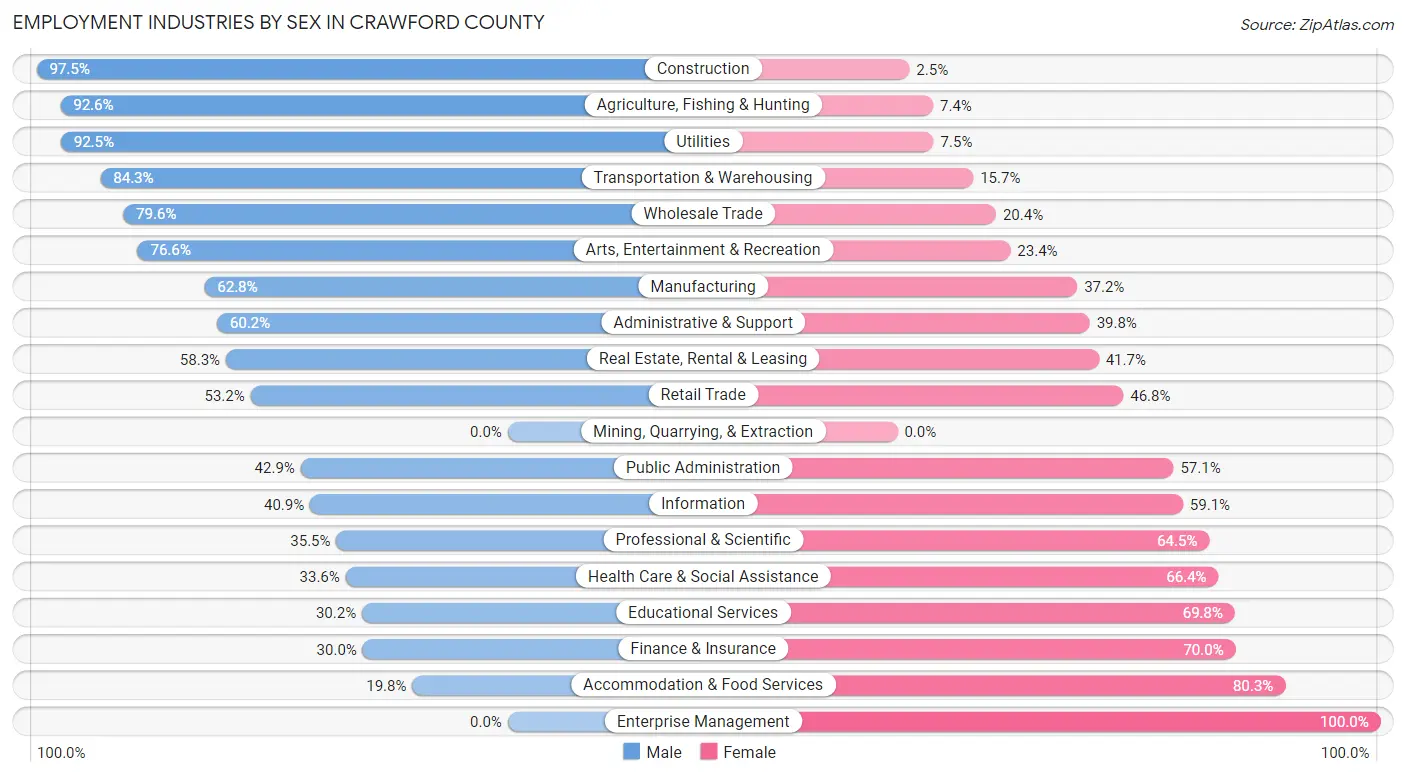
The Crawford County industries that see more men than women are Construction (97.5%), Agriculture, Fishing & Hunting (92.6%), and Utilities (92.5%), whereas the industries that tend to have a higher number of women are Enterprise Management (100.0%), Accommodation & Food Services (80.2%), and Finance & Insurance (70.0%).
| Industry | Male | Female |
| Agriculture, Fishing & Hunting | 551 (92.6%) | 44 (7.4%) |
| Mining, Quarrying, & Extraction | 0 (0.0%) | 0 (0.0%) |
| Construction | 472 (97.5%) | 12 (2.5%) |
| Manufacturing | 1,043 (62.8%) | 618 (37.2%) |
| Wholesale Trade | 238 (79.6%) | 61 (20.4%) |
| Retail Trade | 444 (53.2%) | 390 (46.8%) |
| Transportation & Warehousing | 274 (84.3%) | 51 (15.7%) |
| Utilities | 74 (92.5%) | 6 (7.5%) |
| Information | 18 (40.9%) | 26 (59.1%) |
| Finance & Insurance | 94 (30.0%) | 219 (70.0%) |
| Real Estate, Rental & Leasing | 28 (58.3%) | 20 (41.7%) |
| Professional & Scientific | 94 (35.5%) | 171 (64.5%) |
| Enterprise Management | 0 (0.0%) | 3 (100.0%) |
| Administrative & Support | 121 (60.2%) | 80 (39.8%) |
| Educational Services | 159 (30.2%) | 368 (69.8%) |
| Health Care & Social Assistance | 396 (33.6%) | 784 (66.4%) |
| Arts, Entertainment & Recreation | 95 (76.6%) | 29 (23.4%) |
| Accommodation & Food Services | 64 (19.8%) | 260 (80.2%) |
| Public Administration | 66 (42.9%) | 88 (57.1%) |
| Total | 4,376 (55.3%) | 3,534 (44.7%) |
Education in Crawford County
School Enrollment in Crawford County
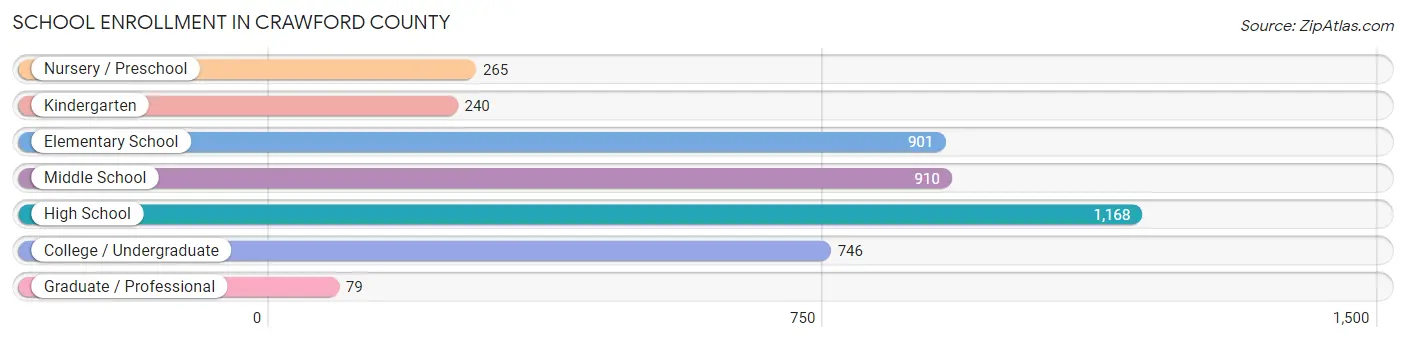
The most common levels of schooling among the 4,309 students in Crawford County are high school (1,168 | 27.1%), middle school (910 | 21.1%), and elementary school (901 | 20.9%).
| School Level | # Students | % Students |
| Nursery / Preschool | 265 | 6.1% |
| Kindergarten | 240 | 5.6% |
| Elementary School | 901 | 20.9% |
| Middle School | 910 | 21.1% |
| High School | 1,168 | 27.1% |
| College / Undergraduate | 746 | 17.3% |
| Graduate / Professional | 79 | 1.8% |
| Total | 4,309 | 100.0% |
School Enrollment by Age by Funding Source in Crawford County
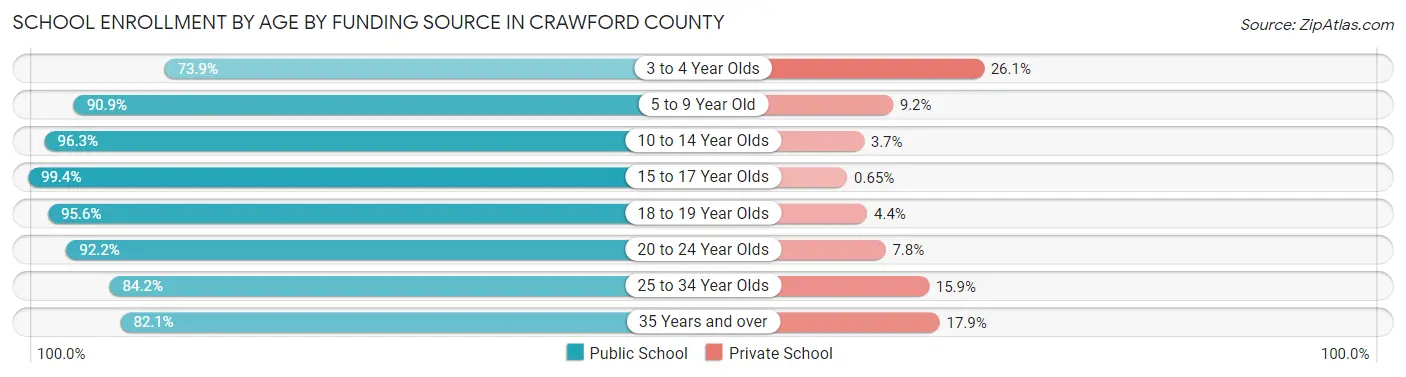
Out of a total of 4,309 students who are enrolled in schools in Crawford County, 302 (7.0%) attend a private institution, while the remaining 4,007 (93.0%) are enrolled in public schools. The age group of 3 to 4 year olds has the highest likelihood of being enrolled in private schools, with 54 (26.1% in the age bracket) enrolled. Conversely, the age group of 15 to 17 year olds has the lowest likelihood of being enrolled in a private school, with 769 (99.4% in the age bracket) attending a public institution.
| Age Bracket | Public School | Private School |
| 3 to 4 Year Olds | 153 (73.9%) | 54 (26.1%) |
| 5 to 9 Year Old | 1,023 (90.8%) | 103 (9.1%) |
| 10 to 14 Year Olds | 1,029 (96.3%) | 40 (3.7%) |
| 15 to 17 Year Olds | 769 (99.4%) | 5 (0.6%) |
| 18 to 19 Year Olds | 329 (95.6%) | 15 (4.4%) |
| 20 to 24 Year Olds | 497 (92.2%) | 42 (7.8%) |
| 25 to 34 Year Olds | 69 (84.2%) | 13 (15.9%) |
| 35 Years and over | 138 (82.1%) | 30 (17.9%) |
| Total | 4,007 (93.0%) | 302 (7.0%) |
Educational Attainment by Field of Study in Crawford County
Education (387 | 21.6%), business (343 | 19.2%), science & technology (251 | 14.0%), arts & humanities (212 | 11.8%), and bio, nature & agricultural (165 | 9.2%) are the most common fields of study among 1,791 individuals in Crawford County who have obtained a bachelor's degree or higher.
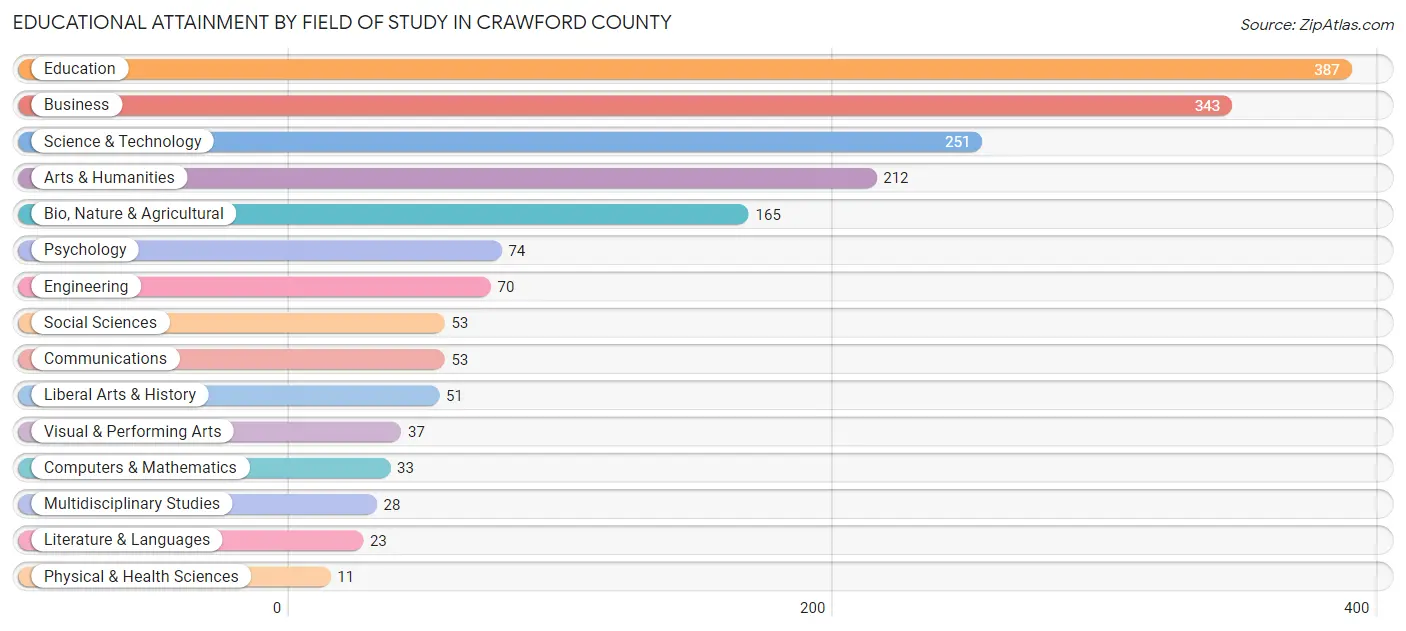
| Field of Study | # Graduates | % Graduates |
| Computers & Mathematics | 33 | 1.8% |
| Bio, Nature & Agricultural | 165 | 9.2% |
| Physical & Health Sciences | 11 | 0.6% |
| Psychology | 74 | 4.1% |
| Social Sciences | 53 | 3.0% |
| Engineering | 70 | 3.9% |
| Multidisciplinary Studies | 28 | 1.6% |
| Science & Technology | 251 | 14.0% |
| Business | 343 | 19.2% |
| Education | 387 | 21.6% |
| Literature & Languages | 23 | 1.3% |
| Liberal Arts & History | 51 | 2.9% |
| Visual & Performing Arts | 37 | 2.1% |
| Communications | 53 | 3.0% |
| Arts & Humanities | 212 | 11.8% |
| Total | 1,791 | 100.0% |
Transportation & Commute in Crawford County
Vehicle Availability by Sex in Crawford County
The most prevalent vehicle ownership categories in Crawford County are males with 2 vehicles (1,995, accounting for 47.3%) and females with 2 vehicles (1,351, making up 58.7%).
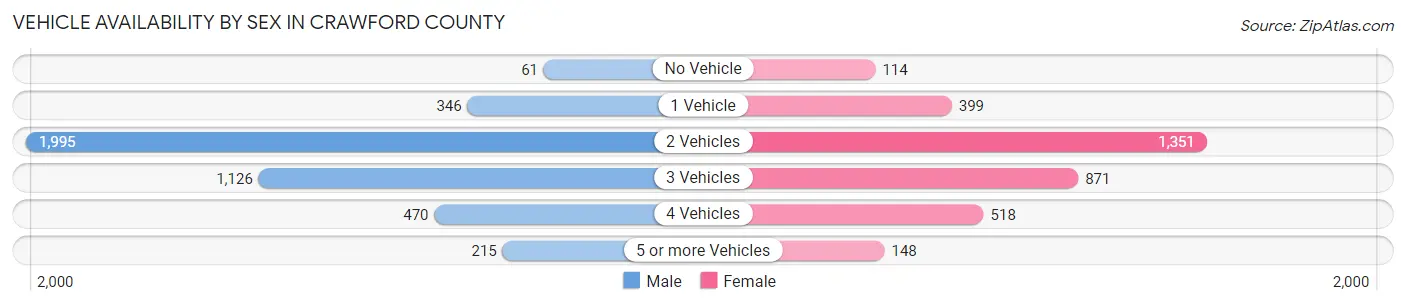
| Vehicles Available | Male | Female |
| No Vehicle | 61 (1.5%) | 114 (3.4%) |
| 1 Vehicle | 346 (8.2%) | 399 (11.7%) |
| 2 Vehicles | 1,995 (47.3%) | 1,351 (39.7%) |
| 3 Vehicles | 1,126 (26.7%) | 871 (25.6%) |
| 4 Vehicles | 470 (11.2%) | 518 (15.2%) |
| 5 or more Vehicles | 215 (5.1%) | 148 (4.3%) |
| Total | 4,213 (100.0%) | 3,401 (100.0%) |
Commute Time in Crawford County
The most frequently occuring commute durations in Crawford County are 5 to 9 minutes (2,123 commuters, 29.3%), 10 to 14 minutes (1,247 commuters, 17.2%), and 15 to 19 minutes (922 commuters, 12.7%).
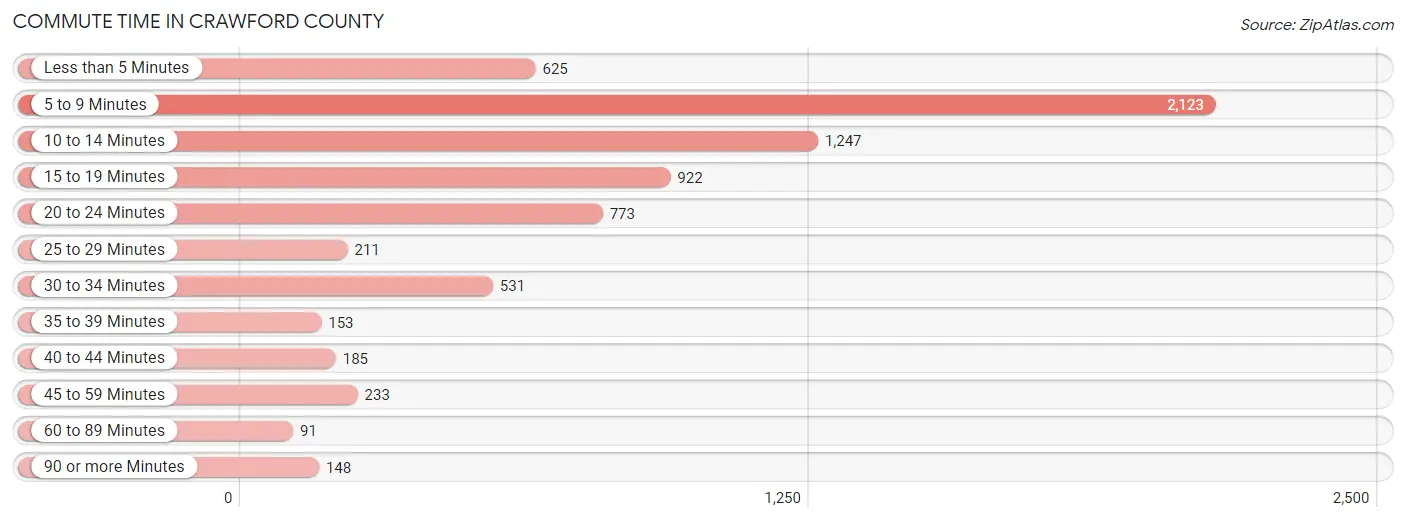
| Commute Time | # Commuters | % Commuters |
| Less than 5 Minutes | 625 | 8.6% |
| 5 to 9 Minutes | 2,123 | 29.3% |
| 10 to 14 Minutes | 1,247 | 17.2% |
| 15 to 19 Minutes | 922 | 12.7% |
| 20 to 24 Minutes | 773 | 10.7% |
| 25 to 29 Minutes | 211 | 2.9% |
| 30 to 34 Minutes | 531 | 7.3% |
| 35 to 39 Minutes | 153 | 2.1% |
| 40 to 44 Minutes | 185 | 2.5% |
| 45 to 59 Minutes | 233 | 3.2% |
| 60 to 89 Minutes | 91 | 1.3% |
| 90 or more Minutes | 148 | 2.0% |
Commute Time by Sex in Crawford County
The most common commute times in Crawford County are 5 to 9 minutes (1,313 commuters, 32.8%) for males and 5 to 9 minutes (810 commuters, 25.1%) for females.
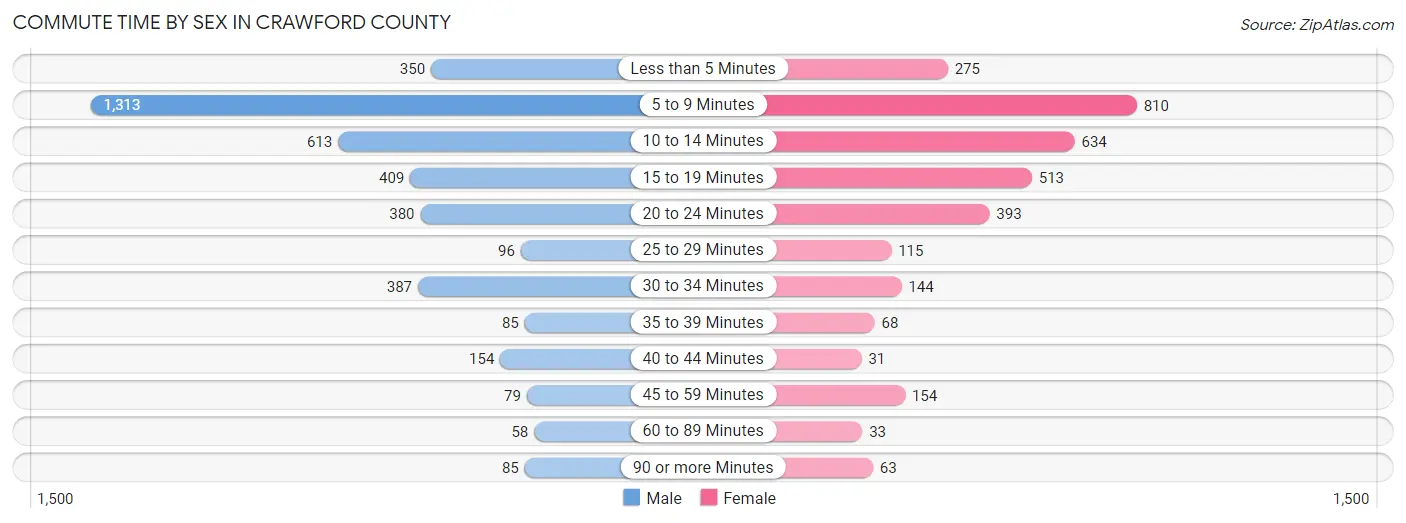
| Commute Time | Male | Female |
| Less than 5 Minutes | 350 (8.7%) | 275 (8.5%) |
| 5 to 9 Minutes | 1,313 (32.8%) | 810 (25.1%) |
| 10 to 14 Minutes | 613 (15.3%) | 634 (19.6%) |
| 15 to 19 Minutes | 409 (10.2%) | 513 (15.9%) |
| 20 to 24 Minutes | 380 (9.5%) | 393 (12.2%) |
| 25 to 29 Minutes | 96 (2.4%) | 115 (3.6%) |
| 30 to 34 Minutes | 387 (9.7%) | 144 (4.4%) |
| 35 to 39 Minutes | 85 (2.1%) | 68 (2.1%) |
| 40 to 44 Minutes | 154 (3.8%) | 31 (1.0%) |
| 45 to 59 Minutes | 79 (2.0%) | 154 (4.8%) |
| 60 to 89 Minutes | 58 (1.5%) | 33 (1.0%) |
| 90 or more Minutes | 85 (2.1%) | 63 (1.9%) |
Time of Departure to Work by Sex in Crawford County
The most frequent times of departure to work in Crawford County are 6:30 AM to 6:59 AM (566, 14.1%) for males and 7:30 AM to 7:59 AM (613, 19.0%) for females.
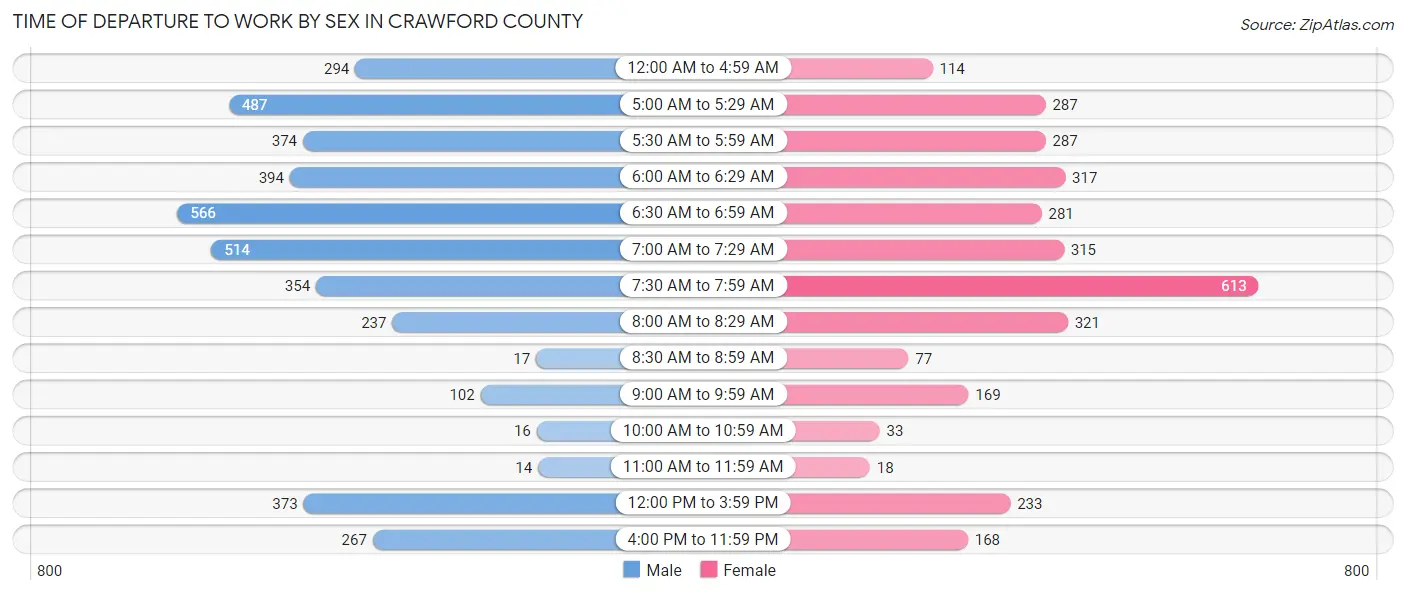
| Time of Departure | Male | Female |
| 12:00 AM to 4:59 AM | 294 (7.3%) | 114 (3.5%) |
| 5:00 AM to 5:29 AM | 487 (12.1%) | 287 (8.9%) |
| 5:30 AM to 5:59 AM | 374 (9.3%) | 287 (8.9%) |
| 6:00 AM to 6:29 AM | 394 (9.8%) | 317 (9.8%) |
| 6:30 AM to 6:59 AM | 566 (14.1%) | 281 (8.7%) |
| 7:00 AM to 7:29 AM | 514 (12.8%) | 315 (9.7%) |
| 7:30 AM to 7:59 AM | 354 (8.8%) | 613 (19.0%) |
| 8:00 AM to 8:29 AM | 237 (5.9%) | 321 (9.9%) |
| 8:30 AM to 8:59 AM | 17 (0.4%) | 77 (2.4%) |
| 9:00 AM to 9:59 AM | 102 (2.5%) | 169 (5.2%) |
| 10:00 AM to 10:59 AM | 16 (0.4%) | 33 (1.0%) |
| 11:00 AM to 11:59 AM | 14 (0.4%) | 18 (0.6%) |
| 12:00 PM to 3:59 PM | 373 (9.3%) | 233 (7.2%) |
| 4:00 PM to 11:59 PM | 267 (6.7%) | 168 (5.2%) |
| Total | 4,009 (100.0%) | 3,233 (100.0%) |
Housing Occupancy in Crawford County
Occupancy by Ownership in Crawford County
Of the total 6,214 dwellings in Crawford County, owner-occupied units account for 4,581 (73.7%), while renter-occupied units make up 1,633 (26.3%).
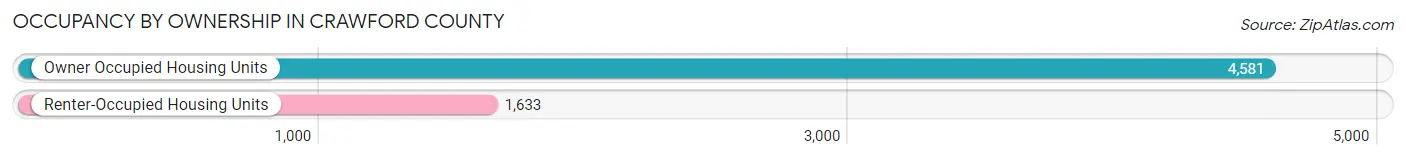
| Occupancy | # Housing Units | % Housing Units |
| Owner Occupied Housing Units | 4,581 | 73.7% |
| Renter-Occupied Housing Units | 1,633 | 26.3% |
| Total Occupied Housing Units | 6,214 | 100.0% |
Occupancy by Household Size in Crawford County
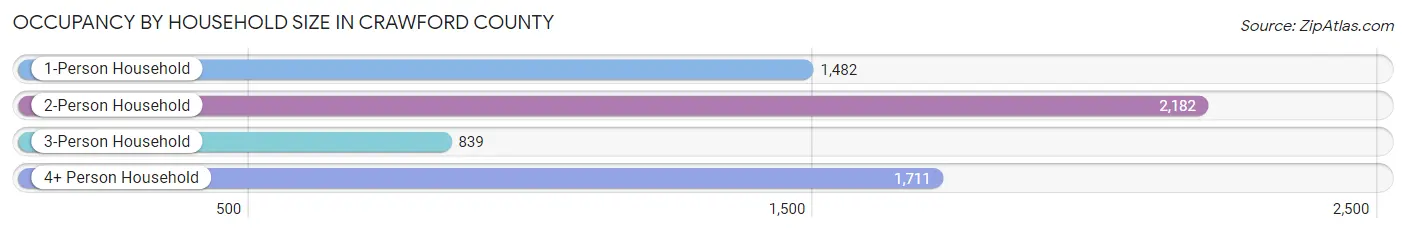
| Household Size | # Housing Units | % Housing Units |
| 1-Person Household | 1,482 | 23.8% |
| 2-Person Household | 2,182 | 35.1% |
| 3-Person Household | 839 | 13.5% |
| 4+ Person Household | 1,711 | 27.5% |
| Total Housing Units | 6,214 | 100.0% |
Occupancy by Ownership by Household Size in Crawford County
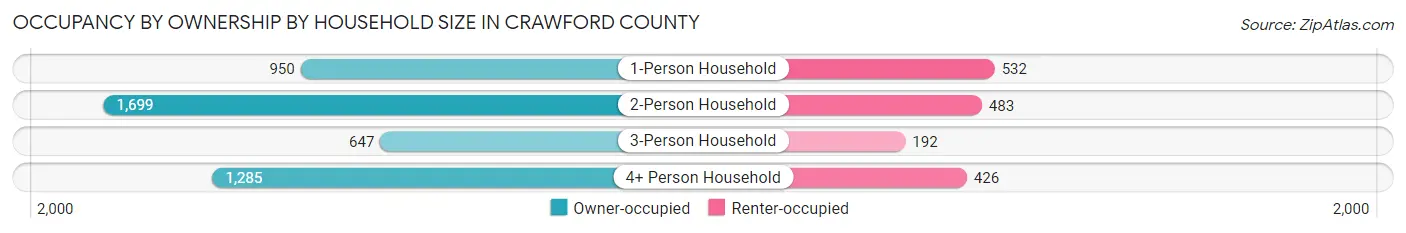
| Household Size | Owner-occupied | Renter-occupied |
| 1-Person Household | 950 (64.1%) | 532 (35.9%) |
| 2-Person Household | 1,699 (77.9%) | 483 (22.1%) |
| 3-Person Household | 647 (77.1%) | 192 (22.9%) |
| 4+ Person Household | 1,285 (75.1%) | 426 (24.9%) |
| Total Housing Units | 4,581 (73.7%) | 1,633 (26.3%) |
Occupancy by Educational Attainment in Crawford County
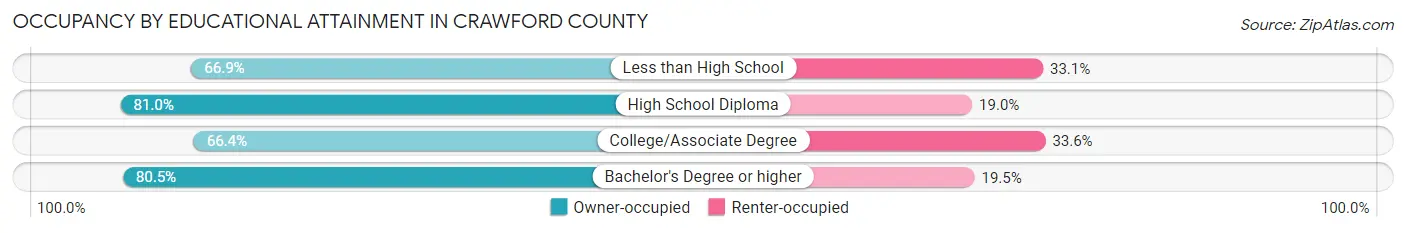
| Household Size | Owner-occupied | Renter-occupied |
| Less than High School | 623 (66.9%) | 308 (33.1%) |
| High School Diploma | 1,685 (81.0%) | 396 (19.0%) |
| College/Associate Degree | 1,439 (66.4%) | 727 (33.6%) |
| Bachelor's Degree or higher | 834 (80.5%) | 202 (19.5%) |
Occupancy by Age of Householder in Crawford County
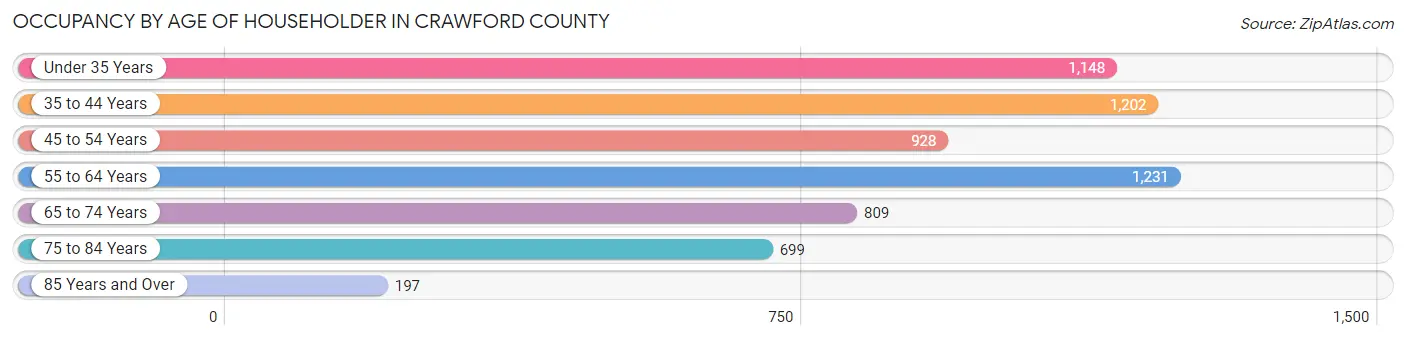
| Age Bracket | # Households | % Households |
| Under 35 Years | 1,148 | 18.5% |
| 35 to 44 Years | 1,202 | 19.3% |
| 45 to 54 Years | 928 | 14.9% |
| 55 to 64 Years | 1,231 | 19.8% |
| 65 to 74 Years | 809 | 13.0% |
| 75 to 84 Years | 699 | 11.3% |
| 85 Years and Over | 197 | 3.2% |
| Total | 6,214 | 100.0% |
Housing Finances in Crawford County
Median Income by Occupancy in Crawford County
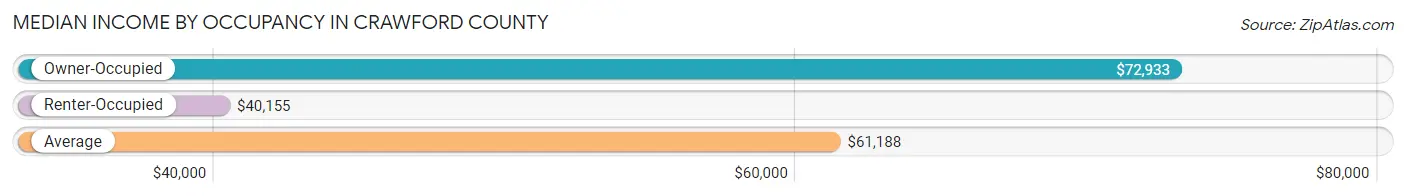
| Occupancy Type | # Households | Median Income |
| Owner-Occupied | 4,581 (73.7%) | $72,933 |
| Renter-Occupied | 1,633 (26.3%) | $40,155 |
| Average | 6,214 (100.0%) | $61,188 |
Occupancy by Householder Income Bracket in Crawford County
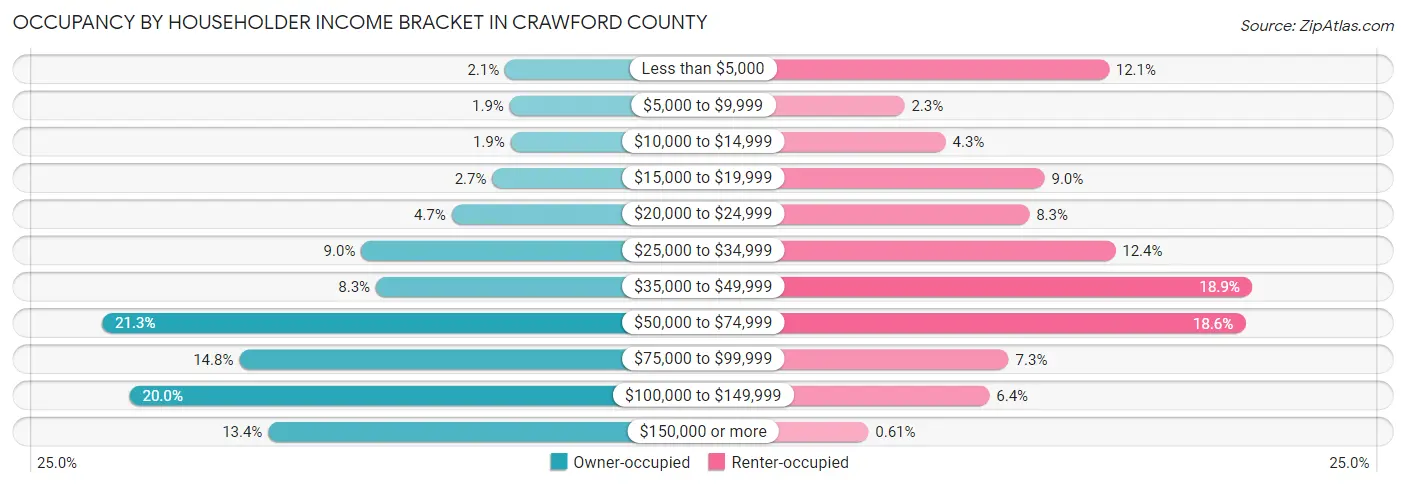
| Income Bracket | Owner-occupied | Renter-occupied |
| Less than $5,000 | 97 (2.1%) | 197 (12.1%) |
| $5,000 to $9,999 | 87 (1.9%) | 38 (2.3%) |
| $10,000 to $14,999 | 85 (1.9%) | 70 (4.3%) |
| $15,000 to $19,999 | 125 (2.7%) | 147 (9.0%) |
| $20,000 to $24,999 | 214 (4.7%) | 135 (8.3%) |
| $25,000 to $34,999 | 411 (9.0%) | 202 (12.4%) |
| $35,000 to $49,999 | 379 (8.3%) | 308 (18.9%) |
| $50,000 to $74,999 | 976 (21.3%) | 303 (18.5%) |
| $75,000 to $99,999 | 677 (14.8%) | 119 (7.3%) |
| $100,000 to $149,999 | 916 (20.0%) | 104 (6.4%) |
| $150,000 or more | 614 (13.4%) | 10 (0.6%) |
| Total | 4,581 (100.0%) | 1,633 (100.0%) |
Monthly Housing Cost Tiers in Crawford County

| Monthly Cost | Owner-occupied | Renter-occupied |
| Less than $300 | 518 (11.3%) | 72 (4.4%) |
| $300 to $499 | 770 (16.8%) | 103 (6.3%) |
| $500 to $799 | 1,260 (27.5%) | 768 (47.0%) |
| $800 to $999 | 508 (11.1%) | 357 (21.9%) |
| $1,000 to $1,499 | 982 (21.4%) | 197 (12.1%) |
| $1,500 to $1,999 | 293 (6.4%) | 5 (0.3%) |
| $2,000 to $2,499 | 123 (2.7%) | 0 (0.0%) |
| $2,500 to $2,999 | 67 (1.5%) | 0 (0.0%) |
| $3,000 or more | 60 (1.3%) | 0 (0.0%) |
| Total | 4,581 (100.0%) | 1,633 (100.0%) |
Physical Housing Characteristics in Crawford County
Housing Structures in Crawford County
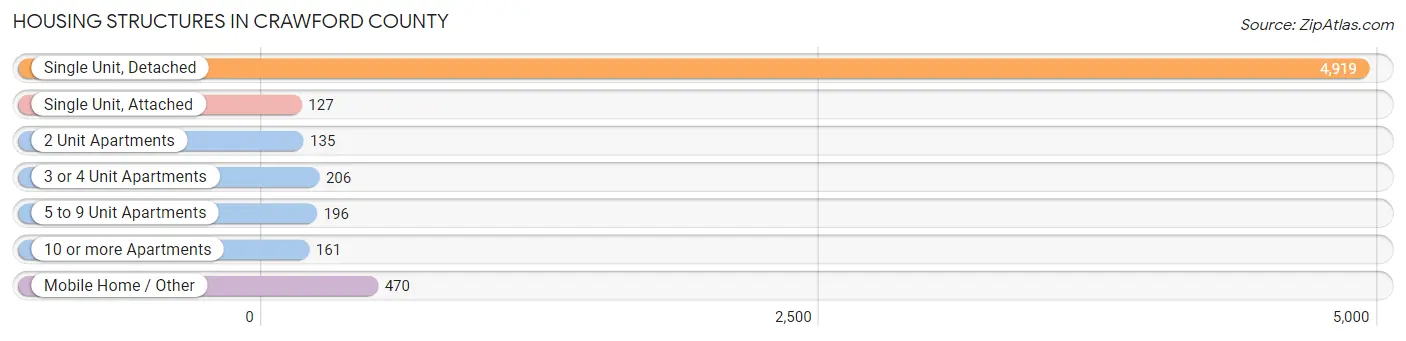
| Structure Type | # Housing Units | % Housing Units |
| Single Unit, Detached | 4,919 | 79.2% |
| Single Unit, Attached | 127 | 2.0% |
| 2 Unit Apartments | 135 | 2.2% |
| 3 or 4 Unit Apartments | 206 | 3.3% |
| 5 to 9 Unit Apartments | 196 | 3.2% |
| 10 or more Apartments | 161 | 2.6% |
| Mobile Home / Other | 470 | 7.6% |
| Total | 6,214 | 100.0% |
Housing Structures by Occupancy in Crawford County
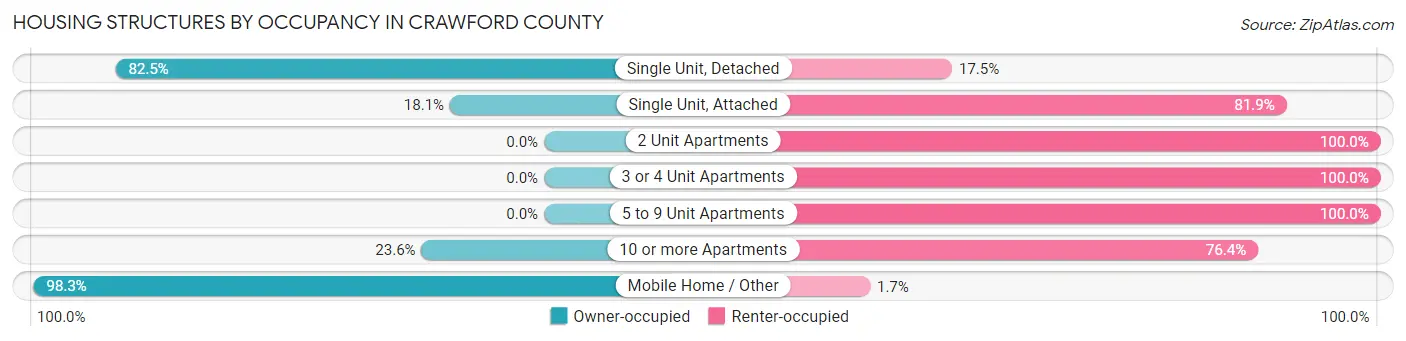
| Structure Type | Owner-occupied | Renter-occupied |
| Single Unit, Detached | 4,058 (82.5%) | 861 (17.5%) |
| Single Unit, Attached | 23 (18.1%) | 104 (81.9%) |
| 2 Unit Apartments | 0 (0.0%) | 135 (100.0%) |
| 3 or 4 Unit Apartments | 0 (0.0%) | 206 (100.0%) |
| 5 to 9 Unit Apartments | 0 (0.0%) | 196 (100.0%) |
| 10 or more Apartments | 38 (23.6%) | 123 (76.4%) |
| Mobile Home / Other | 462 (98.3%) | 8 (1.7%) |
| Total | 4,581 (73.7%) | 1,633 (26.3%) |
Housing Structures by Number of Rooms in Crawford County
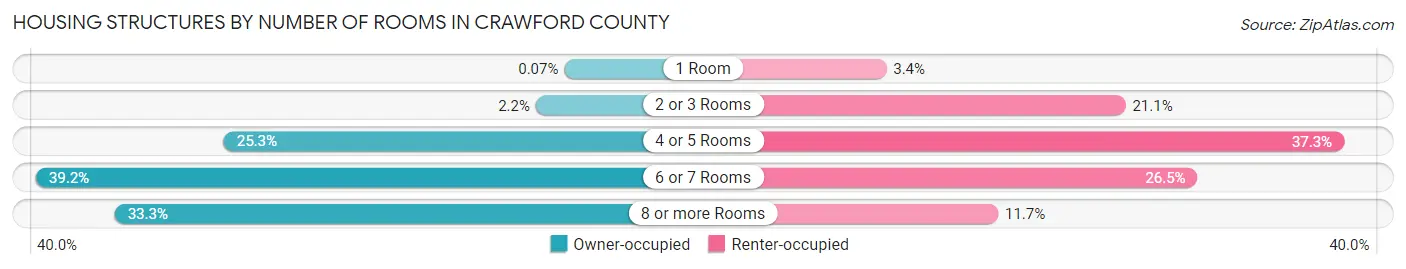
| Number of Rooms | Owner-occupied | Renter-occupied |
| 1 Room | 3 (0.1%) | 56 (3.4%) |
| 2 or 3 Rooms | 100 (2.2%) | 345 (21.1%) |
| 4 or 5 Rooms | 1,157 (25.3%) | 609 (37.3%) |
| 6 or 7 Rooms | 1,794 (39.2%) | 432 (26.5%) |
| 8 or more Rooms | 1,527 (33.3%) | 191 (11.7%) |
| Total | 4,581 (100.0%) | 1,633 (100.0%) |
Housing Structure by Heating Type in Crawford County
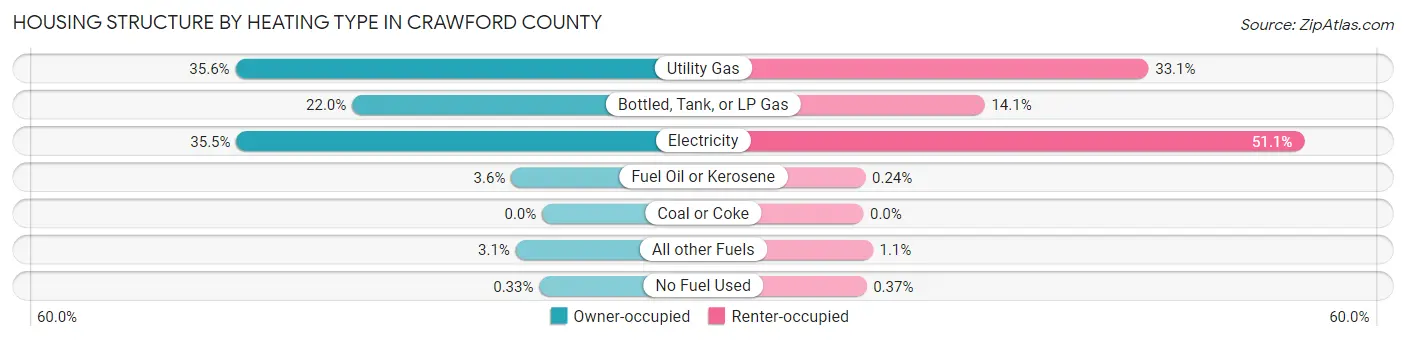
| Heating Type | Owner-occupied | Renter-occupied |
| Utility Gas | 1,629 (35.6%) | 540 (33.1%) |
| Bottled, Tank, or LP Gas | 1,009 (22.0%) | 230 (14.1%) |
| Electricity | 1,624 (35.4%) | 835 (51.1%) |
| Fuel Oil or Kerosene | 164 (3.6%) | 4 (0.2%) |
| Coal or Coke | 0 (0.0%) | 0 (0.0%) |
| All other Fuels | 140 (3.1%) | 18 (1.1%) |
| No Fuel Used | 15 (0.3%) | 6 (0.4%) |
| Total | 4,581 (100.0%) | 1,633 (100.0%) |
Household Vehicle Usage in Crawford County
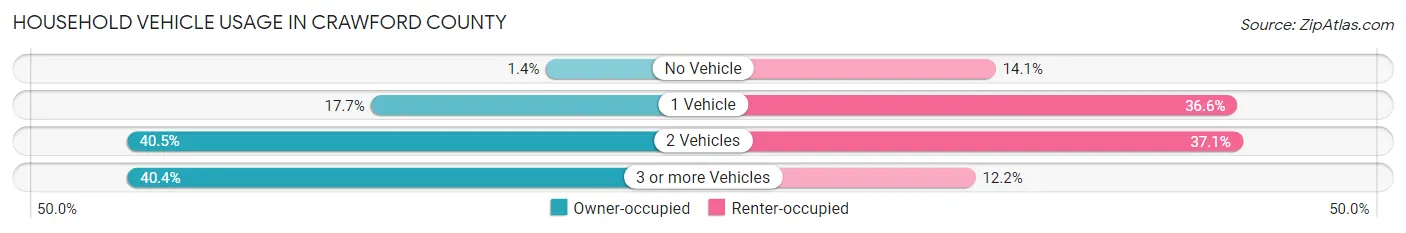
| Vehicles per Household | Owner-occupied | Renter-occupied |
| No Vehicle | 64 (1.4%) | 230 (14.1%) |
| 1 Vehicle | 811 (17.7%) | 598 (36.6%) |
| 2 Vehicles | 1,855 (40.5%) | 606 (37.1%) |
| 3 or more Vehicles | 1,851 (40.4%) | 199 (12.2%) |
| Total | 4,581 (100.0%) | 1,633 (100.0%) |
Real Estate & Mortgages in Crawford County
Real Estate and Mortgage Overview in Crawford County
| Characteristic | Without Mortgage | With Mortgage |
| Housing Units | 2,492 | 2,089 |
| Median Property Value | $99,400 | $147,000 |
| Median Household Income | $60,000 | $398 |
| Monthly Housing Costs | $493 | $59 |
| Real Estate Taxes | $1,306 | $76 |
Property Value by Mortgage Status in Crawford County

| Property Value | Without Mortgage | With Mortgage |
| Less than $50,000 | 679 (27.3%) | 212 (10.2%) |
| $50,000 to $99,999 | 574 (23.0%) | 481 (23.0%) |
| $100,000 to $299,999 | 1,051 (42.2%) | 1,234 (59.1%) |
| $300,000 to $499,999 | 135 (5.4%) | 96 (4.6%) |
| $500,000 to $749,999 | 35 (1.4%) | 33 (1.6%) |
| $750,000 to $999,999 | 0 (0.0%) | 16 (0.8%) |
| $1,000,000 or more | 18 (0.7%) | 17 (0.8%) |
| Total | 2,492 (100.0%) | 2,089 (100.0%) |
Household Income by Mortgage Status in Crawford County
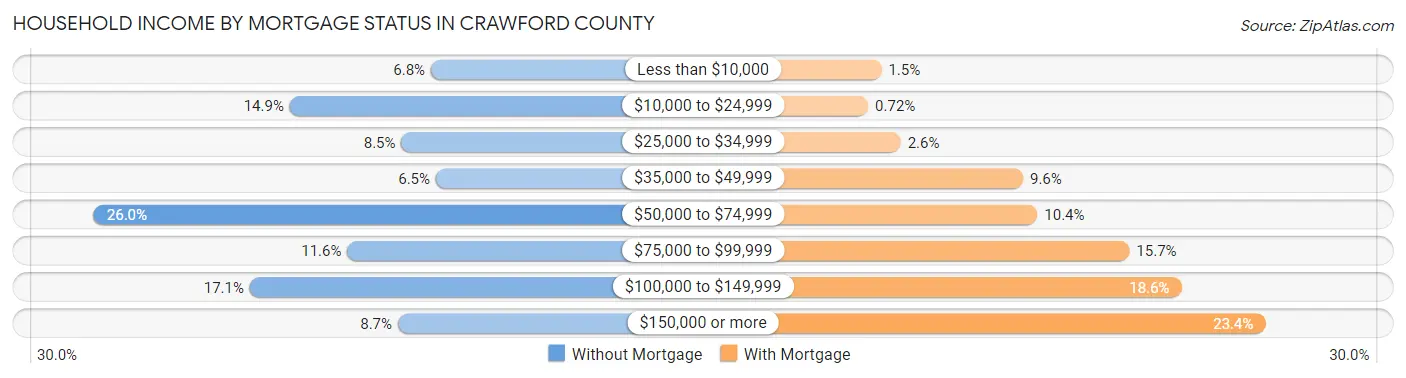
| Household Income | Without Mortgage | With Mortgage |
| Less than $10,000 | 169 (6.8%) | 31 (1.5%) |
| $10,000 to $24,999 | 370 (14.8%) | 15 (0.7%) |
| $25,000 to $34,999 | 211 (8.5%) | 54 (2.6%) |
| $35,000 to $49,999 | 162 (6.5%) | 200 (9.6%) |
| $50,000 to $74,999 | 649 (26.0%) | 217 (10.4%) |
| $75,000 to $99,999 | 288 (11.6%) | 327 (15.7%) |
| $100,000 to $149,999 | 427 (17.1%) | 389 (18.6%) |
| $150,000 or more | 216 (8.7%) | 489 (23.4%) |
| Total | 2,492 (100.0%) | 2,089 (100.0%) |
Property Value to Household Income Ratio in Crawford County
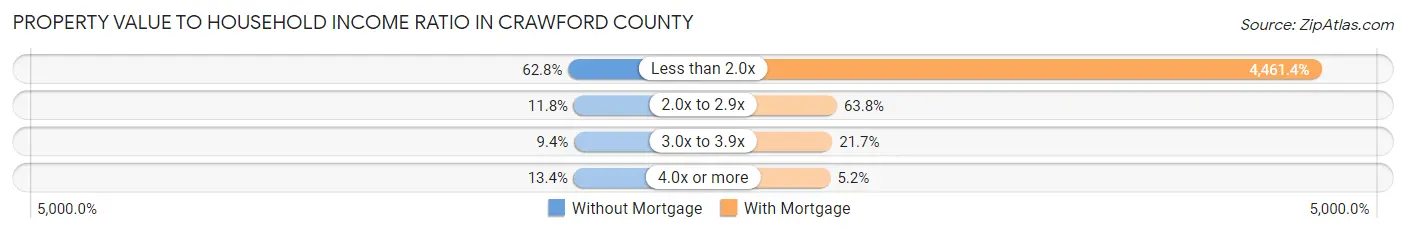
| Value-to-Income Ratio | Without Mortgage | With Mortgage |
| Less than 2.0x | 1,566 (62.8%) | 93,199 (4,461.4%) |
| 2.0x to 2.9x | 294 (11.8%) | 1,333 (63.8%) |
| 3.0x to 3.9x | 235 (9.4%) | 453 (21.7%) |
| 4.0x or more | 335 (13.4%) | 109 (5.2%) |
| Total | 2,492 (100.0%) | 2,089 (100.0%) |
Real Estate Taxes by Mortgage Status in Crawford County
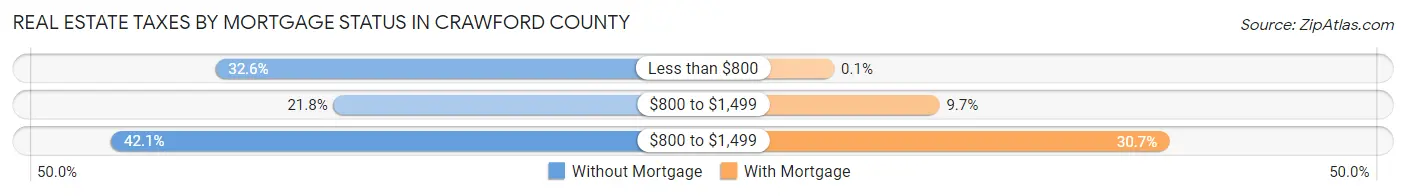
| Property Taxes | Without Mortgage | With Mortgage |
| Less than $800 | 812 (32.6%) | 2 (0.1%) |
| $800 to $1,499 | 543 (21.8%) | 203 (9.7%) |
| $800 to $1,499 | 1,049 (42.1%) | 641 (30.7%) |
| Total | 2,492 (100.0%) | 2,089 (100.0%) |
Health & Disability in Crawford County
Health Insurance Coverage by Age in Crawford County
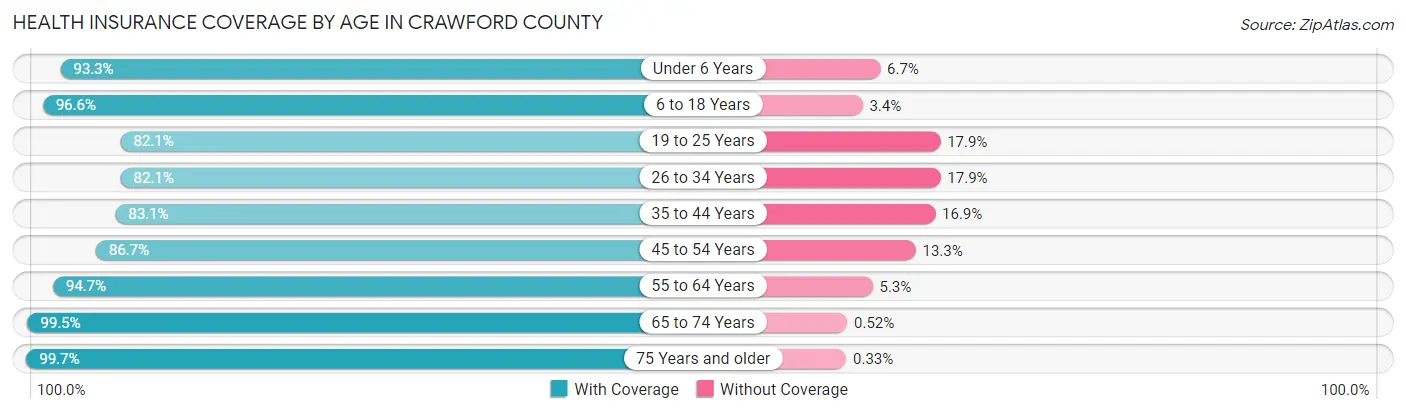
| Age Bracket | With Coverage | Without Coverage |
| Under 6 Years | 1,147 (93.3%) | 82 (6.7%) |
| 6 to 18 Years | 3,089 (96.6%) | 108 (3.4%) |
| 19 to 25 Years | 1,323 (82.1%) | 288 (17.9%) |
| 26 to 34 Years | 1,347 (82.1%) | 294 (17.9%) |
| 35 to 44 Years | 1,604 (83.1%) | 327 (16.9%) |
| 45 to 54 Years | 1,488 (86.7%) | 228 (13.3%) |
| 55 to 64 Years | 2,048 (94.7%) | 114 (5.3%) |
| 65 to 74 Years | 1,539 (99.5%) | 8 (0.5%) |
| 75 Years and older | 1,222 (99.7%) | 4 (0.3%) |
| Total | 14,807 (91.1%) | 1,453 (8.9%) |
Health Insurance Coverage by Citizenship Status in Crawford County

| Citizenship Status | With Coverage | Without Coverage |
| Native Born | 1,147 (93.3%) | 82 (6.7%) |
| Foreign Born, Citizen | 3,089 (96.6%) | 108 (3.4%) |
| Foreign Born, not a Citizen | 1,323 (82.1%) | 288 (17.9%) |
Health Insurance Coverage by Household Income in Crawford County
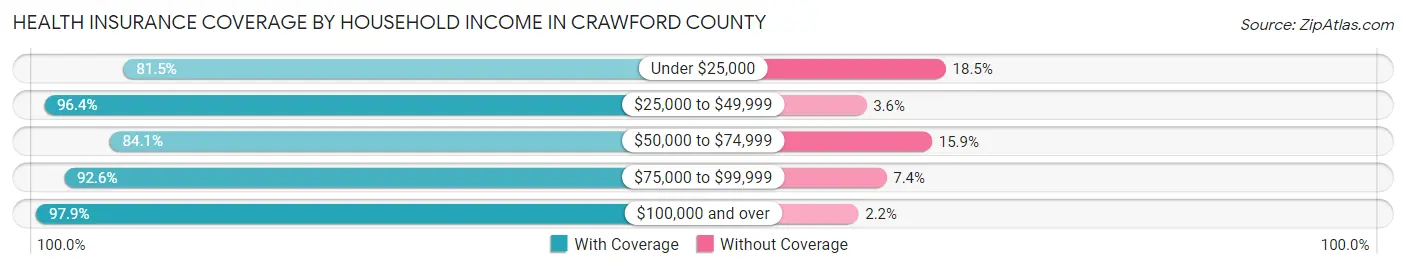
| Household Income | With Coverage | Without Coverage |
| Under $25,000 | 2,151 (81.5%) | 489 (18.5%) |
| $25,000 to $49,999 | 2,303 (96.4%) | 87 (3.6%) |
| $50,000 to $74,999 | 2,956 (84.1%) | 560 (15.9%) |
| $75,000 to $99,999 | 1,991 (92.6%) | 159 (7.4%) |
| $100,000 and over | 5,104 (97.9%) | 112 (2.1%) |
Public vs Private Health Insurance Coverage by Age in Crawford County
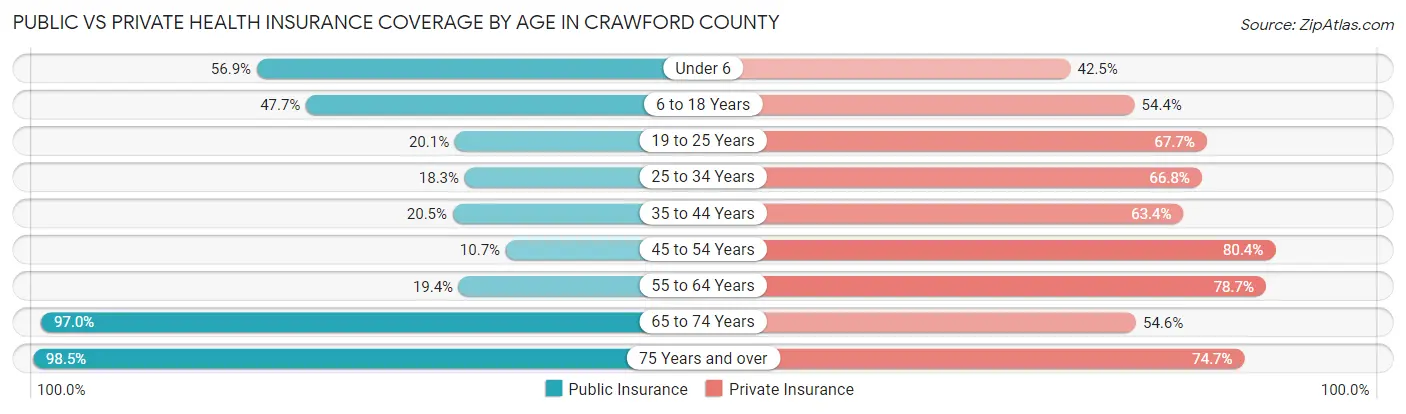
| Age Bracket | Public Insurance | Private Insurance |
| Under 6 | 699 (56.9%) | 522 (42.5%) |
| 6 to 18 Years | 1,526 (47.7%) | 1,738 (54.4%) |
| 19 to 25 Years | 324 (20.1%) | 1,091 (67.7%) |
| 25 to 34 Years | 300 (18.3%) | 1,096 (66.8%) |
| 35 to 44 Years | 396 (20.5%) | 1,224 (63.4%) |
| 45 to 54 Years | 183 (10.7%) | 1,380 (80.4%) |
| 55 to 64 Years | 419 (19.4%) | 1,701 (78.7%) |
| 65 to 74 Years | 1,500 (97.0%) | 845 (54.6%) |
| 75 Years and over | 1,207 (98.5%) | 916 (74.7%) |
| Total | 6,554 (40.3%) | 10,513 (64.7%) |
Disability Status by Sex by Age in Crawford County
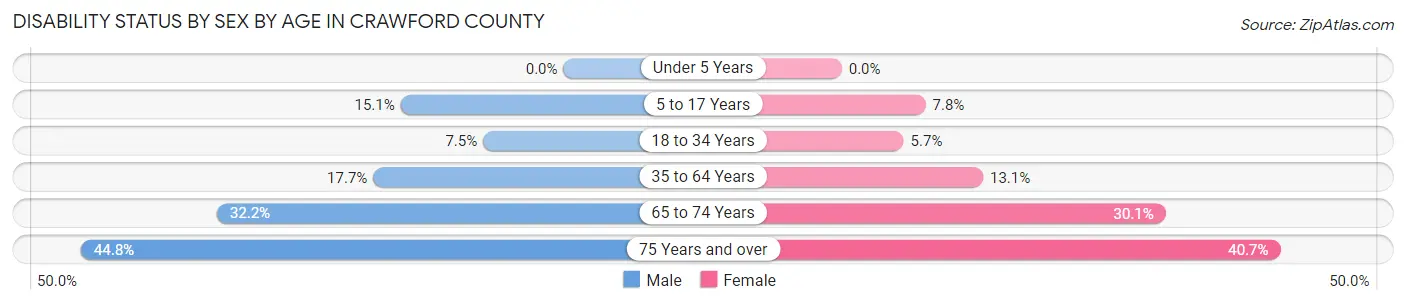
| Age Bracket | Male | Female |
| Under 5 Years | 0 (0.0%) | 0 (0.0%) |
| 5 to 17 Years | 250 (15.1%) | 118 (7.8%) |
| 18 to 34 Years | 139 (7.4%) | 95 (5.7%) |
| 35 to 64 Years | 487 (17.6%) | 400 (13.1%) |
| 65 to 74 Years | 262 (32.2%) | 220 (30.0%) |
| 75 Years and over | 231 (44.8%) | 289 (40.7%) |
Disability Class by Sex by Age in Crawford County
Disability Class: Hearing Difficulty
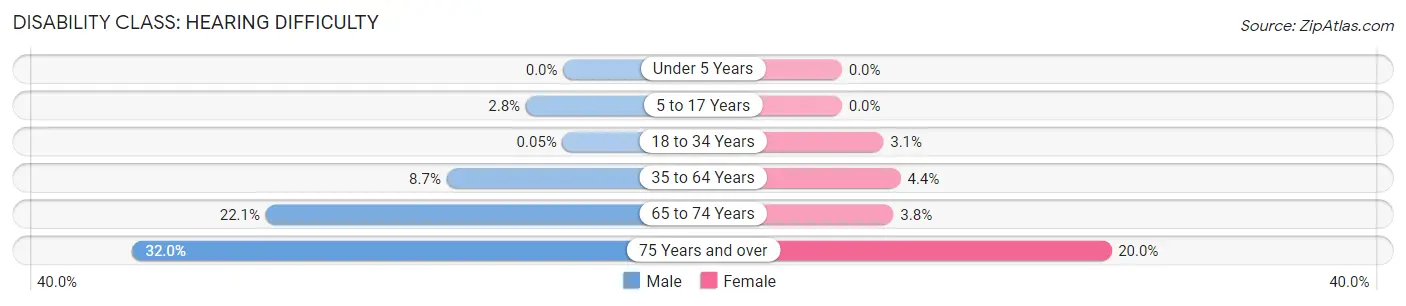
| Age Bracket | Male | Female |
| Under 5 Years | 0 (0.0%) | 0 (0.0%) |
| 5 to 17 Years | 46 (2.8%) | 0 (0.0%) |
| 18 to 34 Years | 1 (0.1%) | 51 (3.1%) |
| 35 to 64 Years | 239 (8.7%) | 133 (4.4%) |
| 65 to 74 Years | 180 (22.1%) | 28 (3.8%) |
| 75 Years and over | 165 (32.0%) | 142 (20.0%) |
Disability Class: Vision Difficulty
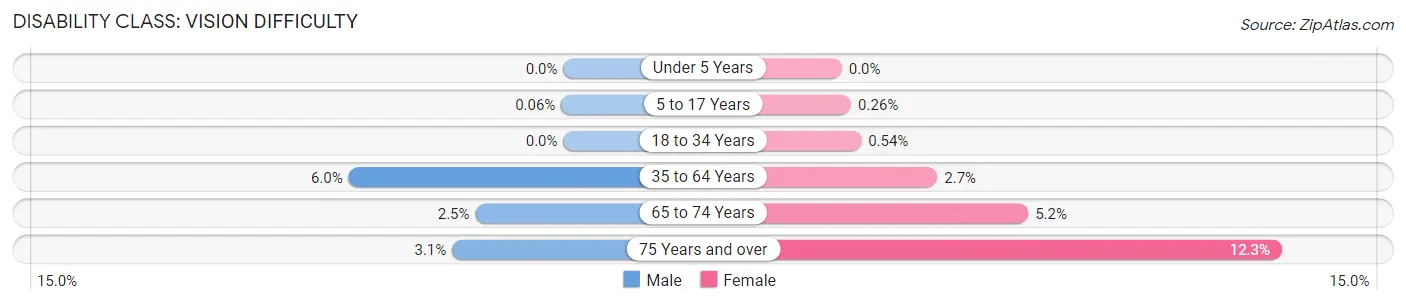
| Age Bracket | Male | Female |
| Under 5 Years | 0 (0.0%) | 0 (0.0%) |
| 5 to 17 Years | 1 (0.1%) | 4 (0.3%) |
| 18 to 34 Years | 0 (0.0%) | 9 (0.5%) |
| 35 to 64 Years | 165 (6.0%) | 81 (2.7%) |
| 65 to 74 Years | 20 (2.5%) | 38 (5.2%) |
| 75 Years and over | 16 (3.1%) | 87 (12.2%) |
Disability Class: Cognitive Difficulty
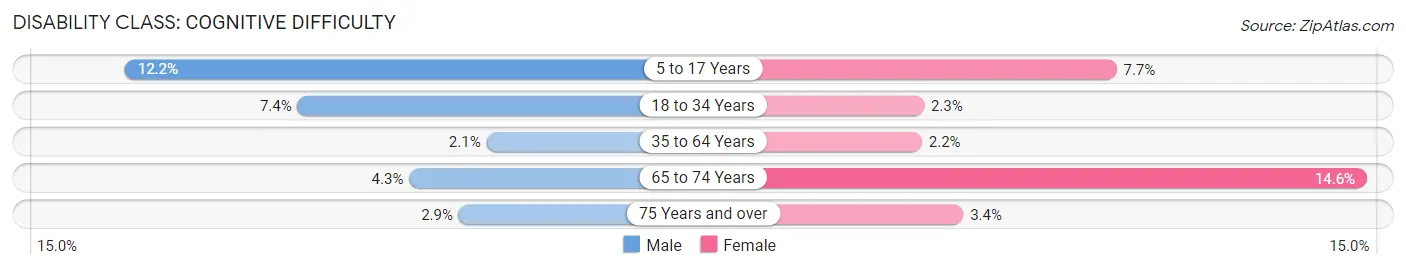
| Age Bracket | Male | Female |
| 5 to 17 Years | 202 (12.2%) | 116 (7.6%) |
| 18 to 34 Years | 138 (7.4%) | 38 (2.3%) |
| 35 to 64 Years | 59 (2.1%) | 68 (2.2%) |
| 65 to 74 Years | 35 (4.3%) | 107 (14.6%) |
| 75 Years and over | 15 (2.9%) | 24 (3.4%) |
Disability Class: Ambulatory Difficulty
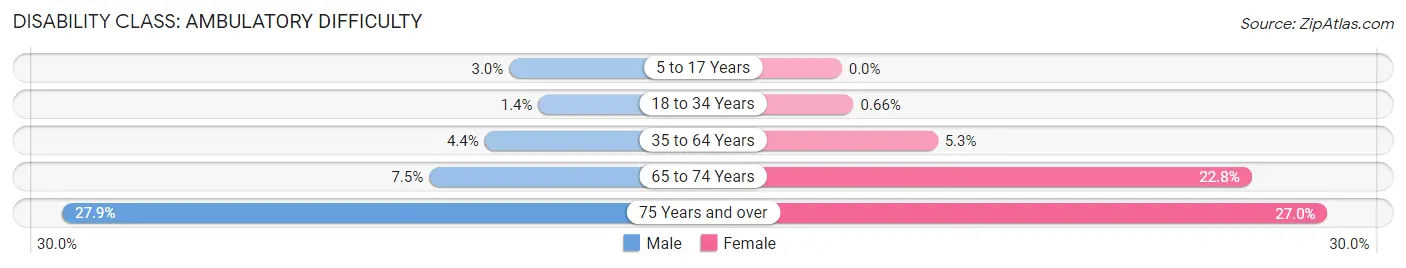
| Age Bracket | Male | Female |
| 5 to 17 Years | 50 (3.0%) | 0 (0.0%) |
| 18 to 34 Years | 26 (1.4%) | 11 (0.7%) |
| 35 to 64 Years | 121 (4.4%) | 163 (5.3%) |
| 65 to 74 Years | 61 (7.5%) | 167 (22.8%) |
| 75 Years and over | 144 (27.9%) | 192 (27.0%) |
Disability Class: Self-Care Difficulty
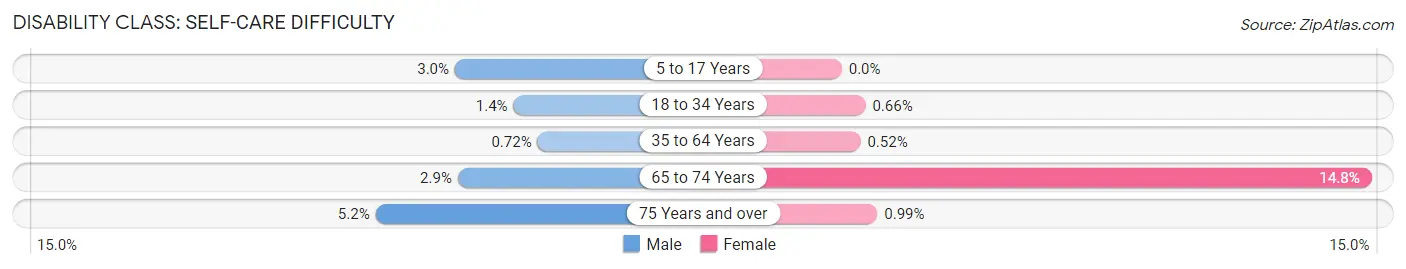
| Age Bracket | Male | Female |
| 5 to 17 Years | 50 (3.0%) | 0 (0.0%) |
| 18 to 34 Years | 26 (1.4%) | 11 (0.7%) |
| 35 to 64 Years | 20 (0.7%) | 16 (0.5%) |
| 65 to 74 Years | 24 (2.9%) | 108 (14.7%) |
| 75 Years and over | 27 (5.2%) | 7 (1.0%) |
Technology Access in Crawford County
Computing Device Access in Crawford County
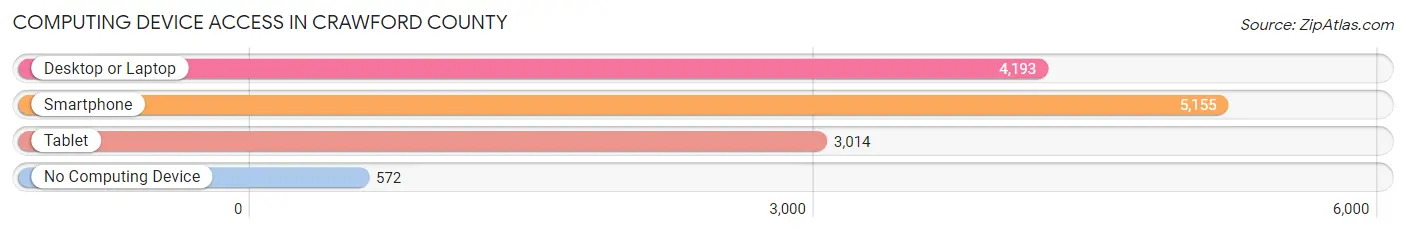
| Device Type | # Households | % Households |
| Desktop or Laptop | 4,193 | 67.5% |
| Smartphone | 5,155 | 83.0% |
| Tablet | 3,014 | 48.5% |
| No Computing Device | 572 | 9.2% |
| Total | 6,214 | 100.0% |
Internet Access in Crawford County
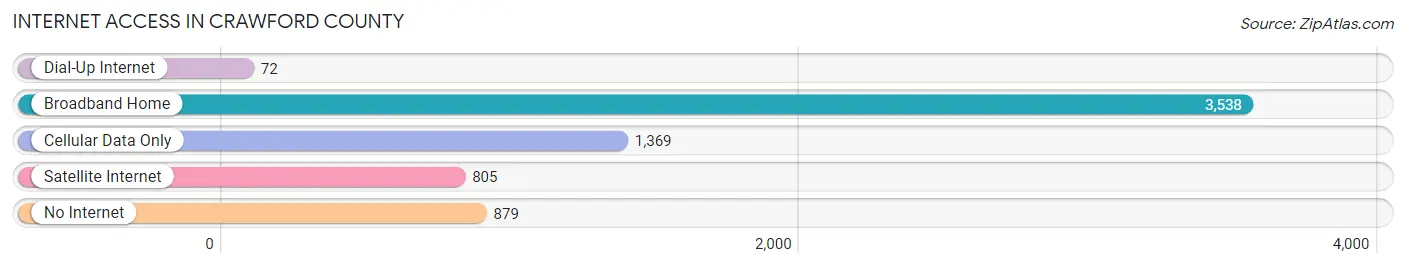
| Internet Type | # Households | % Households |
| Dial-Up Internet | 72 | 1.2% |
| Broadband Home | 3,538 | 56.9% |
| Cellular Data Only | 1,369 | 22.0% |
| Satellite Internet | 805 | 13.0% |
| No Internet | 879 | 14.1% |
| Total | 6,214 | 100.0% |
Crawford County Summary
Crawford County, Iowa is located in the southwestern corner of the state and is bordered by the states of Nebraska and Missouri. It is part of the Sioux City, IA-NE-SD Metropolitan Statistical Area. The county was established in 1851 and named after William H. Crawford, the United States Secretary of War from 1815 to 1817. As of the 2010 census, the population was 17,096.
Geography
Crawford County is located in the Loess Hills region of Iowa. The county is mostly rural, with rolling hills and valleys. The county is drained by the West Nishnabotna River and its tributaries. The highest point in the county is located in the northwest corner, at an elevation of 1,400 feet (427 m). The county has a total area of 576 square miles (1,490 km2), of which 575 square miles (1,490 km2) is land and 0.7 square miles (1.8 km2) (0.1%) is water.
Demographics
As of the 2010 census, there were 17,096 people, 6,845 households, and 4,717 families residing in the county. The population density was 29.7 people per square mile (11.5/km2). There were 7,541 housing units at an average density of 13.1 per square mile (5.1/km2). The racial makeup of the county was 97.2% White, 0.3% Black or African American, 0.3% Native American, 0.3% Asian, 0.2% Pacific Islander, 0.7% from other races, and 1.2% from two or more races. 2.2% of the population were Hispanic or Latino of any race.
There were 6,845 households, out of which 30.2% had children under the age of 18 living with them, 56.2% were married couples living together, 8.2% had a female householder with no husband present, and 31.7% were non-families. 27.2% of all households were made up of individuals, and 13.2% had someone living alone who was 65 years of age or older. The average household size was 2.45 and the average family size was 2.97.
The median income for a household in the county was $41,945, and the median income for a family was $50,945. Males had a median income of $36,945 versus $25,945 for females. The per capita income for the county was $20,945. About 5.2% of families and 8.2% of the population were below the poverty line, including 10.2% of those under age 18 and 8.2% of those age 65 or over.
Economy
Crawford County is largely agricultural, with corn, soybeans, and hay being the primary crops. Livestock production is also important, with cattle, hogs, and sheep being raised in the county. The county is also home to several manufacturing companies, including a large pork processing plant, a cheese factory, and a furniture manufacturer.
The county is served by two major highways, U.S. Route 30 and Iowa Highway 141. The county seat is Denison, which is also the largest city in the county. Other cities in the county include Dow City, Manilla, Schleswig, and Vail.
Crawford County is home to several recreational attractions, including the Crawford County Historical Museum, the Crawford County Fairgrounds, and the Crawford County Conservation Board. The county is also home to several parks, including the Crawford County Park, the Dow City Park, and the Manilla Park.
Conclusion
Crawford County, Iowa is a rural county located in the southwestern corner of the state. It is home to 17,096 people, most of whom are involved in agriculture. The county is served by two major highways and is home to several recreational attractions. The county is also home to several manufacturing companies, which provide jobs and economic stability to the area.
Common Questions
What is the Total Population of Crawford County?
Total Population of Crawford County is 16,450.
What is the Total Male Population of Crawford County?
Total Male Population of Crawford County is 8,167.
What is the Total Female Population of Crawford County?
Total Female Population of Crawford County is 8,283.
What is the Ratio of Males per 100 Females in Crawford County?
There are 98.60 Males per 100 Females in Crawford County.
What is the Ratio of Females per 100 Males in Crawford County?
There are 101.42 Females per 100 Males in Crawford County.
What is the Median Population Age in Crawford County?
Median Population Age in Crawford County is 37.3 Years.
What is the Average Family Size in Crawford County
Average Family Size in Crawford County is 3.0 People.
What is the Average Household Size in Crawford County
Average Household Size in Crawford County is 2.6 People.
What is Per Capita Income in Crawford County?
Per Capita income in Crawford County is $30,781.
What is the Median Family Income in Crawford County?
Median Family Income in Crawford County is $73,892.
What is the Median Household income in Crawford County?
Median Household Income in Crawford County is $61,188.
What is Income or Wage Gap in Crawford County?
Income or Wage Gap in Crawford County is 28.3%.
Women in Crawford County earn 71.7 cents for every dollar earned by a man.
What is Family Income Deficit in Crawford County?
Family Income Deficit in Crawford County is $15,863.
Families that are below poverty line in Crawford County earn $15,863 less on average than the poverty threshold level.
What is Inequality or Gini Index in Crawford County?
Inequality or Gini Index in Crawford County is 0.44.
How Large is the Labor Force in Crawford County?
There are 8,241 People in the Labor Forcein in Crawford County.
What is the Percentage of People in the Labor Force in Crawford County?
63.7% of People are in the Labor Force in Crawford County.
What is the Unemployment Rate in Crawford County?
Unemployment Rate in Crawford County is 4.1%.