Buena Vista County, IA
Buena Vista County Map

Buena Vista County Overview
20,687
TOTAL POPULATION
10,599
MALE POPULATION
10,088
FEMALE POPULATION
105.07
MALES / 100 FEMALES
95.18
FEMALES / 100 MALES
35.6
MEDIAN AGE
3.5
AVG FAMILY SIZE
2.6
AVG HOUSEHOLD SIZE
$31,985
PER CAPITA INCOME
$87,475
AVG FAMILY INCOME
$62,662
AVG HOUSEHOLD INCOME
29.5%
WAGE / INCOME GAP [ % ]
70.5¢/ $1
WAGE / INCOME GAP [ $ ]
0.42
INEQUALITY / GINI INDEX
10,903
LABOR FORCE [ PEOPLE ]
68.3%
PERCENT IN LABOR FORCE
5.0%
UNEMPLOYMENT RATE
Buena Vista County Area Codes
Race in Buena Vista County
The most populous races in Buena Vista County are White / Caucasian (14,160 | 68.4%), Hispanic or Latino (5,573 | 26.9%), and Asian (2,121 | 10.2%).

| Race | # Population | % Population |
| Asian | 2,121 | 10.2% |
| Black / African American | 606 | 2.9% |
| Hawaiian / Pacific | 430 | 2.1% |
| Hispanic or Latino | 5,573 | 26.9% |
| Native / Alaskan | 48 | 0.2% |
| White / Caucasian | 14,160 | 68.4% |
| Two or more Races | 1,531 | 7.4% |
| Some other Race | 1,791 | 8.7% |
| Total | 20,687 | 100.0% |
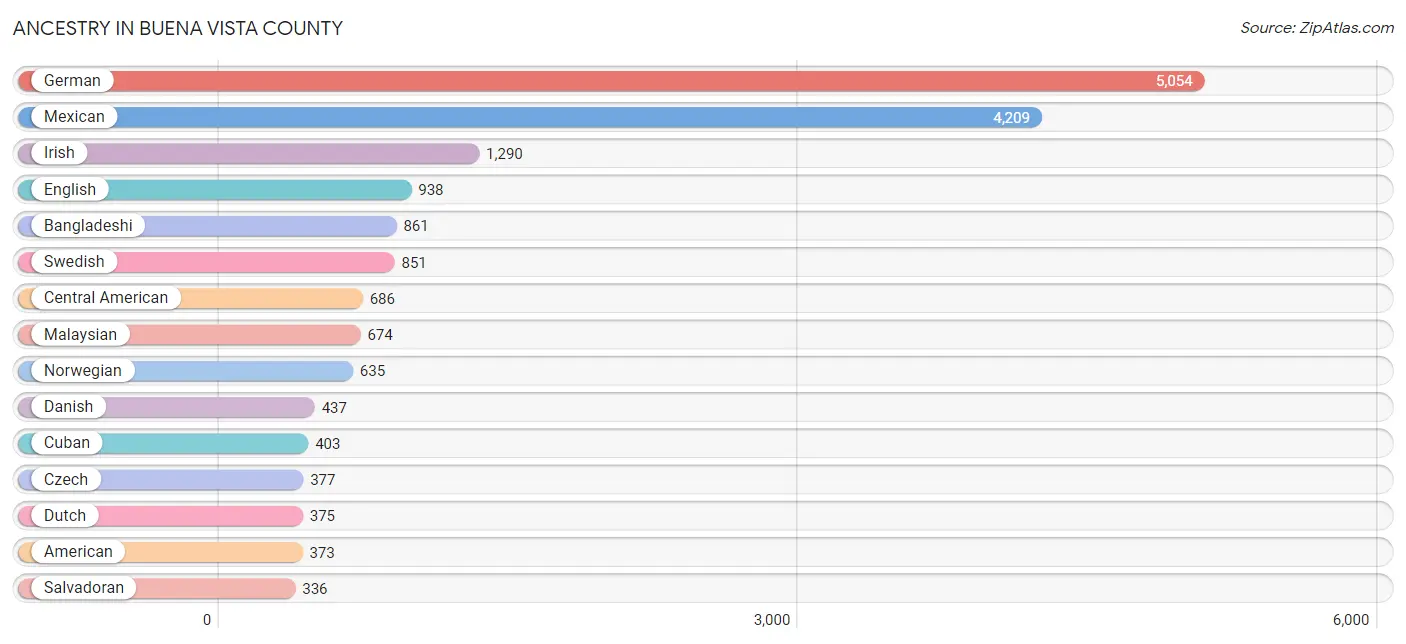
Ancestry in Buena Vista County
The most populous ancestries reported in Buena Vista County are German (5,054 | 24.4%), Mexican (4,209 | 20.3%), Irish (1,290 | 6.2%), English (938 | 4.5%), and Bangladeshi (861 | 4.2%), together accounting for 59.7% of all Buena Vista County residents.
| Ancestry | # Population | % Population |
| African | 75 | 0.4% |
| American | 373 | 1.8% |
| Arab | 6 | 0.0% |
| Austrian | 4 | 0.0% |
| Bangladeshi | 861 | 4.2% |
| Belgian | 8 | 0.0% |
| Bhutanese | 18 | 0.1% |
| British | 19 | 0.1% |
| Burmese | 57 | 0.3% |
| Canadian | 56 | 0.3% |
| Central American | 686 | 3.3% |
| Cherokee | 32 | 0.2% |
| Chickasaw | 7 | 0.0% |
| Colombian | 3 | 0.0% |
| Croatian | 2 | 0.0% |
| Cuban | 403 | 1.9% |
| Czech | 377 | 1.8% |
| Czechoslovakian | 33 | 0.2% |
| Danish | 437 | 2.1% |
| Dutch | 375 | 1.8% |
| Eastern European | 13 | 0.1% |
| English | 938 | 4.5% |
| Ethiopian | 152 | 0.7% |
| European | 176 | 0.9% |
| French | 189 | 0.9% |
| French Canadian | 39 | 0.2% |
| German | 5,054 | 24.4% |
| Greek | 11 | 0.1% |
| Guatemalan | 306 | 1.5% |
| Haitian | 8 | 0.0% |
| Honduran | 36 | 0.2% |
| Hungarian | 11 | 0.1% |
| Indian (Asian) | 12 | 0.1% |
| Indonesian | 326 | 1.6% |
| Irish | 1,290 | 6.2% |
| Italian | 172 | 0.8% |
| Korean | 44 | 0.2% |
| Latvian | 7 | 0.0% |
| Lebanese | 1 | 0.0% |
| Luxembourger | 22 | 0.1% |
| Malaysian | 674 | 3.3% |
| Mexican | 4,209 | 20.3% |
| Mexican American Indian | 25 | 0.1% |
| Native Hawaiian | 7 | 0.0% |
| Norwegian | 635 | 3.1% |
| Pakistani | 37 | 0.2% |
| Panamanian | 8 | 0.0% |
| Pennsylvania German | 5 | 0.0% |
| Polish | 81 | 0.4% |
| Portuguese | 8 | 0.0% |
| Puerto Rican | 20 | 0.1% |
| Russian | 62 | 0.3% |
| Salvadoran | 336 | 1.6% |
| Scandinavian | 84 | 0.4% |
| Scotch-Irish | 57 | 0.3% |
| Scottish | 198 | 1.0% |
| Sioux | 18 | 0.1% |
| Slovak | 2 | 0.0% |
| South American | 16 | 0.1% |
| Spaniard | 7 | 0.0% |
| Spanish | 196 | 0.9% |
| Sri Lankan | 200 | 1.0% |
| Subsaharan African | 287 | 1.4% |
| Sudanese | 58 | 0.3% |
| Swedish | 851 | 4.1% |
| Swiss | 43 | 0.2% |
| Syrian | 5 | 0.0% |
| Thai | 3 | 0.0% |
| Ukrainian | 37 | 0.2% |
| Venezuelan | 13 | 0.1% |
| Welsh | 96 | 0.5% | View All 71 Rows |
Immigrants in Buena Vista County
The most numerous immigrant groups reported in Buena Vista County came from Latin America (2,454 | 11.9%), Central America (2,055 | 9.9%), Mexico (1,667 | 8.1%), Asia (1,317 | 6.4%), and South Eastern Asia (1,190 | 5.8%), together accounting for 42.0% of all Buena Vista County residents.

| Immigration Origin | # Population | % Population |
| Africa | 383 | 1.8% |
| Asia | 1,317 | 6.4% |
| Bangladesh | 3 | 0.0% |
| Cambodia | 55 | 0.3% |
| Canada | 43 | 0.2% |
| Caribbean | 377 | 1.8% |
| Central America | 2,055 | 9.9% |
| Colombia | 9 | 0.0% |
| Cuba | 369 | 1.8% |
| Denmark | 5 | 0.0% |
| Eastern Africa | 334 | 1.6% |
| Eastern Asia | 123 | 0.6% |
| Eastern Europe | 24 | 0.1% |
| El Salvador | 186 | 0.9% |
| England | 1 | 0.0% |
| Ethiopia | 221 | 1.1% |
| Europe | 33 | 0.2% |
| Guatemala | 193 | 0.9% |
| Haiti | 8 | 0.0% |
| Honduras | 7 | 0.0% |
| Ireland | 3 | 0.0% |
| Japan | 7 | 0.0% |
| Kenya | 63 | 0.3% |
| Korea | 116 | 0.6% |
| Laos | 386 | 1.9% |
| Latin America | 2,454 | 11.9% |
| Mexico | 1,667 | 8.1% |
| Micronesia | 116 | 0.6% |
| North Macedonia | 11 | 0.1% |
| Northern Africa | 49 | 0.2% |
| Northern Europe | 9 | 0.0% |
| Oceania | 117 | 0.6% |
| Panama | 2 | 0.0% |
| Philippines | 6 | 0.0% |
| Russia | 13 | 0.1% |
| South America | 22 | 0.1% |
| South Central Asia | 3 | 0.0% |
| South Eastern Asia | 1,190 | 5.8% |
| Sudan | 49 | 0.2% |
| Thailand | 311 | 1.5% |
| Venezuela | 13 | 0.1% |
| Vietnam | 200 | 1.0% |
| Western Asia | 1 | 0.0% | View All 43 Rows |
Sex and Age in Buena Vista County
Sex and Age in Buena Vista County
The most populous age groups in Buena Vista County are 5 to 9 Years (916 | 8.6%) for men and 15 to 19 Years (909 | 9.0%) for women.

| Age Bracket | Male | Female |
| Under 5 Years | 879 (8.3%) | 559 (5.5%) |
| 5 to 9 Years | 916 (8.6%) | 696 (6.9%) |
| 10 to 14 Years | 624 (5.9%) | 723 (7.2%) |
| 15 to 19 Years | 870 (8.2%) | 909 (9.0%) |
| 20 to 24 Years | 759 (7.2%) | 697 (6.9%) |
| 25 to 29 Years | 669 (6.3%) | 643 (6.4%) |
| 30 to 34 Years | 671 (6.3%) | 512 (5.1%) |
| 35 to 39 Years | 664 (6.3%) | 769 (7.6%) |
| 40 to 44 Years | 514 (4.9%) | 445 (4.4%) |
| 45 to 49 Years | 671 (6.3%) | 573 (5.7%) |
| 50 to 54 Years | 548 (5.2%) | 484 (4.8%) |
| 55 to 59 Years | 714 (6.7%) | 677 (6.7%) |
| 60 to 64 Years | 605 (5.7%) | 521 (5.2%) |
| 65 to 69 Years | 515 (4.9%) | 586 (5.8%) |
| 70 to 74 Years | 411 (3.9%) | 411 (4.1%) |
| 75 to 79 Years | 237 (2.2%) | 368 (3.6%) |
| 80 to 84 Years | 127 (1.2%) | 115 (1.1%) |
| 85 Years and over | 205 (1.9%) | 400 (4.0%) |
| Total | 10,599 (100.0%) | 10,088 (100.0%) |
Families and Households in Buena Vista County
Median Family Size in Buena Vista County
The median family size in Buena Vista County is 3.47 persons per family, with single male/father families (219 | 4.9%) accounting for the largest median family size of 3.82 persons per family. On the other hand, single female/mother families (667 | 14.9%) represent the smallest median family size with 3.26 persons per family.

| Family Type | # Families | Family Size |
| Married-Couple | 3,602 (80.3%) | 3.49 |
| Single Male/Father | 219 (4.9%) | 3.82 |
| Single Female/Mother | 667 (14.9%) | 3.26 |
| Total Families | 4,488 (100.0%) | 3.47 |
Median Household Size in Buena Vista County
The median household size in Buena Vista County is 2.61 persons per household, with single male/father households (219 | 2.9%) accounting for the largest median household size of 4.44 persons per household. non-family households (3,050 | 40.5%) represent the smallest median household size with 1.20 persons per household.

| Household Type | # Households | Household Size |
| Married-Couple | 3,602 (47.8%) | 3.54 |
| Single Male/Father | 219 (2.9%) | 4.44 |
| Single Female/Mother | 667 (8.8%) | 3.43 |
| Non-family | 3,050 (40.5%) | 1.20 |
| Total Households | 7,538 (100.0%) | 2.61 |
Household Size by Marriage Status in Buena Vista County
Out of a total of 7,538 households in Buena Vista County, 4,488 (59.5%) are family households, while 3,050 (40.5%) are nonfamily households. The most numerous type of family households are 2-person households, comprising 1,968, and the most common type of nonfamily households are 1-person households, comprising 2,345.

| Household Size | Family Households | Nonfamily Households |
| 1-Person Households | - | 2,345 (31.1%) |
| 2-Person Households | 1,968 (26.1%) | 691 (9.2%) |
| 3-Person Households | 695 (9.2%) | 0 (0.0%) |
| 4-Person Households | 864 (11.5%) | 14 (0.2%) |
| 5-Person Households | 585 (7.8%) | 0 (0.0%) |
| 6-Person Households | 101 (1.3%) | 0 (0.0%) |
| 7+ Person Households | 275 (3.6%) | 0 (0.0%) |
| Total | 4,488 (59.5%) | 3,050 (40.5%) |
Female Fertility in Buena Vista County
Fertility by Age in Buena Vista County
Average fertility rate in Buena Vista County is 89.0 births per 1,000 women. Women in the age bracket of 20 to 34 years have the highest fertility rate with 181.0 births per 1,000 women. Women in the age bracket of 20 to 34 years acount for 79.2% of all women with births.

| Age Bracket | Women with Births | Births / 1,000 Women |
| 15 to 19 years | 19 (4.5%) | 21.0 |
| 20 to 34 years | 336 (79.2%) | 181.0 |
| 35 to 50 years | 69 (16.3%) | 35.0 |
| Total | 424 (100.0%) | 89.0 |
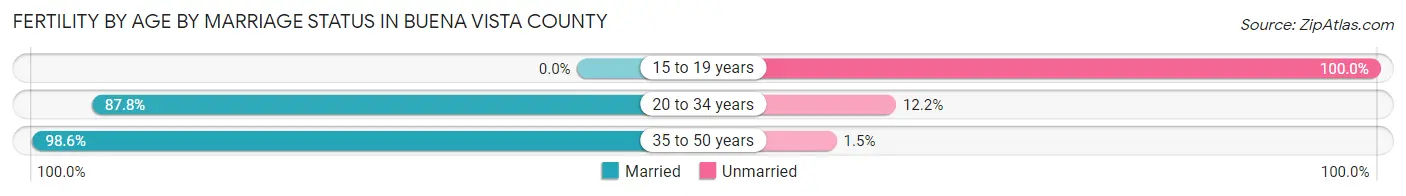
Fertility by Age by Marriage Status in Buena Vista County
85.6% of women with births (424) in Buena Vista County are married. The highest percentage of unmarried women with births falls into 15 to 19 years age bracket with 100.0% of them unmarried at the time of birth, while the lowest percentage of unmarried women with births belong to 35 to 50 years age bracket with 1.4% of them unmarried.
| Age Bracket | Married | Unmarried |
| 15 to 19 years | 0 (0.0%) | 19 (100.0%) |
| 20 to 34 years | 295 (87.8%) | 41 (12.2%) |
| 35 to 50 years | 68 (98.6%) | 1 (1.5%) |
| Total | 363 (85.6%) | 61 (14.4%) |
Fertility by Education in Buena Vista County
Average fertility rate in Buena Vista County is 89.0 births per 1,000 women. Women with the education attainment of bachelor's degree have the highest fertility rate of 176.0 births per 1,000 women, while women with the education attainment of graduate degree have the lowest fertility at 24.0 births per 1,000 women. Women with the education attainment of college or associate's degree represent 38.0% of all women with births.

| Educational Attainment | Women with Births | Births / 1,000 Women |
| Less than High School | 62 (14.6%) | 46.0 |
| High School Diploma | 88 (20.7%) | 79.0 |
| College or Associate's Degree | 161 (38.0%) | 110.0 |
| Bachelor's Degree | 108 (25.5%) | 176.0 |
| Graduate Degree | 5 (1.2%) | 24.0 |
| Total | 424 (100.0%) | 89.0 |
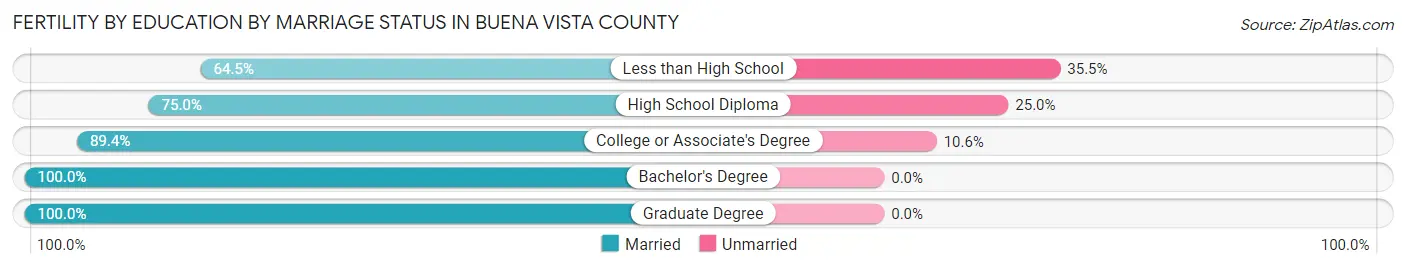
Fertility by Education by Marriage Status in Buena Vista County
14.4% of women with births in Buena Vista County are unmarried. Women with the educational attainment of bachelor's degree are most likely to be married with 100.0% of them married at childbirth, while women with the educational attainment of less than high school are least likely to be married with 35.5% of them unmarried at childbirth.
| Educational Attainment | Married | Unmarried |
| Less than High School | 40 (64.5%) | 22 (35.5%) |
| High School Diploma | 66 (75.0%) | 22 (25.0%) |
| College or Associate's Degree | 144 (89.4%) | 17 (10.6%) |
| Bachelor's Degree | 108 (100.0%) | 0 (0.0%) |
| Graduate Degree | 5 (100.0%) | 0 (0.0%) |
| Total | 363 (85.6%) | 61 (14.4%) |
Income in Buena Vista County
Income Overview in Buena Vista County
Per Capita Income in Buena Vista County is $31,985, while median incomes of families and households are $87,475 and $62,662 respectively.
| Characteristic | Number | Measure |
| Per Capita Income | 20,687 | $31,985 |
| Median Family Income | 4,488 | $87,475 |
| Mean Family Income | 4,488 | $104,006 |
| Median Household Income | 7,538 | $62,662 |
| Mean Household Income | 7,538 | $85,747 |
| Income Deficit | 4,488 | $0 |
| Wage / Income Gap (%) | 20,687 | 29.52% |
| Wage / Income Gap ($) | 20,687 | 70.48¢ per $1 |
| Gini / Inequality Index | 20,687 | 0.42 |
Earnings by Sex in Buena Vista County
Average Earnings in Buena Vista County are $36,555, $44,539 for men and $31,392 for women, a difference of 29.5%.

| Sex | Number | Average Earnings |
| Male | 6,187 (53.4%) | $44,539 |
| Female | 5,389 (46.6%) | $31,392 |
| Total | 11,576 (100.0%) | $36,555 |
Earnings by Sex by Income Bracket in Buena Vista County
The most common earnings brackets in Buena Vista County are $55,000 to $64,999 for men (631 | 10.2%) and $30,000 to $34,999 for women (492 | 9.1%).

| Income | Male | Female |
| $2,499 or less | 265 (4.3%) | 365 (6.8%) |
| $2,500 to $4,999 | 316 (5.1%) | 284 (5.3%) |
| $5,000 to $7,499 | 227 (3.7%) | 209 (3.9%) |
| $7,500 to $9,999 | 99 (1.6%) | 172 (3.2%) |
| $10,000 to $12,499 | 136 (2.2%) | 150 (2.8%) |
| $12,500 to $14,999 | 138 (2.2%) | 145 (2.7%) |
| $15,000 to $17,499 | 57 (0.9%) | 212 (3.9%) |
| $17,500 to $19,999 | 40 (0.6%) | 232 (4.3%) |
| $20,000 to $22,499 | 104 (1.7%) | 161 (3.0%) |
| $22,500 to $24,999 | 418 (6.8%) | 157 (2.9%) |
| $25,000 to $29,999 | 452 (7.3%) | 480 (8.9%) |
| $30,000 to $34,999 | 235 (3.8%) | 492 (9.1%) |
| $35,000 to $39,999 | 254 (4.1%) | 320 (5.9%) |
| $40,000 to $44,999 | 396 (6.4%) | 485 (9.0%) |
| $45,000 to $49,999 | 427 (6.9%) | 208 (3.9%) |
| $50,000 to $54,999 | 464 (7.5%) | 379 (7.0%) |
| $55,000 to $64,999 | 631 (10.2%) | 394 (7.3%) |
| $65,000 to $74,999 | 419 (6.8%) | 166 (3.1%) |
| $75,000 to $99,999 | 518 (8.4%) | 292 (5.4%) |
| $100,000+ | 591 (9.6%) | 86 (1.6%) |
| Total | 6,187 (100.0%) | 5,389 (100.0%) |
Earnings by Sex by Educational Attainment in Buena Vista County
Average earnings in Buena Vista County are $47,384 for men and $35,595 for women, a difference of 24.9%. Men with an educational attainment of graduate degree enjoy the highest average annual earnings of $79,911, while those with less than high school education earn the least with $40,375. Women with an educational attainment of graduate degree earn the most with the average annual earnings of $65,051, while those with high school diploma education have the smallest earnings of $28,750.

| Educational Attainment | Male Income | Female Income |
| Less than High School | $40,375 | $34,898 |
| High School Diploma | $44,583 | $28,750 |
| College or Associate's Degree | $51,850 | $34,527 |
| Bachelor's Degree | $66,481 | $49,279 |
| Graduate Degree | $79,911 | $65,051 |
| Total | $47,384 | $35,595 |
Family Income in Buena Vista County
Family Income Brackets in Buena Vista County
According to the Buena Vista County family income data, there are 978 families falling into the $100,000 to $149,999 income range, which is the most common income bracket and makes up 21.8% of all families. Conversely, the $10,000 to $14,999 income bracket is the least frequent group with only 22 families (0.5%) belonging to this category.

| Income Bracket | # Families | % Families |
| Less than $10,000 | 54 | 1.2% |
| $10,000 to $14,999 | 22 | 0.5% |
| $15,000 to $24,999 | 108 | 2.4% |
| $25,000 to $34,999 | 224 | 5.0% |
| $35,000 to $49,999 | 570 | 12.7% |
| $50,000 to $74,999 | 880 | 19.6% |
| $75,000 to $99,999 | 821 | 18.3% |
| $100,000 to $149,999 | 978 | 21.8% |
| $150,000 to $199,999 | 498 | 11.1% |
| $200,000+ | 337 | 7.5% |
Family Income by Famaliy Size in Buena Vista County
6-person families (133 | 3.0%) account for the highest median family income in Buena Vista County with $124,750 per family, while 2-person families (2,036 | 45.4%) have the highest median income of $42,052 per family member.

| Income Bracket | # Families | Median Income |
| 2-Person Families | 2,036 (45.4%) | $84,104 |
| 3-Person Families | 806 (18.0%) | $86,071 |
| 4-Person Families | 757 (16.9%) | $119,732 |
| 5-Person Families | 544 (12.1%) | $88,269 |
| 6-Person Families | 133 (3.0%) | $124,750 |
| 7+ Person Families | 212 (4.7%) | $54,963 |
| Total | 4,488 (100.0%) | $87,475 |
Family Income by Number of Earners in Buena Vista County
The median family income in Buena Vista County is $87,475, with families comprising 3+ earners (680) having the highest median family income of $124,400, while families with 1 earner (1,142) have the lowest median family income of $54,158, accounting for 15.1% and 25.5% of families, respectively.

| Number of Earners | # Families | Median Income |
| No Earners | 506 (11.3%) | $57,500 |
| 1 Earner | 1,142 (25.5%) | $54,158 |
| 2 Earners | 2,160 (48.1%) | $96,048 |
| 3+ Earners | 680 (15.1%) | $124,400 |
| Total | 4,488 (100.0%) | $87,475 |
Household Income in Buena Vista County
Household Income Brackets in Buena Vista County
With 1,704 households falling in the category, the $50,000 to $74,999 income range is the most frequent in Buena Vista County, accounting for 22.6% of all households. In contrast, only 143 households (1.9%) fall into the less than $10,000 income bracket, making it the least populous group.

| Income Bracket | # Households | % Households |
| Less than $10,000 | 143 | 1.9% |
| $10,000 to $14,999 | 181 | 2.4% |
| $15,000 to $24,999 | 580 | 7.7% |
| $25,000 to $34,999 | 603 | 8.0% |
| $35,000 to $49,999 | 1,183 | 15.7% |
| $50,000 to $74,999 | 1,704 | 22.6% |
| $75,000 to $99,999 | 1,033 | 13.7% |
| $100,000 to $149,999 | 1,146 | 15.2% |
| $150,000 to $199,999 | 580 | 7.7% |
| $200,000+ | 384 | 5.1% |
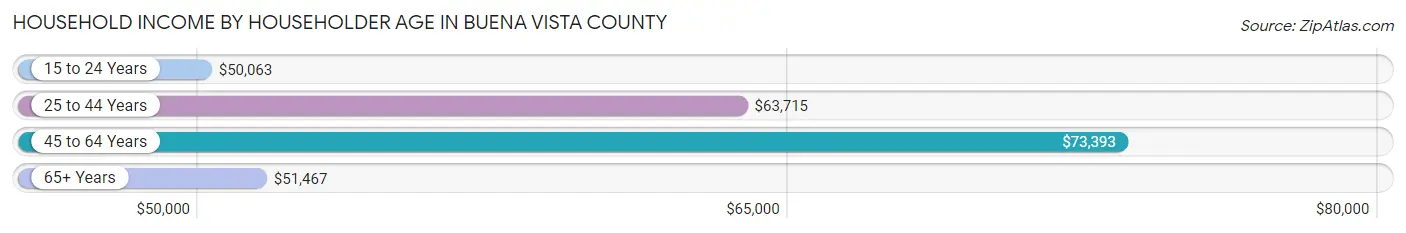
Household Income by Householder Age in Buena Vista County
The median household income in Buena Vista County is $62,662, with the highest median household income of $73,393 found in the 45 to 64 years age bracket for the primary householder. A total of 2,563 households (34.0%) fall into this category. Meanwhile, the 15 to 24 years age bracket for the primary householder has the lowest median household income of $50,063, with 405 households (5.4%) in this group.
| Income Bracket | # Households | Median Income |
| 15 to 24 Years | 405 (5.4%) | $50,063 |
| 25 to 44 Years | 2,567 (34.1%) | $63,715 |
| 45 to 64 Years | 2,563 (34.0%) | $73,393 |
| 65+ Years | 2,003 (26.6%) | $51,467 |
| Total | 7,538 (100.0%) | $62,662 |
Poverty in Buena Vista County
Income Below Poverty by Sex and Age in Buena Vista County
With 6.8% poverty level for males and 7.4% for females among the residents of Buena Vista County, 18 to 24 year old males and 65 to 74 year old females are the most vulnerable to poverty, with 164 males (21.8%) and 154 females (15.5%) in their respective age groups living below the poverty level.

| Age Bracket | Male | Female |
| Under 5 Years | 40 (4.6%) | 41 (7.3%) |
| 5 Years | 17 (11.3%) | 0 (0.0%) |
| 6 to 11 Years | 73 (7.7%) | 41 (4.5%) |
| 12 to 14 Years | 17 (4.2%) | 51 (12.7%) |
| 15 Years | 36 (20.8%) | 0 (0.0%) |
| 16 and 17 Years | 21 (5.7%) | 5 (1.5%) |
| 18 to 24 Years | 164 (21.8%) | 77 (9.8%) |
| 25 to 34 Years | 29 (2.2%) | 108 (9.3%) |
| 35 to 44 Years | 100 (8.5%) | 95 (7.8%) |
| 45 to 54 Years | 83 (6.8%) | 36 (3.4%) |
| 55 to 64 Years | 20 (1.6%) | 43 (3.6%) |
| 65 to 74 Years | 37 (4.1%) | 154 (15.5%) |
| 75 Years and over | 46 (8.8%) | 57 (7.5%) |
| Total | 683 (6.8%) | 708 (7.4%) |
Income Above Poverty by Sex and Age in Buena Vista County
According to the poverty statistics in Buena Vista County, males aged 55 to 64 years and females aged 5 years are the age groups that are most secure financially, with 98.4% of males and 100.0% of females in these age groups living above the poverty line.

| Age Bracket | Male | Female |
| Under 5 Years | 836 (95.4%) | 518 (92.7%) |
| 5 Years | 133 (88.7%) | 87 (100.0%) |
| 6 to 11 Years | 875 (92.3%) | 869 (95.5%) |
| 12 to 14 Years | 384 (95.8%) | 350 (87.3%) |
| 15 Years | 137 (79.2%) | 151 (100.0%) |
| 16 and 17 Years | 350 (94.3%) | 329 (98.5%) |
| 18 to 24 Years | 589 (78.2%) | 706 (90.2%) |
| 25 to 34 Years | 1,275 (97.8%) | 1,047 (90.6%) |
| 35 to 44 Years | 1,076 (91.5%) | 1,119 (92.2%) |
| 45 to 54 Years | 1,131 (93.2%) | 1,015 (96.6%) |
| 55 to 64 Years | 1,252 (98.4%) | 1,143 (96.4%) |
| 65 to 74 Years | 875 (95.9%) | 838 (84.5%) |
| 75 Years and over | 475 (91.2%) | 707 (92.5%) |
| Total | 9,388 (93.2%) | 8,879 (92.6%) |
Income Below Poverty Among Married-Couple Families in Buena Vista County
The poverty statistics for married-couple families in Buena Vista County show that 2.9% or 105 of the total 3,602 families live below the poverty line. Families with 3 or 4 children have the highest poverty rate of 4.4%, comprising of 20 families. On the other hand, families with no children have the lowest poverty rate of 2.7%, which includes 53 families.

| Children | Above Poverty | Below Poverty |
| No Children | 1,931 (97.3%) | 53 (2.7%) |
| 1 or 2 Children | 1,071 (97.3%) | 30 (2.7%) |
| 3 or 4 Children | 430 (95.6%) | 20 (4.4%) |
| 5 or more Children | 65 (97.0%) | 2 (3.0%) |
| Total | 3,497 (97.1%) | 105 (2.9%) |
Income Below Poverty Among Single-Parent Households in Buena Vista County
According to the poverty data in Buena Vista County, 2.3% or 5 single-father households and 12.9% or 86 single-mother households are living below the poverty line. Among single-father households, those with 3 or 4 children have the highest poverty rate, with 4 households (28.6%) experiencing poverty. Likewise, among single-mother households, those with 5 or more children have the highest poverty rate, with 2 households (100.0%) falling below the poverty line.

| Children | Single Father | Single Mother |
| No Children | 0 (0.0%) | 21 (9.4%) |
| 1 or 2 Children | 1 (1.1%) | 36 (10.2%) |
| 3 or 4 Children | 4 (28.6%) | 27 (30.7%) |
| 5 or more Children | 0 (0.0%) | 2 (100.0%) |
| Total | 5 (2.3%) | 86 (12.9%) |
Income Below Poverty Among Married-Couple vs Single-Parent Households in Buena Vista County
The poverty data for Buena Vista County shows that 105 of the married-couple family households (2.9%) and 91 of the single-parent households (10.3%) are living below the poverty level. Within the married-couple family households, those with 3 or 4 children have the highest poverty rate, with 20 households (4.4%) falling below the poverty line. Among the single-parent households, those with 3 or 4 children have the highest poverty rate, with 31 household (30.4%) living below poverty.
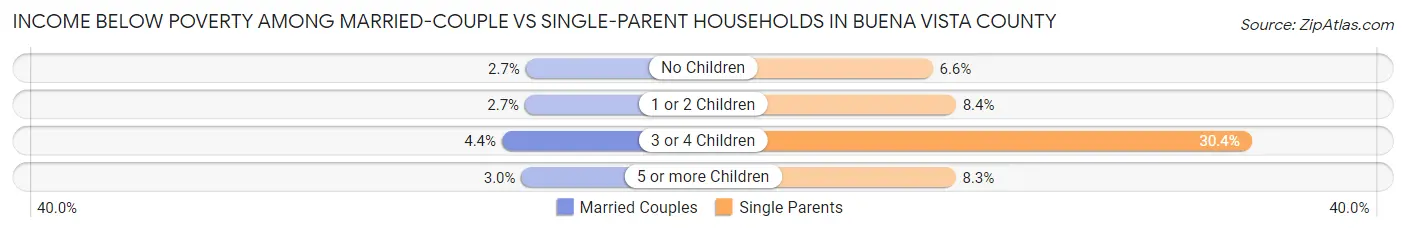
| Children | Married-Couple Families | Single-Parent Households |
| No Children | 53 (2.7%) | 21 (6.6%) |
| 1 or 2 Children | 30 (2.7%) | 37 (8.4%) |
| 3 or 4 Children | 20 (4.4%) | 31 (30.4%) |
| 5 or more Children | 2 (3.0%) | 2 (8.3%) |
| Total | 105 (2.9%) | 91 (10.3%) |
Employment Characteristics in Buena Vista County
Employment by Class of Employer in Buena Vista County
Among the 10,171 employed individuals in Buena Vista County, private company employees (7,246 | 71.2%), local government employees (770 | 7.6%), and not-for-profit organizations (729 | 7.2%) make up the most common classes of employment.

| Employer Class | # Employees | % Employees |
| Private Company Employees | 7,246 | 71.2% |
| Self-Employed (Incorporated) | 333 | 3.3% |
| Self-Employed (Not Incorporated) | 700 | 6.9% |
| Not-for-profit Organizations | 729 | 7.2% |
| Local Government Employees | 770 | 7.6% |
| State Government Employees | 286 | 2.8% |
| Federal Government Employees | 79 | 0.8% |
| Unpaid Family Workers | 28 | 0.3% |
| Total | 10,171 | 100.0% |
Employment Status by Age in Buena Vista County
According to the labor force statistics for Buena Vista County, out of the total population over 16 years of age (15,963), 68.3% or 10,903 individuals are in the labor force, with 5.0% or 545 of them unemployed. The age group with the highest labor force participation rate is 45 to 54 years, with 91.3% or 2,078 individuals in the labor force. Within the labor force, the 45 to 54 years age range has the highest percentage of unemployed individuals, with 10.2% or 212 of them being unemployed.

| Age Bracket | In Labor Force | Unemployed |
| 16 to 19 Years | 607 (41.8%) | 45 (7.4%) |
| 20 to 24 Years | 1,184 (81.3%) | 81 (6.8%) |
| 25 to 29 Years | 1,160 (88.4%) | 32 (2.8%) |
| 30 to 34 Years | 1,019 (86.1%) | 42 (4.1%) |
| 35 to 44 Years | 2,048 (85.6%) | 82 (4.0%) |
| 45 to 54 Years | 2,078 (91.3%) | 212 (10.2%) |
| 55 to 59 Years | 1,212 (87.1%) | 27 (2.2%) |
| 60 to 64 Years | 883 (78.4%) | 16 (1.8%) |
| 65 to 74 Years | 617 (32.1%) | 9 (1.5%) |
| 75 Years and over | 99 (6.8%) | 0 (0.0%) |
| Total | 10,903 (68.3%) | 545 (5.0%) |
Employment Status by Educational Attainment in Buena Vista County
According to labor force statistics for Buena Vista County, 86.8% of individuals (8,402) out of the total population between 25 and 64 years of age (9,680) are in the labor force, with 4.9% or 412 of them being unemployed. The group with the highest labor force participation rate are those with the educational attainment of bachelor's degree or higher, with 91.5% or 1,776 individuals in the labor force. Within the labor force, individuals with high school diploma education have the highest percentage of unemployment, with 8.2% or 200 of them being unemployed.

| Educational Attainment | In Labor Force | Unemployed |
| Less than High School | 1,844 (84.2%) | 166 (7.6%) |
| High School Diploma | 2,439 (83.9%) | 238 (8.2%) |
| College / Associate Degree | 2,341 (88.6%) | 69 (2.6%) |
| Bachelor's Degree or higher | 1,776 (91.5%) | 12 (0.6%) |
| Total | 8,402 (86.8%) | 474 (4.9%) |
Employment Occupations by Sex in Buena Vista County
Management, Business, Science and Arts Occupations
The most common Management, Business, Science and Arts occupations in Buena Vista County are Community & Social Service (930 | 9.0%), Management (851 | 8.2%), Education Instruction & Library (693 | 6.7%), Health Diagnosing & Treating (441 | 4.3%), and Health Technologists (284 | 2.7%).

Management, Business, Science and Arts Occupations by Sex
Within the Management, Business, Science and Arts occupations in Buena Vista County, the most male-oriented occupations are Computers & Mathematics (95.2%), Architecture & Engineering (85.6%), and Computers, Engineering & Science (82.7%), while the most female-oriented occupations are Education Instruction & Library (79.9%), Education, Arts & Media (75.3%), and Community & Social Service (73.4%).

| Occupation | Male | Female |
| Management | 590 (69.3%) | 261 (30.7%) |
| Business & Financial | 106 (59.9%) | 71 (40.1%) |
| Computers, Engineering & Science | 139 (82.7%) | 29 (17.3%) |
| Computers & Mathematics | 40 (95.2%) | 2 (4.8%) |
| Architecture & Engineering | 77 (85.6%) | 13 (14.4%) |
| Life, Physical & Social Science | 22 (61.1%) | 14 (38.9%) |
| Community & Social Service | 247 (26.6%) | 683 (73.4%) |
| Education, Arts & Media | 18 (24.7%) | 55 (75.3%) |
| Legal Services & Support | 53 (63.1%) | 31 (36.9%) |
| Education Instruction & Library | 139 (20.1%) | 554 (79.9%) |
| Arts, Media & Entertainment | 37 (46.3%) | 43 (53.7%) |
| Health Diagnosing & Treating | 128 (29.0%) | 313 (71.0%) |
| Health Technologists | 103 (36.3%) | 181 (63.7%) |
| Total (Category) | 1,210 (47.1%) | 1,357 (52.9%) |
| Total (Overall) | 5,484 (52.9%) | 4,877 (47.1%) |
Services Occupations
The most common Services occupations in Buena Vista County are Food Preparation & Serving (338 | 3.3%), Cleaning & Maintenance (318 | 3.1%), Personal Care & Service (235 | 2.3%), Healthcare Support (208 | 2.0%), and Security & Protection (167 | 1.6%).

Services Occupations by Sex
Within the Services occupations in Buena Vista County, the most male-oriented occupations are Cleaning & Maintenance (67.9%), Firefighting & Prevention (53.5%), and Security & Protection (44.3%), while the most female-oriented occupations are Healthcare Support (98.1%), Personal Care & Service (95.7%), and Law Enforcement (69.7%).

| Occupation | Male | Female |
| Healthcare Support | 4 (1.9%) | 204 (98.1%) |
| Security & Protection | 74 (44.3%) | 93 (55.7%) |
| Firefighting & Prevention | 54 (53.5%) | 47 (46.5%) |
| Law Enforcement | 20 (30.3%) | 46 (69.7%) |
| Food Preparation & Serving | 110 (32.5%) | 228 (67.5%) |
| Cleaning & Maintenance | 216 (67.9%) | 102 (32.1%) |
| Personal Care & Service | 10 (4.3%) | 225 (95.7%) |
| Total (Category) | 414 (32.7%) | 852 (67.3%) |
| Total (Overall) | 5,484 (52.9%) | 4,877 (47.1%) |
Sales and Office Occupations
The most common Sales and Office occupations in Buena Vista County are Sales & Related (945 | 9.1%), and Office & Administration (859 | 8.3%).

Sales and Office Occupations by Sex
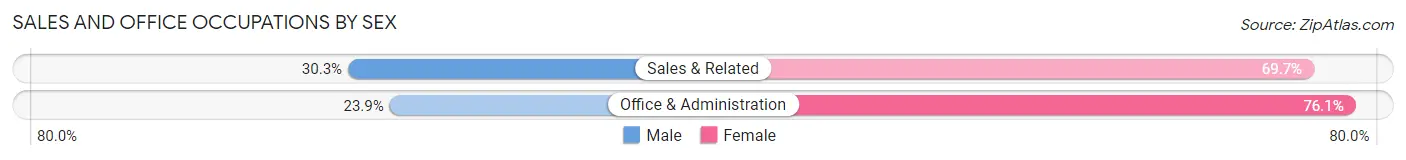
| Occupation | Male | Female |
| Sales & Related | 286 (30.3%) | 659 (69.7%) |
| Office & Administration | 205 (23.9%) | 654 (76.1%) |
| Total (Category) | 491 (27.2%) | 1,313 (72.8%) |
| Total (Overall) | 5,484 (52.9%) | 4,877 (47.1%) |
Natural Resources, Construction and Maintenance Occupations
The most common Natural Resources, Construction and Maintenance occupations in Buena Vista County are Construction & Extraction (448 | 4.3%), Installation, Maintenance & Repair (368 | 3.5%), and Farming, Fishing & Forestry (232 | 2.2%).

Natural Resources, Construction and Maintenance Occupations by Sex

| Occupation | Male | Female |
| Farming, Fishing & Forestry | 214 (92.2%) | 18 (7.8%) |
| Construction & Extraction | 426 (95.1%) | 22 (4.9%) |
| Installation, Maintenance & Repair | 355 (96.5%) | 13 (3.5%) |
| Total (Category) | 995 (94.9%) | 53 (5.1%) |
| Total (Overall) | 5,484 (52.9%) | 4,877 (47.1%) |
Production, Transportation and Moving Occupations
The most common Production, Transportation and Moving occupations in Buena Vista County are Production (2,499 | 24.1%), Material Moving (765 | 7.4%), and Transportation (412 | 4.0%).

Production, Transportation and Moving Occupations by Sex

| Occupation | Male | Female |
| Production | 1,518 (60.7%) | 981 (39.3%) |
| Transportation | 351 (85.2%) | 61 (14.8%) |
| Material Moving | 505 (66.0%) | 260 (34.0%) |
| Total (Category) | 2,374 (64.6%) | 1,302 (35.4%) |
| Total (Overall) | 5,484 (52.9%) | 4,877 (47.1%) |
Employment Industries by Sex in Buena Vista County
Employment Industries in Buena Vista County
The major employment industries in Buena Vista County include Manufacturing (3,302 | 31.9%), Retail Trade (1,396 | 13.5%), Educational Services (1,182 | 11.4%), Health Care & Social Assistance (897 | 8.7%), and Agriculture, Fishing & Hunting (585 | 5.7%).

Employment Industries by Sex in Buena Vista County
The Buena Vista County industries that see more men than women are Mining, Quarrying, & Extraction (100.0%), Utilities (100.0%), and Construction (91.9%), whereas the industries that tend to have a higher number of women are Health Care & Social Assistance (78.5%), Finance & Insurance (77.7%), and Information (76.2%).

| Industry | Male | Female |
| Agriculture, Fishing & Hunting | 517 (88.4%) | 68 (11.6%) |
| Mining, Quarrying, & Extraction | 17 (100.0%) | 0 (0.0%) |
| Construction | 537 (91.9%) | 47 (8.1%) |
| Manufacturing | 2,080 (63.0%) | 1,222 (37.0%) |
| Wholesale Trade | 156 (75.4%) | 51 (24.6%) |
| Retail Trade | 510 (36.5%) | 886 (63.5%) |
| Transportation & Warehousing | 221 (80.1%) | 55 (19.9%) |
| Utilities | 72 (100.0%) | 0 (0.0%) |
| Information | 10 (23.8%) | 32 (76.2%) |
| Finance & Insurance | 69 (22.3%) | 241 (77.7%) |
| Real Estate, Rental & Leasing | 20 (31.8%) | 43 (68.2%) |
| Professional & Scientific | 156 (51.1%) | 149 (48.8%) |
| Enterprise Management | 0 (0.0%) | 0 (0.0%) |
| Administrative & Support | 135 (82.3%) | 29 (17.7%) |
| Educational Services | 363 (30.7%) | 819 (69.3%) |
| Health Care & Social Assistance | 193 (21.5%) | 704 (78.5%) |
| Arts, Entertainment & Recreation | 32 (42.7%) | 43 (57.3%) |
| Accommodation & Food Services | 144 (46.6%) | 165 (53.4%) |
| Public Administration | 97 (47.5%) | 107 (52.4%) |
| Total | 5,484 (52.9%) | 4,877 (47.1%) |
Education in Buena Vista County
School Enrollment in Buena Vista County
The most common levels of schooling among the 5,575 students in Buena Vista County are high school (1,299 | 23.3%), elementary school (1,213 | 21.8%), and college / undergraduate (1,186 | 21.3%).

| School Level | # Students | % Students |
| Nursery / Preschool | 406 | 7.3% |
| Kindergarten | 374 | 6.7% |
| Elementary School | 1,213 | 21.8% |
| Middle School | 1,004 | 18.0% |
| High School | 1,299 | 23.3% |
| College / Undergraduate | 1,186 | 21.3% |
| Graduate / Professional | 93 | 1.7% |
| Total | 5,575 | 100.0% |
School Enrollment by Age by Funding Source in Buena Vista County
Out of a total of 5,575 students who are enrolled in schools in Buena Vista County, 859 (15.4%) attend a private institution, while the remaining 4,716 (84.6%) are enrolled in public schools. The age group of 20 to 24 year olds has the highest likelihood of being enrolled in private schools, with 352 (52.1% in the age bracket) enrolled. Conversely, the age group of 15 to 17 year olds has the lowest likelihood of being enrolled in a private school, with 996 (98.6% in the age bracket) attending a public institution.

| Age Bracket | Public School | Private School |
| 3 to 4 Year Olds | 310 (94.2%) | 19 (5.8%) |
| 5 to 9 Year Old | 1,385 (90.4%) | 147 (9.6%) |
| 10 to 14 Year Olds | 1,206 (95.4%) | 58 (4.6%) |
| 15 to 17 Year Olds | 996 (98.6%) | 14 (1.4%) |
| 18 to 19 Year Olds | 328 (62.1%) | 200 (37.9%) |
| 20 to 24 Year Olds | 323 (47.8%) | 352 (52.1%) |
| 25 to 34 Year Olds | 97 (69.3%) | 43 (30.7%) |
| 35 Years and over | 69 (71.1%) | 28 (28.9%) |
| Total | 4,716 (84.6%) | 859 (15.4%) |
Educational Attainment by Field of Study in Buena Vista County
Education (856 | 27.3%), business (483 | 15.4%), bio, nature & agricultural (383 | 12.2%), arts & humanities (259 | 8.3%), and science & technology (243 | 7.7%) are the most common fields of study among 3,135 individuals in Buena Vista County who have obtained a bachelor's degree or higher.

| Field of Study | # Graduates | % Graduates |
| Computers & Mathematics | 31 | 1.0% |
| Bio, Nature & Agricultural | 383 | 12.2% |
| Physical & Health Sciences | 27 | 0.9% |
| Psychology | 120 | 3.8% |
| Social Sciences | 154 | 4.9% |
| Engineering | 55 | 1.8% |
| Multidisciplinary Studies | 3 | 0.1% |
| Science & Technology | 243 | 7.7% |
| Business | 483 | 15.4% |
| Education | 856 | 27.3% |
| Literature & Languages | 135 | 4.3% |
| Liberal Arts & History | 206 | 6.6% |
| Visual & Performing Arts | 97 | 3.1% |
| Communications | 83 | 2.6% |
| Arts & Humanities | 259 | 8.3% |
| Total | 3,135 | 100.0% |
Transportation & Commute in Buena Vista County
Vehicle Availability by Sex in Buena Vista County
The most prevalent vehicle ownership categories in Buena Vista County are males with 2 vehicles (2,083, accounting for 39.4%) and females with 2 vehicles (1,541, making up 45.8%).

| Vehicles Available | Male | Female |
| No Vehicle | 180 (3.4%) | 103 (2.3%) |
| 1 Vehicle | 708 (13.4%) | 873 (19.2%) |
| 2 Vehicles | 2,083 (39.4%) | 1,541 (33.9%) |
| 3 Vehicles | 1,562 (29.6%) | 1,393 (30.6%) |
| 4 Vehicles | 350 (6.6%) | 362 (8.0%) |
| 5 or more Vehicles | 400 (7.6%) | 273 (6.0%) |
| Total | 5,283 (100.0%) | 4,545 (100.0%) |
Commute Time in Buena Vista County
The most frequently occuring commute durations in Buena Vista County are 5 to 9 minutes (2,886 commuters, 30.2%), 10 to 14 minutes (2,108 commuters, 22.1%), and less than 5 minutes (1,250 commuters, 13.1%).

| Commute Time | # Commuters | % Commuters |
| Less than 5 Minutes | 1,250 | 13.1% |
| 5 to 9 Minutes | 2,886 | 30.2% |
| 10 to 14 Minutes | 2,108 | 22.1% |
| 15 to 19 Minutes | 857 | 9.0% |
| 20 to 24 Minutes | 808 | 8.5% |
| 25 to 29 Minutes | 350 | 3.7% |
| 30 to 34 Minutes | 465 | 4.9% |
| 35 to 39 Minutes | 223 | 2.3% |
| 40 to 44 Minutes | 128 | 1.3% |
| 45 to 59 Minutes | 186 | 1.9% |
| 60 to 89 Minutes | 169 | 1.8% |
| 90 or more Minutes | 130 | 1.4% |
Commute Time by Sex in Buena Vista County
The most common commute times in Buena Vista County are 5 to 9 minutes (1,556 commuters, 30.9%) for males and 5 to 9 minutes (1,330 commuters, 29.3%) for females.

| Commute Time | Male | Female |
| Less than 5 Minutes | 669 (13.3%) | 581 (12.8%) |
| 5 to 9 Minutes | 1,556 (30.9%) | 1,330 (29.3%) |
| 10 to 14 Minutes | 891 (17.7%) | 1,217 (26.9%) |
| 15 to 19 Minutes | 401 (8.0%) | 456 (10.1%) |
| 20 to 24 Minutes | 456 (9.1%) | 352 (7.8%) |
| 25 to 29 Minutes | 253 (5.0%) | 97 (2.1%) |
| 30 to 34 Minutes | 286 (5.7%) | 179 (4.0%) |
| 35 to 39 Minutes | 116 (2.3%) | 107 (2.4%) |
| 40 to 44 Minutes | 102 (2.0%) | 26 (0.6%) |
| 45 to 59 Minutes | 108 (2.1%) | 78 (1.7%) |
| 60 to 89 Minutes | 129 (2.6%) | 40 (0.9%) |
| 90 or more Minutes | 61 (1.2%) | 69 (1.5%) |
Time of Departure to Work by Sex in Buena Vista County
The most frequent times of departure to work in Buena Vista County are 7:30 AM to 7:59 AM (731, 14.5%) for males and 7:30 AM to 7:59 AM (889, 19.6%) for females.
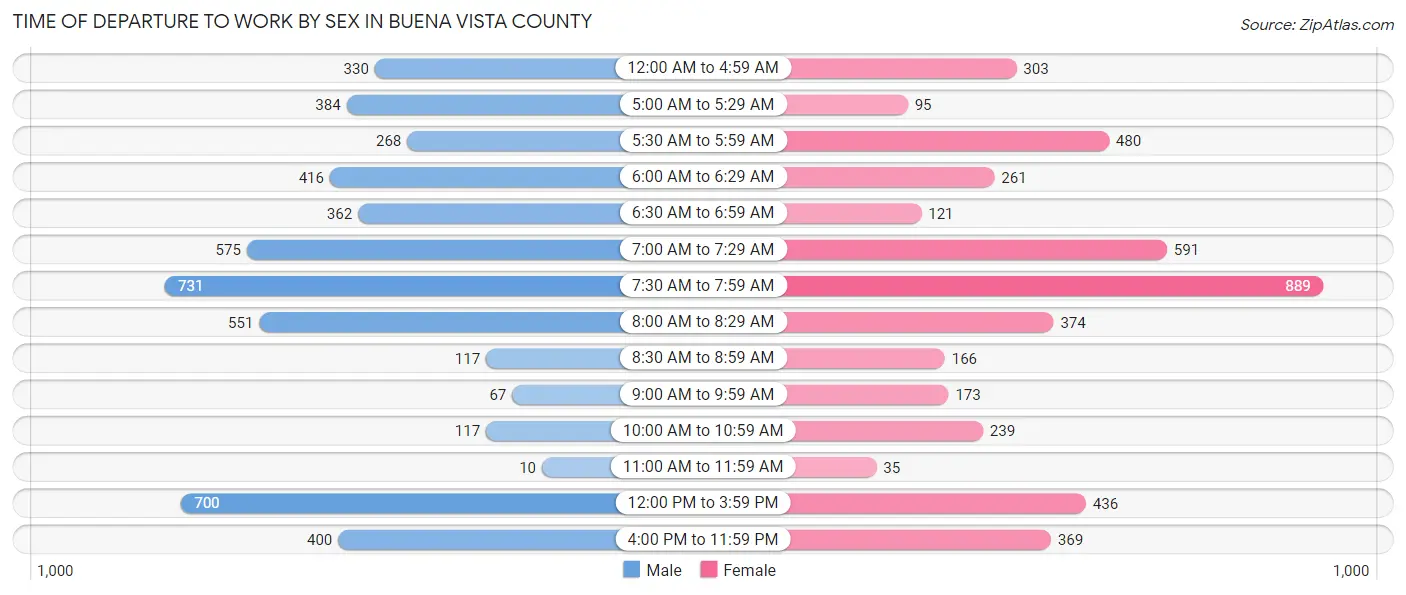
| Time of Departure | Male | Female |
| 12:00 AM to 4:59 AM | 330 (6.6%) | 303 (6.7%) |
| 5:00 AM to 5:29 AM | 384 (7.6%) | 95 (2.1%) |
| 5:30 AM to 5:59 AM | 268 (5.3%) | 480 (10.6%) |
| 6:00 AM to 6:29 AM | 416 (8.3%) | 261 (5.8%) |
| 6:30 AM to 6:59 AM | 362 (7.2%) | 121 (2.7%) |
| 7:00 AM to 7:29 AM | 575 (11.4%) | 591 (13.0%) |
| 7:30 AM to 7:59 AM | 731 (14.5%) | 889 (19.6%) |
| 8:00 AM to 8:29 AM | 551 (11.0%) | 374 (8.3%) |
| 8:30 AM to 8:59 AM | 117 (2.3%) | 166 (3.7%) |
| 9:00 AM to 9:59 AM | 67 (1.3%) | 173 (3.8%) |
| 10:00 AM to 10:59 AM | 117 (2.3%) | 239 (5.3%) |
| 11:00 AM to 11:59 AM | 10 (0.2%) | 35 (0.8%) |
| 12:00 PM to 3:59 PM | 700 (13.9%) | 436 (9.6%) |
| 4:00 PM to 11:59 PM | 400 (8.0%) | 369 (8.1%) |
| Total | 5,028 (100.0%) | 4,532 (100.0%) |
Housing Occupancy in Buena Vista County
Occupancy by Ownership in Buena Vista County
Of the total 7,538 dwellings in Buena Vista County, owner-occupied units account for 5,280 (70.1%), while renter-occupied units make up 2,258 (29.9%).
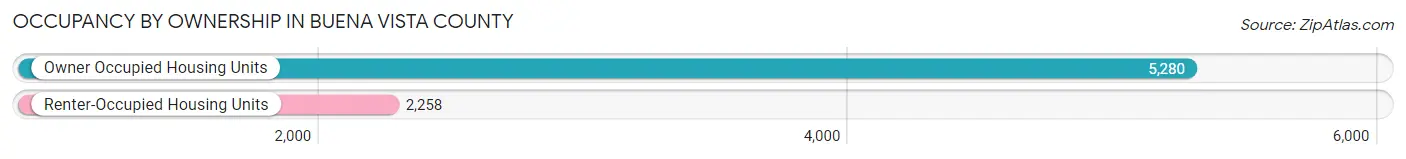
| Occupancy | # Housing Units | % Housing Units |
| Owner Occupied Housing Units | 5,280 | 70.1% |
| Renter-Occupied Housing Units | 2,258 | 29.9% |
| Total Occupied Housing Units | 7,538 | 100.0% |
Occupancy by Household Size in Buena Vista County

| Household Size | # Housing Units | % Housing Units |
| 1-Person Household | 2,345 | 31.1% |
| 2-Person Household | 2,659 | 35.3% |
| 3-Person Household | 695 | 9.2% |
| 4+ Person Household | 1,839 | 24.4% |
| Total Housing Units | 7,538 | 100.0% |
Occupancy by Ownership by Household Size in Buena Vista County

| Household Size | Owner-occupied | Renter-occupied |
| 1-Person Household | 1,180 (50.3%) | 1,165 (49.7%) |
| 2-Person Household | 2,065 (77.7%) | 594 (22.3%) |
| 3-Person Household | 495 (71.2%) | 200 (28.8%) |
| 4+ Person Household | 1,540 (83.7%) | 299 (16.3%) |
| Total Housing Units | 5,280 (70.1%) | 2,258 (29.9%) |
Occupancy by Educational Attainment in Buena Vista County

| Household Size | Owner-occupied | Renter-occupied |
| Less than High School | 793 (50.6%) | 773 (49.4%) |
| High School Diploma | 1,303 (61.6%) | 812 (38.4%) |
| College/Associate Degree | 1,693 (80.7%) | 405 (19.3%) |
| Bachelor's Degree or higher | 1,491 (84.8%) | 268 (15.2%) |
Occupancy by Age of Householder in Buena Vista County

| Age Bracket | # Households | % Households |
| Under 35 Years | 1,579 | 20.9% |
| 35 to 44 Years | 1,393 | 18.5% |
| 45 to 54 Years | 1,115 | 14.8% |
| 55 to 64 Years | 1,448 | 19.2% |
| 65 to 74 Years | 1,107 | 14.7% |
| 75 to 84 Years | 550 | 7.3% |
| 85 Years and Over | 346 | 4.6% |
| Total | 7,538 | 100.0% |
Housing Finances in Buena Vista County
Median Income by Occupancy in Buena Vista County

| Occupancy Type | # Households | Median Income |
| Owner-Occupied | 5,280 (70.1%) | $76,801 |
| Renter-Occupied | 2,258 (29.9%) | $48,918 |
| Average | 7,538 (100.0%) | $62,662 |
Occupancy by Householder Income Bracket in Buena Vista County

| Income Bracket | Owner-occupied | Renter-occupied |
| Less than $5,000 | 23 (0.4%) | 73 (3.2%) |
| $5,000 to $9,999 | 50 (0.9%) | 0 (0.0%) |
| $10,000 to $14,999 | 54 (1.0%) | 128 (5.7%) |
| $15,000 to $19,999 | 118 (2.2%) | 161 (7.1%) |
| $20,000 to $24,999 | 148 (2.8%) | 156 (6.9%) |
| $25,000 to $34,999 | 402 (7.6%) | 199 (8.8%) |
| $35,000 to $49,999 | 739 (14.0%) | 441 (19.5%) |
| $50,000 to $74,999 | 1,057 (20.0%) | 650 (28.8%) |
| $75,000 to $99,999 | 767 (14.5%) | 262 (11.6%) |
| $100,000 to $149,999 | 1,014 (19.2%) | 134 (5.9%) |
| $150,000 or more | 908 (17.2%) | 54 (2.4%) |
| Total | 5,280 (100.0%) | 2,258 (100.0%) |
Monthly Housing Cost Tiers in Buena Vista County
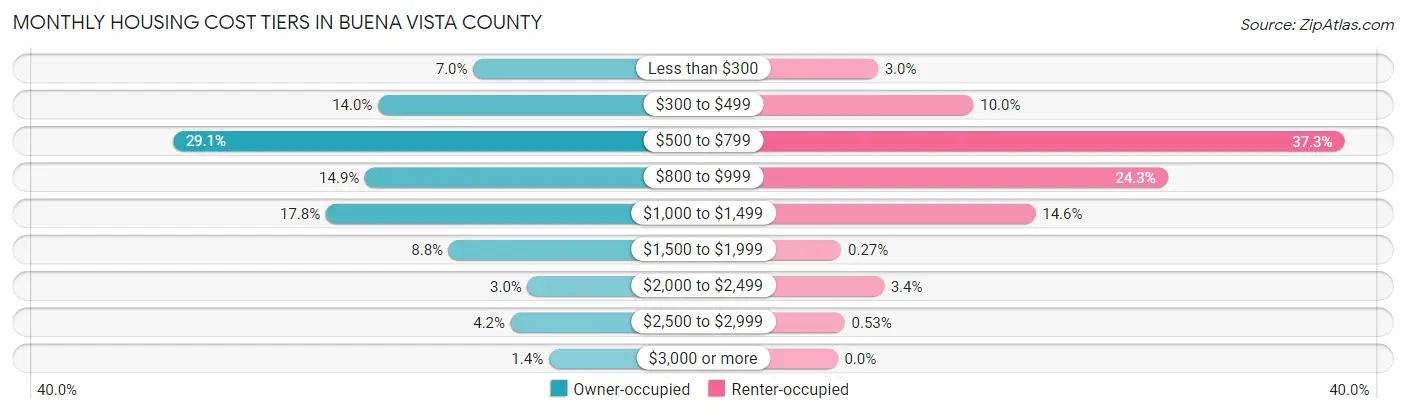
| Monthly Cost | Owner-occupied | Renter-occupied |
| Less than $300 | 367 (7.0%) | 67 (3.0%) |
| $300 to $499 | 737 (14.0%) | 226 (10.0%) |
| $500 to $799 | 1,536 (29.1%) | 843 (37.3%) |
| $800 to $999 | 788 (14.9%) | 549 (24.3%) |
| $1,000 to $1,499 | 940 (17.8%) | 329 (14.6%) |
| $1,500 to $1,999 | 462 (8.7%) | 6 (0.3%) |
| $2,000 to $2,499 | 156 (2.9%) | 77 (3.4%) |
| $2,500 to $2,999 | 221 (4.2%) | 12 (0.5%) |
| $3,000 or more | 73 (1.4%) | 0 (0.0%) |
| Total | 5,280 (100.0%) | 2,258 (100.0%) |
Physical Housing Characteristics in Buena Vista County
Housing Structures in Buena Vista County
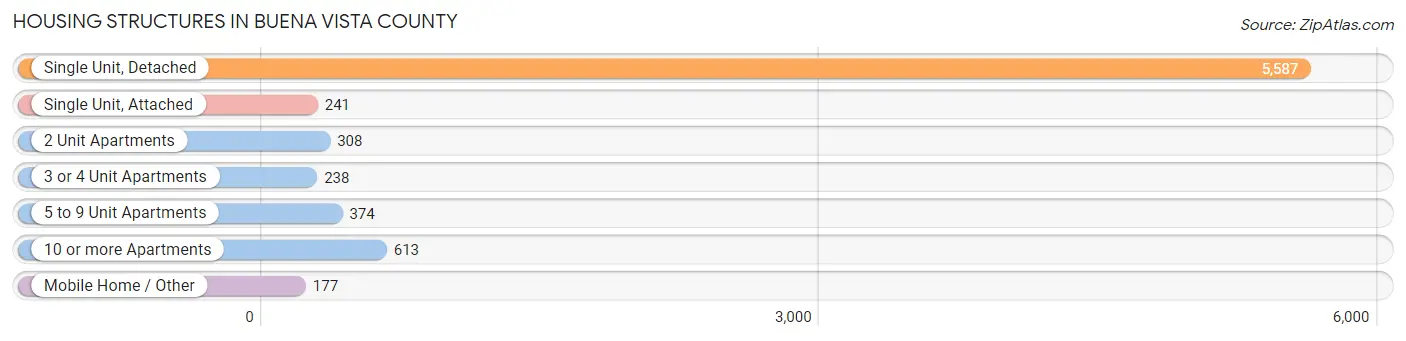
| Structure Type | # Housing Units | % Housing Units |
| Single Unit, Detached | 5,587 | 74.1% |
| Single Unit, Attached | 241 | 3.2% |
| 2 Unit Apartments | 308 | 4.1% |
| 3 or 4 Unit Apartments | 238 | 3.2% |
| 5 to 9 Unit Apartments | 374 | 5.0% |
| 10 or more Apartments | 613 | 8.1% |
| Mobile Home / Other | 177 | 2.4% |
| Total | 7,538 | 100.0% |
Housing Structures by Occupancy in Buena Vista County

| Structure Type | Owner-occupied | Renter-occupied |
| Single Unit, Detached | 4,797 (85.9%) | 790 (14.1%) |
| Single Unit, Attached | 133 (55.2%) | 108 (44.8%) |
| 2 Unit Apartments | 201 (65.3%) | 107 (34.7%) |
| 3 or 4 Unit Apartments | 3 (1.3%) | 235 (98.7%) |
| 5 to 9 Unit Apartments | 37 (9.9%) | 337 (90.1%) |
| 10 or more Apartments | 16 (2.6%) | 597 (97.4%) |
| Mobile Home / Other | 93 (52.5%) | 84 (47.5%) |
| Total | 5,280 (70.1%) | 2,258 (29.9%) |
Housing Structures by Number of Rooms in Buena Vista County

| Number of Rooms | Owner-occupied | Renter-occupied |
| 1 Room | 34 (0.6%) | 202 (8.9%) |
| 2 or 3 Rooms | 225 (4.3%) | 814 (36.0%) |
| 4 or 5 Rooms | 1,409 (26.7%) | 849 (37.6%) |
| 6 or 7 Rooms | 1,658 (31.4%) | 235 (10.4%) |
| 8 or more Rooms | 1,954 (37.0%) | 158 (7.0%) |
| Total | 5,280 (100.0%) | 2,258 (100.0%) |
Housing Structure by Heating Type in Buena Vista County

| Heating Type | Owner-occupied | Renter-occupied |
| Utility Gas | 3,362 (63.7%) | 808 (35.8%) |
| Bottled, Tank, or LP Gas | 738 (14.0%) | 187 (8.3%) |
| Electricity | 1,114 (21.1%) | 1,235 (54.7%) |
| Fuel Oil or Kerosene | 17 (0.3%) | 12 (0.5%) |
| Coal or Coke | 0 (0.0%) | 0 (0.0%) |
| All other Fuels | 44 (0.8%) | 7 (0.3%) |
| No Fuel Used | 5 (0.1%) | 9 (0.4%) |
| Total | 5,280 (100.0%) | 2,258 (100.0%) |
Household Vehicle Usage in Buena Vista County

| Vehicles per Household | Owner-occupied | Renter-occupied |
| No Vehicle | 45 (0.9%) | 276 (12.2%) |
| 1 Vehicle | 1,155 (21.9%) | 1,069 (47.3%) |
| 2 Vehicles | 1,908 (36.1%) | 750 (33.2%) |
| 3 or more Vehicles | 2,172 (41.1%) | 163 (7.2%) |
| Total | 5,280 (100.0%) | 2,258 (100.0%) |
Real Estate & Mortgages in Buena Vista County
Real Estate and Mortgage Overview in Buena Vista County
| Characteristic | Without Mortgage | With Mortgage |
| Housing Units | 2,612 | 2,668 |
| Median Property Value | $126,400 | $144,200 |
| Median Household Income | $56,688 | $562 |
| Monthly Housing Costs | $537 | $66 |
| Real Estate Taxes | $1,628 | $14 |
Property Value by Mortgage Status in Buena Vista County

| Property Value | Without Mortgage | With Mortgage |
| Less than $50,000 | 338 (12.9%) | 73 (2.7%) |
| $50,000 to $99,999 | 617 (23.6%) | 476 (17.8%) |
| $100,000 to $299,999 | 1,411 (54.0%) | 1,689 (63.3%) |
| $300,000 to $499,999 | 121 (4.6%) | 310 (11.6%) |
| $500,000 to $749,999 | 49 (1.9%) | 61 (2.3%) |
| $750,000 to $999,999 | 71 (2.7%) | 55 (2.1%) |
| $1,000,000 or more | 5 (0.2%) | 4 (0.2%) |
| Total | 2,612 (100.0%) | 2,668 (100.0%) |
Household Income by Mortgage Status in Buena Vista County
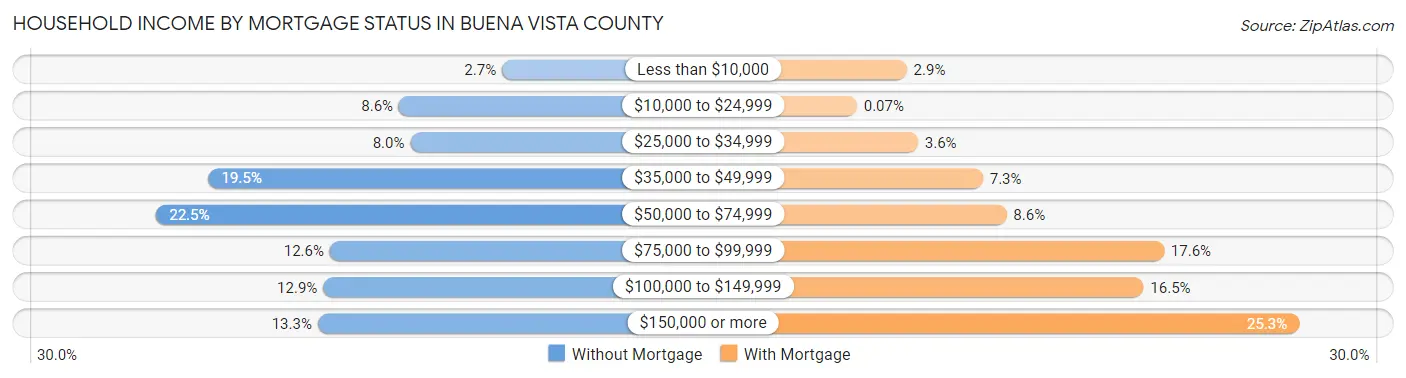
| Household Income | Without Mortgage | With Mortgage |
| Less than $10,000 | 71 (2.7%) | 78 (2.9%) |
| $10,000 to $24,999 | 225 (8.6%) | 2 (0.1%) |
| $25,000 to $34,999 | 208 (8.0%) | 95 (3.6%) |
| $35,000 to $49,999 | 509 (19.5%) | 194 (7.3%) |
| $50,000 to $74,999 | 587 (22.5%) | 230 (8.6%) |
| $75,000 to $99,999 | 328 (12.6%) | 470 (17.6%) |
| $100,000 to $149,999 | 338 (12.9%) | 439 (16.5%) |
| $150,000 or more | 346 (13.3%) | 676 (25.3%) |
| Total | 2,612 (100.0%) | 2,668 (100.0%) |
Property Value to Household Income Ratio in Buena Vista County
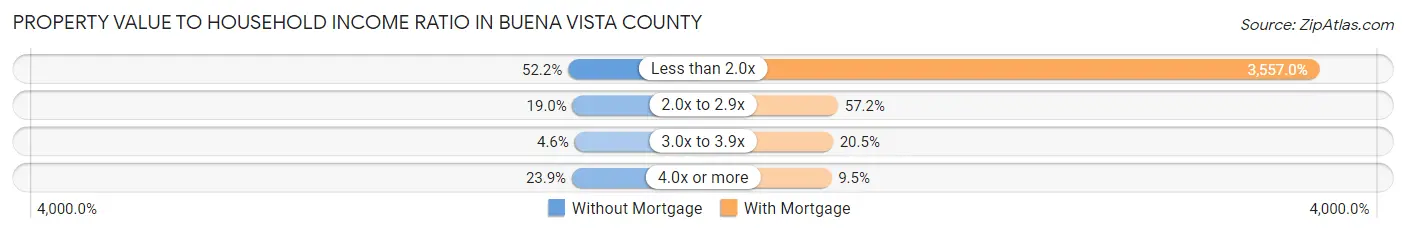
| Value-to-Income Ratio | Without Mortgage | With Mortgage |
| Less than 2.0x | 1,363 (52.2%) | 94,900 (3,557.0%) |
| 2.0x to 2.9x | 495 (19.0%) | 1,526 (57.2%) |
| 3.0x to 3.9x | 119 (4.6%) | 547 (20.5%) |
| 4.0x or more | 625 (23.9%) | 252 (9.5%) |
| Total | 2,612 (100.0%) | 2,668 (100.0%) |
Real Estate Taxes by Mortgage Status in Buena Vista County

| Property Taxes | Without Mortgage | With Mortgage |
| Less than $800 | 642 (24.6%) | 0 (0.0%) |
| $800 to $1,499 | 518 (19.8%) | 242 (9.1%) |
| $800 to $1,499 | 1,301 (49.8%) | 742 (27.8%) |
| Total | 2,612 (100.0%) | 2,668 (100.0%) |
Health & Disability in Buena Vista County
Health Insurance Coverage by Age in Buena Vista County

| Age Bracket | With Coverage | Without Coverage |
| Under 6 Years | 1,626 (97.1%) | 49 (2.9%) |
| 6 to 18 Years | 4,077 (96.9%) | 130 (3.1%) |
| 19 to 25 Years | 1,895 (87.8%) | 264 (12.2%) |
| 26 to 34 Years | 1,673 (81.8%) | 372 (18.2%) |
| 35 to 44 Years | 2,291 (95.9%) | 99 (4.1%) |
| 45 to 54 Years | 2,097 (92.6%) | 168 (7.4%) |
| 55 to 64 Years | 2,325 (94.6%) | 133 (5.4%) |
| 65 to 74 Years | 1,898 (99.7%) | 6 (0.3%) |
| 75 Years and older | 1,285 (100.0%) | 0 (0.0%) |
| Total | 19,167 (94.0%) | 1,221 (6.0%) |
Health Insurance Coverage by Citizenship Status in Buena Vista County

| Citizenship Status | With Coverage | Without Coverage |
| Native Born | 1,626 (97.1%) | 49 (2.9%) |
| Foreign Born, Citizen | 4,077 (96.9%) | 130 (3.1%) |
| Foreign Born, not a Citizen | 1,895 (87.8%) | 264 (12.2%) |
Health Insurance Coverage by Household Income in Buena Vista County

| Household Income | With Coverage | Without Coverage |
| Under $25,000 | 1,107 (92.0%) | 96 (8.0%) |
| $25,000 to $49,999 | 3,516 (95.0%) | 185 (5.0%) |
| $50,000 to $74,999 | 4,515 (92.5%) | 366 (7.5%) |
| $75,000 to $99,999 | 2,618 (91.8%) | 234 (8.2%) |
| $100,000 and over | 6,708 (95.3%) | 334 (4.7%) |
Public vs Private Health Insurance Coverage by Age in Buena Vista County
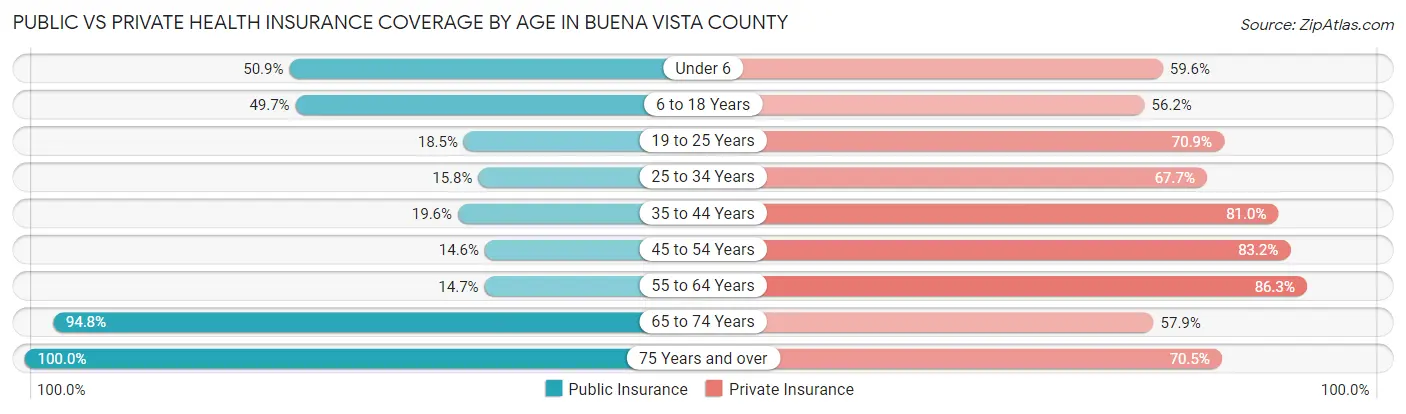
| Age Bracket | Public Insurance | Private Insurance |
| Under 6 | 852 (50.9%) | 998 (59.6%) |
| 6 to 18 Years | 2,092 (49.7%) | 2,365 (56.2%) |
| 19 to 25 Years | 399 (18.5%) | 1,531 (70.9%) |
| 25 to 34 Years | 323 (15.8%) | 1,385 (67.7%) |
| 35 to 44 Years | 468 (19.6%) | 1,936 (81.0%) |
| 45 to 54 Years | 330 (14.6%) | 1,885 (83.2%) |
| 55 to 64 Years | 360 (14.6%) | 2,121 (86.3%) |
| 65 to 74 Years | 1,804 (94.8%) | 1,102 (57.9%) |
| 75 Years and over | 1,285 (100.0%) | 906 (70.5%) |
| Total | 7,913 (38.8%) | 14,229 (69.8%) |
Disability Status by Sex by Age in Buena Vista County

| Age Bracket | Male | Female |
| Under 5 Years | 0 (0.0%) | 0 (0.0%) |
| 5 to 17 Years | 67 (3.2%) | 101 (5.3%) |
| 18 to 34 Years | 199 (8.3%) | 114 (5.0%) |
| 35 to 64 Years | 350 (9.6%) | 204 (5.9%) |
| 65 to 74 Years | 201 (22.0%) | 165 (16.6%) |
| 75 Years and over | 223 (42.8%) | 295 (38.6%) |
Disability Class by Sex by Age in Buena Vista County
Disability Class: Hearing Difficulty

| Age Bracket | Male | Female |
| Under 5 Years | 0 (0.0%) | 0 (0.0%) |
| 5 to 17 Years | 0 (0.0%) | 85 (4.5%) |
| 18 to 34 Years | 6 (0.3%) | 6 (0.3%) |
| 35 to 64 Years | 103 (2.8%) | 17 (0.5%) |
| 65 to 74 Years | 103 (11.3%) | 33 (3.3%) |
| 75 Years and over | 180 (34.5%) | 79 (10.3%) |
Disability Class: Vision Difficulty

| Age Bracket | Male | Female |
| Under 5 Years | 0 (0.0%) | 0 (0.0%) |
| 5 to 17 Years | 3 (0.1%) | 90 (4.7%) |
| 18 to 34 Years | 20 (0.8%) | 10 (0.4%) |
| 35 to 64 Years | 86 (2.4%) | 12 (0.4%) |
| 65 to 74 Years | 45 (4.9%) | 11 (1.1%) |
| 75 Years and over | 5 (1.0%) | 54 (7.1%) |
Disability Class: Cognitive Difficulty

| Age Bracket | Male | Female |
| 5 to 17 Years | 33 (1.6%) | 96 (5.1%) |
| 18 to 34 Years | 180 (7.5%) | 87 (3.8%) |
| 35 to 64 Years | 95 (2.6%) | 104 (3.0%) |
| 65 to 74 Years | 16 (1.8%) | 28 (2.8%) |
| 75 Years and over | 40 (7.7%) | 39 (5.1%) |
Disability Class: Ambulatory Difficulty

| Age Bracket | Male | Female |
| 5 to 17 Years | 18 (0.9%) | 85 (4.5%) |
| 18 to 34 Years | 34 (1.4%) | 31 (1.4%) |
| 35 to 64 Years | 111 (3.0%) | 140 (4.1%) |
| 65 to 74 Years | 108 (11.8%) | 122 (12.3%) |
| 75 Years and over | 73 (14.0%) | 230 (30.1%) |
Disability Class: Self-Care Difficulty

| Age Bracket | Male | Female |
| 5 to 17 Years | 21 (1.0%) | 85 (4.5%) |
| 18 to 34 Years | 2 (0.1%) | 41 (1.8%) |
| 35 to 64 Years | 35 (1.0%) | 11 (0.3%) |
| 65 to 74 Years | 1 (0.1%) | 17 (1.7%) |
| 75 Years and over | 32 (6.1%) | 43 (5.6%) |
Technology Access in Buena Vista County
Computing Device Access in Buena Vista County
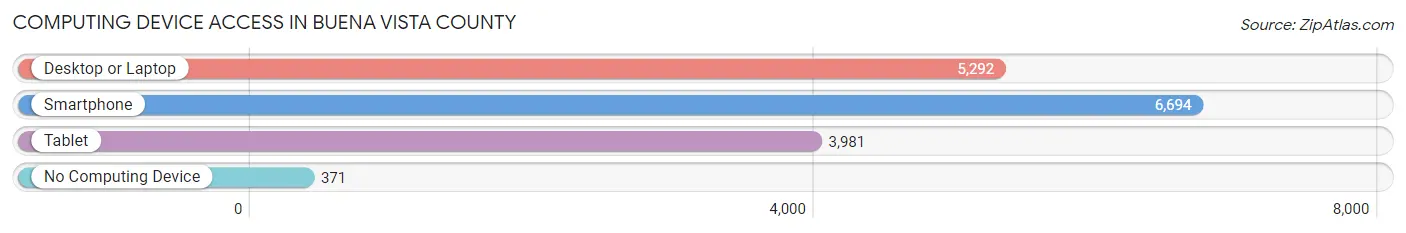
| Device Type | # Households | % Households |
| Desktop or Laptop | 5,292 | 70.2% |
| Smartphone | 6,694 | 88.8% |
| Tablet | 3,981 | 52.8% |
| No Computing Device | 371 | 4.9% |
| Total | 7,538 | 100.0% |
Internet Access in Buena Vista County

| Internet Type | # Households | % Households |
| Dial-Up Internet | 25 | 0.3% |
| Broadband Home | 4,540 | 60.2% |
| Cellular Data Only | 1,545 | 20.5% |
| Satellite Internet | 775 | 10.3% |
| No Internet | 827 | 11.0% |
| Total | 7,538 | 100.0% |
Buena Vista County Summary
Buena Vista County is located in the northwest corner of Iowa, and is bordered by Clay, Palo Alto, Pocahontas, Sac, and Cherokee counties. The county seat is Storm Lake, and the county is home to a population of 20,260 people, according to the 2010 census.
History
Buena Vista County was established in 1851, and was named after the Battle of Buena Vista, which was fought during the Mexican-American War. The county was originally part of the larger Cherokee County, and was split off in 1851. The first settlers in the area were mostly of German and Scandinavian descent, and the county was largely agricultural.
In the late 19th century, the county experienced a population boom due to the arrival of immigrants from Europe. This influx of people led to the establishment of several small towns, including Storm Lake, which was founded in 1856.
In the early 20th century, the county experienced a period of economic growth, as the area became a major producer of corn, soybeans, and hogs. This period of growth was interrupted by the Great Depression, which caused a significant decline in the county’s population.
In the 1950s, the county experienced a resurgence in population growth, as the area became a popular destination for vacationers. This period of growth was further bolstered by the construction of the Storm Lake Dam in the 1960s, which created a large recreational lake.
Geography
Buena Vista County is located in the northwest corner of Iowa, and is bordered by Clay, Palo Alto, Pocahontas, Sac, and Cherokee counties. The county is largely rural, and is home to several small towns, including Storm Lake, Newell, Albert City, and Linn Grove.
The county is located in the Loess Hills region of Iowa, and is characterized by rolling hills and prairies. The county is home to several lakes, including Storm Lake, which is the largest lake in the county.
Economy
Buena Vista County is largely agricultural, and is a major producer of corn, soybeans, and hogs. The county is also home to several manufacturing companies, including a pork processing plant, a wind turbine manufacturer, and a plastics manufacturer.
The county is also home to several tourist attractions, including the Storm Lake Dam, which is a popular destination for fishing and boating. The county is also home to several parks, including the Buena Vista County Park, which is a popular destination for camping and hiking.
Demographics
According to the 2010 census, Buena Vista County is home to a population of 20,260 people. The population is largely white (94.3%), with small percentages of African American (2.2%), Hispanic (1.7%), and Asian (1.2%) residents.
The median household income in the county is $45,845, and the median home value is $117,400. The unemployment rate in the county is 3.7%, which is lower than the national average.
Conclusion
Buena Vista County is a rural county located in the northwest corner of Iowa. The county is largely agricultural, and is home to a population of 20,260 people. The county is largely white, and the median household income is $45,845. The county is home to several tourist attractions, including the Storm Lake Dam, and is a popular destination for fishing and boating.
Common Questions
What is the Total Population of Buena Vista County?
Total Population of Buena Vista County is 20,687.
What is the Total Male Population of Buena Vista County?
Total Male Population of Buena Vista County is 10,599.
What is the Total Female Population of Buena Vista County?
Total Female Population of Buena Vista County is 10,088.
What is the Ratio of Males per 100 Females in Buena Vista County?
There are 105.07 Males per 100 Females in Buena Vista County.
What is the Ratio of Females per 100 Males in Buena Vista County?
There are 95.18 Females per 100 Males in Buena Vista County.
What is the Median Population Age in Buena Vista County?
Median Population Age in Buena Vista County is 35.6 Years.
What is the Average Family Size in Buena Vista County
Average Family Size in Buena Vista County is 3.5 People.
What is the Average Household Size in Buena Vista County
Average Household Size in Buena Vista County is 2.6 People.
What is Per Capita Income in Buena Vista County?
Per Capita income in Buena Vista County is $31,985.
What is the Median Family Income in Buena Vista County?
Median Family Income in Buena Vista County is $87,475.
What is the Median Household income in Buena Vista County?
Median Household Income in Buena Vista County is $62,662.
What is Income or Wage Gap in Buena Vista County?
Income or Wage Gap in Buena Vista County is 29.5%.
Women in Buena Vista County earn 70.5 cents for every dollar earned by a man.
What is Inequality or Gini Index in Buena Vista County?
Inequality or Gini Index in Buena Vista County is 0.42.
How Large is the Labor Force in Buena Vista County?
There are 10,903 People in the Labor Forcein in Buena Vista County.
What is the Percentage of People in the Labor Force in Buena Vista County?
68.3% of People are in the Labor Force in Buena Vista County.
What is the Unemployment Rate in Buena Vista County?
Unemployment Rate in Buena Vista County is 5.0%.