Immigrants from Kazakhstan vs Guatemalan Disability Age 5 to 17

COMPARE

Immigrants from Kazakhstan
Race
Ancestry
AfghanAfricanAlaska NativeAlaskan AthabascanAlbanianAleutAlsatianAmericanApacheArabArapahoArgentineanArmenianAssyrian/Chaldean/SyriacAustralianAustrianBahamianBangladeshiBarbadianBasqueBelgianBelizeanBermudanBhutaneseBlackfeetBolivianBrazilianBritishBritish West IndianBulgarianBurmeseCajunCambodianCanadianCape VerdeanCarpatho RusynCelticCentral AmericanCentral American IndianCherokeeCheyenneChickasawChileanChineseChippewaChoctawColombianColvilleComancheCosta RicanCreeCreekCroatianCrowCubanCypriotCzechCzechoslovakianDanishDelawareDominicanDutchDutch West IndianEastern EuropeanEcuadorianEgyptianEnglishEstonianEthiopianEuropeanFijianFilipinoFinnishFrenchFrench American IndianFrench CanadianGermanGerman RussianGhanaianGreekGuamanian/ChamorroGuyaneseHaitianHmongHonduranHopiHoumaHungarianIcelanderIndian (Asian)IndonesianInupiatIranianIraqiIrishIroquoisIsraeliItalianJamaicanJapaneseJordanianKenyanKiowaKoreanLaotianLatvianLebaneseLiberianLithuanianLumbeeLuxembourgerMacedonianMalaysianMalteseMarshalleseMenomineeMexicanMexican American IndianMongolianMoroccanNative HawaiianNavajoNepaleseNew ZealanderNicaraguanNigerianNorthern EuropeanNorwegianOkinawanOsageOttawaPaiutePakistaniPalestinianPanamanianParaguayanPennsylvania GermanPeruvianPimaPolishPortuguesePotawatomiPuebloPuerto RicanPuget Sound SalishRomanianRussianSalvadoranSamoanScandinavianScotch-IrishScottishSeminoleSenegaleseSerbianShoshoneSierra LeoneanSiouxSlavicSlovakSloveneSomaliSouth AfricanSouth AmericanSouth American IndianSoviet UnionSpaniardSpanishSpanish AmericanSpanish American IndianSri LankanSubsaharan AfricanSudaneseSwedishSwissSyrianTaiwaneseThaiTlingit-HaidaTohono O'OdhamTonganTrinidadian and TobagonianTsimshianTurkishU.S. Virgin IslanderUgandanUkrainianUruguayanUteVenezuelanVietnameseWelshWest IndianYakamaYaquiYugoslavianYumanYup'ikZimbabwean
Immigration
NonimmigrantsImmigrantsAfghanistanAfricaAlbaniaArgentinaArmeniaAsiaAustraliaAustriaBahamasBangladeshBarbadosBelarusBelgiumBelizeBoliviaBosnia and HerzegovinaBrazilBulgariaBurma/MyanmarCabo VerdeCambodiaCameroonCanadaCaribbeanCentral AmericaChileChinaColombiaCongoCosta RicaCroatiaCubaCzechoslovakiaDenmarkDominicaDominican RepublicEastern AfricaEastern AsiaEastern EuropeEcuadorEgyptEl SalvadorEnglandEritreaEthiopiaEuropeFijiFranceGermanyGhanaGreeceGrenadaGuatemalaGuyanaHaitiHondurasHong KongHungaryIndiaIndonesiaIranIraqIrelandIsraelItalyJamaicaJapanJordanKazakhstanKenyaKoreaKuwaitLaosLatin AmericaLatviaLebanonLiberiaLithuaniaMalaysiaMexicoMicronesiaMiddle AfricaMoldovaMoroccoNepalNetherlandsNicaraguaNigeriaNorth AmericaNorth MacedoniaNorthern AfricaNorthern EuropeNorwayOceaniaPakistanPanamaPeruPhilippinesPolandPortugalRomaniaRussiaSaudi ArabiaScotlandSenegalSerbiaSierra LeoneSingaporeSomaliaSouth AfricaSouth AmericaSouth Central AsiaSouth Eastern AsiaSouthern EuropeSpainSri LankaSt. Vincent and the GrenadinesSudanSwedenSwitzerlandSyriaTaiwanThailandTrinidad and TobagoTurkeyUgandaUkraineUruguayUzbekistanVenezuelaVietnamWest IndiesWestern AfricaWestern AsiaWestern EuropeYemenZaireZimbabweAzores
Guatemalan
Race
Ancestry
AfghanAfricanAlaska NativeAlaskan AthabascanAlbanianAleutAlsatianAmericanApacheArabArapahoArgentineanArmenianAssyrian/Chaldean/SyriacAustralianAustrianBahamianBangladeshiBarbadianBasqueBelgianBelizeanBermudanBhutaneseBlackfeetBolivianBrazilianBritishBritish West IndianBulgarianBurmeseCajunCambodianCanadianCape VerdeanCarpatho RusynCelticCentral AmericanCentral American IndianCherokeeCheyenneChickasawChileanChineseChippewaChoctawColombianColvilleComancheCosta RicanCreeCreekCroatianCrowCubanCypriotCzechCzechoslovakianDanishDelawareDominicanDutchDutch West IndianEastern EuropeanEcuadorianEgyptianEnglishEstonianEthiopianEuropeanFijianFilipinoFinnishFrenchFrench American IndianFrench CanadianGermanGerman RussianGhanaianGreekGuamanian/ChamorroGuatemalanGuyaneseHaitianHmongHonduranHopiHoumaHungarianIcelanderIndian (Asian)IndonesianInupiatIranianIraqiIrishIroquoisIsraeliItalianJamaicanJapaneseJordanianKenyanKiowaKoreanLaotianLatvianLebaneseLiberianLithuanianLumbeeLuxembourgerMacedonianMalaysianMalteseMarshalleseMenomineeMexicanMexican American IndianMongolianMoroccanNative HawaiianNavajoNepaleseNew ZealanderNicaraguanNigerianNorthern EuropeanNorwegianOkinawanOsageOttawaPaiutePakistaniPalestinianPanamanianParaguayanPennsylvania GermanPeruvianPimaPolishPortuguesePotawatomiPuebloPuerto RicanPuget Sound SalishRomanianRussianSalvadoranSamoanScandinavianScotch-IrishScottishSeminoleSenegaleseSerbianShoshoneSierra LeoneanSiouxSlavicSlovakSloveneSomaliSouth AfricanSouth AmericanSouth American IndianSoviet UnionSpaniardSpanishSpanish AmericanSpanish American IndianSri LankanSubsaharan AfricanSudaneseSwedishSwissSyrianTaiwaneseThaiTlingit-HaidaTohono O'OdhamTonganTrinidadian and TobagonianTsimshianTurkishU.S. Virgin IslanderUgandanUkrainianUruguayanUteVenezuelanVietnameseWelshWest IndianYakamaYaquiYugoslavianYumanYup'ikZimbabwean
Immigration
NonimmigrantsImmigrantsAfghanistanAfricaAlbaniaArgentinaArmeniaAsiaAustraliaAustriaBahamasBangladeshBarbadosBelarusBelgiumBelizeBoliviaBosnia and HerzegovinaBrazilBulgariaBurma/MyanmarCabo VerdeCambodiaCameroonCanadaCaribbeanCentral AmericaChileChinaColombiaCongoCosta RicaCroatiaCubaCzechoslovakiaDenmarkDominicaDominican RepublicEastern AfricaEastern AsiaEastern EuropeEcuadorEgyptEl SalvadorEnglandEritreaEthiopiaEuropeFijiFranceGermanyGhanaGreeceGrenadaGuatemalaGuyanaHaitiHondurasHong KongHungaryIndiaIndonesiaIranIraqIrelandIsraelItalyJamaicaJapanJordanKenyaKoreaKuwaitLaosLatin AmericaLatviaLebanonLiberiaLithuaniaMalaysiaMexicoMicronesiaMiddle AfricaMoldovaMoroccoNepalNetherlandsNicaraguaNigeriaNorth AmericaNorth MacedoniaNorthern AfricaNorthern EuropeNorwayOceaniaPakistanPanamaPeruPhilippinesPolandPortugalRomaniaRussiaSaudi ArabiaScotlandSenegalSerbiaSierra LeoneSingaporeSomaliaSouth AfricaSouth AmericaSouth Central AsiaSouth Eastern AsiaSouthern EuropeSpainSri LankaSt. Vincent and the GrenadinesSudanSwedenSwitzerlandSyriaTaiwanThailandTrinidad and TobagoTurkeyUgandaUkraineUruguayUzbekistanVenezuelaVietnamWest IndiesWestern AfricaWestern AsiaWestern EuropeYemenZaireZimbabweAzores
Disability Age 5 to 17
Income
Poverty
Unemployment
Labor Participation
Family Structure
Vehicle Availability
Education Level
Disability

Disability Age 5 to 17 Comparison

Immigrants from Kazakhstan

Guatemalans

Exceptional
Excellent
5.2%
DISABILITY AGE 5 TO 17
99.6/ 100
METRIC RATING
77th/ 347
METRIC RANK
5.5%
DISABILITY AGE 5 TO 17
81.5/ 100
METRIC RATING
150th/ 347
METRIC RANK

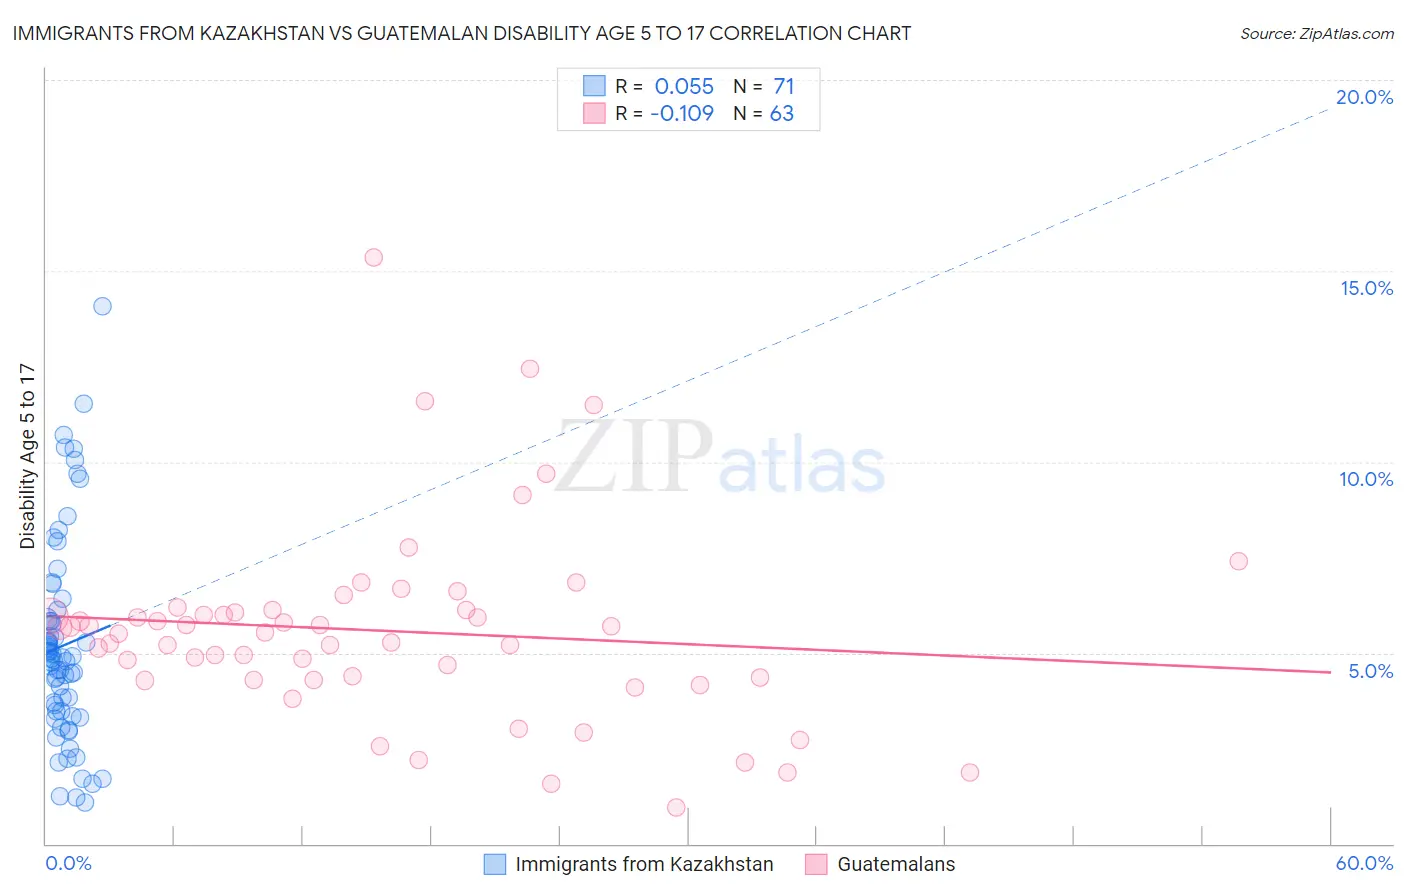
Immigrants from Kazakhstan vs Guatemalan Disability Age 5 to 17 Correlation Chart

The statistical analysis conducted on geographies consisting of 124,141,808 people shows a slight positive correlation between the proportion of Immigrants from Kazakhstan and percentage of population with a disability between the ages 5 and 17 in the United States with a correlation coefficient (R) of 0.055 and weighted average of 5.2%. Similarly, the statistical analysis conducted on geographies consisting of 406,988,204 people shows a poor negative correlation between the proportion of Guatemalans and percentage of population with a disability between the ages 5 and 17 in the United States with a correlation coefficient (R) of -0.109 and weighted average of 5.5%, a difference of 5.3%.
Immigrants from Kazakhstan vs Guatemalan Disability Age 5 to 17

Disability Age 5 to 17 Correlation Summary

MeasurementImmigrants from KazakhstanGuatemalan
Minimum1.1%0.96%
Maximum14.1%15.4%
Range13.0%14.4%
Mean5.2%5.6%
Median4.8%5.5%
Interquartile 25% (IQ1)3.5%4.3%
Interquartile 75% (IQ3)5.9%6.1%
Interquartile Range (IQR)2.4%1.8%
Standard Deviation (Sample)2.6%2.5%
Standard Deviation (Population)2.6%2.5%

Similar Demographics by Disability Age 5 to 17

Demographics Similar to Immigrants from Kazakhstan by Disability Age 5 to 17

In terms of disability age 5 to 17, the demographic groups most similar to Immigrants from Kazakhstan are Immigrants from Cuba (5.2%, a difference of 0.010%), Immigrants from Guyana (5.2%, a difference of 0.030%), Afghan (5.2%, a difference of 0.050%), Immigrants from Moldova (5.2%, a difference of 0.070%), and Sri Lankan (5.2%, a difference of 0.070%).
DemographicsRating | RankDisability Age 5 to 17
Immigrants | Belgium
99.7
/100
|
#70
Exceptional
5.2%
Jordanians
99.7
/100
|
#71
Exceptional
5.2%
Immigrants | Vietnam
99.7
/100
|
#72
Exceptional
5.2%
Immigrants | Czechoslovakia
99.7
/100
|
#73
Exceptional
5.2%
Immigrants | Romania
99.7
/100
|
#74
Exceptional
5.2%
Immigrants | Moldova
99.6
/100
|
#75
Exceptional
5.2%
Immigrants | Guyana
99.6
/100
|
#76
Exceptional
5.2%
Immigrants | Kazakhstan
99.6
/100
|
#77
Exceptional
5.2%
Immigrants | Cuba
99.6
/100
|
#78
Exceptional
5.2%
Afghans
99.6
/100
|
#79
Exceptional
5.2%
Sri Lankans
99.6
/100
|
#80
Exceptional
5.2%
Native Hawaiians
99.6
/100
|
#81
Exceptional
5.2%
Immigrants | Sweden
99.5
/100
|
#82
Exceptional
5.2%
Immigrants | France
99.5
/100
|
#83
Exceptional
5.2%
Immigrants | Nicaragua
99.5
/100
|
#84
Exceptional
5.2%

Demographics Similar to Guatemalans by Disability Age 5 to 17

In terms of disability age 5 to 17, the demographic groups most similar to Guatemalans are Central American (5.5%, a difference of 0.0%), Samoan (5.5%, a difference of 0.030%), Estonian (5.5%, a difference of 0.060%), Ute (5.5%, a difference of 0.070%), and Immigrants from Albania (5.5%, a difference of 0.13%).
DemographicsRating | RankDisability Age 5 to 17
Immigrants | Hungary
87.9
/100
|
#143
Excellent
5.5%
Pakistanis
87.3
/100
|
#144
Excellent
5.5%
Immigrants | Guatemala
86.6
/100
|
#145
Excellent
5.5%
Albanians
83.7
/100
|
#146
Excellent
5.5%
Immigrants | Albania
83.1
/100
|
#147
Excellent
5.5%
Samoans
81.9
/100
|
#148
Excellent
5.5%
Central Americans
81.6
/100
|
#149
Excellent
5.5%
Guatemalans
81.5
/100
|
#150
Excellent
5.5%
Estonians
80.8
/100
|
#151
Excellent
5.5%
Ute
80.6
/100
|
#152
Excellent
5.5%
Ecuadorians
79.7
/100
|
#153
Good
5.5%
Australians
78.8
/100
|
#154
Good
5.5%
Immigrants | Ecuador
78.3
/100
|
#155
Good
5.5%
Hawaiians
78.0
/100
|
#156
Good
5.5%
Immigrants | Costa Rica
77.9
/100
|
#157
Good
5.5%