Zip Codes with the Highest Percentage of Population with a Degree in Liberal Arts and History in Los Altos, CA
RELATED REPORTS & OPTIONS
Liberal Arts and History
Los Altos
Compare Zip Codes
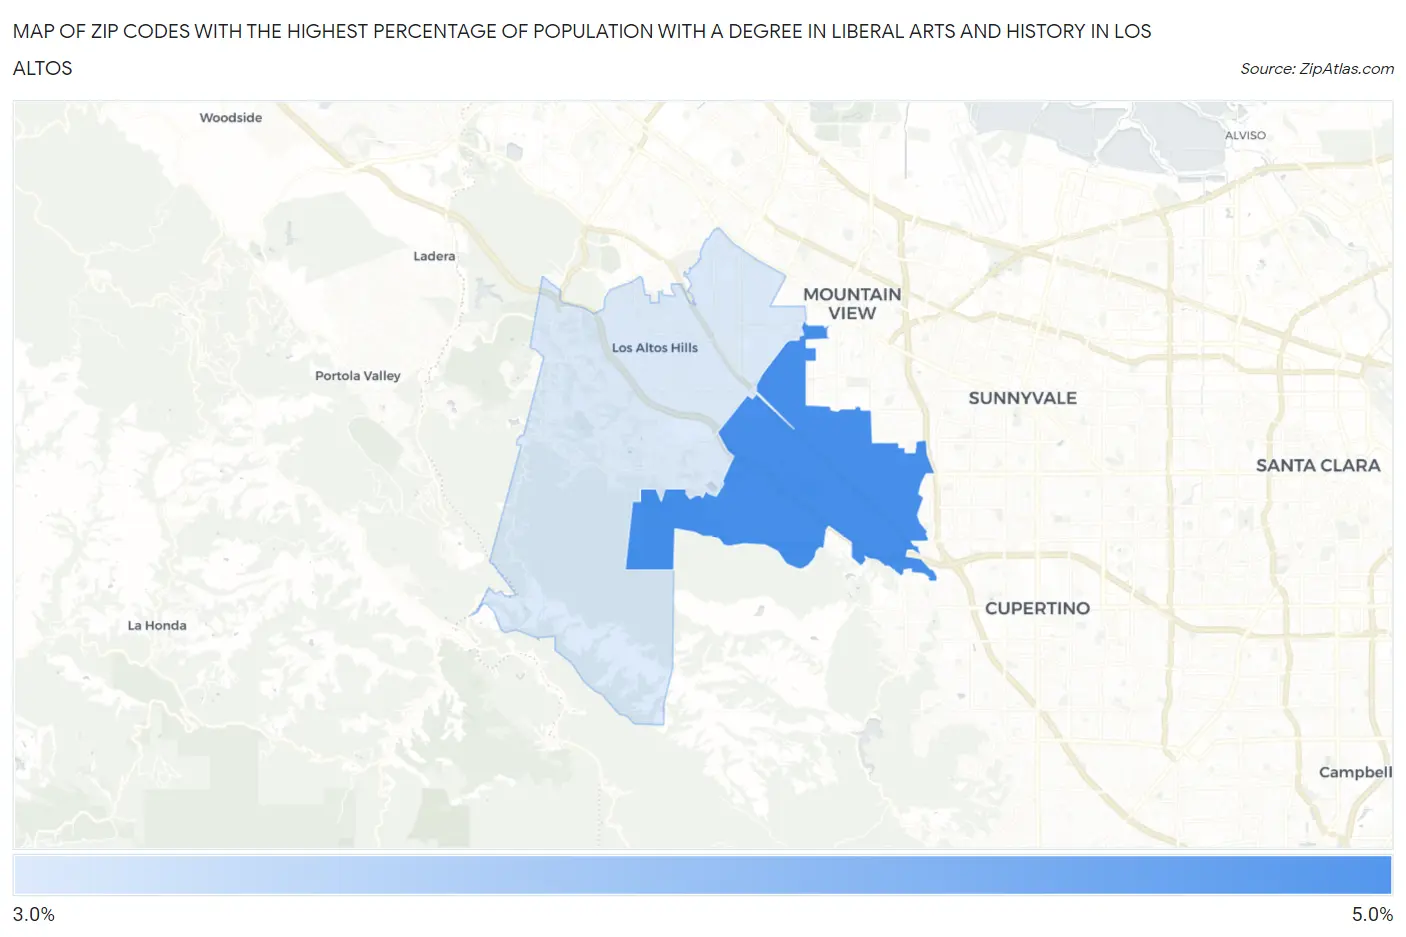
Map of Zip Codes with the Highest Percentage of Population with a Degree in Liberal Arts and History in Los Altos
0.0%
5.0%
Zip Codes with the Highest Percentage of Population with a Degree in Liberal Arts and History in Los Altos, CA
| Zip Code | % Graduates | vs State | vs National | |
| 1. | 94024 | 4.3% | 5.5%(-1.15)#1,110 | 4.9%(-0.528)#13,493 |
| 2. | 94022 | 3.5% | 5.5%(-1.99)#1,272 | 4.9%(-1.37)#16,585 |
1
Common Questions
What are the Top Zip Codes with the Highest Percentage of Population with a Degree in Liberal Arts and History in Los Altos, CA?
Top Zip Codes with the Highest Percentage of Population with a Degree in Liberal Arts and History in Los Altos, CA are:
What zip code has the Highest Percentage of Population with a Degree in Liberal Arts and History in Los Altos, CA?
94024 has the Highest Percentage of Population with a Degree in Liberal Arts and History in Los Altos, CA with 4.3%.
What is the Percentage of Population with a Degree in Liberal Arts and History in Los Altos, CA?
Percentage of Population with a Degree in Liberal Arts and History in Los Altos is 4.1%.
What is the Percentage of Population with a Degree in Liberal Arts and History in California?
Percentage of Population with a Degree in Liberal Arts and History in California is 5.5%.
What is the Percentage of Population with a Degree in Liberal Arts and History in the United States?
Percentage of Population with a Degree in Liberal Arts and History in the United States is 4.9%.