Zip Codes with the Highest Percentage of Population with a Degree in Liberal Arts and History in Monterey Park, CA
RELATED REPORTS & OPTIONS
Liberal Arts and History
Monterey Park
Compare Zip Codes
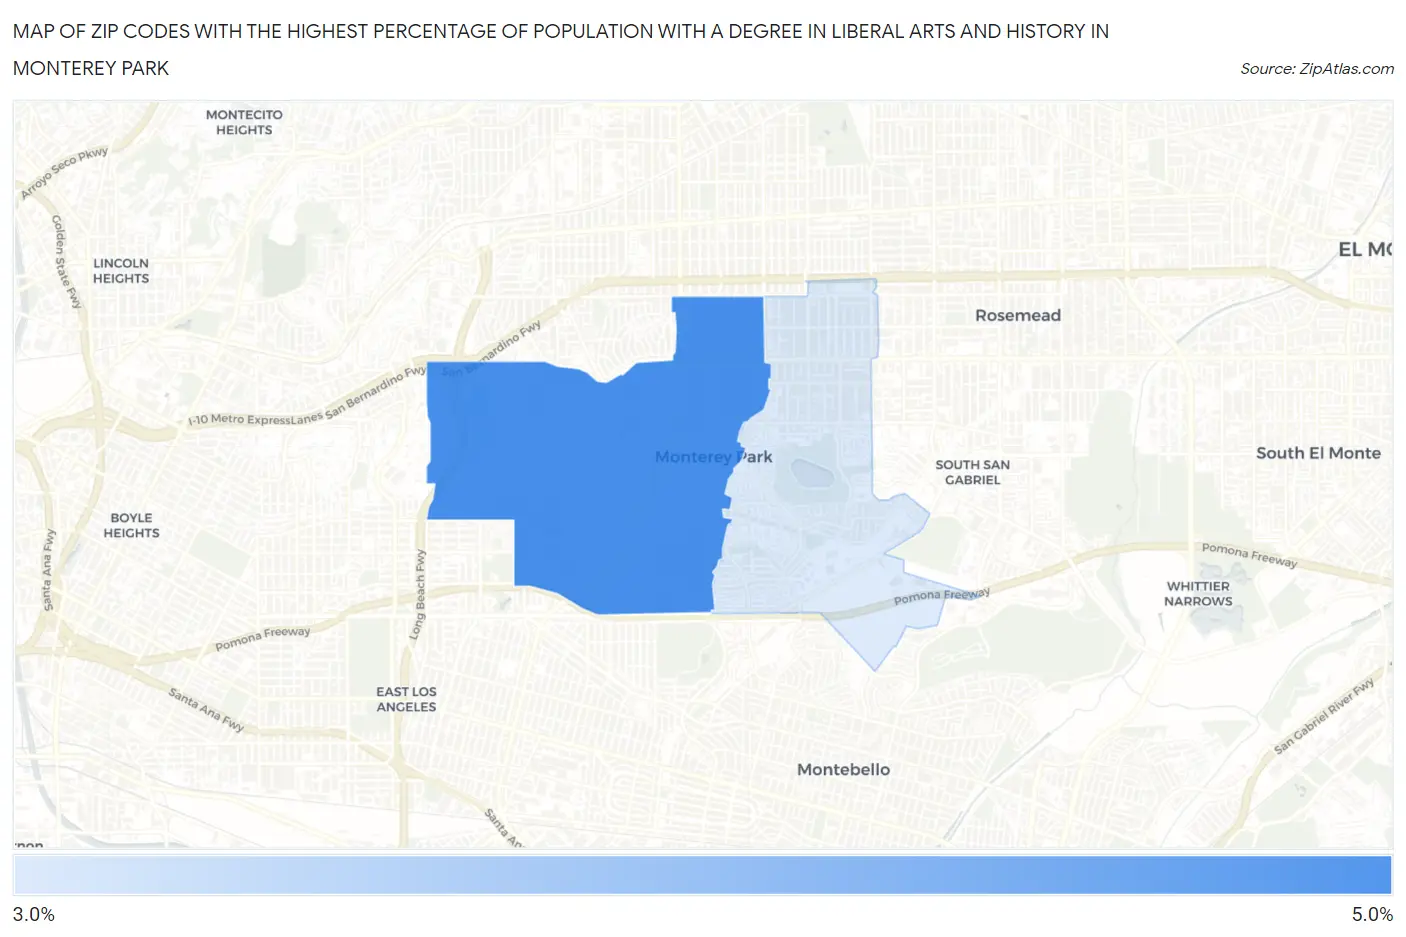
Map of Zip Codes with the Highest Percentage of Population with a Degree in Liberal Arts and History in Monterey Park
0.0%
5.0%
Zip Codes with the Highest Percentage of Population with a Degree in Liberal Arts and History in Monterey Park, CA
| Zip Code | % Graduates | vs State | vs National | |
| 1. | 91754 | 4.6% | 5.5%(-0.867)#1,049 | 4.9%(-0.243)#12,553 |
| 2. | 91755 | 3.2% | 5.5%(-2.28)#1,325 | 4.9%(-1.66)#17,601 |
1
Common Questions
What are the Top Zip Codes with the Highest Percentage of Population with a Degree in Liberal Arts and History in Monterey Park, CA?
Top Zip Codes with the Highest Percentage of Population with a Degree in Liberal Arts and History in Monterey Park, CA are:
What zip code has the Highest Percentage of Population with a Degree in Liberal Arts and History in Monterey Park, CA?
91754 has the Highest Percentage of Population with a Degree in Liberal Arts and History in Monterey Park, CA with 4.6%.
What is the Percentage of Population with a Degree in Liberal Arts and History in Monterey Park, CA?
Percentage of Population with a Degree in Liberal Arts and History in Monterey Park is 4.1%.
What is the Percentage of Population with a Degree in Liberal Arts and History in California?
Percentage of Population with a Degree in Liberal Arts and History in California is 5.5%.
What is the Percentage of Population with a Degree in Liberal Arts and History in the United States?
Percentage of Population with a Degree in Liberal Arts and History in the United States is 4.9%.