Zip Codes with the Highest Percentage of Population with a Degree in Liberal Arts and History in La Puente, CA
RELATED REPORTS & OPTIONS
Liberal Arts and History
La Puente
Compare Zip Codes
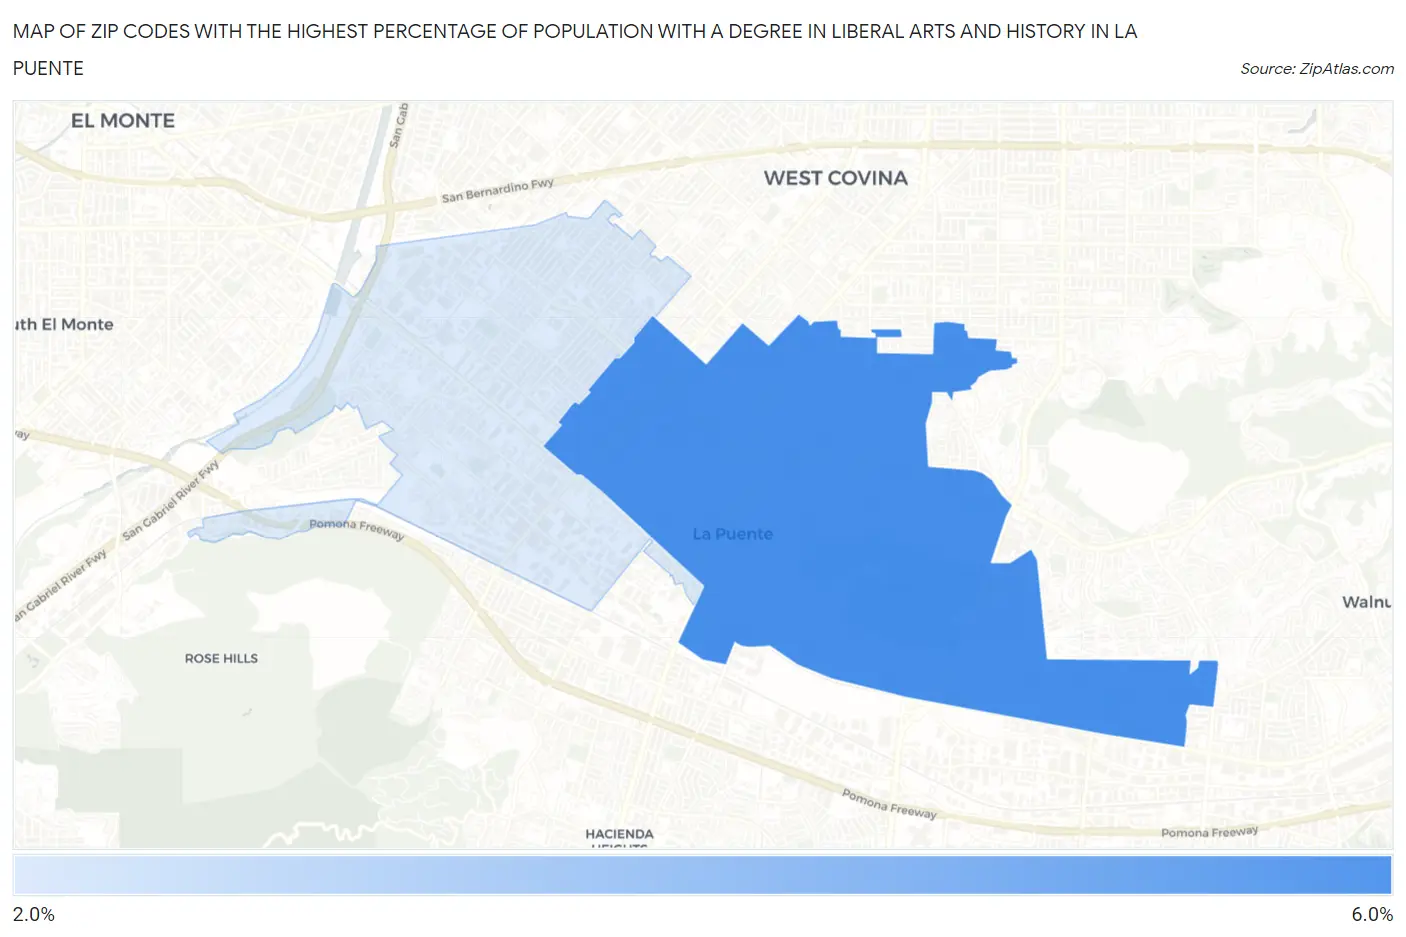
Map of Zip Codes with the Highest Percentage of Population with a Degree in Liberal Arts and History in La Puente
0.0%
6.0%
Zip Codes with the Highest Percentage of Population with a Degree in Liberal Arts and History in La Puente, CA
| Zip Code | % Graduates | vs State | vs National | |
| 1. | 91744 | 5.0% | 5.5%(-0.456)#971 | 4.9%(+0.168)#11,229 |
| 2. | 91746 | 2.8% | 5.5%(-2.71)#1,372 | 4.9%(-2.09)#19,059 |
1
Common Questions
What are the Top Zip Codes with the Highest Percentage of Population with a Degree in Liberal Arts and History in La Puente, CA?
Top Zip Codes with the Highest Percentage of Population with a Degree in Liberal Arts and History in La Puente, CA are:
What zip code has the Highest Percentage of Population with a Degree in Liberal Arts and History in La Puente, CA?
91744 has the Highest Percentage of Population with a Degree in Liberal Arts and History in La Puente, CA with 5.0%.
What is the Percentage of Population with a Degree in Liberal Arts and History in La Puente, CA?
Percentage of Population with a Degree in Liberal Arts and History in La Puente is 3.0%.
What is the Percentage of Population with a Degree in Liberal Arts and History in California?
Percentage of Population with a Degree in Liberal Arts and History in California is 5.5%.
What is the Percentage of Population with a Degree in Liberal Arts and History in the United States?
Percentage of Population with a Degree in Liberal Arts and History in the United States is 4.9%.