Zip Codes with the Highest Percentage of Population Employed in Arts, Media & Entertainment in Crossville, TN
RELATED REPORTS & OPTIONS
Arts, Media & Entertainment
Crossville
Compare Zip Codes
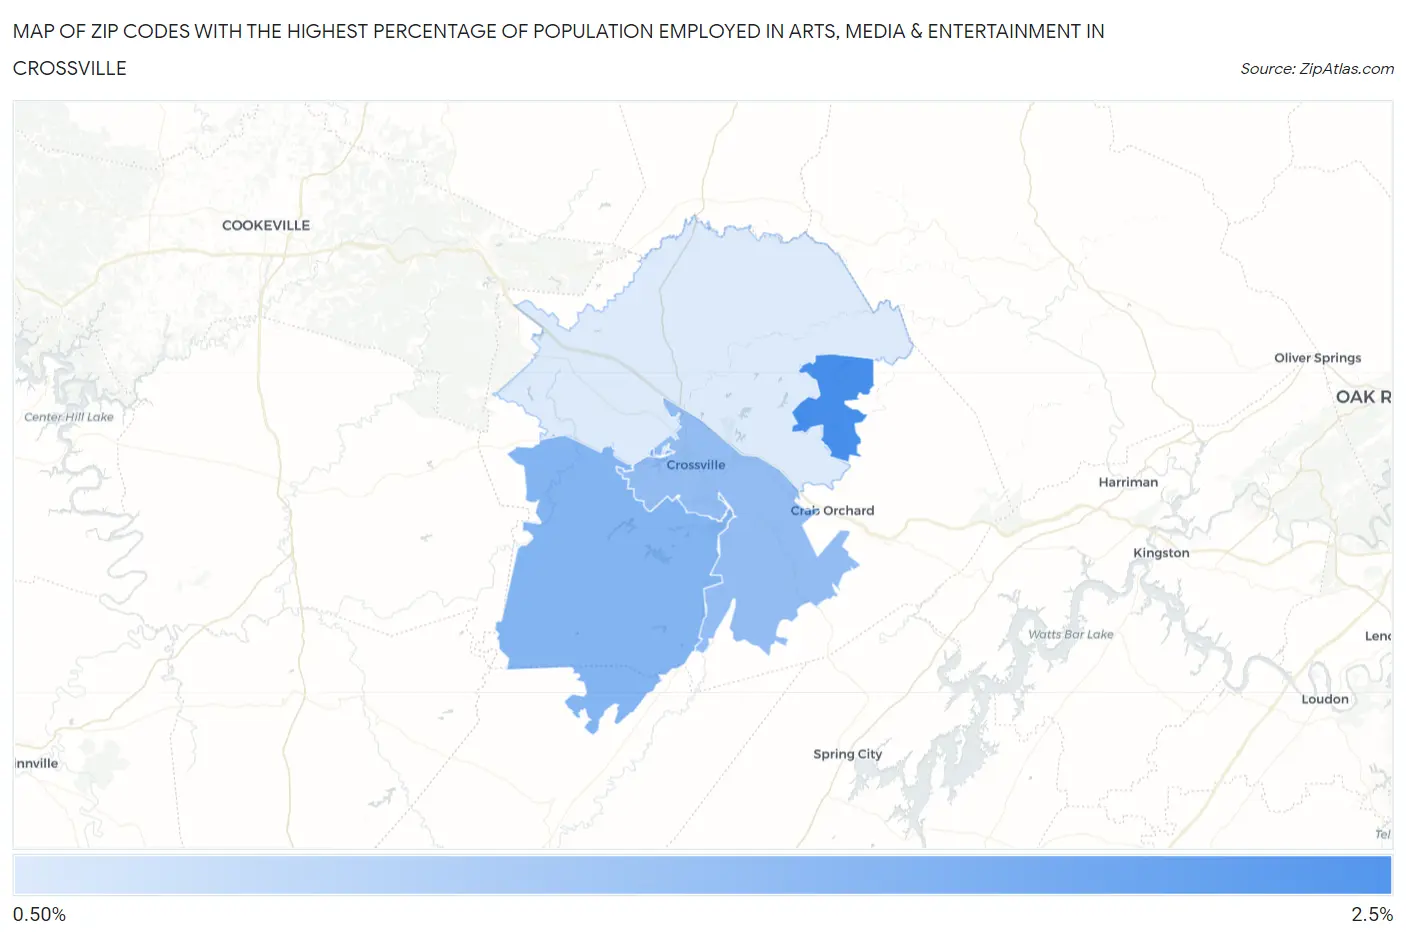
Map of Zip Codes with the Highest Percentage of Population Employed in Arts, Media & Entertainment in Crossville
0.0%
2.5%
Zip Codes with the Highest Percentage of Population Employed in Arts, Media & Entertainment in Crossville, TN
| Zip Code | % Employed | vs State | vs National | |
| 1. | 38558 | 2.0% | 1.9%(+0.091)#142 | 2.1%(-0.029)#7,648 |
| 2. | 38572 | 1.4% | 1.9%(-0.510)#205 | 2.1%(-0.629)#11,477 |
| 3. | 38555 | 1.3% | 1.9%(-0.651)#226 | 2.1%(-0.770)#12,523 |
| 4. | 38571 | 0.56% | 1.9%(-1.38)#347 | 2.1%(-1.50)#18,366 |
1
Common Questions
What are the Top 3 Zip Codes with the Highest Percentage of Population Employed in Arts, Media & Entertainment in Crossville, TN?
Top 3 Zip Codes with the Highest Percentage of Population Employed in Arts, Media & Entertainment in Crossville, TN are:
What zip code has the Highest Percentage of Population Employed in Arts, Media & Entertainment in Crossville, TN?
38558 has the Highest Percentage of Population Employed in Arts, Media & Entertainment in Crossville, TN with 2.0%.
What is the Percentage of Population Employed in Arts, Media & Entertainment in Crossville, TN?
Percentage of Population Employed in Arts, Media & Entertainment in Crossville is 1.1%.
What is the Percentage of Population Employed in Arts, Media & Entertainment in Tennessee?
Percentage of Population Employed in Arts, Media & Entertainment in Tennessee is 1.9%.
What is the Percentage of Population Employed in Arts, Media & Entertainment in the United States?
Percentage of Population Employed in Arts, Media & Entertainment in the United States is 2.1%.