Zip Codes with the Highest Percentage of Households Heated by Fuel Oil / Kerosene in Crossville, TN
RELATED REPORTS & OPTIONS
Fuel Oil Heating
Crossville
Compare Zip Codes
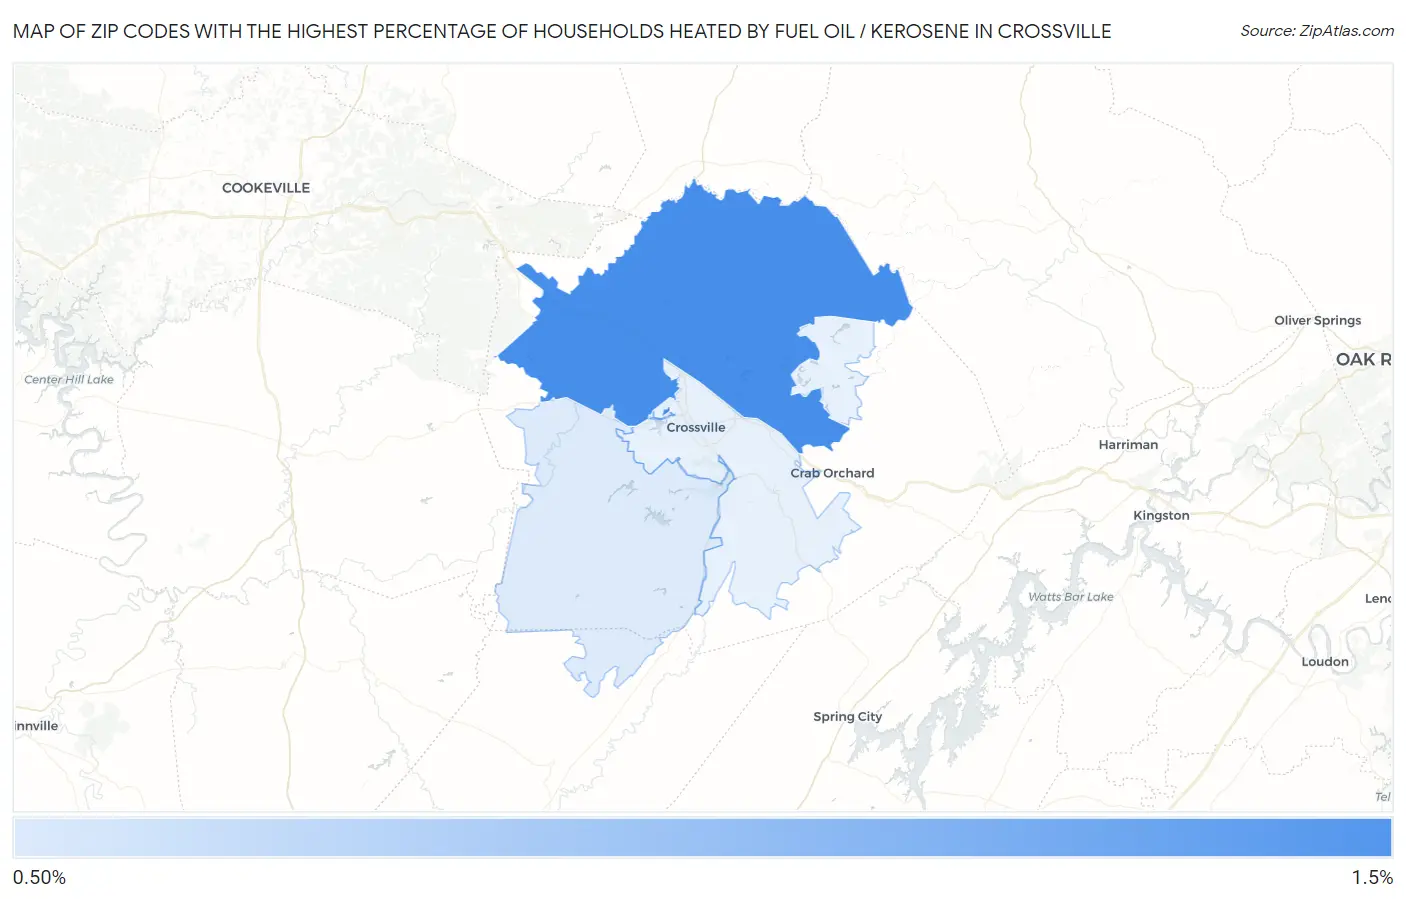
Map of Zip Codes with the Highest Percentage of Households Heated by Fuel Oil / Kerosene in Crossville
0.0%
1.5%
Zip Codes with the Highest Percentage of Households Heated by Fuel Oil / Kerosene in Crossville, TN
| Zip Code | Fuel Oil Heating | vs State | vs National | |
| 1. | 38571 | 1.2% | 0.30%(+0.900)#58 | 4.2%(-3.00)#12,307 |
| 2. | 38572 | 0.60% | 0.30%(+0.300)#97 | 4.2%(-3.60)#14,047 |
1
Common Questions
What are the Top 3 Zip Codes with the Highest Percentage of Households Heated by Fuel Oil / Kerosene in Crossville, TN?
Top 3 Zip Codes with the Highest Percentage of Households Heated by Fuel Oil / Kerosene in Crossville, TN are:
What zip code has the Highest Percentage of Households Heated by Fuel Oil / Kerosene in Crossville, TN?
38571 has the Highest Percentage of Households Heated by Fuel Oil / Kerosene in Crossville, TN with 1.2%.
What is the Percentage of Households Heated by Fuel Oil / Kerosene in Tennessee?
Percentage of Households Heated by Fuel Oil / Kerosene in Tennessee is 0.30%.
What is the Percentage of Households Heated by Fuel Oil / Kerosene in the United States?
Percentage of Households Heated by Fuel Oil / Kerosene in the United States is 4.2%.