Zip Codes with the Highest Percentage of Population Employed in Community & Social Service in Crossville, TN
RELATED REPORTS & OPTIONS
Community & Social Service
Crossville
Compare Zip Codes
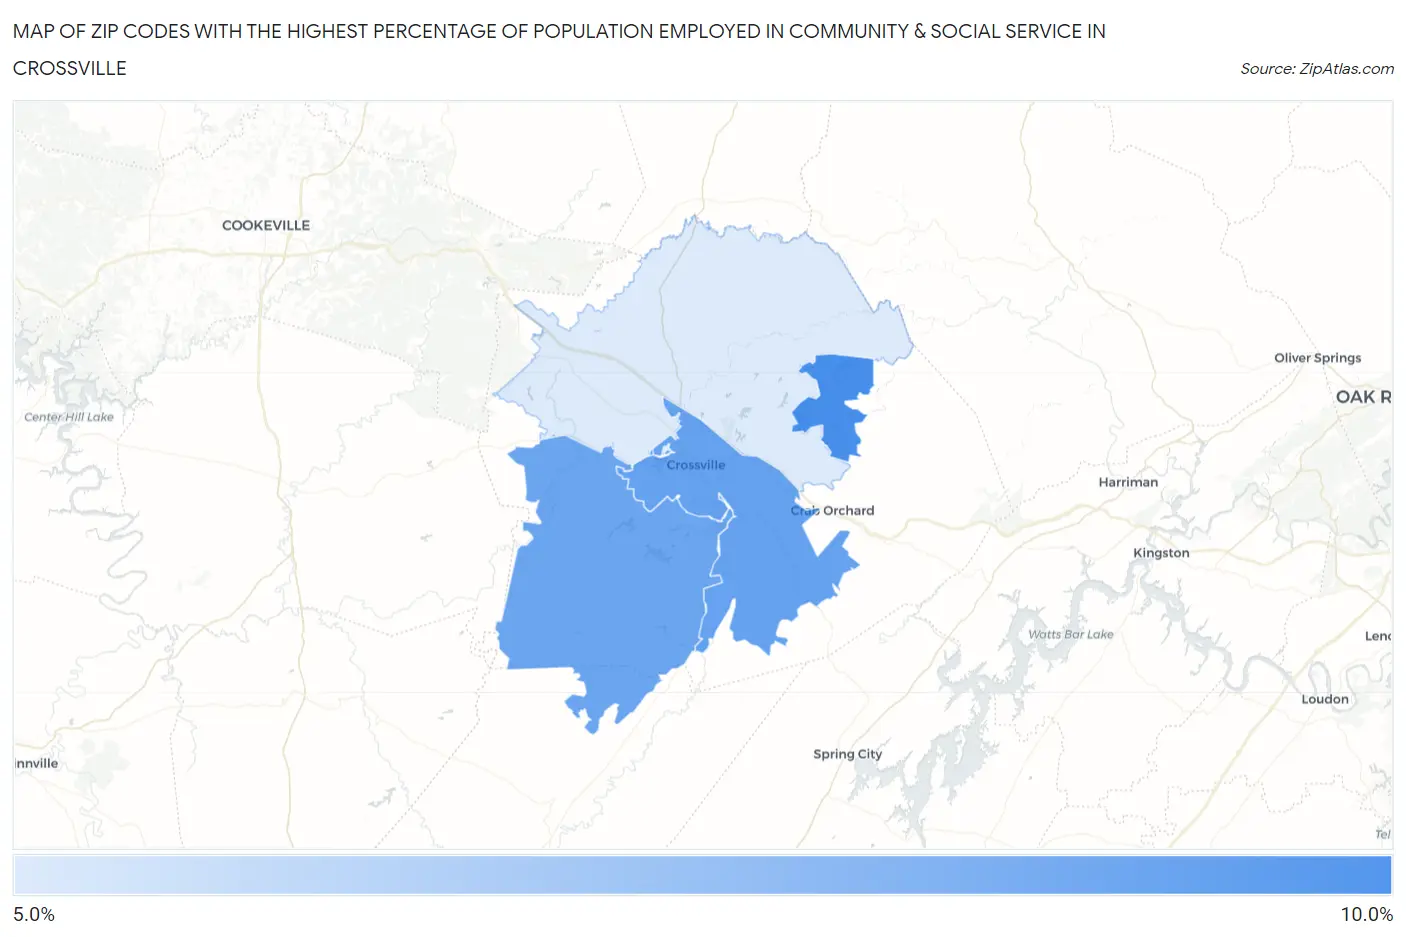
Map of Zip Codes with the Highest Percentage of Population Employed in Community & Social Service in Crossville
0.0%
10.0%
Zip Codes with the Highest Percentage of Population Employed in Community & Social Service in Crossville, TN
| Zip Code | % Employed | vs State | vs National | |
| 1. | 38558 | 8.7% | 10.4%(-1.72)#303 | 11.2%(-2.53)#17,684 |
| 2. | 38555 | 8.0% | 10.4%(-2.43)#346 | 11.2%(-3.25)#19,648 |
| 3. | 38572 | 7.8% | 10.4%(-2.58)#360 | 11.2%(-3.40)#20,104 |
| 4. | 38571 | 5.2% | 10.4%(-5.21)#508 | 11.2%(-6.03)#25,888 |
1
Common Questions
What are the Top 3 Zip Codes with the Highest Percentage of Population Employed in Community & Social Service in Crossville, TN?
Top 3 Zip Codes with the Highest Percentage of Population Employed in Community & Social Service in Crossville, TN are:
What zip code has the Highest Percentage of Population Employed in Community & Social Service in Crossville, TN?
38558 has the Highest Percentage of Population Employed in Community & Social Service in Crossville, TN with 8.7%.
What is the Percentage of Population Employed in Community & Social Service in Crossville, TN?
Percentage of Population Employed in Community & Social Service in Crossville is 7.4%.
What is the Percentage of Population Employed in Community & Social Service in Tennessee?
Percentage of Population Employed in Community & Social Service in Tennessee is 10.4%.
What is the Percentage of Population Employed in Community & Social Service in the United States?
Percentage of Population Employed in Community & Social Service in the United States is 11.2%.