Zip Codes with the Highest Percentage of Population Employed in Mining, Quarrying, & Extraction in Crossville, TN
RELATED REPORTS & OPTIONS
Mining, Quarrying, & Extraction
Crossville
Compare Zip Codes
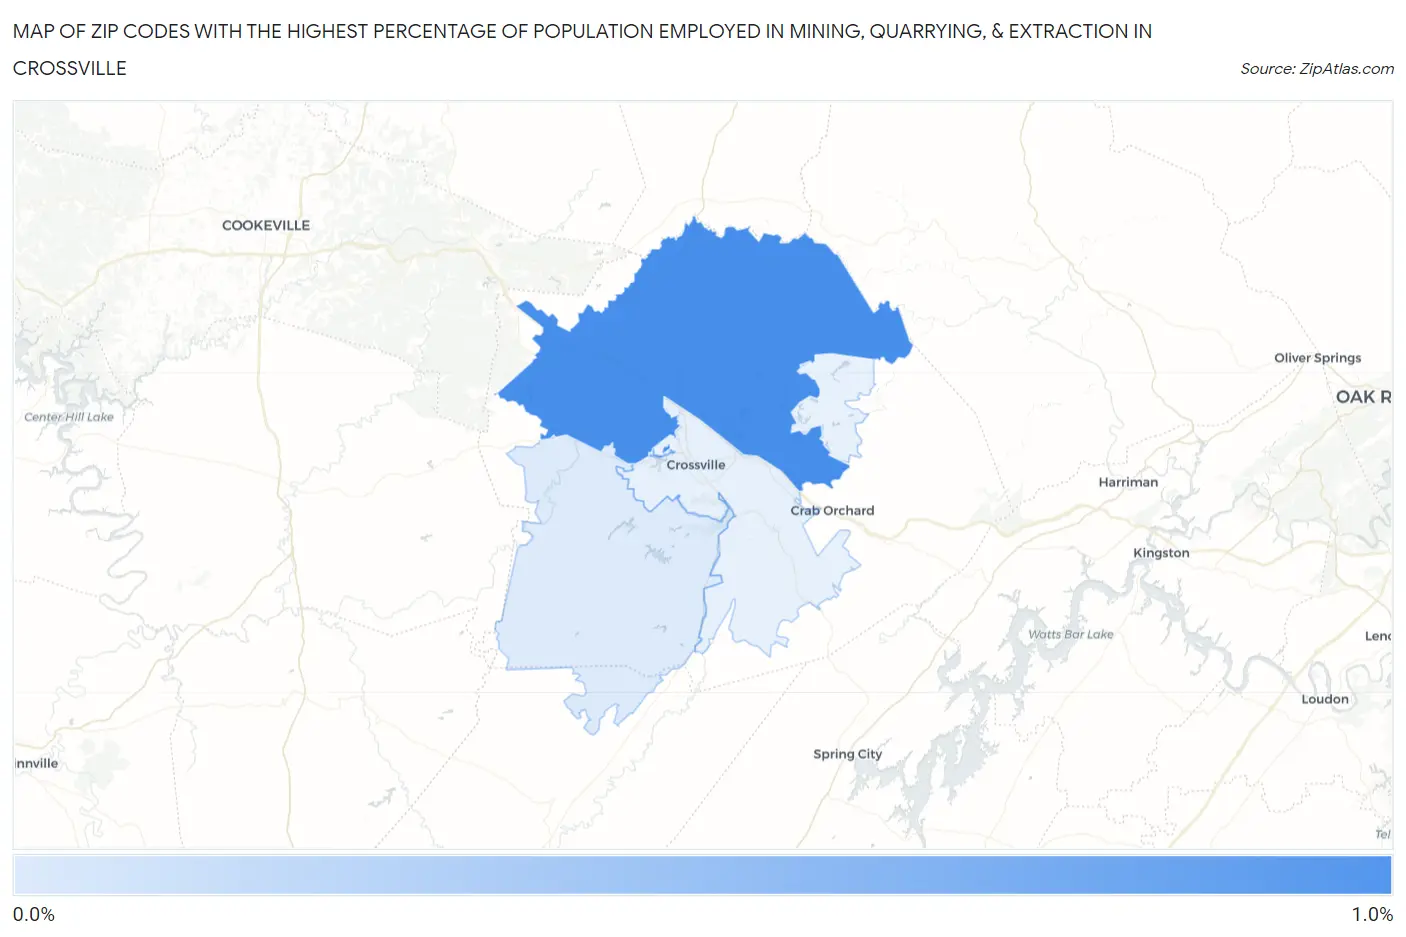
Map of Zip Codes with the Highest Percentage of Population Employed in Mining, Quarrying, & Extraction in Crossville
0.0%
1.0%
Zip Codes with the Highest Percentage of Population Employed in Mining, Quarrying, & Extraction in Crossville, TN
| Zip Code | % Employed | vs State | vs National | |
| 1. | 38571 | 0.87% | 0.14%(+0.731)#53 | 0.44%(+0.432)#5,731 |
| 2. | 38572 | 0.14% | 0.14%(-0.006)#142 | 0.44%(-0.304)#10,288 |
1
Common Questions
What are the Top 3 Zip Codes with the Highest Percentage of Population Employed in Mining, Quarrying, & Extraction in Crossville, TN?
Top 3 Zip Codes with the Highest Percentage of Population Employed in Mining, Quarrying, & Extraction in Crossville, TN are:
What zip code has the Highest Percentage of Population Employed in Mining, Quarrying, & Extraction in Crossville, TN?
38571 has the Highest Percentage of Population Employed in Mining, Quarrying, & Extraction in Crossville, TN with 0.87%.
What is the Percentage of Population Employed in Mining, Quarrying, & Extraction in Tennessee?
Percentage of Population Employed in Mining, Quarrying, & Extraction in Tennessee is 0.14%.
What is the Percentage of Population Employed in Mining, Quarrying, & Extraction in the United States?
Percentage of Population Employed in Mining, Quarrying, & Extraction in the United States is 0.44%.