Zip Codes with the Highest Percentage of Population Employed in Education, Arts & Media in Crossville, TN
RELATED REPORTS & OPTIONS
Education, Arts & Media
Crossville
Compare Zip Codes
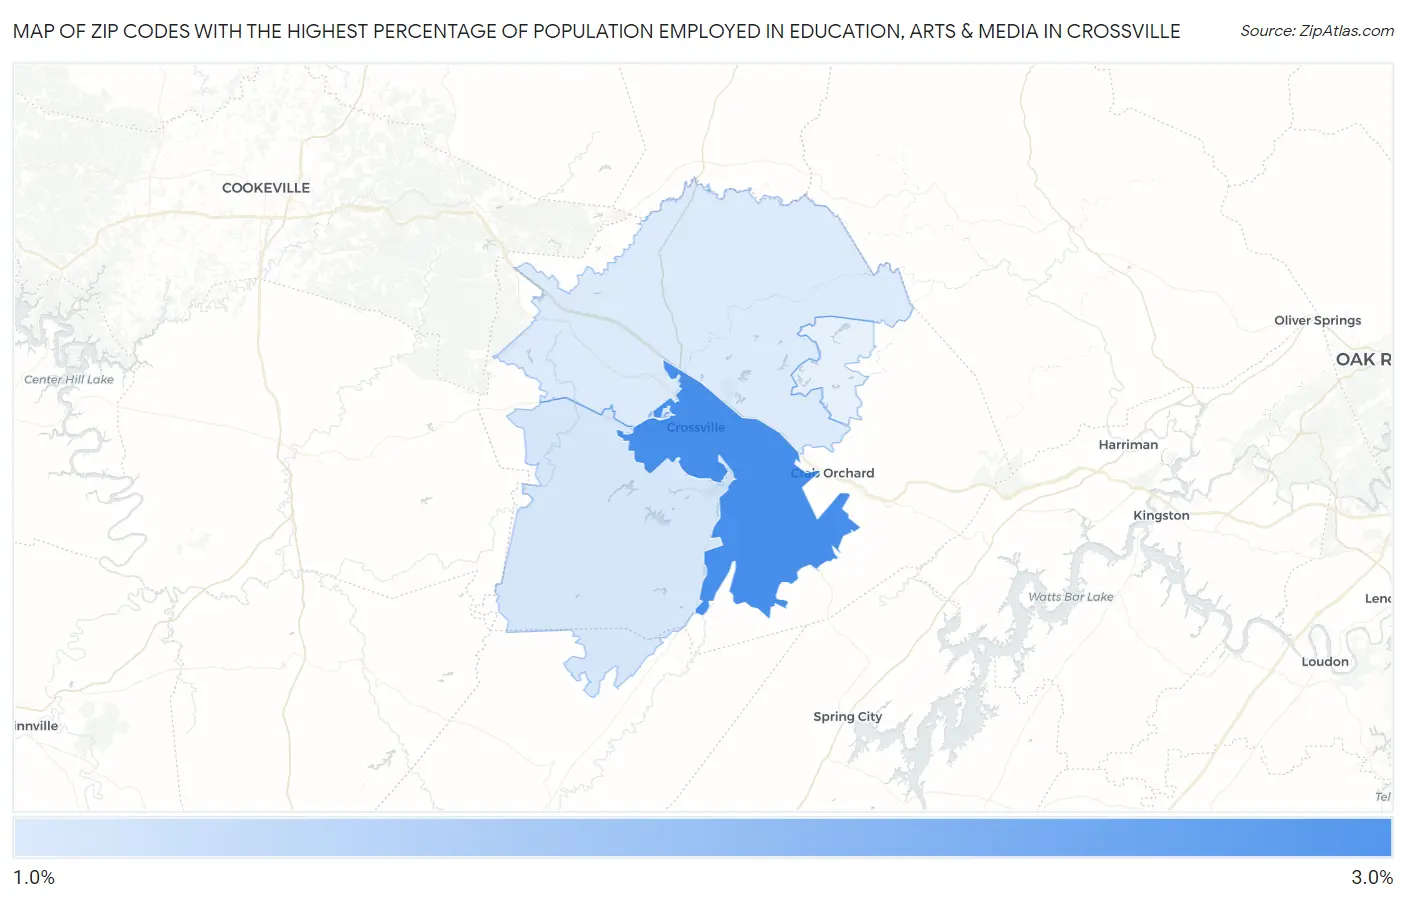
Map of Zip Codes with the Highest Percentage of Population Employed in Education, Arts & Media in Crossville
0.0%
3.0%
Zip Codes with the Highest Percentage of Population Employed in Education, Arts & Media in Crossville, TN
| Zip Code | % Employed | vs State | vs National | |
| 1. | 38555 | 2.8% | 1.7%(+1.12)#75 | 1.8%(+1.05)#5,049 |
| 2. | 38572 | 2.0% | 1.7%(+0.238)#163 | 1.8%(+0.168)#9,910 |
| 3. | 38571 | 1.9% | 1.7%(+0.193)#173 | 1.8%(+0.124)#10,267 |
1
Common Questions
What are the Top 3 Zip Codes with the Highest Percentage of Population Employed in Education, Arts & Media in Crossville, TN?
Top 3 Zip Codes with the Highest Percentage of Population Employed in Education, Arts & Media in Crossville, TN are:
What zip code has the Highest Percentage of Population Employed in Education, Arts & Media in Crossville, TN?
38555 has the Highest Percentage of Population Employed in Education, Arts & Media in Crossville, TN with 2.8%.
What is the Percentage of Population Employed in Education, Arts & Media in Crossville, TN?
Percentage of Population Employed in Education, Arts & Media in Crossville is 4.0%.
What is the Percentage of Population Employed in Education, Arts & Media in Tennessee?
Percentage of Population Employed in Education, Arts & Media in Tennessee is 1.7%.
What is the Percentage of Population Employed in Education, Arts & Media in the United States?
Percentage of Population Employed in Education, Arts & Media in the United States is 1.8%.