Zip Codes with the Highest Percentage of Immigrants from Philippines in Crossville, TN
RELATED REPORTS & OPTIONS
Philippines
Crossville
Compare Zip Codes
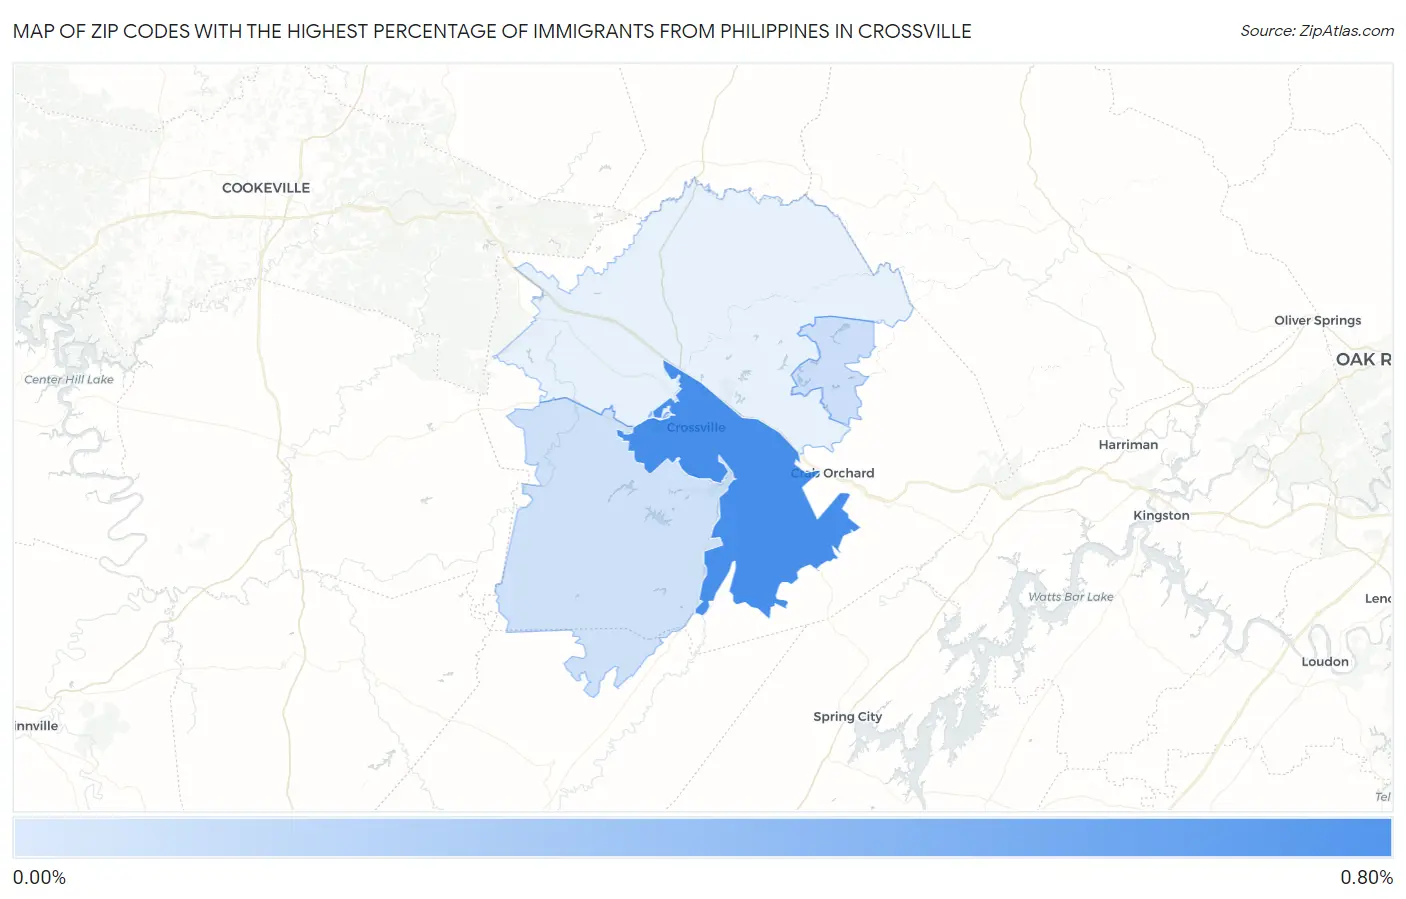
Map of Zip Codes with the Highest Percentage of Immigrants from Philippines in Crossville
0.00%
0.80%
Zip Codes with the Highest Percentage of Immigrants from Philippines in Crossville, TN
| Zip Code | Philippines | vs State | vs National | |
| 1. | 38555 | 0.76% | 0.17%(+0.590)#-1 | 0.60%(+0.159)#0 |
| 2. | 38558 | 0.095% | 0.17%(-0.073)#0 | 0.60%(-0.505)#1 |
| 3. | 38572 | 0.069% | 0.17%(-0.099)#1 | 0.60%(-0.530)#2 |
1
Common Questions
What are the Top 3 Zip Codes with the Highest Percentage of Immigrants from Philippines in Crossville, TN?
Top 3 Zip Codes with the Highest Percentage of Immigrants from Philippines in Crossville, TN are:
What zip code has the Highest Percentage of Immigrants from Philippines in Crossville, TN?
38555 has the Highest Percentage of Immigrants from Philippines in Crossville, TN with 0.76%.
What is the Percentage of Immigrants from Philippines in Crossville, TN?
Percentage of Immigrants from Philippines in Crossville is 0.091%.
What is the Percentage of Immigrants from Philippines in Tennessee?
Percentage of Immigrants from Philippines in Tennessee is 0.17%.
What is the Percentage of Immigrants from Philippines in the United States?
Percentage of Immigrants from Philippines in the United States is 0.60%.