Zip Codes with the Highest Percentage of Population Employed in Security & Protection in Crossville, TN
RELATED REPORTS & OPTIONS
Security & Protection
Crossville
Compare Zip Codes
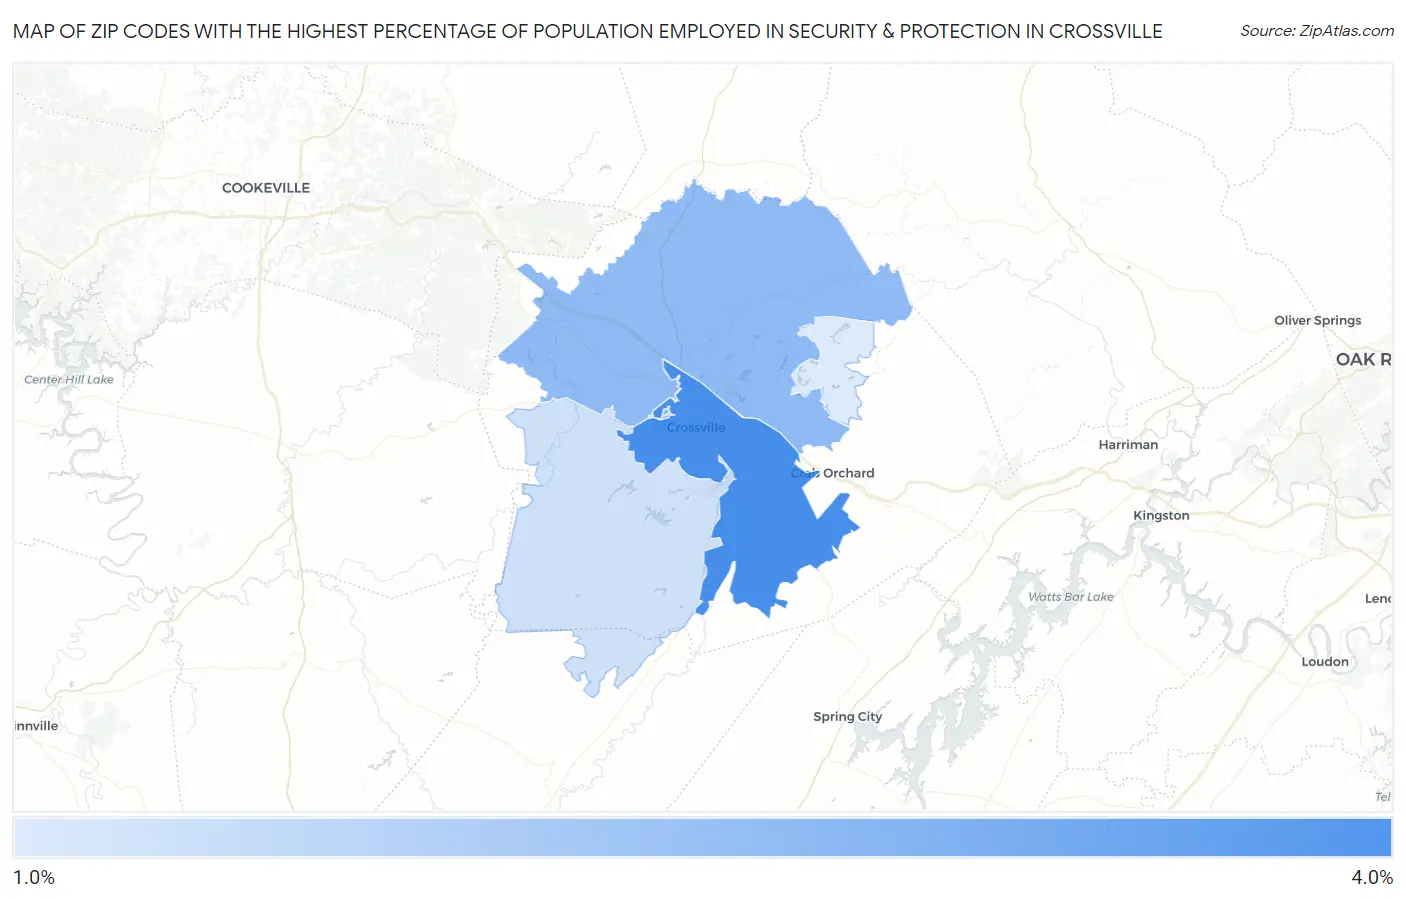
Map of Zip Codes with the Highest Percentage of Population Employed in Security & Protection in Crossville
0.0%
4.0%
Zip Codes with the Highest Percentage of Population Employed in Security & Protection in Crossville, TN
| Zip Code | % Employed | vs State | vs National | |
| 1. | 38555 | 3.4% | 2.1%(+1.27)#117 | 2.1%(+1.21)#6,052 |
| 2. | 38571 | 2.6% | 2.1%(+0.540)#174 | 2.1%(+0.486)#8,848 |
| 3. | 38572 | 2.0% | 2.1%(-0.117)#258 | 2.1%(-0.171)#12,710 |
| 4. | 38558 | 1.8% | 2.1%(-0.247)#277 | 2.1%(-0.301)#13,579 |
1
Common Questions
What are the Top 3 Zip Codes with the Highest Percentage of Population Employed in Security & Protection in Crossville, TN?
Top 3 Zip Codes with the Highest Percentage of Population Employed in Security & Protection in Crossville, TN are:
What zip code has the Highest Percentage of Population Employed in Security & Protection in Crossville, TN?
38555 has the Highest Percentage of Population Employed in Security & Protection in Crossville, TN with 3.4%.
What is the Percentage of Population Employed in Security & Protection in Crossville, TN?
Percentage of Population Employed in Security & Protection in Crossville is 2.9%.
What is the Percentage of Population Employed in Security & Protection in Tennessee?
Percentage of Population Employed in Security & Protection in Tennessee is 2.1%.
What is the Percentage of Population Employed in Security & Protection in the United States?
Percentage of Population Employed in Security & Protection in the United States is 2.1%.