Zip Codes with the Highest Percentage of Renter-Occupied Units in Crossville, TN
RELATED REPORTS & OPTIONS
Highest Renter-Occupied
Crossville
Compare Zip Codes
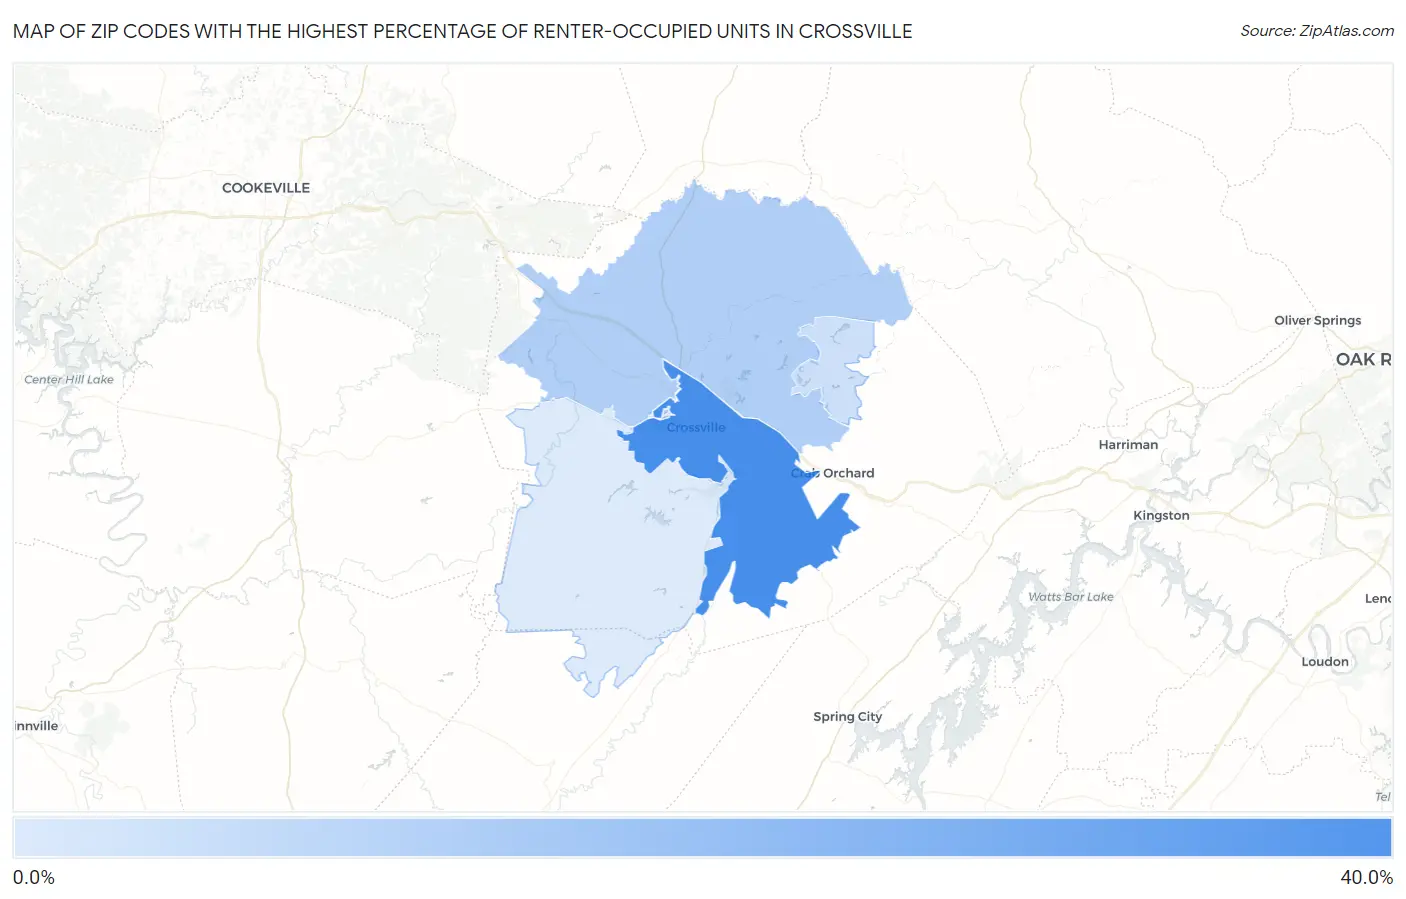
Map of Zip Codes with the Highest Percentage of Renter-Occupied Units in Crossville
0.0%
40.0%
Zip Codes with the Highest Percentage of Renter-Occupied Units in Crossville, TN
| Zip Code | % Renter-Occupied | vs State | vs National | |
| 1. | 38555 | 36.8% | 32.9%(+3.86)#108 | 35.2%(+1.62)#6,572 |
| 2. | 38571 | 16.4% | 32.9%(-16.5)#443 | 35.2%(-18.7)#21,712 |
| 3. | 38558 | 11.4% | 32.9%(-21.6)#524 | 35.2%(-23.8)#26,304 |
| 4. | 38572 | 8.8% | 32.9%(-24.2)#554 | 35.2%(-26.4)#28,143 |
1
Common Questions
What are the Top 3 Zip Codes with the Highest Percentage of Renter-Occupied Units in Crossville, TN?
Top 3 Zip Codes with the Highest Percentage of Renter-Occupied Units in Crossville, TN are:
What zip code has the Highest Percentage of Renter-Occupied Units in Crossville, TN?
38555 has the Highest Percentage of Renter-Occupied Units in Crossville, TN with 36.8%.
What is the Percentage of Renter-Occupied Units in Crossville, TN?
Percentage of Renter-Occupied Units in Crossville is 49.5%.
What is the Percentage of Renter-Occupied Units in Tennessee?
Percentage of Renter-Occupied Units in Tennessee is 32.9%.
What is the Percentage of Renter-Occupied Units in the United States?
Percentage of Renter-Occupied Units in the United States is 35.2%.