Zip Codes with the Highest Percentage of Immigrants from Eastern Asia in Crossville, TN
RELATED REPORTS & OPTIONS
Eastern Asia
Crossville
Compare Zip Codes
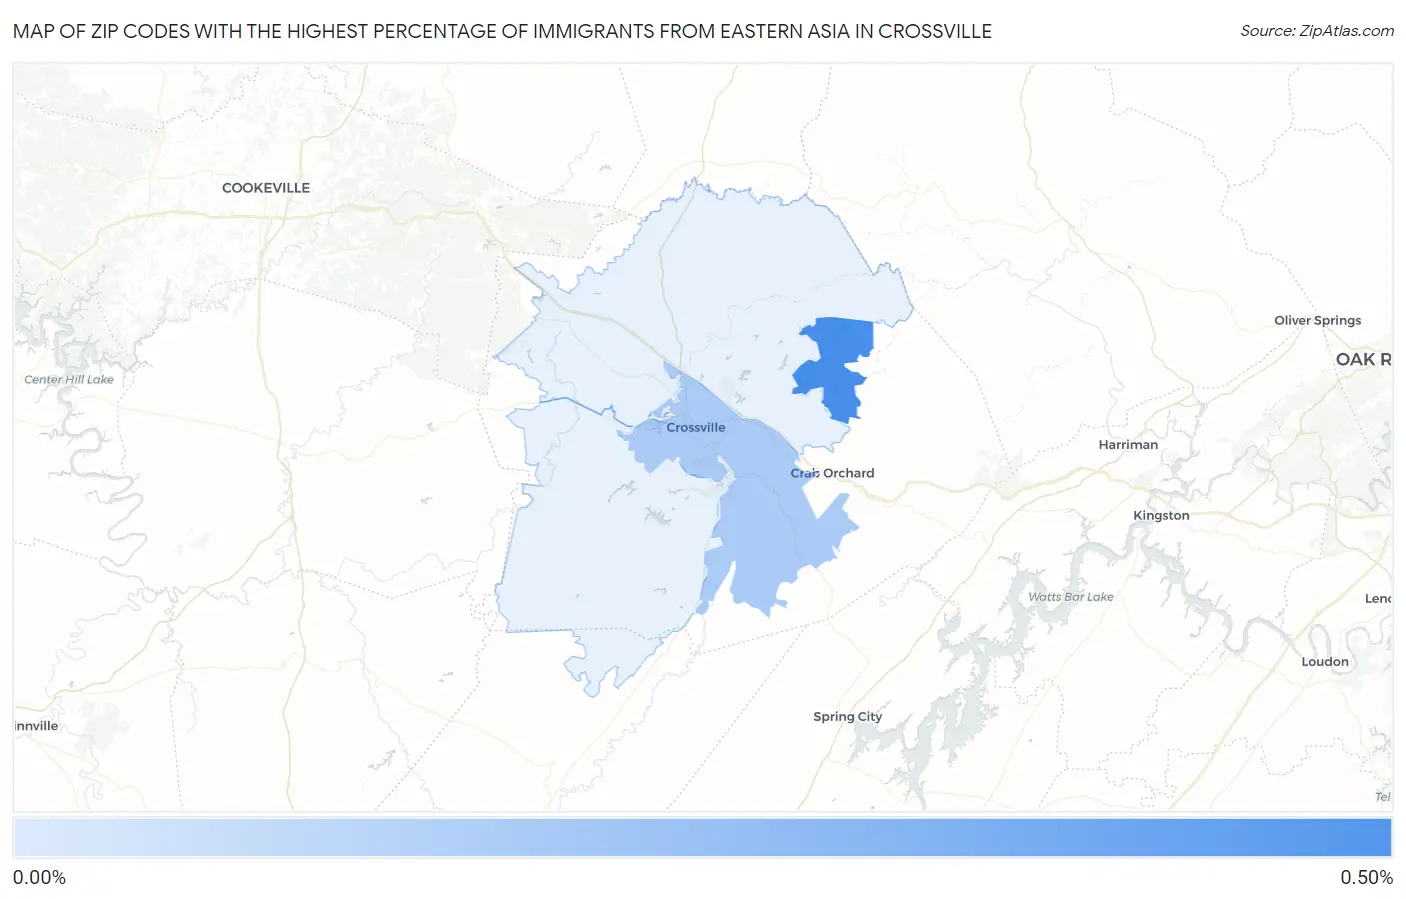
Map of Zip Codes with the Highest Percentage of Immigrants from Eastern Asia in Crossville
0.00%
0.50%
Zip Codes with the Highest Percentage of Immigrants from Eastern Asia in Crossville, TN
| Zip Code | Eastern Asia | vs State | vs National | |
| 1. | 38558 | 0.45% | 0.39%(+0.069)#100 | 1.28%(-0.822)#7,027 |
| 2. | 38555 | 0.15% | 0.39%(-0.232)#191 | 1.28%(-1.12)#11,158 |
1
Common Questions
What are the Top 3 Zip Codes with the Highest Percentage of Immigrants from Eastern Asia in Crossville, TN?
Top 3 Zip Codes with the Highest Percentage of Immigrants from Eastern Asia in Crossville, TN are:
What zip code has the Highest Percentage of Immigrants from Eastern Asia in Crossville, TN?
38558 has the Highest Percentage of Immigrants from Eastern Asia in Crossville, TN with 0.45%.
What is the Percentage of Immigrants from Eastern Asia in Crossville, TN?
Percentage of Immigrants from Eastern Asia in Crossville is 0.27%.
What is the Percentage of Immigrants from Eastern Asia in Tennessee?
Percentage of Immigrants from Eastern Asia in Tennessee is 0.39%.
What is the Percentage of Immigrants from Eastern Asia in the United States?
Percentage of Immigrants from Eastern Asia in the United States is 1.28%.